How Pristine Are China's Parks?
- 1International Chair in Ecotourism Research, Griffith University, Gold Coast, QLD, Australia
- 2Key Laboratory of Regional Sustainable Development Modelling, Chinese Academy of Sciences, Beijing, China
- 3Institute of Geographic Sciences and Natural Resources Research, Chinese Academy of Sciences, Beijing, China
We map and analyse the Human Footprint Index at 1 km scale for 1834 terrestrial Nature Reserves of mainland China. There are fewer, larger, more pristine reserves in the colder, drier, less densely-populated pastoral areas of the north and west; and more numerous, smaller, more heavily modified reserves in the warmer, wetter, more densely populated arable agricultural areas of the south and east. This affects the degree of protection afforded to plant and animal species endemic to different ecosystems. Reserves designated at higher levels of governance are more pristine than lower levels, but with considerable overlap. This is significant as China considers possible reclassification of some reserves as national parks (IUCN category II protected areas). More pristine reserves are more likely to meet conservation criteria.
Introduction
The contributions of protected areas to conservation depend on their biological diversity, environmental management, and environmental quality; and their effectiveness differs greatly both between and within nations, because of history, culture, politics, terrain, and biota (Barnosky et al., 2012; Säterberg et al., 2013; Le Saout et al., 2014; Pimm et al., 2014; Hoffmann et al., 2015; Oldekop et al., 2015). Biodiversity criteria for effectiveness include species-scale parameters such as richness and endemicity, and ecosystem-scale policy criteria such as comprehensiveness, adequacy and representativeness (Kukkala and Moilanen, 2013; Säterberg et al., 2013; Le Saout et al., 2014; Pimm et al., 2014; Hoffmann et al., 2015; Oldekop et al., 2015). Management criteria include control measures for pollution, poaching, pathogens, fire, logging, livestock, invasive species, and industrial development and infrastructure (Säterberg et al., 2013; Le Saout et al., 2014; Pimm et al., 2014; Hoffmann et al., 2015; Oldekop et al., 2015; Ren et al., 2015; Xie et al., 2015).
Environmental quality criteria assess pristineness, i.e., least anthropogenic modification. Anthropogenic modifications include, e.g., past use for agriculture, forestry, fisheries or mining; infrastructure and development; air and water pollution; establishment and spread of feral or invasive species; changed fire regimes, etc. That is, environmental management criteria assess measures taken to control threats, whereas environmental quality criteria, encompassed in measures of pristineness, assess outcomes. Our focus here is on environmental quality and pristineness rather than biological diversity or environmental management, since as outlined below, pristineness has been studied least.
A completely pristine protected area is one without any human modification. Such modifications may include, e.g., roads, buildings and other human structures; industrial development such as mines or dams; primary productions such as agriculture or forestry; tourism infrastructure at all scales, from trails to cableways; invasive species including weeds, pathogens and feral animals; air or water pollution entering the protected area from outside its boundaries; and in recent years, impacts from anthropogenic climate change. Given the scale and scope of human environmental impacts worldwide, very few protected areas are entirely pristine. Since human impacts generally reduce conservation values, measures of pristineness provide valuable criteria for the selection and evaluation of protected areas. That is, If we compare two protected areas with the same area, terrain and connectedness, in the same ecosystem, then the more pristine of the two will generally have lost less of its native biodiversity, is likely to have lower rates of biodiversity loss in future, and will generally have lower future costs to manage further threats to biodiversity (Kukkala and Moilanen, 2013; Le Saout et al., 2014; Palomo et al., 2014; Pimm et al., 2014; Buckley and de Vasconcellos Pegas, 2015). Therefore, pristineness is an important conservation criterion.
China is a megadiverse and populous nation whose protected area system contributes substantially to global conservation, but is under strong anthropogenic pressure (Ren et al., 2015; Xie et al., 2015). Patterns in biodiversity and management have been analyzed extensively (Wu et al., 2011; Ding et al., 2012; Wang et al., 2012; Xu et al., 2014; Cao et al., 2015; Guo et al., 2015; Li et al., 2015; Liu et al., 2015; Luo et al., 2015; Ren et al., 2015; Xie et al., 2015; Zhong et al., 2015; Zhao et al., 2016; Zhang M.-G. et al., in press; Zhang L. et al., in press). Pristineness and anthropogenic modification, however, have not been examined previously. That is, of the three primary criteria for conservation contributions as outlined earlier, data have been available only for two. Information on pristineness is therefore of particular value in analyzing and comparing the conservation value of protected areas in China, as indeed elsewhere. Here, therefore, we calculate, map, and analyse patterns in a numerical index of pristineness, for protected areas throughout mainland China.
Methods
We use the Human Footprint Index (Wildlife Conservation Society and Center for International Earth Science Information Network, 2005), to calculate, map and analyse average pristineness for individual protected areas. Our principal parameter for each park is thus the Protected Area Mean Human Footprint Index, PAMHFI. We calculate and map PAMHFI for all 1834 terrestrial Nature Reserves that are >100 ha in area, throughout mainland China. As in many countries, China uses a range of different designations for different types of public land used for conservation, depending on the public agency responsible, but Nature Reserves are commonly those of highest conservation value (Wu et al., 2011; Wang et al., 2012; Cao et al., 2015; Ren et al., 2015; Xie et al., 2015; Zhong et al., 2015; Zhao et al., 2016; Zhang L. et al., in press; Zhang M.-G. et al., in press). We considered only those larger than 100ha in area, since that is the scale at which data on pristineness are available.
HFI is available at 1km (100 ha) quadrat scale worldwide (Wildlife Conservation Society and Center for International Earth Science Information Network, 2005). Using ArcGIS®, we calculated PAMHFI, i.e., the mean HFI for individual protected areas (PA's), for all 1834 terrestrial Nature Reserves >100 ha (Ministry of Environmental Protection and General Administration of Quality Supervision Inspection and Quarantine, 1993), and tested patterns in relation to location (Figure 1), area (Figure 2), governance (Figure 3) and category (Ministry of Environmental Protection and General Administration of Quality Supervision Inspection and Quarantine, 1993; Ren et al., 2015; Figure 4). Parameters and calculations used in deriving HFI are detailed by Wildlife Conservation Society and Center for International Earth Science Information Network (2005). Parameters include: population density, built-up areas, night-time artificial illumination, land use, land cover, roads, railroads, navigable rivers, and coastal access (Wildlife Conservation Society and Center for International Earth Science Information Network, 2005). HFI is calculated within the range 0–100, with 0 representing complete pristineness, and 100 representing maximum anthropogenic modification. For comparison, major metropolitan areas worldwide have HFI in the bracket 81–100. In the UK, only a few very small areas have HFI <20. In northern Canada and Alaska, HFI <10 for almost the entire area, and HFI <2 for substantial areas (Wildlife Conservation Society and Center for International Earth Science Information Network, 2005).

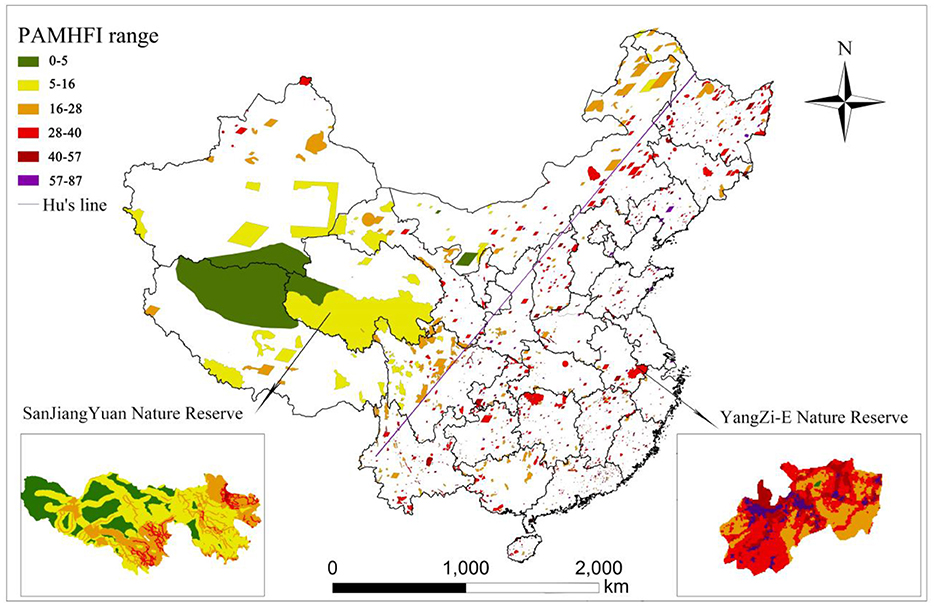
Figure 1. Spatial distribution of PAs coded by Protected Area Mean Human Footprint Index, PAMHFI. Colors represent 1σ PAMHFI bands (Table S1, Figure S2).

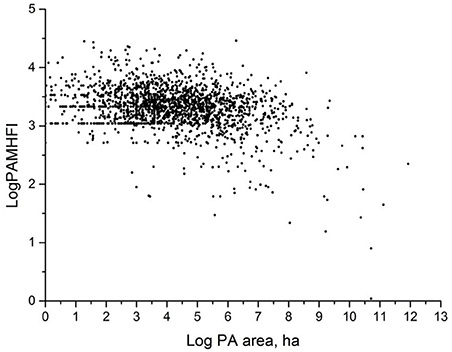
Figure 2. Log-log regression of PAMHFI against PA area. log PAMHFI = 1.573–0.074 log area, β <0 (p < 0.001), R2 = 0.12.

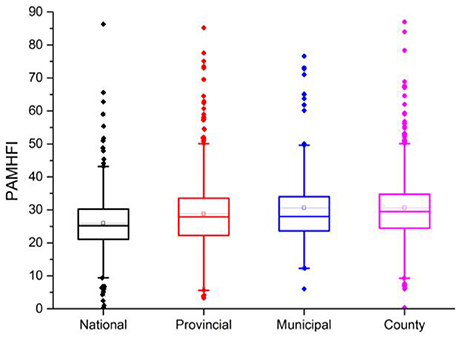
Figure 3. Box plot of PAMHFI distribution for PAs managed at different governance levels, across all PA categories.
Results
HFI varies substantially within and between individual PAs in China (Figure 1). PAMHFI ranges from extremely low levels (0–5) in some sections of large remote arid and mountainous reserves, to very high levels in some small peri-urban reserves. The former are entirely unmodified save for sparse roads and tracks, and very sparse settlements or nomadic livestock herders. The latter are heavily modified through infrastructure for intensive visitation in small areas.
There are 4 governance levels for protected areas in China: national (304 NRs), provincial (583), municipal (192) and county (755). There are 8 categories of NR (Figure S1): forest (57%), wildlife (20%), wetland (12%), grassland, plants, wilderness, geology, and palaeontology (<5% each). Figure 1 also shows Hu's Line (Hu, 1935), which differentiates broadly between sparsely-populated pastoral landscapes in the colder and drier northwest and north, and densely-populated arable landscapes in the warmer and wetter south and east. Whilst the total area within PAs is similar, with 56% in the NW and 44% in the SE, the human population density is >15x higher in the SE, which contains 94% of China's population. NRs in the NW are substantially larger, fewer and more pristine than those in the SE (Figure 1, Figure S3). Across all NRs, however, pristineness is only weakly related to reserve area (Figure 2).
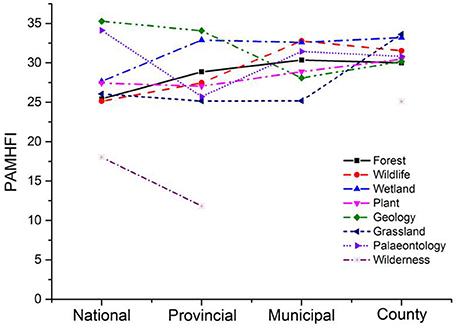
Mean PAMHFI is significantly greater (p < 0.05) for NRs at successively higher governance levels (Figure 3, Table S2), except for municipal cf. county NRs; but these differences are small, with all mean PAMHFI within the range 26.0–30.6 (Table S2). Separation between NR governance levels on the basis of pristineness is weak. Across all governance levels, PAMHFI for wilderness reserves are significantly lower (p < 0.001) than for all other PA categories combined (Figure 4). Forest reserves under national governance are significantly (p < 0.001) more pristine than those at lower governance levels (Figure 4), with a similar but weaker pattern for wildlife reserves (p < 0.05). Grassland reserves at local governance are less pristine (p = 0.015) than at other levels, reflecting weaker control of livestock access.
Discussion
These results show that there are fewer, larger, more pristine reserves in the colder, drier, less densely-populated pastoral areas of the north and west; and more numerous, smaller, more heavily modified reserves in the warmer, wetter, more densely populated arable agricultural areas of the south and east.
This pattern reflects the historical development of China, including its cultural landscapes and food production systems. These factors have greatly affected the availability and size of areas for designation as Nature Reserves. In the south and east, for example, areas with historical religious significance, or steep rocky terrain unsuitable for cultivation, may be the only areas remaining. In the north and west, the cold dry climates and associated pastoral lifestyles and landscapes (Buckley et al., 2008) have retained larger areas in a relatively unmodified state. These patterns affect the degree of protection which can be afforded to plant and animal species endemic to different ecosystems.
These results also show that reserves designated at higher levels of governance are slightly more pristine, on average, than lower levels, national > provincial > municipal > county; but that there is considerable overlap, with no clear thresholds. Many countries have multiple tiers of governance, with corresponding tiers in the designation of protected areas: e.g., federal, state or provincial, and local. Examples include Australia, Brazil, Canada, Germany, India, South Africa, and the USA (Buckley and de Vasconcellos Pegas, 2014, 2015). There are as yet apparently no other national-scale analyses of protected-area pristineness between governance levels, so we cannot yet compare our results from China with patterns in other nations.
Indeed, this is apparently the first analysis of pristineness across the entire PA system for a large biodiverse nation. In conjunction with contemporaneous analyses of biodiversity (Ding et al., 2012; Xu et al., 2014; Li et al., 2015; Luo et al., 2015; Ren et al., 2015; Xie et al., 2015; Zhao et al., 2016) and management (Zhong et al., 2015), these results can contribute to setting priorities for conservation effort and funding. Specifically, as China considers reclassification of some of its Nature Reserves as National Parks, those with greater pristineness, measured here as PAMHFI, will generally merit higher priority, where other considerations such as biological diversity are equal.
There may also be policy implications. Many protected areas in China incorporate core and buffer zones, with human habitation in the buffer. This leads them to be classified as Category IV rather than Category II under the IUCN system. China is now gradually re-naming some of its protected areas as national parks, so as to achieve greater international recognition of its conservation efforts, and perhaps also to improve its international marketing of nature-based tourism (Wang et al., 2012; Cao et al., 2015; Guo et al., 2015; Ren et al., 2015; Zhong et al., 2015; Zhang L. et al., in press). Minimal human modification is one criterion for recognition as an IUCN II reserve, and data presented here may thus be useful in achieving such recognition. Results presented here indicate that reserves designated as wilderness, and reserves designated at national and in some cases provincial level in all categories except geological and paleontological, deserve highest priority.
Author Contributions
RB: designed analyses, wrote article. RZ: collected data, carried out analyses. LZ: designed data collection.
Conflict of Interest Statement
The authors declare that the research was conducted in the absence of any commercial or financial relationships that could be construed as a potential conflict of interest.
Supplementary Material
The Supplementary Material for this article can be found online at: https://www.frontiersin.org/article/10.3389/fevo.2016.00136/full#supplementary-material
References
Barnosky, A. D., Hadly, E. A., Bascompte, J., Berlow, E. L., Brown, J. H., Fortelius, M., et al. (2012). Approaching a state shift in Earth's biosphere. Nature 486, 52–58. doi: 10.1038/nature11018
Buckley, R. C., and de Vasconcellos Pegas, F. (2015). Four hurdles for conservation on private land: the case of the golden lion tamarin in Brazil's Atlantic Forest. Front. Ecol. Evol. 3:88. doi: 10.3389/fevo.2015.00088
Buckley, R., and de Vasconcellos Pegas, F. (2014). Conserving Brazil's Atlantic forests. Science 346:1193. doi: 10.1126/science.346.6214.1193-a
Buckley, R., Ollenburg, C., and Zhong, L. (2008). Cultural landscape in Mongolian tourism. Ann. Tour. Res. 35, 47–61. doi: 10.1016/j.annals.2007.06.007
Cao, M., Peng, L., and Liu, S. (2015). Analysis of the network of protected areas in China based on a geographic perspective: current status, issues and integration. Sustainability 7, 15617–15631. doi: 10.3390/su71115617
Ding, J., Liu, D., Li, C., and Jiang, Z. (2012). Spatial variation in species richness of birds and mammals in mainland China. Shengtai Xue. Acta Ecol. Sinica 32, 343–350. doi: 10.5846/stxb201012201815
Guo, Z., Li, Z., and Cui, G. (2015). Effectiveness of national nature reserve network in representing natural vegetation in mainland China. Biodiv. Conserv. 24, 2735–2750. doi: 10.1007/s10531-015-0959-8
Hoffmann, M., Duckworth, J. W., Holmes, K., Mallon, D. P., Rodrigues, A. S. L., and Stuart, S. N. (2015). The difference conservation makes to extinction risk of the world's ungulates. Cons. Biol. 29, 1303–1313. doi: 10.1111/cobi.12519
Kukkala, A. S., and Moilanen, A. (2013). Core concepts of spatial prioritisation in systematic conservation planning. Biol. Rev. 88, 443–464. doi: 10.1111/brv.12008
Le Saout, S., Hoffmann, M., Shi, Y., Hughes, A., Bernard, C., Brooks, T. M., et al. (2014). Protected areas and effective biodiversity conservation. Science 342, 803–805. doi: 10.1126/science.1239268
Li, X., Clinton, N., Si, Y., Liao, J., Liang, L., and Gong, P. (2015). Projected impacts of climate change on protected birds and nature reserves in China. Sci. Bull. 60, 1644–1653. doi: 10.1007/s11434-015-0892-y
Liu, Q., Chen, J., Corlett, R. T., Fan, X., Yu, D., Yang, H., et al. (2015). Orchid conservation in the biodiversity hotspot of southwestern China. Cons. Biol. 29, 1563–1572. doi: 10.1111/cobi.12584
Luo, Z., Wei, S., Zhang, W., Zhao, M., and Wu, H. (2015). Amphibian biodiversity congruence and conservation priorities in China: Integrating species richness, endemism, and threat patterns. Biol. Cons. 191, 650–658. doi: 10.1016/j.biocon.2015.08.028
Ministry of Environmental Protection General Administration of Quality Supervision Inspection Quarantine (1993). Principles for Categories and Grades of Nature Reserve (GB/T 14529-93). Beijing: People's Republic of China.
Oldekop, J. A., Holmes, G., Harris, W. E., and Evans, K. L. (2015). A global assessment of the social and conservation outcomes of protected areas. Cons. Biol. doi: 10.1111/cobi.12568
Palomo, I., Montes, C., Martín-López, B., González, J. A., García-Llorente, M., Alcorlo, P., et al. (2014). Incorporating the social–ecological approach in protected areas in the Anthropocene. BioScience 64, 181–191. doi: 10.1093/biosci/bit033
Pimm, S. L., Jenkins, C. N., Abell, R., Brooks, T. M., Gittleman, J. L., Joppa, L. N., et al. (2014). The biodiversity of species and their rates of extinction, distribution and protection. Science 334:1246752. doi: 10.1126/science.1246752
Ren, G. P., Young, S. S., Wang, L., Wang, W., Long, Y. C., Wu, R. D., et al. (2015). Effectiveness of China's National Forest Protection Program and nature reserves. Cons. Biol. 29, 1368–1377. doi: 10.1111/cobi.12561
Säterberg, T., Sellman, S., and Ebenman, B. (2013). High frequency of functional extinctions in ecological networks. Nature 499, 468–470. doi: 10.1038/nature12277
Wang, G., Innes, J. L., Wu, S. W., Krzyzanowski, J., Yin, Y., Dai, S., et al. (2012). National park development in China: conservation or commercialization? Ambio 41, 247–261. doi: 10.1007/s13280-011-0194-9
Wildlife Conservation Society Center for International Earth Science Information Network Columbia University (2005). Last of the Wild Project, Version 2, 2005 (LWP-2): Global Human Footprint Dataset (Geographic). Palisades: NASA Socioeconomic Data and Applications Center. Available Online at: http://sedac.ciesin.columbia.edu/data/set/wildareas-v2-human-footprint-geographic
Wu, R., Zhang, S., Yu, D. W., Zhao, P., Li, X., Wang, L., et al. (2011). Effectiveness of China's nature reserves in representing ecological diversity. Front. Ecol. Enviro. 9, 383–389. doi: 10.1890/100093
Xie, G. D., Cao, S. Y., Yang, Q. S., Xia, L., Fan, Z. Y., Gao, Y., et al. (2015). Living Planet Report – China 2015. Beijing: World Wildlife Fund.
Xu, C., Huang, Z. Y., Chi, T., Chen, B. J., Zhang, M., and Liu, M. (2014). Can local landscape attributes explain species richness patterns at macroecological scales? Global Ecol. Biogeog. 23, 436–445. doi: 10.1111/geb.12108
Zhang, L., Luo, Z., Mallon, D., Li, C., and Jiang, Z. (in press). Biodiversity conservation status in China's growing protected areas. Biol. Cons. doi: 10.1016/j.biocon.2016.05.005
Zhang, M.-G., Slik, J. W. F., and Ma, K.-P. (in press). Priority areas for the conservation of perennial plants in China. Biol. Cons. doi: 10.1016/j.biocon.2016.06.007
Zhao, L., Li, J. Y., Liu, H. Y., and Qin, H. N. (2016). Distributions, congruences, and hotspots of higher plants in China. Sci. Rep. 6:19080. doi: 10.1038/srep19080
Keywords: conservation, protected-area, biodiversity, management, governance, IUCN
Citation: Buckley R, Zhou R and Zhong L (2016) How Pristine Are China's Parks?. Front. Ecol. Evol. 4:136. doi: 10.3389/fevo.2016.00136
Received: 24 August 2016; Accepted: 09 November 2016;
Published: 29 November 2016.
Edited by:
Enrico Di Minin, University of Helsinki, FinlandReviewed by:
Sarah-Anne Jeanetta Selier, South African National Biodiversity Institute, South AfricaAlvaro Soutullo, University of the Republic, Uruguay
Copyright © 2016 Buckley, Zhou and Zhong. This is an open-access article distributed under the terms of the Creative Commons Attribution License (CC BY). The use, distribution or reproduction in other forums is permitted, provided the original author(s) or licensor are credited and that the original publication in this journal is cited, in accordance with accepted academic practice. No use, distribution or reproduction is permitted which does not comply with these terms.
*Correspondence: Ralf Buckley, ralf.c.buckley@gmail.com; r.buckley@griffith.edu.au
 Ralf Buckley
 Rui Zhou2,3
  Linsheng Zhong