Systematic Environmental Impact Assessment for Non-natural Reserve Areas: A Case Study of the Chaishitan Water Conservancy Project on Land Use and Plant Diversity in Yunnan, China
 Zhi-Xin Zhu1
  Kun-Kun Zhao1
  Qin-Wen Lin2
  Salman Qureshi3,4,5
  Cynthia Ross Friedman6
  Guo-Yin Cai7,8
  Hua-Feng Wang1*
- 1Hainan Key Laboratory for Sustainable Utilization of Tropical Bioresources, Institute of Tropical Agriculture and Forestry, Hainan University, Haikou, China
- 2Key Laboratory of Plant Resources and Beijing Botanical Garden, Institute of Botany, The Chinese Academy of Sciences, Beijing, China
- 3Department of Geography (Landscape Ecology), Humboldt University of Berlin, Berlin, Germany
- 4Integrative Research Institute on Transformations of Human-Environment Systems, Humboldt University of Berlin, Berlin, Germany
- 5School of Architecture, Birmingham City University, Birmingham, United Kingdom
- 6Department of Biological Sciences, Thompson Rivers University, Kamloops, BC, Canada
- 7Department of Remote Sensing Science and Technology, School of Geomatics and Urban Spatial Informatics, Beijing University of Civil Engineering and Architecture, Beijing, China
- 8Beijing Advanced Innovation Center for Future Urban Design, Beijing University of Civil Engineering and Architecture, Beijing, China
Environmental impact assessment (EIA) before and after the establishment of a Water Conservancy Project (WCP) is of great theoretical and practical importance for assessing the effectiveness of ecological restoration efforts. WCPs rehabilitate flood-damaged areas or other regions hit by disasters by controlling and redistributing surface water and groundwater. Using Geographic Information System (GIS) and Composite Evaluation Index (CEI) in predictive modeling, we studied the degree to which a WCP could change land use, plant communities, and species diversity in Yunnan, China. Via modeling, we quantified likely landscape pattern changes and linked them to naturality (i.e., the percentage of secondary vegetation types), diversity, and stability together with the human interferences (e.g., conservation or restoration project) of an ecosystem. The value of each index was determined by the evaluation system, and the weight percentage was decided through Analytical Hierarchy Process (AHP). We found that minor land-use changes would occur after the Chaishitan WCP was theoretically established. The greatest decline was farmland (0.079%), followed by forest (0.066%), with the least decline in water bodies (0.020%). We found 1,076 vascular plant species (including subspecies, varieties and form) belonging to 165 families and 647 genera in Chaishitan irrigation area before the water conservancy establishment. The naturality and diversity decreased 11.18 and 10.16% respectively. The CEI was 0.92, which indicated that Chaishitan WCP will enhance local landscape heterogeneity, and it will not deteriorate local ecological quality. Our study proposes a comprehensive ecological evaluation system for this WCP and further suggests the importance of including the ecological and environmental consequences of the WCP, along with the well-established socioeconomic evaluation systems for non-natural reserve areas. We conclude that the Chaishitan WCP will have minor environmental impacts on the local landscape and plant diversity. Furthermore, the irrigation project will provide sufficient water once established, which will enrich local plant diversity; therefore, we support its construction.
Introduction
Paradigm shifts in water conservation projects toward harmonizing the needs for humans and nature are essential (Liu et al., 2013). Researchers have been paying increasing attention to the socioeconomic impacts of water conservancy projects (WCPs), but their ecological and environmental consequences have received considerably less attention from the scientific community. WCPs rehabilitate flood-damaged areas or other regions hit by disasters by controlling and redistributing surface water and groundwater. In China, the Before-Project environmental impact assessment (EIA) system for major construction projects has been in place for more than 20 years (Chen et al., 2013). There is a standardized evaluation procedure for assessing the potential ecological effects of construction projects in operation, which involves conducting an on-site investigation and evaluation, making environmental impact predictions, and providing an EIA report. However, there is a general lag between the project's implementation and the assessment of its effects, because some construction projects are in the preliminary design phase, others are under construction, while still others have been completed, but they all need an EIA according to the current environmental management requirements. In other words, real-time ecological environment monitoring and evaluation research is scarce after the project's implementation, preventing assessment of the immediate consequences (Lu et al., 2003; Du and Wang, 2005; Chang et al., 2006; Zhang and Hu, 2010). In particular, quantitative assessments, whereby weights are given to the EIA quality indices according to their properties and importance, are lacking (Wang et al., 2003; Sun and Dong, 2004). Neglecting these ecological and environmental impacts may sometimes lead to unintended consequences (e.g., increasing the incidence of chronic diseases worldwide) for ecosystems as well as to declines in the critical ecosystem services provided to our society (Chen et al., 2013). Therefore, conducting field-based assessment for WCPs' ecological effects will facilitate WCP construction from an ecological perspective, and thus promote their sustainable development (Dong, 2003; Jiang, 2005). Furthermore, such research is of practical significance for EIAs of ecological restoration projects and of similar projects in future.
Previous studies have focused on the environmental and ecological impacts of specific projects; e.g., impacts of the Three Gorges Hydroelectric Project (TGHP) on ecological processes and biodiversity (Wu et al., 2003, 2004; Xie et al., 2003; Lopez-Pujol and Ren, 2009), environmental and ecological effects of the South-to-North Water Transfer Project (SNWTP) (Zhang, 2009). However, there are three shortcomings in the most recent EIA reports. Firstly, very little work has been conducted for non-rare, non-protected species or non-natural reserve areas, whereas biodiversity refers to a collection of all species. The loss of other common or unprotected species will cause declines in overall biodiversity (Chen et al., 2013). Secondly, there is a lack of an integrated vulnerability index based on independent landscape metrics and anthropic impacts. This kind of integrated index would be helpful for the planning of conservation and protection measures in protected areas (Černý et al., 2013; Nzeadibe et al., 2015; Caniani et al., 2016). Thirdly, while companies provide reliable quantitative information about their performance (Hammond and Miles, 2004), the industry has information gaps, as it fails to publicly communicate its level of environmental performance (Panwar et al., 2014; Mäkelä, 2017).
Furthermore, other studies, such as that by Steffen and Leuschner (2014) suggested that decade-long human impact on river hydraulics and chemistry can significantly reduce the community diversity at the landscape level, profoundly altering the relative abundance of the assemblages. Chen et al. (2013) also called for biological diversity impact assessments to be included in any EIA, generating a sound ecological protection and EIA system for established WCPs. Other researchers (e.g., Westman, 1985; Brismar, 2004) also suggested incorporating biological diversity effects into scope of the evaluation, i.e., to investigate the species abundance, distribution, endangered status, and existing problems resulting from the original protection measures. Determining whether it is necessary to protect biological diversity and take corresponding measures depends on local basic biological diversity characteristics and social economic status, which will enable evaluation of WCP scientifically and objectively.
The Chaishitan reservoir, a non-natural reserve area, is located at the interface of Yiliang and Shilin counties in Yunnan province, China (Figure 1). Recently, a water conservancy project has been planned for Chaishitan area to enable irrigation; i.e., Computer Aid Design (CAD) digital maps with the main and branch channels have been generated for implementation in 2016. Assessing land cover and plant diversity before project establishment will be invaluable because it would promote plants to flourish due to an increased water supply; such information would provide a baseline that would otherwise be absent once the water conservancy project became established. Therefore, in this study, we hypothesized that the local plant diversity will increase and that the land use will become more fragmented after the water conservancy project is established.
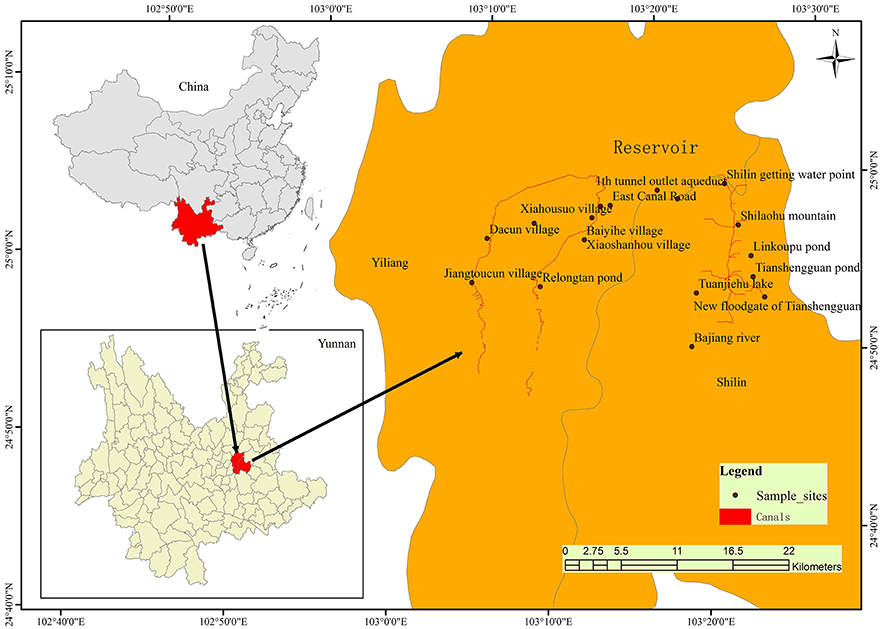
Figure 1. The plant community sampling sites in Chaishitan water conservancy of Yunnan, China.
In this study, we conducted a comprehensive land use analysis and performed plant diversity sampling along the channel and the potential impact areas in Yunnan, China. We then investigated the land use and plant species after modeling the establishment of the Chaishitan WCP through a CAD blueprint of the Chaishitan irrigation region. By comparing the landscape pattern index and plant species composition and relative abundance in the regions, we aimed to address the following questions: (1) How could land-use and plant diversity change immediately after the putative completion of the WCP? (2) Whether or not the Chaishitan WCP should be established in Yunnan as evaluated by our “before-and-after” systematic environment impact assessment; i.e., assessing the plant diversity and land use twice before and then after the project established.
Methods
Study Area
The Chaishitan reservoir is one of the centerpieces of the Nanpanjiang River and is located upstream of the Zhujiang River (i.e., the Pearl River). The actual maximum water level of the Chaishitan reservoir is 1,643.74 m, and its corresponding capacity is of 0.381 billion m3. However, Yiliang city and its surroundings often suffer severe drought. For example, in 2010, the drought areas of Yiliang county totaled 196.2 km2, and 104 km2 of croplands produced nothing due to drought at the end of that year (Anonymous, 2011). In addition, more than 100,000 people had difficulties in accessing safe drinking water because the vast majority of the surface rivers had dried up and the groundwater level had severely decreased in 2010. Therefore, it is urgent to establish an irrigation project (i.e., Chaishitan WCP) from the Chaishitan reservoir to meet the needs of surrounding Yiliang and Shilin counties.
Land Use and Remote Sensing Interpretation
Based on the Current Land Use Classification (GB/T 21010-2007) (CMDLRDC (Cadastral Management Division of Land and Resources Department of China) and LSPI (Lands Surveying and Planning Institute), 2007) issued by China's Land and Resource Ministry, we adopted Current Land Use Classification (Table 1). As the national standard, China's Land Use Status Classification is mandatory, principled and guiding; therefore, we adopted this unified standard in order to improve the level of land management and promote its application in Yiliang county of Yunnan province. Secondly, China's Land Use Status Classification conforms to China's national conditions; namely, it meets the relevant laws and regulations of China's domestic standards, which makes it easier for the construction project to obtain approval. Thirdly, we adopted the nationwide uniform standards, which facilitate the smooth development of the project's construction work; it will be easier to compare our results with similar projects in China and to provide reference for future related projects (Chen et al., 2013).
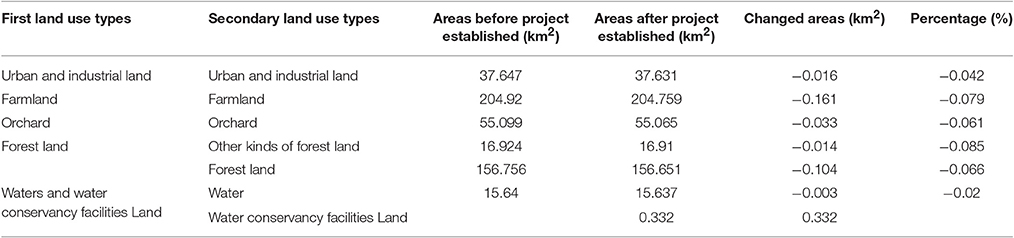
Table 1. The land use area before and after Chaishitan water conservancy project establishment.
The methods of remote sensing image interpretation are widely used and have been applied in previous studies (e.g., Qiu and Wang, 2010; Wang et al., 2013, 2016; Booth et al., 2016). The first-level classification was based on land use and land cover (LULC) characteristics, and the secondary classification is primarily based on the first survey characteristics of land management. One scene of Operational Land Imager (OLI) data from Landsat 8 was obtained in March 9, 2015 as the main source for the second survey of LULC classification. The spatial resolution of panchromatic and multispectral OLI was 15 and 30 m, respectively. Three main steps were taken for the classification. First, we performed a multi-resolution image segmentation to generate image objects to which the classification algorithm could be applied. For this segmentation, we used a “scale parameter” of 20, which was determined by visual interpretation of the segmentation results. The segmentation process identified objects that were homogeneous and included the features (i.e., spectral values, shape, texture, etc.) that can be used for classification (Walker and Blaschke, 2008; Qiu and Wang, 2010). Second, once the segmentation was achieved, we utilized a combination of fuzzy rules and a standard nearest neighbor (SNN) algorithm to classify each image object. A total of 200 training samples were selected and referenced with the auxiliary data (including digital topographic maps). We printed 20 images wherein land use or vegetation types could not be determined from the data alone, brought these images into the field, and either found the specific positions or asked the local people to identify the location. In total, 20 field surveys for the unidentified land use or vegetation types were conducted. Google Earth and local specific maps were also referenced in order to identify their representative classes. Based on the spectral and spatial information of these samples, we created the SNN feature space and fuzzy rule algorithms that were collectively used for classification. Each image object was assigned a probability of belonging to each LULC class, and the final class of image objects was decided on the basis of which assigned class has the highest probability. Finally, we refined the classification with manual adjustment to improve the overall quality of classification. The classification was performed using Definiens 7.0 software. Classification accuracy was assessed by comparing the reference collection with classified imagery (Congalton, 1991). Based on the derived LULC map, we further calculated the percentage for each LULC type in ArcGIS 9.3 (ESRI).
We overlaid the proposed CAD digital maps onto the above remote sensing image from Landsat 8, and then we interpreted the image again and predicted LULC changes immediately after the WCP has been built in 2016. Other ancillary data included 1:50,000 topographic maps, 1:250,000 land-use maps from 2014, district administrative maps and related land resources survey data, inventory reports and related maps.
Plant Diversity Sampling
The field survey on plant species structure and diversity adopted a previously used sampling protocol (Wang et al., 2011) to investigate the community composition and structure of typical vegetation in the region. The proposed layout of the Chaishitan WCP has one main-channel and two branch channels in Yiliang county, and one major main-channel and five branch channels in Shilin county. According to local people who are familiar with the proposed layout of Channels, we found the specific positions of the future channels passing away, and we set 21 plant diversity sampling plots along the channels or near the channels (Figure 1). Once the water conservancy established, most plant species will disappear because of habit loss, therefore, we get the plant diversity before the water conservancy established and predict how could plant diversity change based on the CAD maps and modeling (i.e., we assumed the plant species in or nearby proposed channels will disappear once the water conservancy established in 2016).
We performed plant diversity field investigations twice; the first time was conducted from May to June in 2015 for 27 days with seven people involved in the field work, and the second time was conducted from August to September in 2015 for 42 days with 11 people involved in the field work. We conducted field work according to different land use types: i.e., Secondary needle and broadleaf mixed forest (SF); Wasteland (Wetland) (WL); Eucalyptus plantation (EP); Orchard (OR), and Farmland (FL) (Table 2). The number of sampling sites with each kind of land use type varied from three to eight; eight sampling sites fell into Farmland. In total, 21 sampling sites were investigated (Table 2, Supplementary Material A). The plant diversity was investigated at three different layers; i.e., tree, shrub, and herb layers. At each sampling site, we investigated one 20 × 20 m tree plot: five 2 × 2 m shrub plots and five 1 × 1 m herb plots were surveyed within the tree plot at its four corners and center. In total, we had 21 tree plots, 105 shrub plots, and 105 herb plots. We recorded each species name, diameter at Breast Height (DBH) for trees, height, crown width, coverage for herb, and origin.
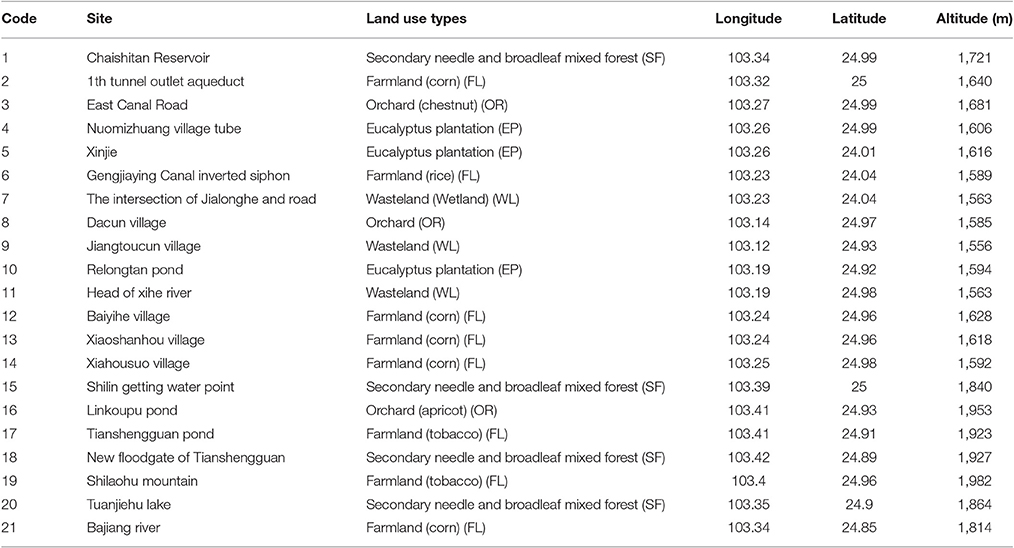
Table 2. Plant community sampling sites in Chaishitan irrigation region, Yunnan province of China.
Data Analysis
Landscape Analysis
Vector graphics were converted into landscape classification grid maps using ArcInfo, and landscape indices were calculated with the Fragstats3.3 (McGarigal et al., 2015) at the landscape level. Patch density (PD), fractal dimension (FD), the clustered index (CONT), dominance index (LDI), degrees of separation index (SPLI), and Shannon diversity indices (SHDI), Number of Patches (NP), Edge Density (ED), Largest Patch Index (LPI), Percentage of Landscape (PLAND), Landscape Shape Index (LSI), Shape Index (Mean) (SHAPE_MN), and Fractal Dimension Index (FRAC_AM) were selected to quantify the modeled and predicted landscape pattern changes (see the concept of each index in Table 3). These landscape pattern indices were then linked to “naturality” (i.e., the percentage of secondary vegetation types), diversity, stability, and human interference in order to establish an evaluation system, which could then be used to estimate the ecological condition of the Chaishitan WCP immediately after its establishment in 2016.
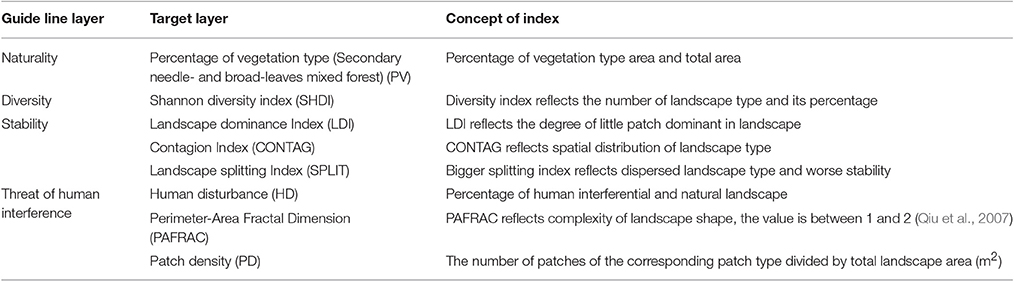
Table 3. Ecological assessment index used in this study.
In light of current ecological assessment systems (O'Neill et al., 1988; Zheng et al., 1994; Xia et al., 2005; Guo et al., 2007), naturality, diversity, stability, and threat of human interference were selected as assessment indicators (Table 3). The weight of each evaluation index was determined by an analytic hierarchy process (Yang and Xiao, 2000; Xu et al., 2002; Guo and Wang, 2005; Wan et al., 2005). Ecological assessment indicators with three levels were selected and evaluated from the perspective of ecological protection (Tables 4A,B).
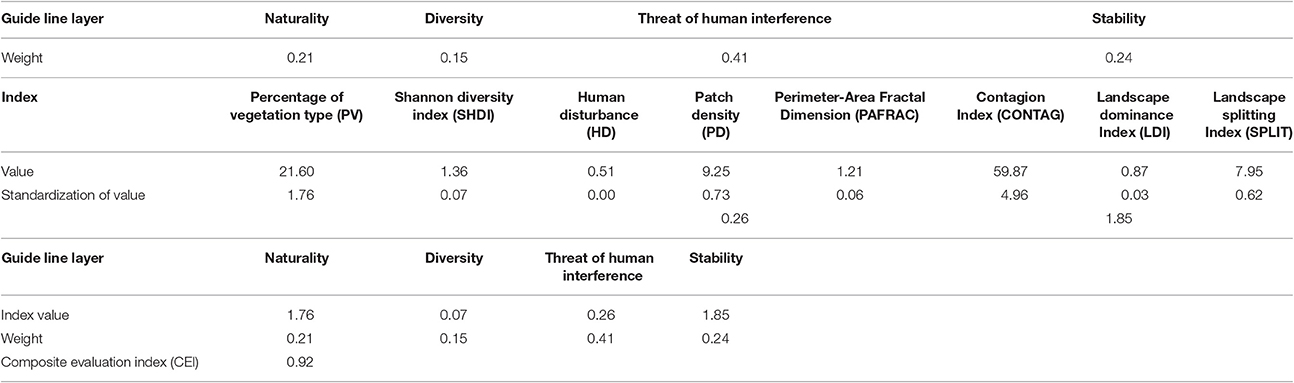
Table 4A. The landscape index and Composite evaluation index before Chaishitan water conservancy project establishment.
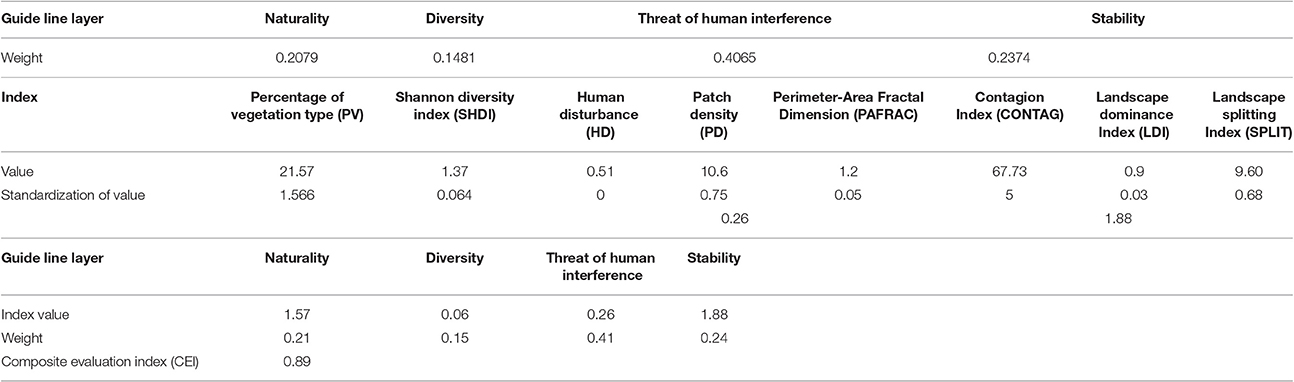
Table 4B. The landscape index and Composite evaluation index after Chaishitan water conservancy project establishment.
A judgment matrix with three level ecological assessment indicators was established in a hierarchical way, which was gauged to reflect the relationship between the affecting factor and its perceived importance. More than 10 experts in the field of landscape or plant diversity assessment were invited to randomly respond to questionnaires “face-to-face” to determine the level of importance: equally important (1), slightly important (3), important (5), obviously important (7), and extremely important (9) (Xu et al., 2002; Wan et al., 2005; Guo et al., 2007). After experts determined the score, we established the judgment matrix and calculated the largest eigenvalue and eigenvector of the matrix as well as the weight of each index value. Regional comprehensive evaluation results are reflected by the following Composite Evaluation Index (CEI) formula (He et al., 2001; Guo and Wang, 2005):
in which, Ci = the score of single evaluation index; wi = the weights of the evaluation indices; n = the number of indices. The ecological environmental quality was assessed by the value of CEI according to Zheng et al. (1994).
We tested the random consistency index (CR) of the judgment matrix; if CR ≤ 0.1, the matrix has a satisfactory consistency, and the weight (w) can be applied (He et al., 2001; Guo and Wang, 2005). The weight of naturality, diversity, stability and threat of human interference is 0.21, 0.15, 0.24, and 0.41 respectively (Table 5). In the target layer (see the definition in Table 3), the weight of each indicator is 0.33.
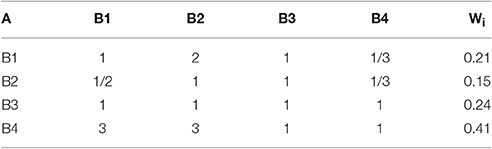
Table 5. Determination of evaluation index weight of Chaishitan water conservancy project.
Plant Diversity Analysis Before Modeling
The arrangement order of the families is determined by Li (1996) and Wu (1991). Simpson, Shannon and Pielou indices were calculated to evaluate the diversity of trees, shrubs, and herb species in each sampling site. The indices were calculated as follows:
(1) The Simpson diversity index (D) (Simpson, 1949);
(2) The Shannon index (e-base) H′e (Shannon, 1948);
(3) The Pielou evenness index (J) (Pielou, 1966):
In the formulae 1 through 3, Pi = ni/N, where ni is the number of an individual species I, N is individual number of all species, while H'maxis the maximum Shannon index. If D = 0, there are no species in the plot.
SPSS (Statistical Product and Service Solutions) was used for statistical analyses to test the significance of differences, i.e., there is a significant difference between two variables if p < 0.05 (and not if p > 0.05).
Results
Land Use and Landscape Pattern Changes before and after WCP Established
Land Use Changes
The total area of the WCP was 486,985 km2, including Urban and industrial land, Farmland, Orchard, Forest land, and Waters/water conservancy facilities (Table 1). The land use did not change significantly once the WCP was established. Minor land use changes were detected before and immediately after the establishment of the Chaishitan WCP. The greatest decline was 0.079% for Farmland (0.161 km2, the amount of the decreased area, similarly hereinafter), then 0.066% for Forestland (0.104 km2). The least decreased is 0.020% (0.003 km2) for water bodies (Table 1, Figure 2). The naturality and diversity decreased 11.18 and 10.16%, respectively. In the guide line layer (see the definitions in Table 3), a layer that includes naturality, diversity, stability, and threat of human interference (see Tables 4A,B). However, the threat of human interference index and ecosystem stability increased by 1.32 and 1.59%, respectively. The CEI decreased by 3.65% (Tables 4A,B).
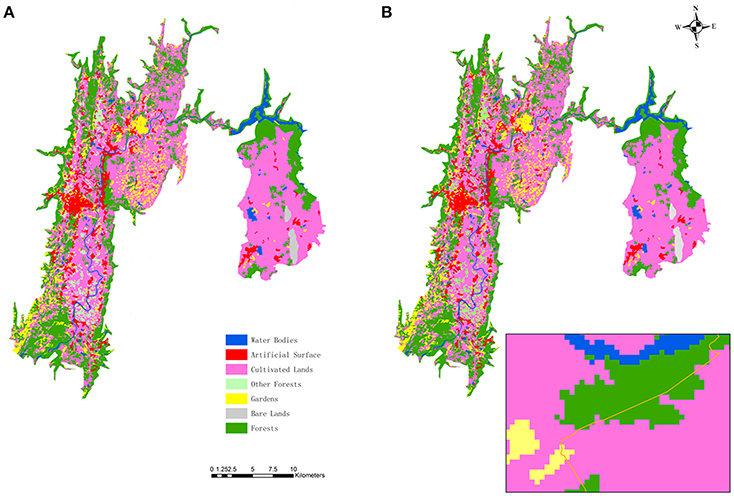
Figure 2. The land-use changes before (A) and after (B) the Chaishitan water conservancy established.
Landscape Pattern Changes
The landscape changes after the WCP established were minor. The value of some landscape pattern indices decreased by about 10% while the value of other indices increased by about 3%. In the index layer (see Tables 4A,B), we found that Percentage of Vegetation type (PV), Shannon Diversity Index (SHDI), Perimeter-Area Fractal Dimension (PAFRAC) and Landscape dominance Index (LDI) decreased by 11.18, 10.16, 11.70, and 5.69%, respectively; however, we found that Patch density (PD), Contagion Index (CONTAG) and Landscape splitting Index (SPLIT) increased by 2.37, 0.75, and 8.66%, respectively (Tables 4A,B).
Class-level analysis indicates the structural characteristics for each land use type and can reveal the land use change features and trends. Eight class metrics; namely, NP, PD, ED, LPI, PLAND, LSI, SHAPE_MN, and FRAC_AM (see the abbreviations in the Methods) were selected to perform the land use type change analysis in this research and the statistical results are shown in Table 6, indicating changes in the landscape structure of each cover type.
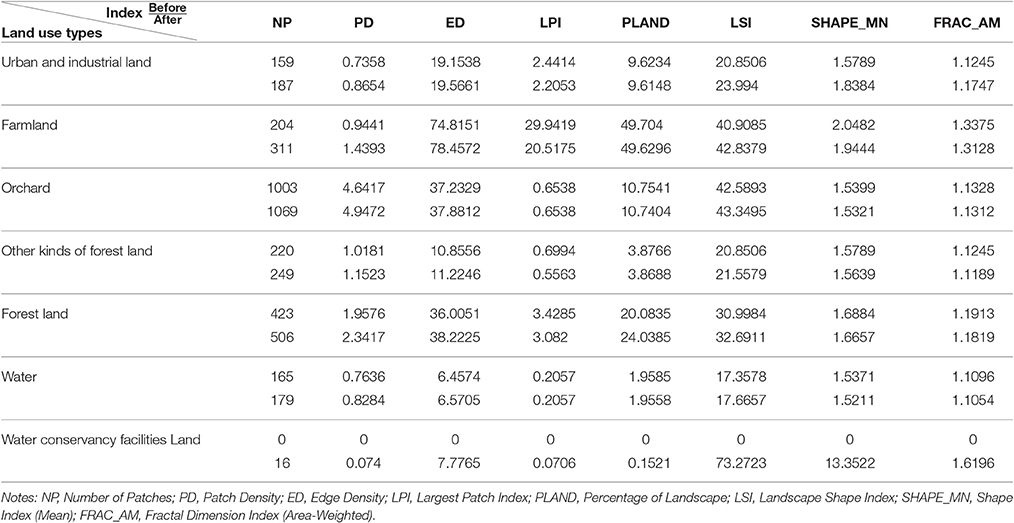
Table 6. Statistics of pattern metrics in class level.
Main Vegetation Types
Five kinds of main vegetation types were found in the field:
Secondary Broadleaf Forest (SF)
Secondary broadleaf forest is the main forest type commonly found in high altitudes; its dominant species includes Pinus yunnanensis Franch., Quercus variabilis Bl. and Cupressus duclouxiana Hickel, Cyclobalanopsis glauca (Thunb.) Oerst., along with Acer buergerianum Miq (Figure 3).
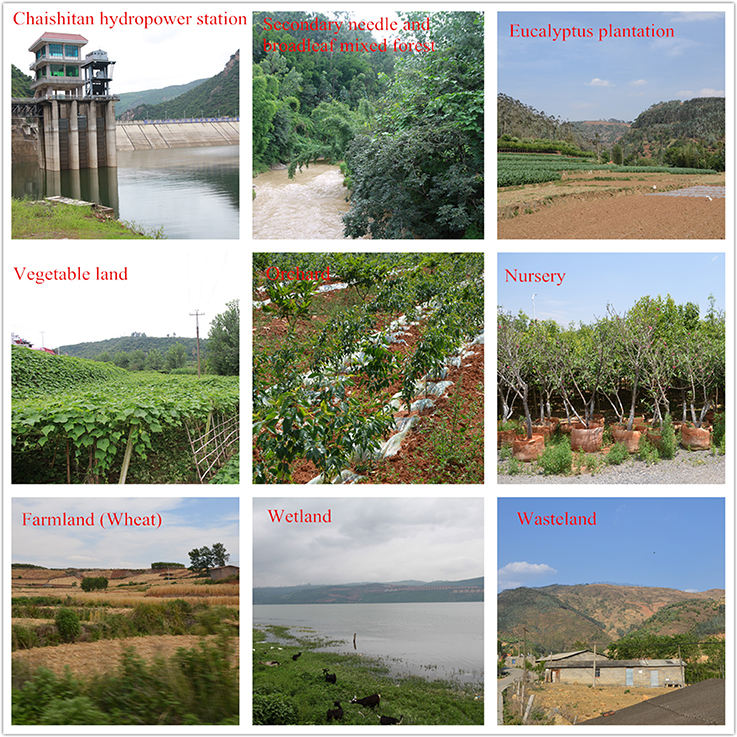
Figure 3. The main land use types in Chaishitan irrigation region.
Eucalyptus Plantations (EP)
Eucalyptus plantations [the main species is Eucalyptus globulus subsp. maidenii (F. Muell.) Kirkpatr.] were widely distributed in the roadside, hillside, dry land and farmland. Most of them are disjunct and distributed in small areas.
Farmland (FL)
Farmland mainly comprised dry areas growing corn, greenhouses containing common crops [such as Panax notoginseng (Burkill) F. H. Chen ex C. H. Chow, Nicotiana tabacum Linn.], and lowlands with good irrigation growing rice.
Orchards (OR)
There are a large number of orchards, including those growing Castanea mollissima Bl., Cerasus pseudocerasus (Lindl.) G. Don (chestnut), and Vaccinium corymbosum L. (blueberry) etc. Most orchards cultivated one or two fruit trees. There were some weeds (such as Eupatorium adenophorum Bidens) living in the understory of orchards.
Wasteland (WL)
Marsh was regarded as the wasteland in this study, which was found near rice fields. Natural marsh vegetation was rarely found in our field work. The main plant species are invasive alien species such as Alternanthera philoxeroides (Mart.) Griseb., and Eupatorium adenophorum Hort. Berol. ex Kunth, mixed with other typical marsh plants such as Equisetum ramosissimum subsp. debile (Roxb. ex Vauch.) Hauke.
Floristic Composition
There was a high vascular plant taxonomic diversity (over 1,000 plant species) found in the investigated fields. A total of 1076 vascular plant species (including subspecies, varieties and form, Supplementary Material B) were identified in the Chaishitan irrigation region, belonging to 165 families and 647 genera (Supplementary Material B). Of these, 23 species (13 families and 16 genera) belong to pteridophytes, accounting for 0.88% of all pteridophyte species in China, whereas 60 species (8 families and 31 genera) are gymnosperms, accounting for 0.8% of gymnosperms species in China. The remaining 993 species (144 families and 600 genera) are angiosperms, accounting for 3.58% of all angiosperms in China. Angiosperm species accounts for 92.29% of all vascular species.
All 1,076 vascular species could be divided into three categories: (1) 295 species (87 families and 226 genera) are wild native species; (2) 748 species (138 families and 462 genera) alien are cultivated species, including vegetables, fruit, aromatic plant, cash crops, and a very large number of garden plant species; (3) 33 species (16 families and 30 genera) are alien invasive species, such as Eupatorium adenophorum Hort. Berol. ex Kunth, Conyza canadensis L. and Ageratum conyzoides Sieber ex Steud.
Poaceae, Fabaceae, and Rosaceae accounted for the most families in Chaishitan irrigation region. Poaceae was represented by the most species (70 species, 48 genera), in which 46 species are wild native species. Fabaceae and Rosaceae were represented by the second (62 species and 36 genera) and the third highest number of species (61 species and 21 genera), respectively. In addition, 49 families were represented by only one species.
Plant Diversity Index
Plant taxonomic diversity indices (i.e., d, He′ and Je) differed in different vegetation types. In tree layer, index d, He′ and Je are the highest in farmland compared to the other four vegetation types (Figure 4A). In shrub layer, d and He′ are the highest in Wasteland (WL); however, Je is the highest in Farmland (FL) (Figure 4B). In the herb layer, d, He′ and Je are the highest in the secondary needle- and broad-leaved mixed forest (SF) (Figure 4C).
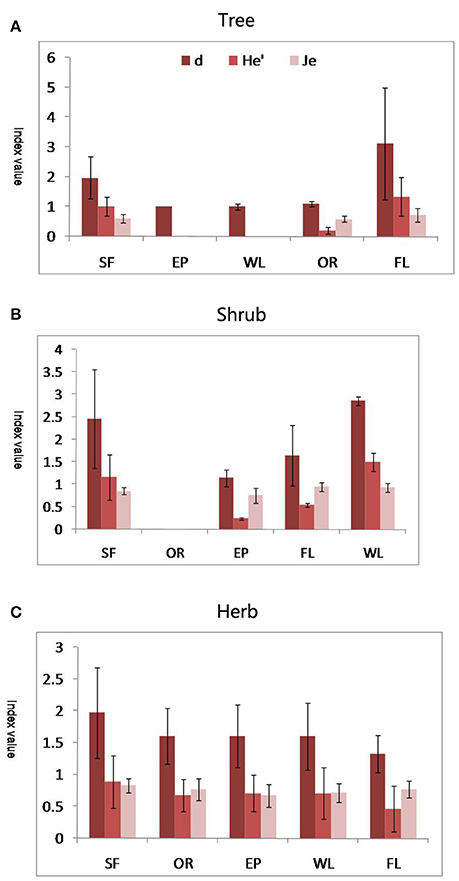
Figure 4. The plant diversity d, He′, and Je in tree (A), shrub (B), and herb (C) layer. SF, Secondary evergreen needle- and broad-leaves mixed forest; FL, Farmland; EP, Eucaluptus plantation; OR, Orchard; WL, Wasteland.
Rare and Protected Plant Species
Some rare or protected plant species were found in the Greenhouses or Nurseries; i.e., cultivars were mainly for ornamental or medicinal use, and were not wild species, such as Alsophila spinulosa (Wall. ex Hook.) R. M. Tryon, Ginkgo biloba Linn., Juglans mandshurica Maxim., Pseudolarix amabilis (Nelson) Rehd., Glyptostrobus pensilis (Staunt.) Koch, Metasequoia glyptostroboides Hu et Cheng, Taxus wallichiana var. chinensis (Pilg.) Florin, Liriodendron chinense (Hemsl.) Sargent., Pachylarnax sinica (Law) N. H Xia et C. Y. Wu, Phoebe zhennan S. Lee et F. N. Wei, Fagopyrum dibotrys (D. Don) Hara, Davidia involucrate Baill., Sinojackia xylocarpa Hu, and Kolkwitzia amabilis Graebn. were found in our field investigation. These species are listed as national key protected plants species. However, as these were not wild species, their genetic diversity is lower. Furthermore, as there were a large number of individuals of these species, they have a lower conservation value. There were numerous clones of the protected species in the greenhouses and nurseries.
Discussion
Determining a project's evaluation scope is one of the key issues in the EIA procedures (TGEIAEI (Technical Guidelines for Environmental Impact Assessment Ecological Impact), 2011; Liang, 2015; Tan et al., 2015). According to TGEIAEI (Technical Guidelines for Environmental Impact Assessment Ecological Impact) (2011), EIA should fully embody the ecological integrity, covering the directly and indirectly affected areas of all activities of the assessment projects. The scope of evaluation work should be determined by the impact of the evaluation project on ecological factors, the impact degree and the interaction among ecological factors. We should consider the relationships between the evaluation projects and the climatic processes, hydrological processes, and biological processes. We should take the complete climatic units, hydrological units, eco-units and geographic boundaries as reference boundaries. However, there was no specific evaluation scope regulated in TGEIAEI (Technical Guidelines for Environmental Impact Assessment Ecological Impact) (2011) mainly because of the reasons as follows: First, China has a broad geography with diverse ecosystem types, and the projects are complex. Second, different industry guides have clearly defined the scope of the evaluation work; Third, according to the statistics on previous construction projects, most ecological impact assessments have not been carried out in accordance with the evaluation scope recommended by the original guidelines (Liang, 2015; Tan et al., 2015).
In this study, given that the low water temperature and salinity will affect the fish breeding ten kilometers downstream, our evaluation scope included those areas. In the public involvement procedure, we drafted questionnaires and posted them in the places of greatest population concentration to ask local people their opinions and suggestions about biodiversity changes, which helps local biodiversity protection in the future.
“Before-and-after” methods have been applied to previous projects in China. However, some EIA projects did not have systematic (i.e., complete and comprehensive) environment impact assessments for non-natural reserve areas once the project received approval from the government departments, e.g., some assessments only evaluated the status for non-natural reserve areas or neglected plant diversity evaluation in these areas. In this study, we not only evaluated the status before the project was established, but we also systematically evaluated future conditions based on modeling.
The Impact of Chaishitan WCP on Local Landscape
The accuracy of remote sensing depends on the data extraction process (Zhu et al., 2016). In our study, the remote sensing image was from OLI data based on Landsat 8: its resolution is 30 m. Thus, the accuracy defines the meaningfulness of the data. For example, the percentage decline of Farmland and Forestland was 0.079 and 0.066%, respectively. However, if the sensing accuracy is only 70%, these changes are not meaningful at all, because the simple classification error is much greater than the magnitude of changes. Unfortunately, high resolution images are either simply not available or prohibitively expensive, as are images from SPOT (Satellite Pour l'Observation de la Terre) or Quickbird. In this study, based on OLI data from Landsat 8, the CEI before and after Chaishitan WCP was established is 0.92 and 0.89, respectively. Although the CEI decreased by 0.03, both CEI values indicate that the ecological state is healthy, according to the criteria in Zheng et al. (1994). These values indicate that the Chaishitan WCP will make the CEI decrease slightly, but will not decrease the rank of the overall ecological quality of the Chaishitan region.
Environment Impact Assessments are often conducted before a project is established, can lead to a lack of land use/cover assessments after establishment. In this study, we predicted the changes of land use/cover based on the data from planning diagrams, and found that the structure of landscapes could change after the establishment of the Chaishitan WCP. Specifically, PV, SHDI, PAFRAC, and LDI decreased, while PD, CONTAG, and SPLIT increased, indicating increased landscape fragmentation along with decreases in landscape diversity. The Chaishitan WCP establishment could result in land use change and therefore most landscape indices would change; e.g., PV decreases because the channels or canals would occupy the areas normally containing some natural vegetation, resulting in natural vegetation decreases. On the other hand, the Chaishitan WCP establishment would make the landscape more fragmented, and therefore, the SPLIT will increase due to the generation of more patches.
Shape Feature Analysis
We can see from the column of SHAPE_MN (Table 5) that only the land use of urban and industrial land increased, while others decreased, especially for orchards with the least change. This indicates that the shape for urban and industrial land has become more complicated, while other land use types have become more simple or regular after the implementation of the water conservancy facilities. This phenomenon might be caused by the design of this water conservancy facility, which endeavors to have the least disruption to farmland as possible. The situation for SHAPE_MN is almost the same as the index of FRAC_AM, which represents the self-correlation of patches. The value of FRAC_AM is negatively proportional to the impact of human activities. All the FRAC_AM values are very small, which means that all of these land use types are easily affected by human activities.
Landscape Domination Analysis
PLAND and LPI are often used to identify the dominance of the land use type in the whole landscape (O'Neill et al., 1988; Wu, 2000). In this analysis, these two indices indicated that farmland would remain as the dominant land use type after the construction of the water conservancy facilities.
Landscape Fragmentation Analysis
PD and ED are generally combined to analyze the degree of fragmentation for each land use type (O'Neill et al., 1988; Wu, 2000; Wen et al., 2008). By comparing the values of these two indices for all of these land use types, it can be concluded orchard and water bodies have the largest and least degree of fragmentation, respectively. After performing the construction of water conservancy facilities, the degree of fragmentation for all the land used types increased. This means that the water conservation facilities have caused fragmentation of each land use type.
The Impacts of the Chaishitan WCP on Plant Species
In this study, the Chaishitan WCP is predicted to change the area values of different land types (Table 1); however, the land use change should not decrease plant diversity because of the three following reasons: first, the change in farmland area (0.161 km2) and forest land area (0.104 km2) is limited (Table 1). Second, as shown in our field investigation, the Chaishitan project will not occupy natural forest, for all affected forests are secondary forests, plantations or orchards (Tables 4A,B). The plant diversity in the farmland and artificial forestland is not high, as most species are cultivated species or alien species, and the species in the forest are widely distributed in that region. Finally, there is no special species sensitive to local habit (Supplementary Material B). On the contrary, Chaishitan WCP might increase the number of local plant species in the long term because once the project is in operation, the human interventions will be reduced, which may create more beneficial habitat or niche for more species due to sufficient water supply.
From a whole ecosystem perspective, the ability of the ecosystem to resist alien species invasion, plant diseases and pest invasion will increase because of sufficient water supply. In the long term, ecosystem stability will depend on multiple factors (e.g., improved soil texture), and the temporary biodiversity decrease should not be reflected in the CEI decrease in the future, because the ecosystem resilience will improve the plant diversity.
An Impact Assessment is an important tool for conservation and sustainable use of biodiversity (IAIA, 2005). There is a growing interest in promoting biodiversity consideration in impact assessments (e.g., IAIA, 2005; CBD (Convention on Biological Diversity), 2006). In order to support this trend, many guidelines and tools have been developed (e.g., World Bank, 2000; OECD (Organisation for Economic Cooperation Development), 2002). Wegner et al. (2005) points out the diversity in definitions and approaches to its assessment among EIA practitioners. Geneletti et al. (2003) further argued that accounting for uncertainty in biodiversity impact assessment—in data, methodologies, and value judgments provided by the experts—is important. Gontier et al. (2006) also address the gap between research in prediction tools and current practice in biodiversity assessment within environmental assessment. Post-project-analysis (PPA) refers to a method and system of tracing, monitoring and confirmatory assessing the environmental impact of constructed projects and the efficiency of preventive measures, as well as proposing remedial plans or measures, aiming to achieve the coordination between project construction and environment (Division of Bill, Resources and Environmental Commission of National People's Congress (DBRECNP), 2003). At present, the PPA in environmental impact in China is basically at the stage of discussing the concept, indicators, methods, content and procedure of the assessment as well as developing case studies (Li et al., 1997; Shen et al., 2005; Cai et al., 2007), while post-project analysis in construction projects is not yet widely conducted. In this study, our assessment was conducted before the project was established, i.e., Before-Project-Analysis (BPA), which could maximally decrease the environmental risk the project brings. In this study, we used modeling predict the land use and plant diversity change immediately after the project established, while as discussed previously, plant could restore to its mature state in a long term (e.g., 5 years, 10 years), therefore, it seems that another comprehensive field investigation is needed to understand what the irrigation system will change. The rare or endangered plant species were found in the greenhouse or nursery, and no wild individuals were found in the investigated field. Furthermore, the irrigation project will provide sufficient water once it is established, which will enrich local plant diversity.
The loss of biodiversity in non-natural reserves is much higher than the loss rate of nature reserves due to over-exploitation, habitat loss, etc. in China (Xia et al., 2005). In this study, we used the Yiliang WCP as an example and we set up hundreds of plant diversity plots to systematically investigate the plant diversity, abundance, and conservation status. Our real intent is to generate more attention the landscape and plant diversity of non-natural reserve areas in China.
Conclusion
Systematic environment impact assessment for non-natural reserve areas should be conducted with the same weight as assessments for natural reserve areas, because the baseline for such non-natural areas is needed and too easily neglected. Ignoring these baselines could create data gaps, which in turn could impede future project establishment or environment assessment in a long term. In this study, we proposed a comprehensive evaluation system to assess the potential ecological and environmental consequences of WCP. Our ecological evaluation results showed that the Chaishitan water conservancy project may initially fragment landscape patterns and deteriorate the local ecological conditions. Furthermore, the plant diversity will decrease when the WCP has been constructed. However, the maps of channels indicated that the local diversity will likely rebound and increase in the long term, which will provide beneficial habitat for local species. Therefore, it is appropriate to establish a WCP in Chaishitan irrigation region as long as we model and understand the ecological and environmental consequences of the WCP using well-established socioeconomic evaluation systems.
Author Contributions
HW and ZZ conceived this idea, HW, GC, and QL did the field work, remote sensing image interpretation and data analyses, GC and KZ helped creating the figures. HW, CR, and SQ revised the manuscript. All authors contributed to the manuscript.
Funding
This study was funded by National Scientific Foundation of China (31660055 and 31660074), the initial fund from Hainan University (kyqd1633), the fund from China Ministry of Science and Technology (grant number 2012BAJ14B03-6) and Beijing Municipal Education Commission (grant number UDC2016050100).
Conflict of Interest Statement
The authors declare that the research was conducted in the absence of any commercial or financial relationships that could be construed as a potential conflict of interest.
Supplementary Material
The Supplementary Material for this article can be found online at: https://www.frontiersin.org/article/10.3389/fevo.2017.00060/full#supplementary-material
References
Booth, E. G., Qiu, J. X., Carpenter, R. S., Jason Schatz, J., Chen, X., Kucharik, J. C., et al. (2016). From qualitative to quantitative environmental scenarios: translating storylines into biophysical modeling inputs at the watershed scale. Environ. Model. Softw. 85, 80–97. doi: 10.1016/j.envsoft.2016.08.008
Brismar, A. (2004). Attention to impact pathways in EISs of large dam projects. Environ. Impact. Assess. Rev. 24, 59–87. doi: 10.1016/S0195-9255(03)00162-8
Cai, W. X., Zhu, J. Q., and Zhou, S. X. (2007). Advances in environmental impact post-project -assessment. Environ. Pollut. Control 29, 548–551.
Caniani, D., Labella, A., Lioi, D. S., Mancini, I. M., and Masi, S. (2016). Habitat ecological integrity and environmental impact assessment of anthropic activities: a GIS-based fuzzy logic model for sites of high biodiversity conservation interest. Ecol. Indicat. 67, 238–249. doi: 10.1016/j.ecolind.2016.02.038
CBD (Convention on Biological Diversity) (2006). Decision VIII/28 of the Convention on Biological Diversity: Voluntary Guidelines on Biodiversity-inclusive Impact Assessment. Secretariat of the Convention on Biological Diversity & Netherlands Commission for Environmental. Montreal, QC: Commission for Environmental Assessment.
Černý, T., Doležal, J., Janeček, Š., Šråtek, M., Valachovič, M., Petřík, P., et al. (2013). Environmental correlates of plant diversity in Korean temperate forests. Acta Oecol. 47, 37–45 doi: 10.1016/j.actao.2012.12.001
Chang, B. C., Geng, L. H., and Liu, C. (2006). Ecological effect evaluation index system of water conservancy and hydropower project. Water Sci. Technol. Prog. 25, 11–14.
Chen, K. Q., Ge, H. F., and Yan, X. (2013). Biodiversity conservation in hydropower projects: introducing biodiversity impact assessment into environmental impact assessment of hydropower projects. J. Water Conserv. 44, 608–614.
CMDLRDC (Cadastral Management Division of Land and Resources Department of China) LSPI (Lands Surveying and Planning Institute) (2007). Current Land Use Classification (GB/T 21010-2007). Beijing: Code of International Classification for Standards: 07.040.
Congalton, R. (1991). A review of assessing the accuracy of classifications of remotely sensed data. Remote Sens. Environ. 37, 35–46. doi: 10.1016/0034-4257(91)90048-B
Division of Bill, Resources and Environmental Commission of National People's Congress (DBRECNP) (2003). Interpretation of Environmental Impact Assessment Law of the People's Republic of China. Beijing: China Legal Publishing House.
Dong, Z. (2003). The theoretical framework of eco-hydraulic engineering. J. Hydraulic Eng. J. Hydraulic Eng. 1–6.
Du, Q., and Wang, S. (2005). River ecological function and ecological effects of hydrological processes. J. China Institute Water Conserv. Hydropower 3, 287–290.
Geneletti, D., Beinat, E., Chung, C. F., Fabbri, A. G., and Scholter, H. J. (2003). Accounting for uncertainty factors in biodiversity impact assessment: lessons from a case study. Environ. Impact Assess. Rev. 23, 471–487. doi: 10.1016/S0195-9255(03)00045-3
Gontier, M., Balfors, B., and Mortberg, U. (2006). Biodiversity in environmental assessment-current practice and tools for prediction. Environ. Impact Assess. Rev. 26, 268–286. doi: 10.1016/j.eiar.2005.09.001
Guo, Q. X., Chen, H. W., Xu, X. T., Peng, Z., and Liu, N. (2007). Assessment of the regional landscape ecological impact with project of controlling desertification in the southern suburb of Datong City. Trans. Chin. Soc. Agric. Eng. 23, 69–74.
Guo, Q. X., and Wang, T. M. (2005). Landscape ecological evaluation of Fenglin nature reserve: quantification and interpretation. Chinese J. Appl. Ecol. 16, 825–832.
Hammond, K., and Miles, S. (2004). Assessing quality assessment of corporate social reporting: UK perspectives. Account. Forum 28, 61–79. doi: 10.1016/j.accfor.2004.04.005
He, C. Q., Cui, B. S., and Zhao, Z. C. (2001). Ecological evaluation on typical wetlands in Jilin Province. Chinese J. Appl. Ecol. 12, 754–756.
IAIA (2005). Biodiversity in Impact Assessment. Special Publication Series No. 3. International Association for Impact Assessment. Available online at: https://link.springer.com/article/10.1007%2Fs00267-008-9128-0
Jiang, W. (2005). Study on green water management and water-saving society. China Water Res. 13, 44–45.
Li, Y. W., Liu, F., and Duan, N. (1997). Studies on the post-project analysis in environmental impact. Environ. Sci. Res. 10, 52–56.
Liang, X. G. (2015). How to determine the scope of Environmental Impact Assessment? Environ. Impact Assess. 2, 3–4.
Liu, J., Zang, C., Tian, S., Liu, J., Yang, H., Jia, S., et al. (2013). Water conservancy projects in China: achievements, challenges and way forward. Global Environ. Change 23, 633–643. doi: 10.1016/j.gloenvcha.2013.02.002
Lopez-Pujol, J., and Ren, M. X. (2009). Biodiversity and the Three Gorges Reservoir: a troubled marriage. J. Nat. Hist. 43, 2765–2786. doi: 10.1080/00222930903220010
Lu, C. X., Xie, G. D., and Chen, S. K. (2003). Effect of hydraulic engineering on River ecosystem service function evaluation methods. J. Appl. Ecol. 14, 803–807.
Mäkelä, M. (2017). Environmental impacts and aspects in the forest industry: what kind of picture do corporate environmental reports provide. Forest Policy Econ. 80, 178–191. doi: 10.1016/j.forpol.2017.03.018
McGarigal, K., Ene, E., and Holmes, C. (2015). Fragstats 3.3. Spatial Pattern Analysis Program for Quantifying Landscape Structure. Availabe online at: http://www.umass.edu/landeco/research/fragstats/fragstats.html
Nzeadibe, T. C., Ajaero, K. C., Okonkwo, E. E., Okpoko, P. U., Akukwe, T. I., and Njoku-Tony, R. F. (2015). Integrating community perceptions and cultural diversity in social impact assessment in Nigeria. Environ. Impact Assessm. Rev. 55, 74–83. doi: 10.1016/j.eiar.2015.07.005
OECD (Organisation for Economic Cooperation and Development) (2002). Hand-book for Biodiversity Valuation: a Guide for Policy Makers. Paris: OECD.
O'Neill, R. V., Krummel, J. R., Gardner, R. H., Sugihara, G., Jackson, B., DeAngelis, D. L., et al. (1988). Indices of landscape pattern. Landscape Ecol. 1, 153–162. doi: 10.1007/BF00162741
Panwar, R., Hansen, E., and Kozak, R. (2014). Evaluating social and environmental issues of integrating the legitimacy gap with expectational gaps: an empirical assessment of the forest industry. Bus. Soc. 53, 853–875. doi: 10.1177/0007650312438884
Pielou, E. C. (1966). The measurement of diversity in different types of biological collections. J. Theor. Biol. 13, 131–144. doi: 10.1016/0022-5193(66)90013-0
Qiu, J.-X., and Wang, X.-K. (2010). A comparative study on object-based land cover classification in high spatial resolution remote sensing imagery of urban areas. Remote Sens. Technol. Appl. 25, 653–661.
Qiu, P. H., Xu, S. J., and Xie, G. Z. (2007). Analysis on the ecological vulnerability of the western Hainan Island based on its landscape pattern and ecosystem sensitivity. Acta Ecol. Sin. 27, 1257–1264. doi: 10.1016/S1872-2032(07)60026-2
Shannon, C. E. (1948). A mathematical theory of communication. Bell Syst. Tech. J. 27, 379–423. doi: 10.1002/j.1538-7305.1948.tb01338.x
Shen, Y., Wu, L. N., Wang, H. R., and Yan, X. L. (2005). Post-project-analysis in environmental impact: development and main problems. J. Chang Univ. 25, 56–59.
Steffen, K., and Leuschner, C. (2014). Sixty years of change in the macrophyte vegetation of north-west German running waters: a community- and landscape-level analysis. Feddes Repertorium 125, 98–120. doi: 10.1002/fedr.201400007
Sun, Z., and Dong, Z. (2004). Analysis of the ecological effects of water conservancy projects. Water Resour. Hydropower Eng. 35, 5–8.
Tan, H. F., Luo, Z., Yao, J., and Zhang, S. (2015). Environmental impact assessment of water conservancy and hydropower project: grade and scope for surface water. Environ. Protect. Technol. 21, 42–44.
TGEIAEI (Technical Guidelines for Environmental Impact Assessment Ecological Impact) (HJ 19-2011) (2011). Chinese Classification for Standards (Z00). Beijing: International Classification for Standards (13.020).
Walker, J. S., and Blaschke, T. (2008). Object-based land-cover classification for the Phoenix metropolitan area: optimization vs. transportability. Int. J. Remote Sens. 29, 2021–2040. doi: 10.1080/01431160701408337
Wan, N. F., Jiang, J. X., and Xu, J. X. (2005). Application of the analytic hierarchy process to pest management in the rice fields of Shanghai City. Acta Ecol. Sin. 25, 2997–3002.
Wang, H. F., Lencinas, M. V., Ross Friedman, C., Wang, X. K., and Qiu, J. X. (2011). Understory plant diversity assessment of Eucalyptus plantations over three vegetation types in Yunnan, China. New Forests 42, 101–116. doi: 10.1007/s11056-010-9240-x
Wang, H. F., Qiu, J. X., Breuste, J., Ross Friedman, C., Zhou, W. Q., and Wang, X. K. (2013). Variations of urban greenness across urban structural units in Beijing, China. Urb. Fores. Urb. Green. 12, 554–561. doi: 10.1016/j.ufug.2013.05.004
Wang, H. F., Qureshi, S., Qureshi, B., Qiu, J., Ross Friedman, C., Breuste, J., et al. (2016). A multivariate analysis integrating ecological, socioeconomic and physical characteristics to investigate urban forest cover and plant diversity in Beijing, China. Ecol. Indic. 60, 921–929. doi: 10.1016/j.ecolind.2015.08.015
Wang, Y., Zong, Y., and Chen, M. (2003). A biodiversity index method for evaluating river pollution. Environ. Protect. Recycl. Econ. 23, 22–24.
Wegner, A., Moore, S. A., and Bailey, J. (2005). Consideration of biodiversity in environmental impact assessment in Western Australia: practitioner perceptions. Environ. Impact Assess. Rev. 25, 143–162. doi: 10.1016/j.eiar.2004.03.003
Wen, M., Liu, S., and Cui, B. (2008). Influence of construction of water conservancy projects on ecosystem. Acta Ecol. Sin. 28, 1663–1671.
Westman, W. E. (1985). Ecology, Impact Assessment and Environmental Planning. New York, NY: John Wiley and Sons.
World Bank (2000). Biodiversity and Environmental Assessment Toolkit. Washington, DC: The World Bank.
Wu, J. G. (2000). Landscape Ecology—Pattern, Process, Scale and Grade. Beijing: Higher Education Press.
Wu, J., Huang, J., Han, X., Gao, X., He, F., Jiang, M., et al. (2004). The Three Gorges Dam: an ecological perspective. Front. Ecol. Environ. 2, 241–248. doi: 10.1890/1540-9295(2004)002[0241:TTGDAE]2.0.CO;2
Wu, J., Huang, J., Han, X., Xie, Z., and Gao, X. (2003). Three-Gorges Dam – experiment in habitat fragmentation? Science 300, 1239–1240. doi: 10.1126/science.1083312
Xia, J. H., Yan, Z. M., and Jiang, C. F. (2005). Comprehensive assessment index system of ecosystem riparian zone. Adv. Water Sci. 16, 345–348.
Xie, P., Wu, J., Huang, J., and Han, X. (2003). Three-Gorges Dam: risk to ancient fish. Science 302, 1149. doi: 10.1126/science.302.5648.1149b
Xu, H., Qian, Y., and Peng, B. Z. (2002). Ecological evaluation on yaoluoping nature reserve in anhui province. Agro-environ. Protect. 21, 360–364.
Yang, R. Q., and Xiao, Y. (2000). The ecological evaluation of taibaishan national nature reserve. Geogr. Territori. Res. 16, 75–78.
Zhang, H., and Hu, A. (2010). Some thoughts on ecological effect of water conservancy and hydropower projects and strategies. Business Manager 215.
Zhang, Q. (2009). The South-to-North Water Transfer Project of China: environmental implications and monitoring strategy. J. Am. Water Resour. Assoc. 45, 1238–1247. doi: 10.1111/j.1752-1688.2009.00357.x
Zheng, Y. W., Xue, D. Y., and Zhang, G. S. (1994). Study on ecological evaluation criteria and standards for nature reserve in China. Rural Eco-environ. 10, 22–25.
Keywords: modeling, water conservancy project, landscape index, plant diversity, ecological evaluation
Citation: Zhu Z-X, Zhao K-K, Lin Q-W, Qureshi S, Ross Friedman C, Cai G-Y and Wang H-F (2017) Systematic Environmental Impact Assessment for Non-natural Reserve Areas: A Case Study of the Chaishitan Water Conservancy Project on Land Use and Plant Diversity in Yunnan, China. Front. Ecol. Evol. 5:60. doi: 10.3389/fevo.2017.00060
Received: 19 October 2016; Accepted: 24 May 2017;
Published: 23 June 2017.
Edited by:
Luuk Fleskens, Wageningen University and Research, NetherlandsReviewed by:
Karl Kunert, University of Pretoria, South AfricaSafdar Ali Shirazi, University of the Punjab, Pakistan
Copyright © 2017 Zhu, Zhao, Lin, Qureshi, Ross Friedman, Cai and Wang. This is an open-access article distributed under the terms of the Creative Commons Attribution License (CC BY). The use, distribution or reproduction in other forums is permitted, provided the original author(s) or licensor are credited and that the original publication in this journal is cited, in accordance with accepted academic practice. No use, distribution or reproduction is permitted which does not comply with these terms.
*Correspondence: Hua-Feng Wang, wanghuafeng2012@foxmail.com