Prioritizing Street Tree Planting Locations to Increase Benefits for All Citizens: Experience From Joliette, Canada
 Rita Sousa-Silva
 Elyssa Cameron
 Alain Paquette
- Centre for Forest Research, Université du Québec à Montréal, Montreal, QC, Canada
As the climate continues to warm and the world becomes more urbanized, our reliance on trees and the benefits they provide is rapidly increasing. Many cities worldwide are planting trees to offset rising temperatures, trap pollutants, and enhance environmental and human health and well-being. To maximize the benefits of planting trees and avoid further increasing social inequities, a city needs to prioritize where to establish trees by first identifying those areas of greatest need. This work aims to demonstrate a spatially explicit approach for cities to determine these priority locations to achieve the greatest returns on specific benefits. Criteria for prioritization were developed in tandem with the City of Joliette, Canada, and based on nine indicators: surface temperature, tree density, vegetation cover, resilience, tree size and age, presence of species at risk, land use type, socioeconomic deprivation, and potential for active transportation. The City’s preferences were taken into account when assigning different weights to each indicator. The resulting tree planting priority maps can be used to target street tree plantings to locations where trees are needed most. This approach can be readily applied to other cities as these criteria can be adjusted to accommodate specific tree canopy goals and planning constraints. As cities are looking to expand tree canopy, we hope this work will assist in sustaining and growing their urban forest, enabling it to be more resilient and to keep providing multiple and sustained benefits where they are needed the most.
Introduction
Since the earliest days of the industrial revolution, people have been migrating to cities in search of better living conditions. Today, 55% of the world’s population lives in urban areas, a proportion that is expected to increase to 68% by 2050 (United Nations, 2019). As urbanization accelerates, cities face a growing demand for housing space, energy, public transportation infrastructure, and a range of other vital necessities, with significant consequences for public health, social cohesion, and environmental sustainability (Moore et al., 2003; Madlener and Sunak, 2011; Cook and Swyngedouw, 2012; Strange, 2018). Climate change further exacerbates the challenges of rapid urbanization as urban populations are likely to be more vulnerable to its adverse effects (Bulkeley and Betsill, 2003). The urban heat island effect, for instance, which describes the phenomenon whereby urban areas are generally warmer than their surrounding suburban and rural counterparts, can pose a significant risk to human health and is expected to worsen in the future as the climate continues to warm (Laaidi et al., 2012; Heaviside et al., 2017).
Cities play a pivotal role in climate change as both problem sources and solutions. As the hubs of economic activity, cities are often blamed as major contributors to greenhouse gas emissions but we fail to acknowledge that well-planned and governed cities are also central to mitigation strategies (Satterthwaite, 2008; Dodman, 2009; Revi et al., 2014). In light of the responsibilities they hold concerning land use planning, cities afford multiple opportunities to develop and implement new policies and programmes for mitigating climate change (Dodman, 2009). Furthermore, local efforts to mitigate climate change impacts, such as maintaining or expanding urban forests, may be politically easier to implement than international efforts, while having immediate benefits, such as energy cost savings and sizeable public health benefits (Akbari and Konopacki, 2005; Harlan and Ruddell, 2011; Estrada et al., 2017).
Urban trees, particularly street trees, provide numerous benefits, or ecosystem services, which can contribute to mitigating climate change while also enhancing urban biodiversity, sustainability, and improving human health and well-being (Tyrväinen et al., 2005; Harlan and Ruddell, 2011; Salmond et al., 2016; O’Sullivan et al., 2017; Nowak et al., 2018). These benefits range from intangible social, psychological and aesthetic values (Peckham et al., 2013) to the amelioration of air quality (Nowak et al., 2018), carbon sequestration (Lindén et al., 2020), and the attenuation of heat-island effects (Ziter et al., 2019). As a result, tree planting programs are being actively pursued around the world. For instance, in 2015, New York City completed an effort to plant one million trees (New York Restoration Project, 2020); Los Angeles has planted 407,000 trees between 2006 and 2013 (McPherson, 2014); Milan hopes to plant three million trees by 2030 (Barry, 2018); and China aims to increase tree cover to 45% in more than 200 cities (Liu et al., 2004). In Canada, where 80% of the population now lives in cities, several cities have also adopted major tree planting programs to expand their urban forests (e.g., City of Toronto, 2013; City of Vancouver, 2014; Ville de Montréal, 2016). Planning, planting, and growing the urban forest, insuring that those trees will be cared for and survive into the future, create opportunities for improving its resilience to climate change and the continued delivery of its benefits for decades to come. Indeed, if done well and in an integrated manner with other solutions to reduce the sources and enhance the sinks of greenhouse gases, the maintenance of existing trees and the planting of new trees can help tackle the climate emergency we are currently facing (Griscom et al., 2017; Ripple et al., 2019). Furthermore, strategic planting of new trees can help cities proactively address existing inequities associated with the distribution of urban tree cover, namely street trees, and by extension its benefits. Low-income minority neighborhoods typically have fewer trees and are disproportionately exposed to adverse environmental health impacts, including from extreme heat and poor air quality (Nesbitt et al., 2019; Landry et al., 2020; Schell et al., 2020). Emphasis to improve urban green equity should focus on street trees and private residential land, as noted by previous research (Nesbitt et al., 2019), the former being the focus of this study.
Urban tree planting efforts are, however, hampered by the relatively limited space for tree planting in dense cities (Pataki et al., 2021) and by factors such as air pollution, soil compaction, wide pH ranges, heat, and general abuse (Sæbø et al., 2003), which make it difficult to establish new trees and maintain existing ones. The complexity required to manage for this wide array of challenges in an era of budget constraints makes it ever more important to plant the right tree in the right place to maximize the benefits provided by each tree and to build a more resilient urban forest overall (Roy et al., 2012; Pincetl et al., 2013; Hale et al., 2015). We want the trees being planted today to deliver benefits now, but especially over the long term.
In this paper, we describe an approach we developed for the City of Joliette, Canada, including the spatial analyses and insights gained from discussions with local stakeholders to improve the approach’s usability and practicality, which can be replicated in other cities. Our work draws inspiration from previous studies, in particular that by Locke et al. (2010), which describes an approach for identifying and prioritizing tree planting sites designed to support the New York City tree planting campaign. Other studies have described similar approaches for different cities or to prioritize specific benefits. For example, Morani et al. (2011) and Locke et al. (2013) have extended a priority planting methodology for Baltimore, Maryland, previously developed by Raciti et al. (2006). Bodnaruk et al. (2017) have explored optimal planting locations and trade-offs for the mitigation of air pollution and excessive heat for Baltimore; Lin (2020) developed a framework to prioritize tree planting and protection locations to maximize human health benefits in a case study of New York City. Our work demarks itself from previous works as our approach was developed from the onset with the challenges of smaller cities in mind – for example, regarding data availability – contrary to the studies mentioned above that were developed for densely developed urban areas; and by explicitly considering urban forest diversity and resilience. To the best of our knowledge, our case study is also the first published study for Canada, whose government has recently pledged to plant two billion trees over the next 10 years, including in urban settings (Natural Resources Canada, 2020). Our objective was to identify opportunities for substantial gains in street tree cover by identifying and prioritizing locations where the benefits of trees are most needed (socially, economically, and environmentally) while maximizing the benefit-cost ratio of each newly planted tree, and reinforcing the resilience of the urban forest. Numerous studies have shown that the benefits of maintaining trees and the urban forest usually outweigh the costs (McPherson et al., 2005; Vogt et al., 2015; Song et al., 2018). For example, a study of urban forests in California, United States, found that residents received $5.82 in annual benefits from every $1 invested in management costs of street trees (McPherson et al., 2016); and in Toronto, Canada, researchers found that people living on tree-lined streets reported health benefits equivalent to being 7 years younger or receiving a $10,000 salary rise (Kardan et al., 2015), thereby demonstrating that street trees are worth the management investment. Our approach stemmed directly from city managers and elected officials’ concerns: in 2019, the City of Joliette sought help to achieve ambitious goals to grow their urban forest that, from the onset, where quantified in terms of actual service delivery, not “canopy cover” or “number of trees planted.” In other words, they were asking: “Where should we plant trees?,” with a limited budget, so as to maximize the benefits that targeted tree plantings can achieve for all citizens.
Materials and Methods
Study Area and Indicators Analyzed
Joliette is a small city in southwest Quebec, of approximately 20,000 inhabitants (Statistics Canada, 2016), and approximately 50 km northeast of Montreal, the second-most populous city in Canada (Figure 1).
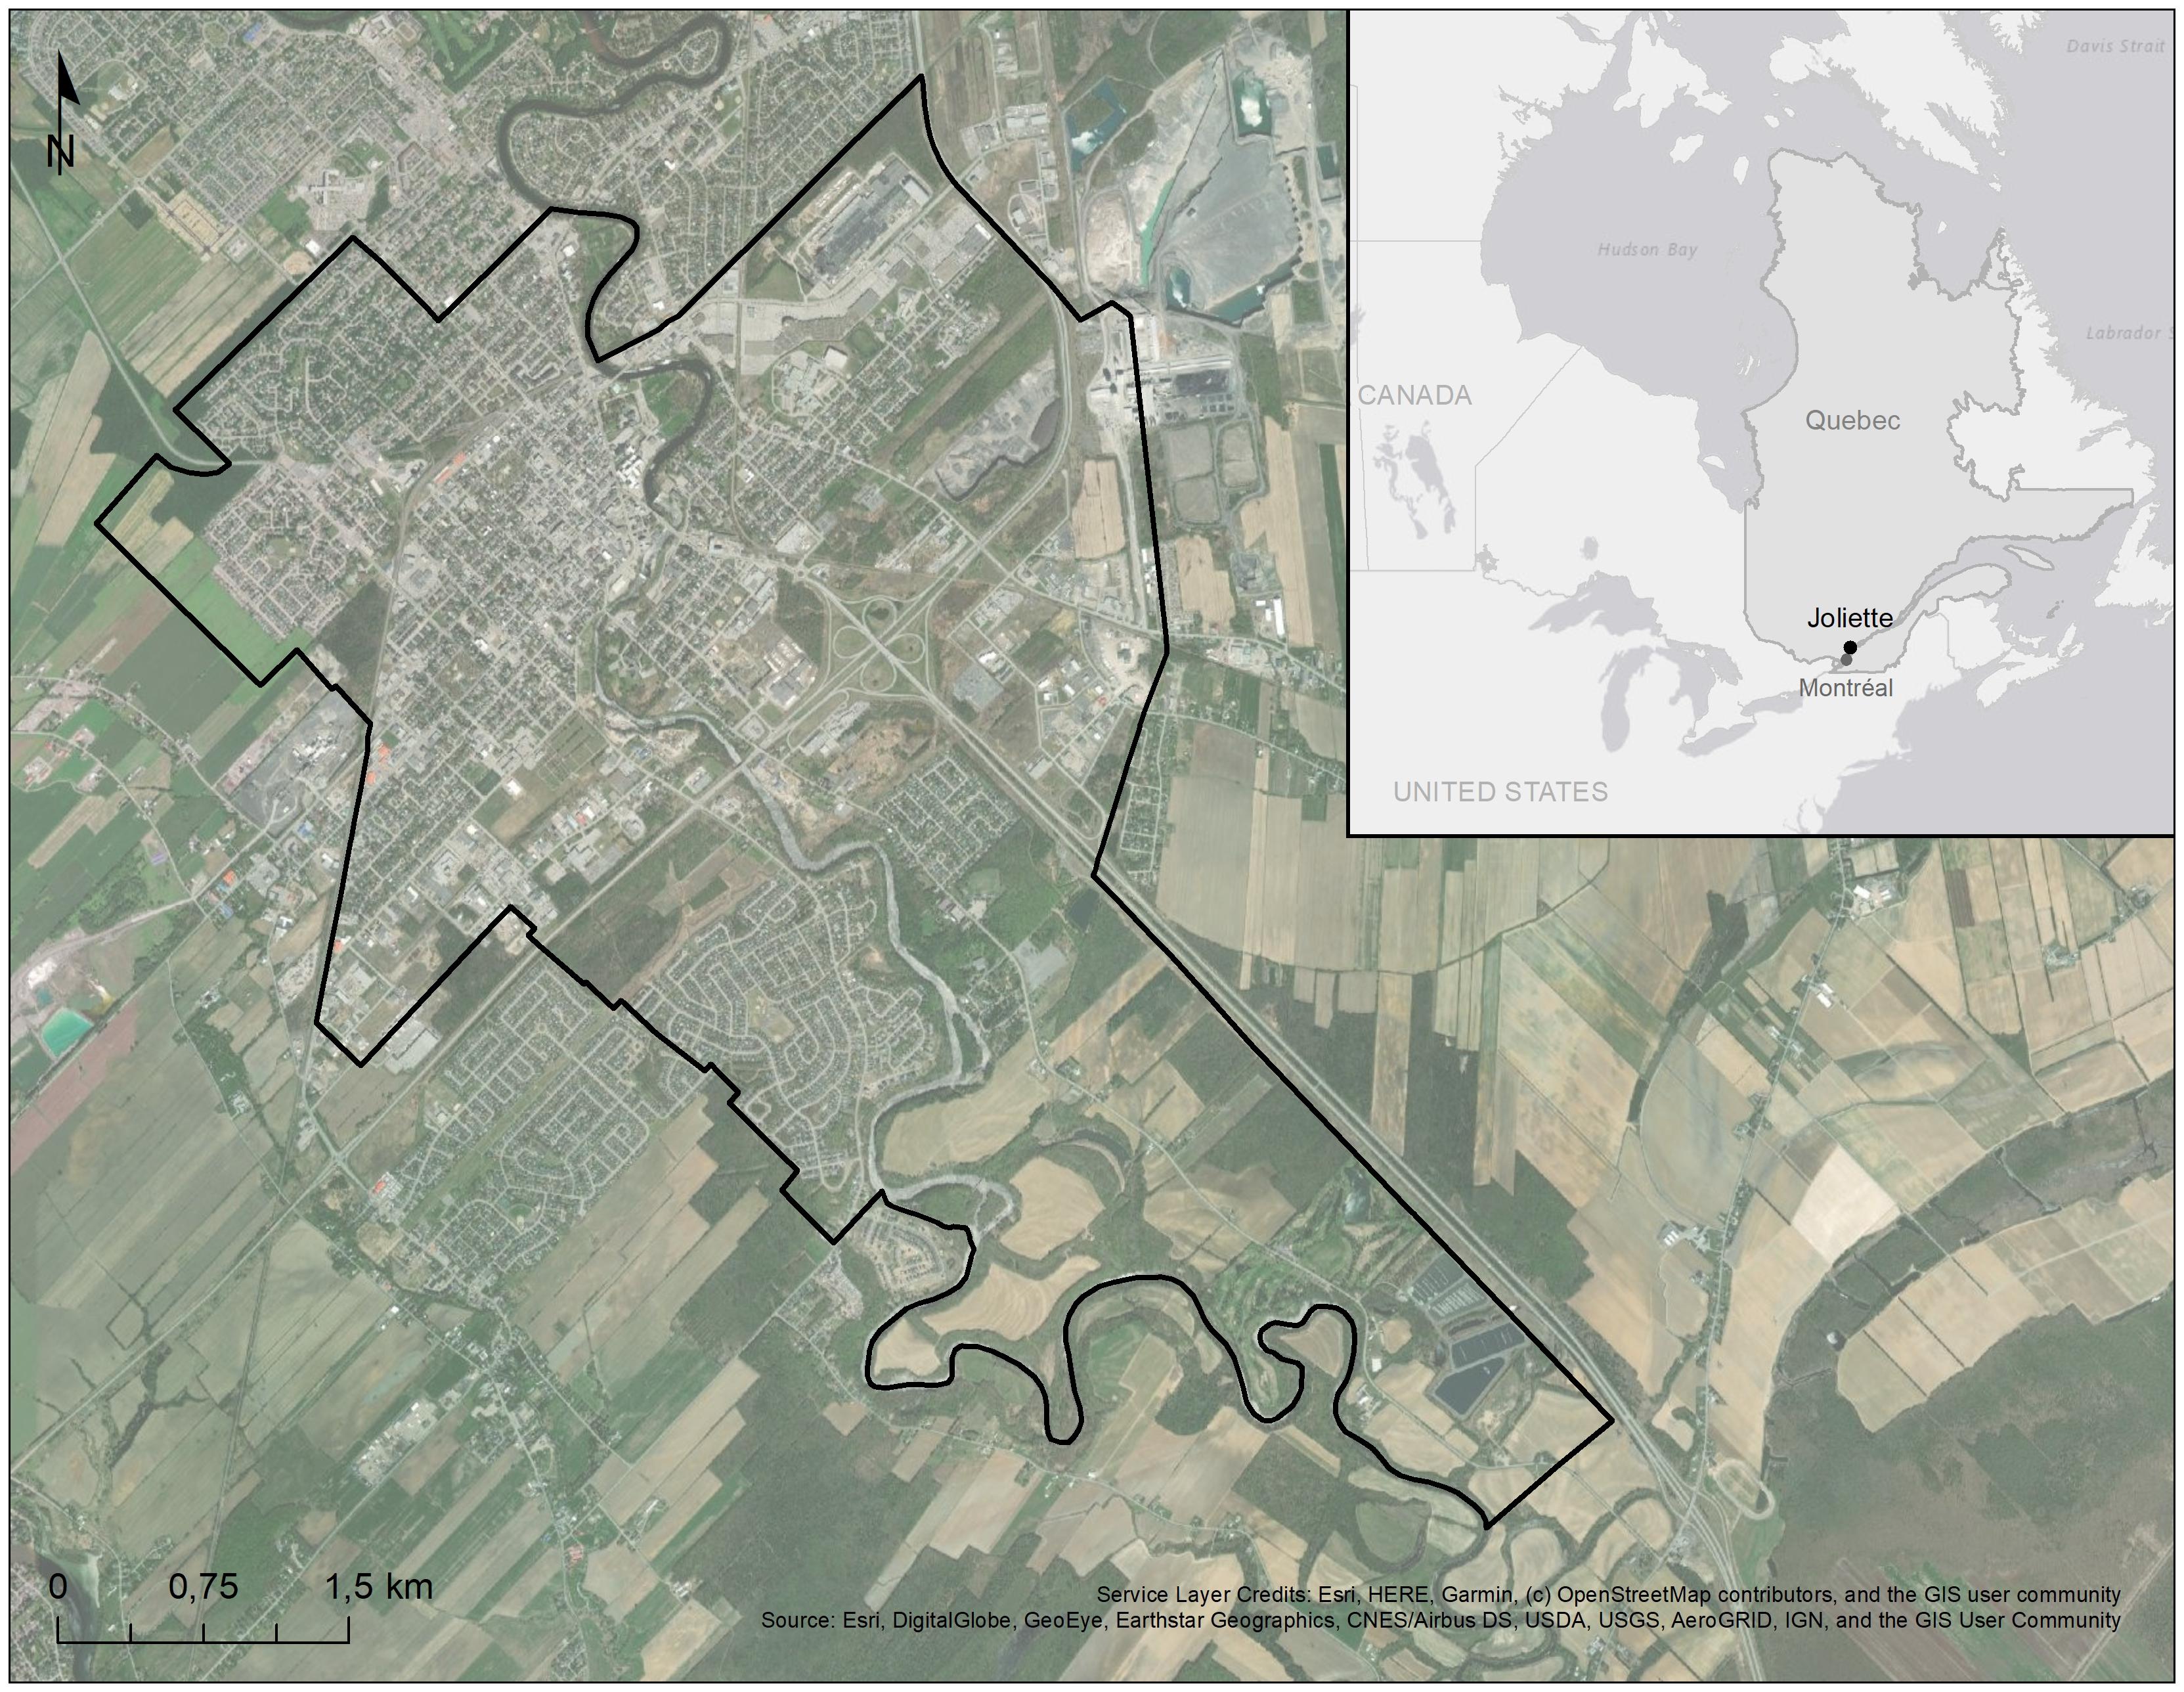
Figure 1. Map of the City of Joliette. The inset map shows the location of the study area in Quebec and Canada. Maps were created using ArcGIS software (version 10.7.1; www.arcgis.com).
The selection of potential indicators and their relative weight for prioritizing street segments for tree planting was guided by published literature (e.g., Locke et al., 2010, 2013), expert judgment, and feedback from meetings with city managers, as well as data availability. Prioritization works by matching known tree benefits to areas lacking in those benefits; whereby areas lacking one or several benefits are classified as being of higher priority than areas already rich in benefits. Specifically, future planting locations were selected by using a planting priority index developed by combining nine indicators that are within the reach of most cities, large and small: (1) surface temperature, (2) tree density, (3) vegetation cover, (4) functional diversity, (5) tree size and age, (6) presence of species at risk (in this example, ash trees), (7) land use type, (8) socioeconomic deprivation, and (9) potential for active transportation. Data for each indicator were spatially aggregated within a buffer area of 50 m around each street segment (part of a street between two consecutive junctions; see Supplementary Figure 1 for a schematic representation), which is the geographic unit used for planning purposes in the City of Joliette (as in most municipalities). For ease of use and interpretability, indicators with continuous data were split into quintiles. These data were ordered from smallest to largest and then divided into five equally sized groups, or quintiles, and categorized from 1 through 5, where 1 represents the lowest priority and 5 represents the highest priority. As part of the analysis, each indicator was assigned a weighted score from 1 to 3 (see section “Weighting of the Indicators and Optimization Scenarios” below) to best meet the City’s highest priorities – which in this case was reducing the urban heat island effect. All spatial analyses were done using the Spatial Analyst tool in ArcGIS 10.7.1 software.
Surface Temperature
In urban areas, the replacement of vegetated surfaces with paved and impervious surfaces increases surface temperatures and contributes to the urban heat island effect (Akbari and Konopacki, 2005; Mohajerani et al., 2017). Planting trees in cities can mitigate urban heat island effects directly through shading and indirectly through evapotranspiration cooling; especially in the case of cities that are powered by fossil fuels, tree shade can also reduce the demand for air conditioning and therefore carbon emissions from power plants (Akbari and Konopacki, 2004; Gunawardena et al., 2017; Ziter et al., 2019). Data on surface temperature were sourced from the Quebec Public Health Institute for 2015 (INSPQ, 2012), and for each street segment, a single temperature value was calculated by averaging the temperature values of pixels falling inside each buffer area (pixel size of 20 m × 20 m; Boulfroy et al., 2013). Areas with high temperatures have a greater need for more trees and therefore represent a high priority for tree planting.
Tree Density and Vegetation Cover
We used two indicators to describe tree cover: tree density (defined as the number of street trees per kilometer) and vegetation cover (defined as the percentage of ground covered by green vegetation, including trees, shrubs, and grass). Information on tree canopy cover from airborne LiDAR or satellite imagery was not available, as is often the case for smaller cities worldwide. Tree density was calculated using the City’s tree inventory data: a total of 22,527 public trees from approximately 91 species in 39 genera were georeferenced and had their diameter at breast height measured. Note that this indicator ignores private trees, as is always the case in municipal tree inventories. The most abundant species is silver maple (Acer saccharinum; 19%) and the most abundant genera are Acer (35%) and Fraxinus (21%). Vegetation cover was estimated for each buffer area using the Normalized Difference Vegetation Index (NDVI) derived from Landsat 7 imagery taken in 2017 (30 m resolution; the Landsat data are freely available from the USGS at)1, where higher values indicate a higher density of green vegetation. Using both indicators maximizes the information that can be learned about the type and density of vegetation – for instance, the NDVI does not differentiate trees from grass but does include private greenery, such as trees growing in residential yards. For both indicators, low scores indicate street segments with a very high density of trees (or green vegetation cover) and therefore a very low priority area for tree planting, whereas high scores correspond to streets with a very low tree density (or green vegetation cover) and are ranked a very high priority for planting.
Tree Functional Diversity
Historically, streetscapes have been dominated by rows of trees of the same species putting the whole urban forest at risk from biotic agents like the Dutch elm disease and the emerald ash borer (Raupp et al., 2006; Greene and Millward, 2016). Therefore, a diversity of responses to any stress or disturbance amongst different species is imperative for maintaining the sustained flow of benefits that urban forests are expected to provide to society. Plant functional traits, defined as measurable species characteristics that reflect the responses and adaptations of plants to the environment (Violle et al., 2007), can be used to pool species together into ecologically meaningful groups. It is assumed that different species with similar functional traits respond similarly to the environment and, therefore, that using species from different functional groups provides the best insurance to maintain and enhance the benefits of trees into the future (Paquette et al., 2021). For this study, the tree species found in the City of Joliette’s tree species inventory were divided into five functional groups, defined by functional traits that reflect the ecological strategies of species to cope with stressful conditions, and according to a method developed by our group previously (Paquette et al., 2021). Functional diversity was estimated as the effective number of functional groups, or Hill numbers, using the exponential of Shannon’s diversity index. The Hill numbers, originally introduced as an evenness index in economics by Hill (1973), account for both the richness and evenness characteristics of a community (Jost, 2007). The lower the effective number of functional groups in each street segment, the higher the chance that disturbances will impair ecosystem functioning and consequently, the greater the priority of the location for tree planting. Although the dataset used in Paquette et al. (2021) has been expanded and updated to include new species (Belluau et al., 2021), we realize this information may be difficult to obtain or otherwise unavailable in some regions. In these cases, a more simple index, such as the Hill numbers estimation of species richness, could be used instead.
Tree Size and Age and Species at Risk
Streets with many large old trees reaching the end of their natural life span or in need of being replaced (e.g., infected ash trees) should also be considered high-priority locations for tree planting. In this study, we used tree size (diameter) as a proxy to identify older trees that have reached their maximum size and could, potentially, begin to decline in health and require removal in the short term. For each species, the maximum diameter was determined using data from Montreal’s tree inventory (a neighboring large city with an inventory having a larger overall number of individuals per species; Ville de Montréal, 2021), with values assigned equal to the 95th percentile value in the dataset for each given species. The diameter of each tree in the Joliette’s tree inventory was then compared with the maximum diameter of corresponding species and all trees whose diameter was above the 85th percentile of the observed maximum diameter for that species were classified as “older trees.” Finally, the proportion of older trees in each street segment was determined, with larger values indicating higher priority for planting. Likewise, street segments with a greater proportion of ash trees were ranked with increased priority due to the spread of the emerald ash borer and its current and anticipated impacts on Joliette’s urban forest cover. The emerald ash borer, Agrilus planipennis, an insect pest native to Asia, has killed millions of ash trees in the United States and Canada and poses a very high risk to urban forests, especially those dominated by a small suite of species (Poland and McCullough, 2006; Greene and Millward, 2016), like the City of Joliette, where ash comprises roughly 21% of all urban trees. It is important to note that both the species and age of trees are, most often, not uniformly distributed in a city. Indeed, trees along streets and in parks are commonly planted at the same time, all of approximately the same age, and from a small pool of species, often just one, so that most of those ash trees, for example, are found in quasi-monoculture patches. This has important management implications as the loss of trees will result in concentrated areas of high forest cover loss, with subsequent cascading impacts on human health and well-being.
Land Use Type
Land use often plays a key role in the presence, or absence, of trees within a city. Also, cities have the authority and responsibility for planting new trees in public areas, such as parks and streets, but this control is restricted on private parcels, such as residential yards, gardens, or commercial and industrial areas, where the majority of available planting spaces are (Troy et al., 2007; Ordóñez et al., 2019). For this study, land use data were provided by the City of Joliette, whereby each street was classified as being in either a residential, commercial, industrial, or rural area. This classification was based primarily on the types of buildings and infrastructure present on each given street. Subsequently, through consultation with the City, a prioritization ranking was assigned to each land use type. Residential areas were ranked highest (5) as it was hypothesized that the greatest number of people would benefit from having a greater number of trees in these areas. Following the same logic (greatest impact for citizens), commercial areas were ranked second (3), followed by industrial (2) and rural (1). The gap between the highest-ranked class (residential areas, 5) to the second highest (commercial areas, 3) was an intentional choice to place greater importance on planting trees where people live; this can be modified or adapted depending on the context of the city being targeted.
Socioeconomic Deprivation
The benefits of urban trees are considerable, yet there is growing concern that access to these benefits is not equally distributed throughout a city. Previous studies have shown that canopy cover tends to be lower in poorer neighborhoods (Dai, 2011; Greene et al., 2018). A disparity in location and quality of urban forest canopy cover leads to an inequitable distribution of such benefits, often disproportionately benefitting more affluent neighborhoods, which compounds preventable health issues, including heat-related illnesses and deaths (Wolch et al., 2014; Greene et al., 2018). Urban greening strategies offer, therefore, an opportunity to reduce inequality in the distribution of the benefits of trees through strategically targeted planting efforts. To achieve this goal, we used the Canadian deprivation index based on the 2016 census data (INSPQ, 2016). This index embodies two forms of inequality, material and social. The former refers to the lack of everyday goods and commodities, including poorer access to urban green space; whereas the latter refers to the fragility of an individual’s social network, from the family to the community (INSPQ, 2016). The scores for both material and social deprivation were equally weighted (50/50) to obtain the summary deprivation score. For instance, an area with a material deprivation index of 3 and a social deprivation index of 5 would receive a summary score of 4. This produces a summary deprivation score from 1 to 5, with 5 representing the most deprived areas that should be treated as a top priority for planting additional trees.
Potential for Active Transportation
Transport infrastructures, such as bicycle lanes and pedestrian corridors that encourage active transportation, are prime locations to plant trees. As well as helping to cool the air by providing shade, planting trees is an effective way to encourage physical activity, making these areas welcoming and attractive for people, and reducing cyclist and pedestrian exposure to pollution (MacNaughton et al., 2014; Lusk et al., 2018). Transportation corridors with both bicycle and pedestrian infrastructures have the highest potential for active transportation and hence deserve a high priority score (5), whereas roads with infrastructures for only cyclists or pedestrians received a lower priority score (3; medium potential, medium priority). Finally, roads with no bicycle lanes nor sidewalks received a score of 1 (low potential, low priority). In short, if there is potential for active transportation, we want to favor it by adding trees and the greater the potential (bicycle lanes and/or sidewalks), the greater the priority to plant, and hence the decision to maximize the discrimination between classes (i.e., the gaps between them). The networks of bicycle lanes and sidewalks were provided by the City and were related spatially to the street segments network within a 15 m buffer area.
Weighting of the Indicators and Optimization Scenarios
Once all of the nine indicators’ scores have been calculated, they were multiplied by their respective weights and summed to yield a single weighted composite score, wherein larger index values indicate a higher priority for planting. No pretense is made that these are the only relevant indicators, but they are the indicators that have been given the most attention in the literature and for which data were available in Joliette as in most small cities. Weights ranged from 1, signaling indicators of lower importance, to 3, denoting indicators of higher importance. The weighting of indicators in this study was determined through consultation with the City to best meet their priorities. These weights are not rigid and the City may revise them over time to reflect changing priorities; likewise, different cities, with different priorities and challenges, can also assign different weights to the indicators. This is an important feature of a multi-criteria decision analysis approach, such as the one presented here, as it allows for a transparent understanding of how the values and preferences of different stakeholders (e.g., local authorities, community leaders), weighting the importance of the criteria, affect the decision-making process (Hongoh et al., 2011).
The equation used for the calculation of the planting priority index used in this paper is the following:
where PPI denotes the planting priority index, I is the score of the indicators a, b, c… i, and w is the weight of each indicator.
Different optimization scenarios can be explored and compared based on the weights assigned to the indicators (Figure 2). One (of multiple) possible optimization scenarios is presented in Figure 3, in which temperature reduction in residential areas was judged by the City to be the most important criterion to prioritize tree planting (hereafter referred to as “heat reduction scenario”). In this scenario, surface temperature is given the highest weight (a score of 3), followed in importance by land use type (to target areas of highest citizen presence first), percent canopy cover (to achieve maximum benefits), ash trees presence (to align with city intervention that is already needed), and socioeconomic deprivation (to assure impoverished communities receive more equal services) that were all assigned a weight of 2, with the others receiving a weight of 1 (see Table 1 and Figure 4 for details).
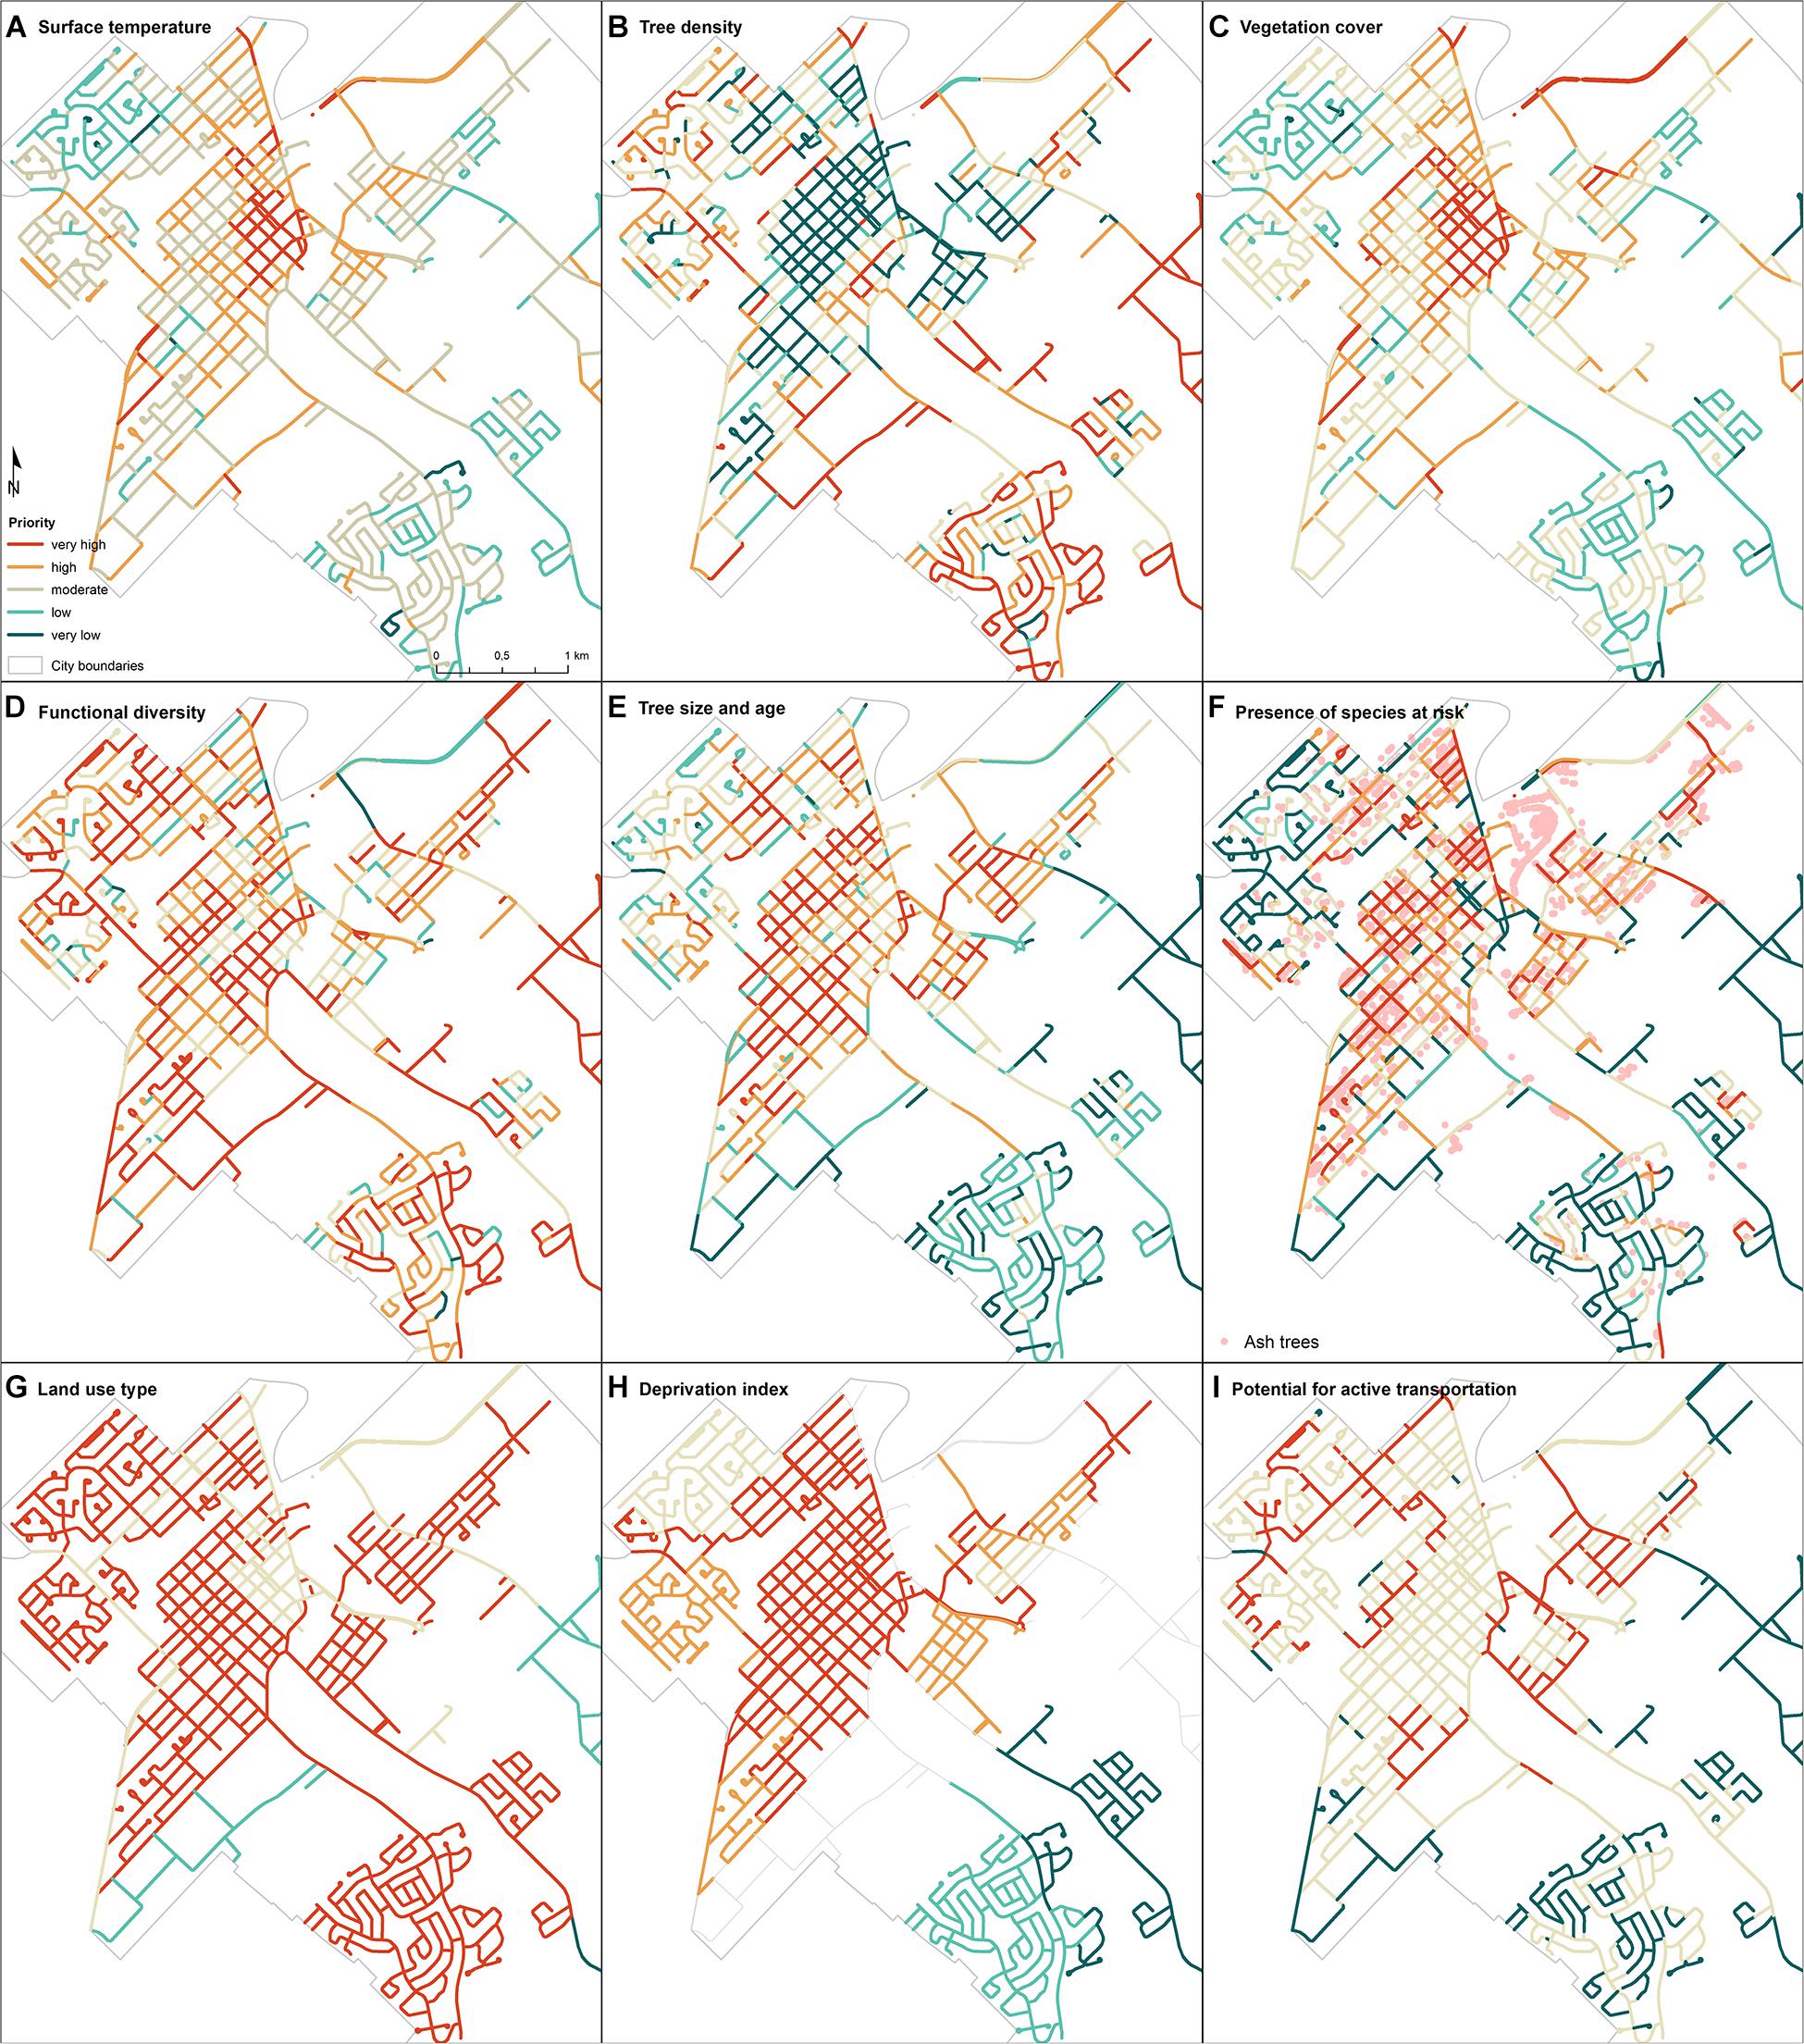
Figure 2. Tree planting priority maps for the City of Joliette showing single-objective optimizations scenarios using the selected indicators: (A) surface temperature, (B) tree density, (C) vegetation cover, (D) tree functional diversity, (E) tree size and age, (F) presence of species at risk (ash trees), (G) land use type, (H) deprivation index, and (I) potential for active transportation. Street segments shown in red have a higher priority for planting (unweighted values).
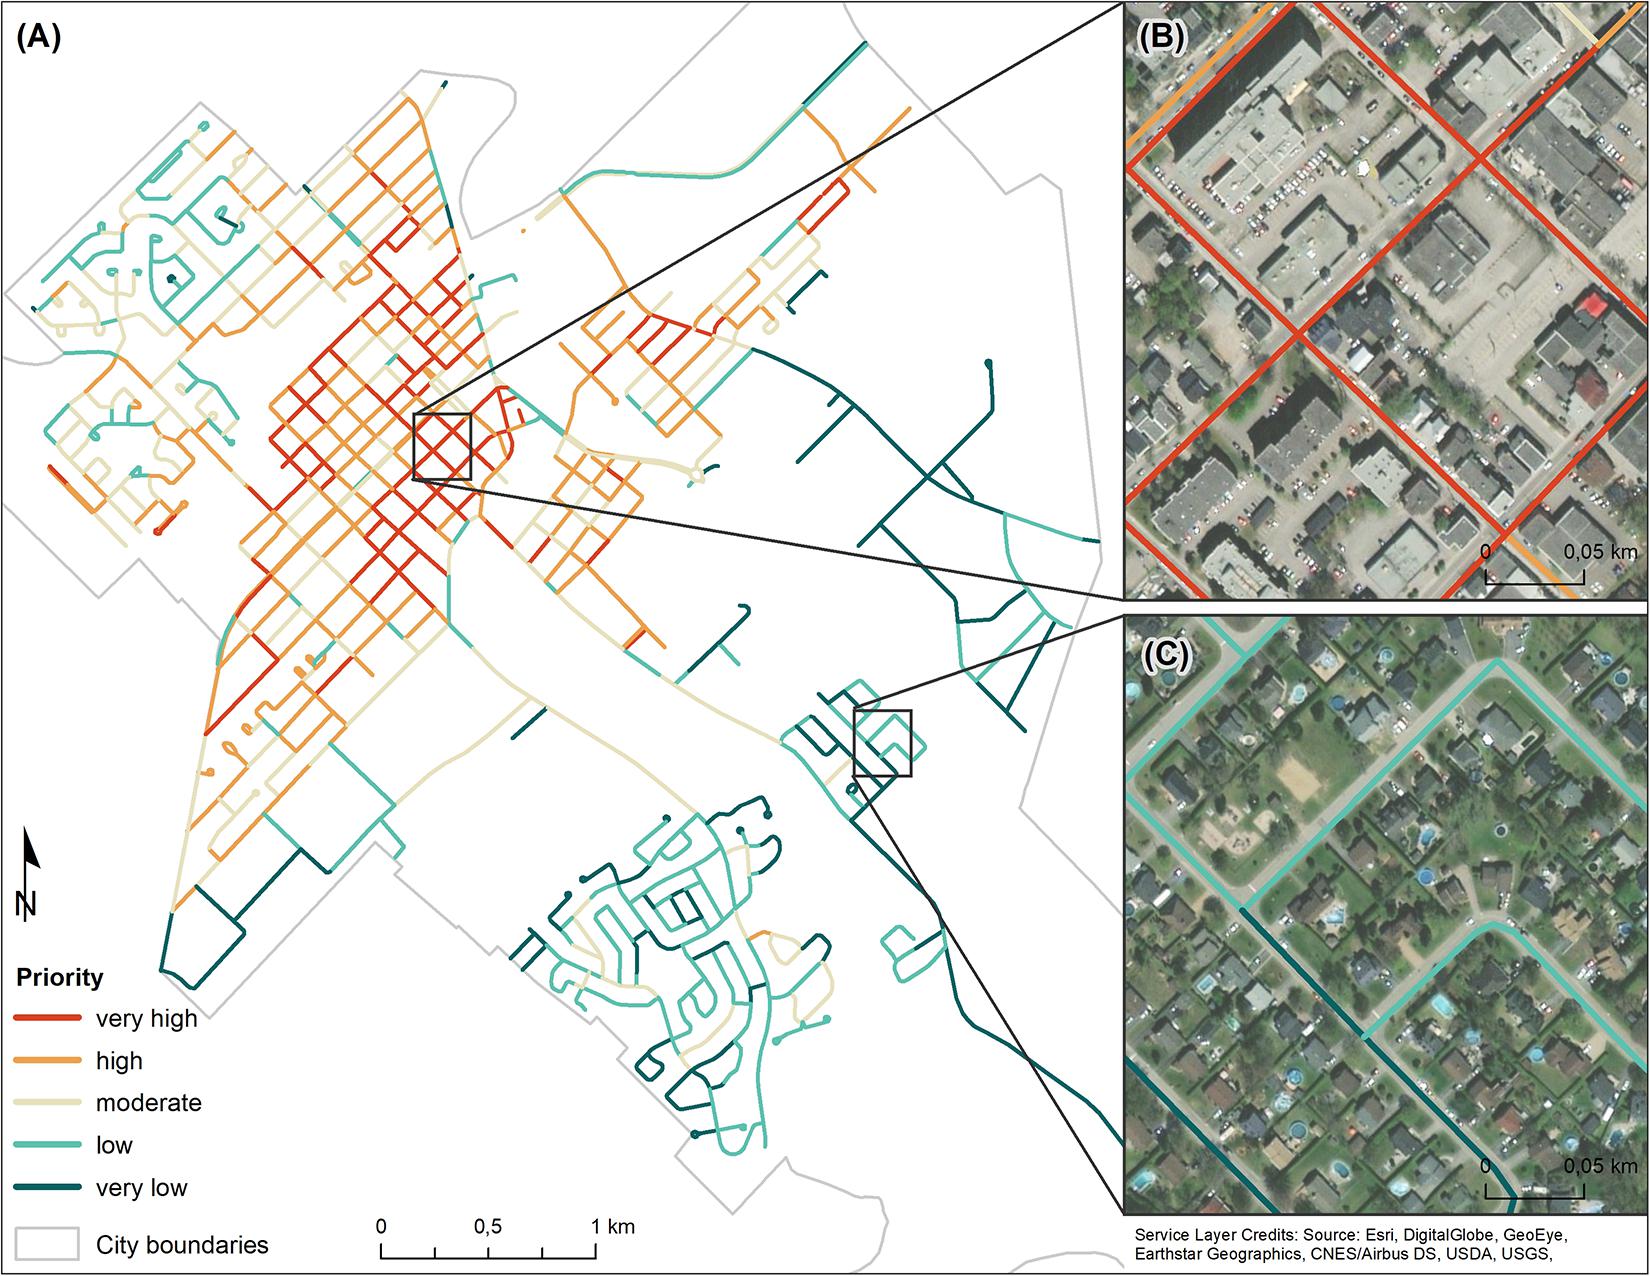
Figure 3. Tree planting priority map for the City of Joliette with heat reduction as the overarching goal (heat reduction scenario). Map of the city’s street segments network (A), with insets showing high (B) and low priority areas (C) for tree planting on a larger scale. Street segments shown in red have a higher priority for planting.
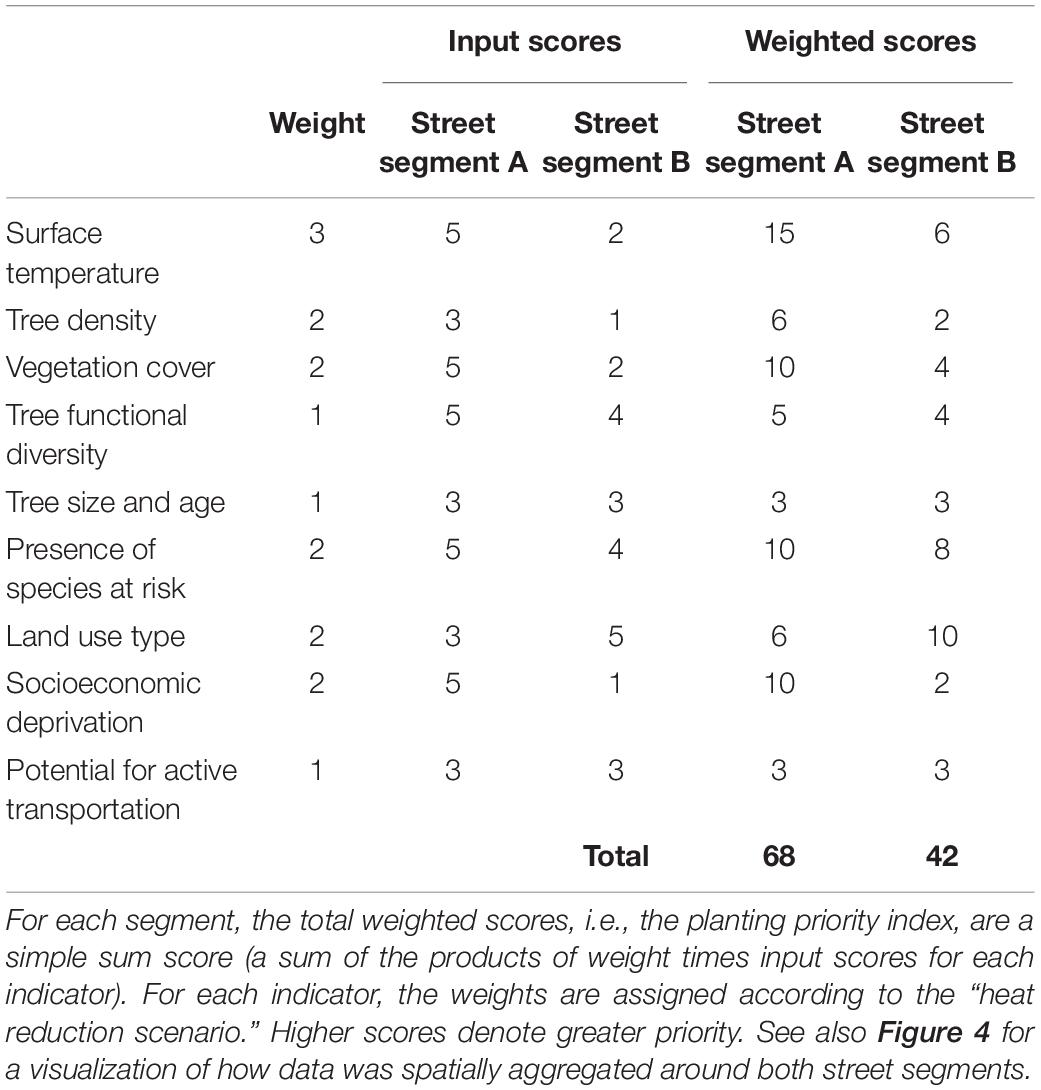
Table 1. Input scores and weighted scores for the nine indicators used for prioritizing tree plantings in the City of Joliette for two street segments, one with very high priority (A) and one with very low priority (B), both highlighted in Figure 3.
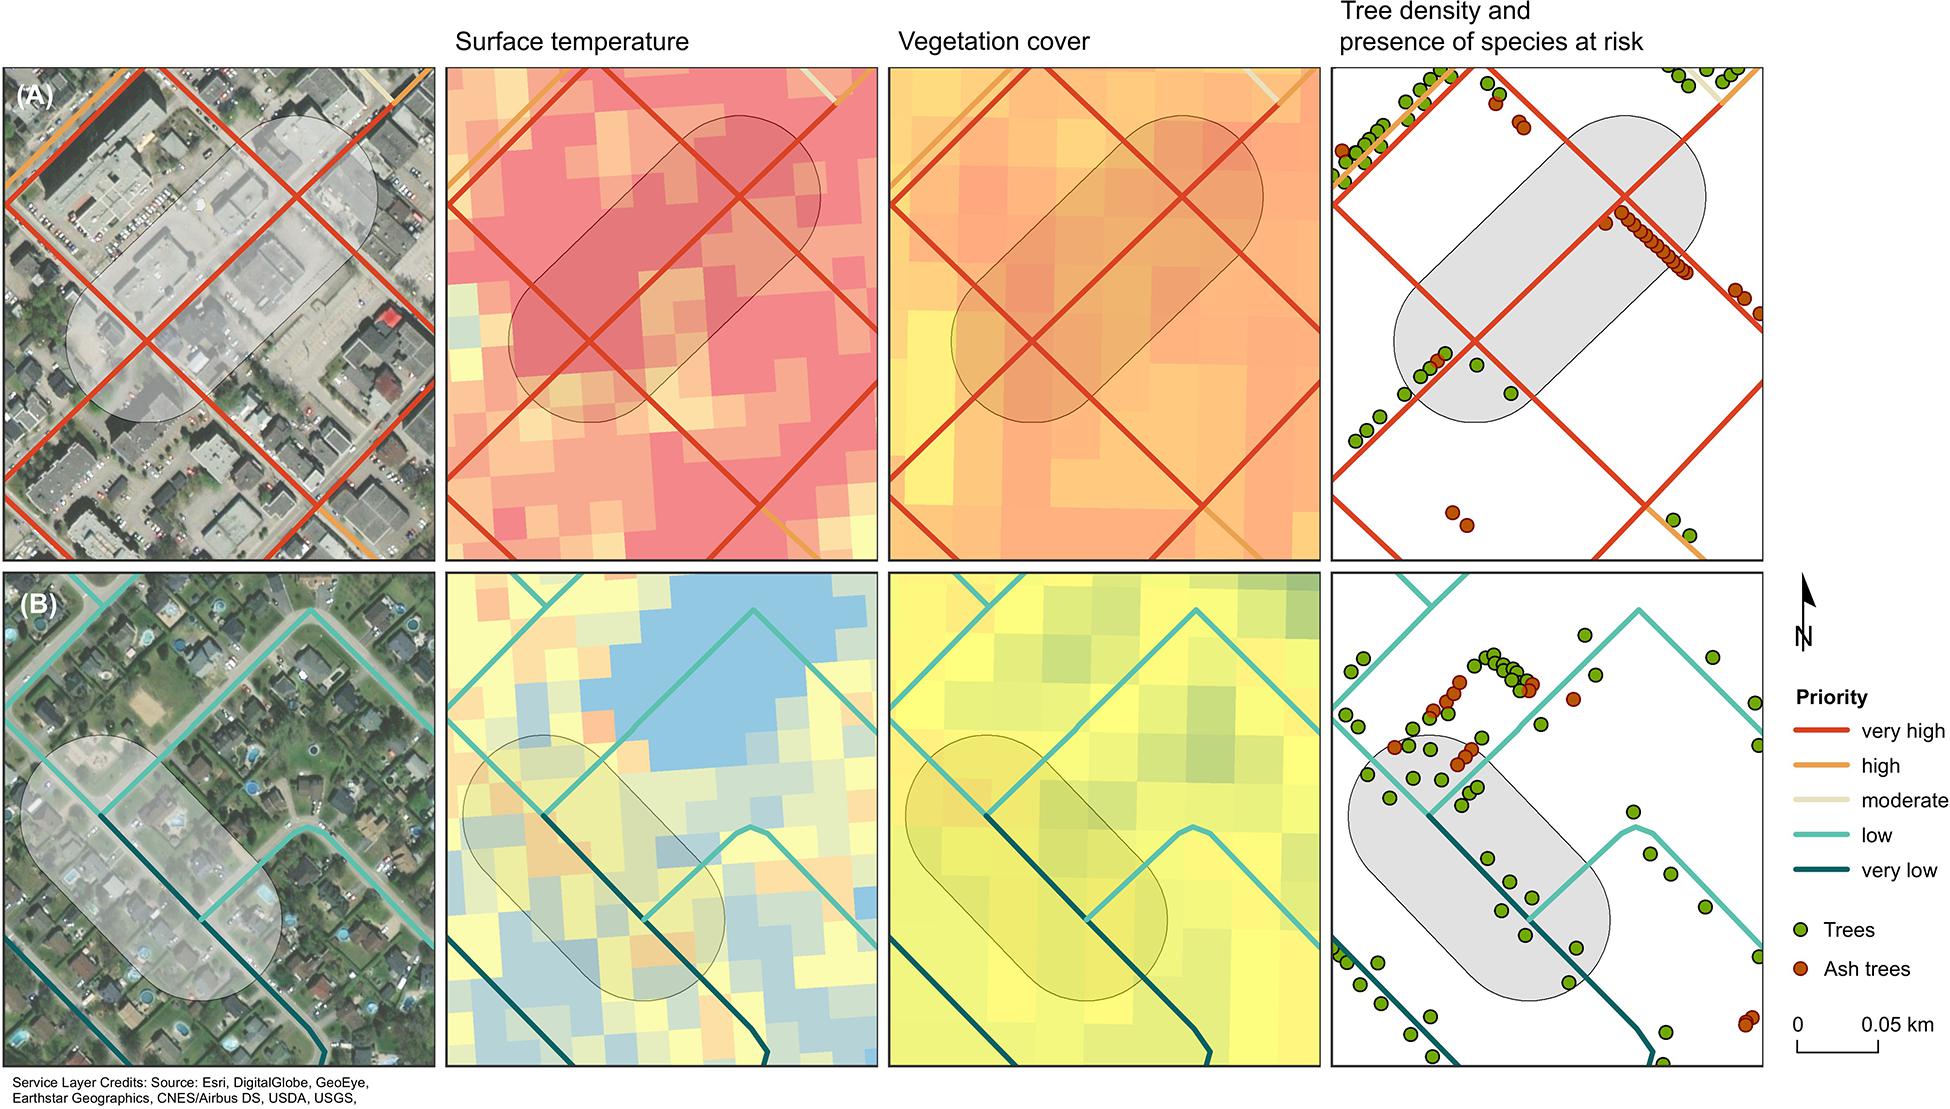
Figure 4. Example of street segments with very high priority (A) and very low priority (B) for tree planting (weighted composite score assigned according to the “heat reduction scenario”; first column on the left). Buffer area (light gray) used to aggregate spatial data around each street segment is also shown. All spatial analyses were done using the Spatial Analyst tool in ArcGIS (version 10.7.1; www.arcgis.com). The examples shown here illustrate four indicators: surface temperature, vegetation cover, tree density, and presence of species at risk (here, ash trees). Street segments shown in red have a higher priority for planting.
Visualization of Results
The results of the proposed tree planting prioritization scheme can be cartographically shown by using a geographical information system, a spatial analysis tool commonly used by municipalities. Different classification methods produce different maps with the same data. The most commonly used classification methods in geographical information systems are natural breaks, quantile, equal interval, and standard deviation. In this analysis, the Jenks optimization method was used to create the choropleth maps as it seeks to minimize variation within classes (making them as similar as possible) while maximizing variance among classes (making data classes as different as possible) (Figures 2, 3). The levels of planting priority were divided into five classes, including very high, high, moderate, low, and very low, for interpretability and visualization as in previous studies (e.g., Locke et al., 2010, 2013). The natural breaks classification (Jenks) is based on natural groupings inherent in the data searching for points where the difference is maximized and using these as the limits of each class.
Results
After calculating a final score for each street segment, nine street tree planting prioritization maps were generated, one for each indicator (Figure 2). The results were in part similar between the maps with areas representing a high priority for tree planting becoming easily visible: these areas are generally in the city center while the areas considered of lowest priority for planting are located in the suburban areas. The exception was the map showing the density of the existing tree canopy located on public land (Figure 2B). Importantly, high canopy density can be seen to overlap with areas with a high density of ash trees (Figure 2F). Local functional diversity was relatively low everywhere (Figure 2D).
In addition, we mapped the “heat reduction scenario” (Figure 3), where areas of highest priority have high-temperature values, low canopy cover, and higher values of deprivation index (Figure 2). This is a direct consequence of the relative weights assigned to each indicator to align with the current priorities of the City, which placed greater importance on gains in canopy cover in residential areas to reduce the heat island effect. In addition to the “heat reduction scenario,” we also explored a scenario where functional diversity and ash trees’ presence were weighted more heavily (i.e., they received a weight of 3; Supplementary Figure 2). Low species diversity is a major concern ecologically, but not currently a highly actionable priority for the City. This scenario was hence chosen to illustrate the diverse range of goals that can be attained – likely reflecting different priorities (or combination of priorities) and perspectives – through targeted tree plantings. However, in short, the two scenarios produced similar recommendations.
Finally, the classification method used in Figures 2, 3 was based on the Jenks natural breaks, whose class breaks are set where there are jumps in the data values. It is important to note, however, that it is only the way the results are communicated that changes; the recommended planting order (i.e., the values of each indicator and the weighted scores used to calculate the planting priority index) remains the same.
Discussion
The spatial prioritization approach explained and applied in this paper is fairly straightforward and practical to use, as well as fully adaptable to different cities with different priorities. It is also within the reach of most cities, large or small, since it uses readily available data at no or little cost, and can be adapted to context and resources available. It addresses two important questions currently faced by urban managers and planners: where are the areas of greatest need for tree planting and stewardship, and how can cities maximize the benefits of newly planted and existing trees?
The analysis presented here sought to maximize the benefits of street tree plantings within the City of Joliette. The development of the planting priority index included all the indicators that were determined to be relevant by the City and the team of researchers, guided by published literature (e.g., Locke et al., 2010, 2013) and the availability of data at the local level. This analysis also provides insight into which pre-existing trees are most important to protect in order to maintain or increase the canopy cover and associated benefits. That is, areas where the need for tree planting is greatest – where those benefits are most needed – correspond to areas where the preservation of established, healthy trees, especially large old trees, should also be prioritized highest.
We believe the indicators we describe in this study are widely applicable and highly relevant within many contexts (e.g., in densely developed urban centers to suburban areas as well as in cities of varying sizes); they are, however, not the only ones. While this paper specifically addresses the City of Joliette’s priorities for tree planting, the approach can easily be adapted for use in other cities seeking to increase their urban tree canopy, and other indicators could be added to this set and weighted accordingly. Better performing variables could also replace older ones as new data become available (e.g., the number of trees and crown volumes for public and private land tenures using LiDAR data). Nevertheless, we strongly emphasize the importance of considering some of these indicators when prioritizing tree planting locations, especially diversity, which has not been considered in previous studies. In the same vein, the presence of species at risk, or a high density of older trees, are other aspects that should not be overlooked, so that trees are prioritized at locations where existing trees are in poor health or at risk of mortality to insects or blights or dying off of old age. Irrespective of this, we advocate the protection of healthy large old trees as they can provide the greatest benefits (Cavender and Donnelly, 2019).
The Planting Priority Index and Priority Maps
Our final map shows a priority tree planting index calculated for the City of Joliette based on their main objective: prioritizing tree planting locations to reduce urban heat island effects (Figure 3). The development of the index consisted of three main steps: (i) selection of indicators, (ii) weighting, and (iii) aggregation. The planting priority index was created using nine indicators [surface temperature, tree density, canopy cover, functional diversity, size of the trees, presence of species at risk (for Joliette, ash trees), land use, socioeconomic deprivation, potential for active transportation], all weighted in a way that directly reflects the priorities of the City. Building and testing different optimization scenarios (e.g., maximizing tree diversity to help build resilience into the urban forest) can help in making trade-offs and produce multi-objective optimizations that are “optimal compromises” (as shown in Supplementary Figure 2, although the outcomes of the optimizations saw little change). We also considered different single-objective optimizations scenarios (Figure 2), but we note that these single-objective optimizations do not produce any real trade-offs among the indicators.
Prescribing weights for each indicator is one of the most important aspects of calculating a priority index due to the potentially large effects of different weights on the outcome (Papathoma-Köhle et al., 2019). In this study, the City was tasked with assigning a score of importance to each indicator, but the results could be recalculated involving different actors or factors, e.g., based on citizen consultation and participation, expert opinion, or strength of scientific evidence. From the City’s standpoint, the issue of greatest importance was temperature reduction (for citizen health and safety issues), which was given a weight of 3, followed in importance by land use (to target areas of highest citizen presence first), percent canopy cover (to reach targets and achieve maximum benefits), ash trees presence (to align with city intervention that is already needed), and socioeconomic deprivation (to assure impoverished communities receive more equal services).
The choice of the classification method for map design is another key aspect as it may affect the interpretation of the results and their potential application (e.g., priority settings or funding allocation). Here, we used the Jenks natural break as our default classification method, which maximizes the similarity of numbers within classes while maximizing the variance between classes. However, it can be easily replaced by other classification methods (e.g., equal interval and quantile classification schemes). Most importantly, while this choice could result in different maps, this does not change the final tree planting priority scores, indicating where new trees could provide the most benefits, and the assumptions underlying them, which is the focus of our approach.
Strengths, Limitations and Future Directions
This work has several strengths worth noting. First, the proposed approach can be easily updated as new information and data become available (e.g., streets change as well as land use over time). Secondly, it allows for flexibility in the relative weighting of information used, in that it allows decision-makers to focus on those factors they recognized to be of key importance to achieve their goals through the increased urban tree canopy. The approach is also highly flexible in the sense that it is easily transferable to any given city as it can be adjusted to accommodate other cities’ specific goals, available data, and planning constraints, and to the datasets available. However, though criteria for determining where to plant and maintain trees can be changed as necessary to ensure that local urban tree canopy goals are met, we strongly suggest that diversity always be kept given its direct links to the benefits and uses of urban forests and trees. While no species recommendations are made, what is important is that a diversity of tree species is planted to build resilience against new pests and diseases, and climate change (Paquette et al., 2021). Thirdly, this approach can be applied at the city, neighborhood or street scale to guide targeted tree plantings, in areas where there is a need. The scale chosen will often depend on the spatial scale best suited to strategic planning and tree management arrangements at a local level (Borgström et al., 2006), which in this study was appropriate for street scale level. A careful analysis of the maps also provides insight into past decisions about where and what tree species to plant, how it has defined the present (e.g., the plight of ash trees), and the lessons that should be learned for the future (Greene and Millward, 2016).
Nevertheless, the presented study has its limitations. This analysis focused on trees planted and managed by municipalities within the public right-of-way, including streets, laneways, and sidewalks. However, the majority of the urban forest is situated on private land (Kenney, 2003), so it is advisable that privately owned land in the vicinity of high priority areas also be targeted for planting whenever possible, as well as in parks and open green spaces. As for the former, even though the trees we were interested in here are the ones in the public right-of-way, urban managers and planners can also use this approach to implement programs to support the private sectors to plant trees in places where they are needed but where the public right-of-way cannot accept more (e.g., due to a lack of space to plant). Municipalities can and should encourage voluntary tree planting on private land, for instance, by partnering with local non-profit organizations that connect with the private sector to leverage resources or using direct incentives. Another potential limitation lies in the reliance on partial tree inventories to assess species diversity, the presence of species at risk, and age statistics; complete inventories should become increasingly available in the future with the development of remote-sensing solutions. Moreover, physical attributes for different streets, such as right-of-way width and type of surface, could not be accounted for in this analysis. This could result in street segments being selected that are not suitable for planting, e.g., due to lack of space. The costs of planting trees are also not the same for all types of planting situations and, if the plantable spots have to be created (e.g., by removing concrete or asphalt pavement or by modifying or amending the soil in the planting spot), costs may significantly increase. Future work could pair this analysis with ground truth data, e.g., on the presence or absence of planting strips, soil conditions, and explicitly consider monetary and resource costs as constraints and trade-offs, including the removal of impervious surfaces to increase plantable area. In this regard, continuous updating of the datasets used to produce the map classification as new data become available is highly encouraged. Finally, the weighting of indicators can have a significant effect on the overall composite index. Using a subjective weighting method as we do here, involving stakeholders in priority setting, carries inherent bias as it requires users to decide on the contribution of each indicator to predefined objectives. However, not setting weights might not be the best option as it ignores the local stakeholders’ preferences. A future direction to address this issue could be to include a large and diverse number of stakeholders, from public, non-profit, community, and private sectors, in the selection and weighting of indicators. Panels through a Delphi approach, an iterative and anonymous participatory method used for gathering and evaluating expert-based knowledge, could be adopted as a structured method for group scoring (Linstone and Turoff, 2002).
Conclusion
This work presents a novel approach to determine where trees should be planted and cared for to maximize the benefits of street plantings as well as aiding urban planners to direct tree planting where it is needed most. Given that there is no single best approach to prioritize tree planting as each city has its own characteristics and priorities, the proposed approach provides one that is flexible and comprehensive enough to address locally relevant needs across heterogeneous metropolitan regions. The resulting priority maps are a useful visual tool for planners to make optimal decisions as it allows for a transparent and spatially explicit understanding of how the relative importance assigned to each indicator affects the decision-making process and priority setting. Like all analyses of this type, the presented research and results relied on several assumptions. In consultation with the City of Joliette, we had to make decisions about which benefits provided by trees are most important, how to weigh the importance of each benefit when combining them to generate the final tree-planting priority score, and how to represent the need for those benefits spatially as a way to communicate clearly and effectively the essential information to a non-specialist audience. There are several other goals and priorities for tree plantings that could be pursued, from enhancing air pollution removal to improving water quality and reducing the severity of flood events, using different sources of data to represent them, and changing how they are weighted. It is also hoped that this approach will spur more research to understand the full value of urban trees for their many benefits, as well as disservices (e.g., pollen-related allergies), and inspire other cities to replicate, adapt, and scale up their tree planting and maintenance strategies to create more resilient urban forests that provide diverse and sustained benefits.
Data Availability Statement
All data generated or analyzed during this study are available on request to the corresponding author.
Author Contributions
All authors listed have made a substantial, direct and intellectual contribution to the work, and approved it for publication.
Funding
This research was supported by the City of Joliette and by the Programme Climat Municipalités from the Ministère de l’Environnement et de la Lutte Contre les Changements Climatiques du Québec.
Conflict of Interest
The authors declare that the research was conducted in the absence of any commercial or financial relationships that could be construed as a potential conflict of interest.
Publisher’s Note
All claims expressed in this article are solely those of the authors and do not necessarily represent those of their affiliated organizations, or those of the publisher, the editors and the reviewers. Any product that may be evaluated in this article, or claim that may be made by its manufacturer, is not guaranteed or endorsed by the publisher.
Acknowledgments
We would like to underline the vital and enthusiastic part the City of Joliette played in this research, in particular Charles Gratton. They initially came up with the main question – where should we plant trees to maximize the benefits from our in street trees in terms of services to the public – and were actively involved at every stage of the project.
Supplementary Material
The Supplementary Material for this article can be found online at: https://www.frontiersin.org/articles/10.3389/fevo.2021.716611/full#supplementary-material
Footnotes
References
Akbari, H., and Konopacki, S. (2004). Energy effects of heat-island reduction strategies in Toronto. Canada. Energy 29, 191–210. doi: 10.1016/j.energy.2003.09.004
Akbari, H., and Konopacki, S. (2005). Calculating energy-saving potentials of heat-island reduction strategies. Energy Policy 33, 721–756. doi: 10.1016/j.enpol.2003.10.001
Barry, C. (2018). Plant a Tree: Milan’s Ambitious Plans to be Cleaner, Greener. New York, NY: Assoc. Press.
Belluau, M., Bouchard, É, Déziel, M., Mordacq, O., Messier, C., and Paquette, A. (2021). Tree Functional Trait Application Project v1. London: Figshare, doi: 10.6084/m9.figshare.14039504.v2
Bodnaruk, E. W., Kroll, C. N., Yang, Y., Hirabayashi, S., Nowak, D. J., and Endreny, T. A. (2017). Where to plant urban trees? A spatially explicit methodology to explore ecosystem service tradeoffs. Landsc. Urban Plan. 157, 457–467. doi: 10.1016/j.landurbplan.2016.08.016
Borgström, S. T., Elmqvist, T., Angelstam, P., and Alfsen-Norodom, C. (2006). Scale mismatches in management of urban landscapes. Ecol. Soc. 11:16. doi: 10.5751/ES-01819-110216
Boulfroy, E., Khaldoune, J., Grenon, F., Fournier, R., and Talbot, B. (2013). Conservation des Îlots de Fraîcheur Urbains - Description de la Méthode Suivie Pour Identifier et Localiser Les Îlots de Fraîcheur et de Chaleur (Méthode en 9 Niveaux). Rapport 2012-11 c. Available online at: http://cerfo.qc.ca/conservation-des-ilots-de-fraicheur-urbains-description-de-la-methode-suivie-pour-identifier-et-localiser-les-ilots-de-fraicheur-et-de-chaleur-methode-en-9-niveaux-rapport-2012-11-c-40-pages/ (accessed May 15, 2021).
Bulkeley, H., and Betsill, M. (2003). Cities and Climate Change: Urban Sustainability and Global Environmental Governance. London: Routledge.
Cavender, N., and Donnelly, G. (2019). Intersecting urban forestry and botanical gardens to address big challenges for healthier trees, people, and cities. Plants People Planet 1, 315–322. doi: 10.1002/ppp3.38
City of Toronto (2013). City of Toronto Strategic Forest Management Plan. Available online at: https://www.toronto.ca/city-government/accountability-operations-customer-service/long-term-vision-plans-and-strategies/strategic-forest-management-plan/ (accessed June 8, 2020).
City of Vancouver (2014). City of Vancouver Urban Forest Strategy. Available online at: https://vancouver.ca/home-property-development/urban-forest-strategy.aspx (accessed December 4, 2019).
Cook, I. R., and Swyngedouw, E. (2012). Cities, social cohesion and the environment: towards a future research agenda. Urban Stud. 49, 1959–1979. doi: 10.1177/0042098012444887
Dai, D. (2011). Racial/ethnic and socioeconomic disparities in urban green space accessibility: where to intervene? Landsc. Urban Plan. 102, 234–244. doi: 10.1016/j.landurbplan.2011.05.002
Dodman, D. (2009). Blaming cities for climate change? An analysis of urban greenhouse gas emissions inventories. Environ. Urban 21, 185–201. doi: 10.1177/0956247809103016
Estrada, F., Botzen, W. J. W., and Tol, R. S. J. (2017). A global economic assessment of city policies to reduce climate change impacts. Nat. Clim. Chang. 7, 403–406. doi: 10.1038/nclimate3301
Greene, C. S., and Millward, A. A. (2016). The legacy of past tree planting decisions for a city confronting emerald ash borer (Agrilus planipennis) invasion. Front. Ecol. Evol. 4:27. doi: 10.3389/fevo.2016.00027
Greene, C. S., Robinson, P. J., and Millward, A. A. (2018). Canopy of advantage: who benefits most from city trees? J. Environ. Manag. 208, 24–35. doi: 10.1016/j.jenvman.2017.12.015
Griscom, B. W., Adams, J., Ellis, P. W., Houghton, R. A., Lomax, G., Miteva, D. A., et al. (2017). Natural climate solutions. Proc. Natl. Acad. Sci. U.S.A. 114, 11645–11650. doi: 10.1073/pnas.1710465114
Gunawardena, K. R., Wells, M. J., and Kershaw, T. (2017). Utilising green and bluespace to mitigate urban heat island intensity. Sci. Total Environ. 584–585, 1040–1055. doi: 10.1016/j.scitotenv.2017.01.158
Hale, J. D., Pugh, T. A. M., Sadler, J. P., Boyko, C. T., Brown, J., Caputo, S., et al. (2015). Delivering a multi-functional and resilient urban forest. Sustainability 7, 4600–4624. doi: 10.3390/su7044600
Harlan, S. L., and Ruddell, D. M. (2011). Climate change and health in cities: impacts of heat and air pollution and potential co-benefits from mitigation and adaptation. Curr. Opin. Environ. Sustain. 3, 126–134. doi: 10.1016/j.cosust.2011.01.001
Heaviside, C., Macintyre, H., and Vardoulakis, S. (2017). The urban heat island: implications for health in a changing environment. Curr. Environ. Heal. Rep. 4, 296–305. doi: 10.1007/s40572-017-0150-3
Hill, M. O. (1973). Diversity and evenness: a unifying notation and its consequences. Ecology 54, 427–432. doi: 10.2307/1934352
Hongoh, V., Hoen, A. G., Aenishaenslin, C., Waaub, J. P., Bélanger, D., and Michel, P. (2011). Spatially explicit multi-criteria decision analysis for managing vector-borne diseases. Int. J. Health Geogr. 10:70. doi: 10.1186/1476-072X-10-70
INSPQ (2012). Ilots de Chaleur/Fraicheur Urbains et Température de Surface 2012. Jeux Données. Available online at: https://www.donneesquebec.ca/recherche/dataset/ilots-de-chaleur-fraicheur-urbains-et-temperature-de-surface (accessed March 24, 2020).
INSPQ (2016). Deprivation Index, Canada, 2016. Available online at: https://www.inspq.qc.ca/en/expertise/information-management-and-analysis/deprivation-index/deprivation-index-canada-2016 (accessed March 25, 2020).
Jost, L. (2007). Partitioning diversity into independent alpha and beta components. Ecology 88, 2427–2439. doi: 10.1890/06-1736.1
Kardan, O., Gozdyra, P., Misic, B., Moola, F., Palmer, L. J., Paus, T., et al. (2015). Neighborhood greenspace and health in a large urban center. Sci. Rep. 5:11610. doi: 10.1038/srep11610
Kenney, W. A. (2003). A strategy for Canada’s urban forests. For. Chron. 79, 785–789. doi: 10.5558/tfc79785-4
Laaidi, K., Zeghnoun, A., Dousset, B., Bretin, P., Vandentorren, S., Giraudet, E., et al. (2012). The impact of heat islands on mortality in Paris during the August 2003 heat wave. Environ. Health Perspect. 120, 254–259. doi: 10.1289/ehp.1103532
Landry, F., Dupras, J., and Messier, C. (2020). Convergence of urban forest and socio-economic indicators of resilience: a study of environmental inequality in four major cities in eastern Canada. Landsc. Urban Plan 202:103856. doi: 10.1016/j.landurbplan.2020.103856
Lin, J. (2020). Developing a composite indicator to prioritize tree planting and protection locations. Sci. Total Environ. 717:137269. doi: 10.1016/j.scitotenv.2020.137269
Lindén, L., Riikonen, A., Setälä, H., and Yli-Pelkonen, V. (2020). Quantifying carbon stocks in urban parks under cold climate conditions. Urban For. Urban Green. 49:126633. doi: 10.1016/j.ufug.2020.126633
Linstone, H. A., and Turoff, M. (2002). The Delphi Method: Technology and Applications. 616. Available online at: https://web.njit.edu/turoff/pubs/delphibook/delphibook.pdf (accessed May 16, 2021).
Liu, C., Che, S., and Shen, G. (2004). Urban Forestry in China: Status and Prospects. UA-Magazine. 15–17. Available online at: https://www.researchgate.net/publication/288351110 (accessed December 4, 2019).
Locke, D. H., Grove, J. M., Galvin, M., O’Neil-Dunne, J. P. M., and Murphy, C. (2013). Applications of urban tree canopy assessment and prioritization tools: supporting collaborative decision making to achieve urban sustainability goals. Cities Environ. 6:7. doi: 10.1007/s10772-018-9516-7
Locke, D. H., Grove, J. M., Lu, J. W. T., Troy, A., O’Niel-Dunne, J. P. M., and Beck, B. D. (2010). Prioritizing preferable locations for increasing urban tree canopy in New York City. Cities Environ. 3, 1–18. doi: 10.15365/cate.3142010
Lusk, A. C., da Silva Filho, D. F., and Dobbert, L. (2018). Pedestrian and cyclist preferences for tree locations by sidewalks and cycle tracks and associated benefits: worldwide implications from a study in Boston, MA. Cities 106:102111. doi: 10.1016/j.cities.2018.06.024
MacNaughton, P., Melly, S., Vallarino, J., Adamkiewicz, G., and Spengler, J. D. (2014). Impact of bicycle route type on exposure to traffic-related air pollution. Sci. Total Environ. 490, 37–43. doi: 10.1016/j.scitotenv.2014.04.111
Madlener, R., and Sunak, Y. (2011). Impacts of urbanization on urban structures and energy demand: what can we learn for urban energy planning and urbanization management? Sustain. Cities Soc. 1, 45–53. doi: 10.1016/j.scs.2010.08.006
McPherson, E. G. (2014). Monitoring million trees LA: tree performance during the early years and future benefits. Arboric. Urban For. 40, 286–301.
McPherson, E. G., van Doorn, N., and de Goede, J. (2016). Structure, function and value of street trees in California. USA. Urban For. Urban Green. 17, 104–115. doi: 10.1016/j.ufug.2016.03.013
McPherson, G., Simpson, J. R., Peper, P. J., Maco, S. E., and Xiao, Q. (2005). Municipal forest benefits and costs in five US cities. J. For. 103, 411–416. doi: 10.1093/jof/103.8.411
Mohajerani, A., Bakaric, J., and Jeffrey-Bailey, T. (2017). The urban heat island effect, its causes, and mitigation, with reference to the thermal properties of asphalt concrete. J. Environ. Manag. 197, 522–538. doi: 10.1016/j.jenvman.2017.03.095
Moore, M., Gould, P., and Keary, B. S. (2003). Global urbanization and impact on health. Int. J. Hyg. Environ. Health 206, 269–278. doi: 10.1078/1438-4639-00223
Morani, A., Nowak, D. J., Hirabayashi, S., and Calfapietra, C. (2011). How to select the best tree planting locations to enhance air pollution removal in the MillionTreesNYC initiative. Environ. Pollut. 159, 1040–1047. doi: 10.1016/j.envpol.2010.11.022
Natural Resources Canada (2020). Minister O’Regan Launches Canada’s Plan to Plant Two Billion Trees. Gov. Canada. Available online at: https://web.archive.org/web/20210514203736/https://www.canada.ca/en/natural-resources-canada/news/2020/12/minister-oregan-launches-canadas-plan-to-plant-two-billion-trees.html (accessed July 27, 2021).
Nesbitt, L., Meitner, M. J., Girling, C., Sheppard, S. R. J., and Lu, Y. (2019). Who has access to urban vegetation? A spatial analysis of distributional green equity in 10 US cities. Landsc. Urban Plan. 181, 51–79. doi: 10.1016/j.landurbplan.2018.08.007
New York Restoration Project (2020). NYC Just Planted 1 Million Trees. Here’s How We Did It. Available online at: https://www.nyrp.org/blog/nyc-just-planted-1-million-trees-heres-how-we-did-it (accessed June 8, 2020).
Nowak, D. J., Hirabayashi, S., Doyle, M., McGovern, M., and Pasher, J. (2018). Air pollution removal by urban forests in Canada and its effect on air quality and human health. Urban For. Urban Green. 29, 40–48. doi: 10.1016/j.ufug.2017.10.019
Ordóñez, C., Bush, J., Hurley, J., Amati, M., and Livesley, S. (2019). “How can local governments retain and plant trees on private lands—a primer,” in The Nature of Cities. Available online at: https://www.thenatureofcities.com/2019/05/30/how-can-local-governments-retain-and-plant-trees-on-private-lands-a-primer/ (accessed March 24, 2020).
O’Sullivan, O. S., Holt, A. R., Warren, P. H., and Evans, K. L. (2017). Optimising UK urban road verge contributions to biodiversity and ecosystem services with cost-effective management. J. Environ. Manag. 191, 162–171. doi: 10.1016/j.jenvman.2016.12.062
Papathoma-Köhle, M., Schlögl, M., and Fuchs, S. (2019). Vulnerability indicators for natural hazards: an innovative selection and weighting approach. Sci. Rep. 9, 1–14. doi: 10.1038/s41598-019-50257-2
Paquette, A., Sousa-Silva, R., Maure, F., Cameron, E., Belluau, M., and Messier, C. (2021). Praise for diversity: a functional approach to reduce risks in urban forests. Urban For. Urban Green. 62:127157. doi: 10.1016/j.ufug.2021.127157
Pataki, D. E., Alberti, M., Cadenasso, M. L., Felson, A. J., McDonnell, M. J., Pincetl, S., et al. (2021). The benefits and limits of urban tree planting for environmental and human health. Front. Ecol. Evol. 9:603757. doi: 10.3389/fevo.2021.603757
Peckham, S. C., Duinker, P. N., and Ordóñez, C. (2013). Urban forest values in canada: views of citizens in calgary and halifax. Urban For. Urban Green. 12, 154–162. doi: 10.1016/j.ufug.2013.01.001
Pincetl, S., Gillespie, T., Pataki, D. E., Saatchi, S., and Saphores, J. D. (2013). Urban tree planting programs, function or fashion? Los Angeles and urban tree planting campaigns. GeoJournal 78, 475–493. doi: 10.1007/s10708-012-9446-x
Poland, T. M., and McCullough, D. G. (2006). Emerald ash borer: invasion of the urban forest and the threat to North America’s ash resource. J. For. 104, 118–124. doi: 10.1093/jof/104.3.118
Raciti, S., Galvin, M. F., Grove, J. M., O’Neil-Dunne, J. P. M., Todd, A., and Clagett, S. (2006). Urban Tree Canopy Goal Setting: A Guide for Chesapeake Bay Communities. Available online at: https://www.chesapeakebay.net/documents/UTC_Guide_Final.pdf (accessed May 14, 2021).
Raupp, M. J., Cumming, A. B., and Raupp, E. C. (2006). Street tree diversity in eastern North America and its potential for tree loss to exotic borers. Arboric. Urban For. 32, 297–304.
Revi, A., Satterthwaite, D., Aragón-Durand, F., Corfee-Morlot, J., Kiunsi, R. B. R., Pelling, M., et al. (2014). Towards transformative adaptation in cities: the IPCC’s Fifth Assessment. Environ. Urban. 26, 11–28. doi: 10.1177/0956247814523539
Ripple, W. J., Wolf, C., Newsome, T. M., Barnard, P., and Moomaw, W. R. (2019). World Scientists’ warning of a climate emergency. Bioscience 2000, 1–20. doi: 10.1093/biosci/biz088
Roy, S., Byrne, J., and Pickering, C. (2012). A systematic quantitative review of urban tree benefits, costs, and assessment methods across cities in different climatic zones. Urban For. Urban Green. 11, 351–363. doi: 10.1016/j.ufug.2012.06.006
Salmond, J. A., Tadaki, M., Vardoulakis, S., Arbuthnott, K., Coutts, A., Demuzere, M., et al. (2016). Health and climate related ecosystem services provided by street trees in the urban environment. Environ. Heal. A Glob. Access Sci. Source 15:S36. doi: 10.1186/s12940-016-0103-6
Satterthwaite, D. (2008). Cities’ contribution to global warming: notes on the allocation of greenhouse gas emissions. Environ. Urban 20, 539–549. doi: 10.1177/0956247808096127
Schell, C. J., Dyson, K., Fuentes, T. L., Des Roches, S., Harris, N. C., Miller, D. S., et al. (2020). The ecological and evolutionary consequences of systemic racism in urban environments. Science 369:eaay4497. doi: 10.1126/SCIENCE.AAY4497
Song, X. P., Tan, P. Y., Edwards, P., and Richards, D. (2018). The economic benefits and costs of trees in urban forest stewardship: a systematic review. Urban For. Urban Green. 29, 162–170. doi: 10.1016/j.ufug.2017.11.017
Statistics Canada (2016). Joliette Census Profile. 2016 Census Data. Available online at: https://www12.statcan.gc.ca/census-recensement/2016/dp-pd/prof/details/page.cfm?Lang=E&Geo1=CSD&Code1=2461025&Geo2=CD&Code2=2461&SearchText=Joliette&SearchType=Begins&SearchPR=01&B1=All&TABID=1&type=0 (accessed March 11, 2020).
Strange, I. (2018). “Urban Planning and city futures: planning for cities in the twenty-first century,” in Smart Futures, Challenges of Urbanisation, and Social Sustainability, eds M. Dastbaz, W. Naudé, and J. Manoochehri (Cham: Springer), doi: 10.1007/978-3-319-74549-7_2
Sæbø, A., Benedikz, T., and Randrup, T. B. (2003). Selection of trees for urban forestry in the Nordic countries. Urban For. Urban Green. 2, 101–114. doi: 10.1078/1618-8667-00027
Troy, A. R., Grove, J. M., O’Neil-Dunne, J. P. M., Pickett, S. T. A., and Cadenasso, M. L. (2007). Predicting opportunities for greening and patterns of vegetation on private urban lands. Environ. Manage. 40, 394–412. doi: 10.1007/s00267-006-0112-2
Tyrväinen, L., Pauleit, S., Seeland, K., and De Vries, S. (2005). “Benefits and uses of urban forests and trees,” in Urban Forests and Trees: A Reference Book, eds C. C. Konijnendijk, K. Nilsson, T. B. Randrup, and J. Schipperijn (Berlin: Springer), 81–114. doi: 10.1007/3-540-27684-X_5
United Nations (2019). World Urbanization Prospects: The 2018 Revision. New York, NY: United Nations.
Ville de Montréal (2016). Sustainable Montréal 2016-2020 Plan. Together for a Sustainable Metropolis. Available online at: http://ville.montreal.qc.ca/pls/portal/docs/page/d_durable_en/media/documents/plan_de_dd_en_lr.pdf (accessed December 16, 2019).
Ville de Montréal (2021). Arbres Publics sur le Territoire de la Ville - Inventaire Arbres Publics. Jeux données. Available online at: http://donnees.ville.montreal.qc.ca/dataset/arbres/resource/c6c5afe8-10be-4539-8eae-93918ea9866e (accessed May 15, 2021).
Violle, C., Navas, M. L., Vile, D., Kazakou, E., Fortunel, C., Hummel, I., et al. (2007). Let the concept of trait be functional! Oikos 116, 882–892. doi: 10.1111/j.0030-1299.2007.15559.x
Vogt, J., Hauer, R., and Fischer, B. C. (2015). The costs of maintaining and not maintaining the urban forest: a review of the urban forestry and arboriculture literature. Arboric. Urban For. 41, 293–323.
Wolch, J. R., Byrne, J., and Newell, J. P. (2014). Urban green space, public health, and environmental justice: the challenge of making cities “just green enough.”. Landsc. Urban Plan. 125, 234–244. doi: 10.1016/j.landurbplan.2014.01.017
Keywords: urban trees, urban forest planning, priority planting, ecosystem services, resilience
Citation: Sousa-Silva R, Cameron E and Paquette A (2021) Prioritizing Street Tree Planting Locations to Increase Benefits for All Citizens: Experience From Joliette, Canada. Front. Ecol. Evol. 9:716611. doi: 10.3389/fevo.2021.716611
Received: 28 May 2021; Accepted: 31 August 2021;
Published: 23 September 2021.
Edited by:
James W. N. Steenberg, Nova Scotia Department of Natural Resources, CanadaReviewed by:
Kaitlyn Pike, University of British Columbia, CanadaPeter N. Duinker, Dalhousie University, Canada
Copyright © 2021 Sousa-Silva, Cameron and Paquette. This is an open-access article distributed under the terms of the Creative Commons Attribution License (CC BY). The use, distribution or reproduction in other forums is permitted, provided the original author(s) and the copyright owner(s) are credited and that the original publication in this journal is cited, in accordance with accepted academic practice. No use, distribution or reproduction is permitted which does not comply with these terms.
*Correspondence: Rita Sousa-Silva, silva.as.rita@gmail.com