Soil Phosphorus Translocation via Preferential Flow Pathways: A Comparison of Two Sites With Different Phosphorus Stocks
 Vera Makowski
 Stefan Julich
 Karl-Heinz Feger
 Dorit Julich
- Institute of Soil Science and Site Ecology, Technische Universität Dresden, Tharandt, Germany
Weather events where a dry period is followed by a heavy rainfall event appear to affect phosphorus (P) exports through preferential flow pathways from forest soils. Export rates also depend on the P stocks. To explore this, we installed zero-tension lysimeters in three trenches at two sites with contrasting soil P stocks. Lysimeters were installed in three different depths (topsoil, subsoil and deep subsoil) to explore P depth transport. We covered the forest floor above the lysimeters with tarpaulins to simulate a dry period and afterward artificially irrigated the area. This experiment was repeated three times at each site. Lysimeter samples were analyzed for concentrations of total P, organic and inorganic dissolved P and particle bound P (>0.45 μm). Loads of P and flow rates were calculated. Results reveal clear differences between sites, individual events and soil depths. At both sites, concentrations and loads of P in the topsoil lysimeters were higher than those in the subsoil. This difference was most evident at the low P site and underlines its efficiency of recycling nutrients. Dissolved inorganic P showed marked peaks in the topsoil lysimeters, whereby in the subsoil, particle-bound P peaks were partly noticeable at both sites. Depth transport of P into the subsoil depended on initial soil moisture, texture and the spatial distribution of flow pathways. Further, we observed large heterogeneity within a single site, dependent on profile-specific characteristics of the distribution of P, flow pathways and microbial biomass. We conclude that under certain conditions, there is a depth transport of P into the subsoil and therefore a potential of P exports, especially for particle-bound P. Small-scale heterogeneity hampers the clear identification of influences and illustrates the need for further research regarding soil heterogeneity.
Introduction
Phosphorus (P) is an essential nutrient for all organisms. In terrestrial ecosystems, research on P mainly focused on cultivated soils (Heckrath et al., 1995; Withers et al., 2001; Damon et al., 2014). Here, fertilizing and manure application are the main factors for P import (Linderholm et al., 2012). Exports are driven by soil erosion on the surface, subsurface leaching and tile drains (Sims et al., 1998; Turner and Haygarth, 2000). Meanwhile, P budgets in forest soils were assumed to be balanced under natural conditions (e.g., Wood et al., 1984). Exports were attributed to soil erosion after clear cutting (e.g., Likens et al., 1970) and therefore preventable by management. Imports of P are driven by atmospheric deposition (of P-rich dust) and mineral weathering (Newman, 1995). Therefore, imports depend on the abundance of P-containing minerals in deposits and parent material. Based on that, it was hypothesized that P exports under natural conditions in forest ecosystems depend on their soil P status, i.e., total amount and availability/mobility (Lang et al., 2016). The smaller the soil P stock, the tighter the P cycling in a forest ecosystem and therefore the smaller the leaching loss (“recycling system”). Consequently, Lang et al. (2017) connected soil P stocks along a geometric sequence with different nutrition strategies of beech (Fagus sylvatica L.) ecosystems and confirmed their previous hypothesis. Furthermore, connections between soil P status and various influencing factors on the forest P cycle were investigated. For example, Spohn et al. (2018) found differences in P uptake by plants or microbes, depending on season and P stock of the soil at a given site. Hauenstein et al. (2018) illustrated the increasing importance of organic layers and their ability to prevent P leaching with decreasing site P status. Moreover, an increased P mobilization of microbial associated P after drying-rewetting cycles, resulting in the subsequent increased risk of P depletion, especially of sites with already low P stocks, was observed (Brödlin et al., 2019). The above-mentioned studies mainly focused on organic layers and the mineral topsoil. Research on the mineral subsoil of forests often focused on the dissolved organic P fractions (Qualls et al., 2000; Kaiser et al., 2003). A site-specific depth transport of dissolved organic P in the soil solution of forest soils could be observed by Kaiser et al. (2003). Additionally, they found peaks of dissolved organic P during rainfall events after dry periods. Recent studies found elevated amounts of P in forest streams during heavy rainfall events, compared to base flow conditions (Benning et al., 2012; Julich S. et al., 2017). Julich S. et al. (2017) quantified these amounts with up to 12 g ha–1 per event, which accounts for up to 19% of the annual flux. These peaks seem to be more pronounced during rainfall events following a dry period and thereby are in line with the findings of Kaiser et al. (2003) and Brödlin et al. (2019). The drying of the soil and its subsequent rewetting can result in the formation of preferential flow (Jarvis, 2007; Guo and Lin, 2018). Through such preferential flow pathways (PFP), nutrients including P can quickly be transported into the subsoil without passing the sorbing soil matrix (Makowski et al., 2020). Consequently, a dry period followed by a heavy rainfall event seem to be important for soil P exports. Most research on P balances in forest soils has focused on moisture conditions mainly influenced by slow matrix flow (e.g., Ilg et al., 2009). For the collection of preferential flow, which is supposed to predominantly translocate P through forest soils, zero-tension lysimeters can be used (Allaire et al., 2009; Peters and Durner, 2009). Advantages and limitations of this approach were discussed elsewhere (e.g., Zhu et al., 2002; Barzegar et al., 2004); their applicability with regard to quantifying P transport via preferential flow in forest soils was tested in a pre-testing study by Makowski et al. (2020). The filling with coarse material prevents matrix flow from entering the lysimeter and therefore they only sample preferential flow. Further, the filling ensures tight contact to the soil above, prevents it from collapsing and increases the collection efficiency (Radulovich and Sollins, 1987). Additionally, zero-tension lysimeters are able to collect particle-associated P, which is often (partly) excluded by other sampling methods (e.g., suction cups) by their fine pores (Grossmann and Udluft, 1991). However, these colloids are important carriers for soil P, including subsoil P (Missong et al., 2017). Therefore, the aim of our study was to investigate the translocation of dissolved and particle-bound P through preferential flow pathways into the subsoil. We tested to what extent at sites with differing soil P stock significant differences in P subsoil transport occur. Thus, we hypothesize that (i) relevant loads of P are translocated into the subsoil via preferential flow pathways, and (ii) at the P-poor site, a lower amount of P is translocated into the subsoil as compared to the P-rich site.
Materials and Methods
Site Description
The experiments were conducted at two sites in Germany, Mitterfels with a high soil P status (678 g m–2 soil P) and Lüss with a low soil P status (164 g m–2 soil P). Mitterfels (hereafter called “high P site”) is a mountainous region located in the Bavarian Forest in SE Germany. The soil is a Dystric Cambisol (WRB, 2015) developed on a paragneiss. Gravel, stones and boulders mainly appeared from 20 to 30 cm soil depth and below. Their size and distribution varied strongly between replicates. Lüss (hereafter called “low P site”) is located in the North German lowlands. The soil is also a Dystric Cambisol, which was formed from a glacial sandy till. The till layers cause marked differences in soil physical conditions, i.e., texture ranging from silt to gravel and stones, with a high variety within a single profile. Both sites are covered with 130-year-old beeches (Fagus sylvatica L.). Further site information is listed in Table 1, profile information in Table 2.
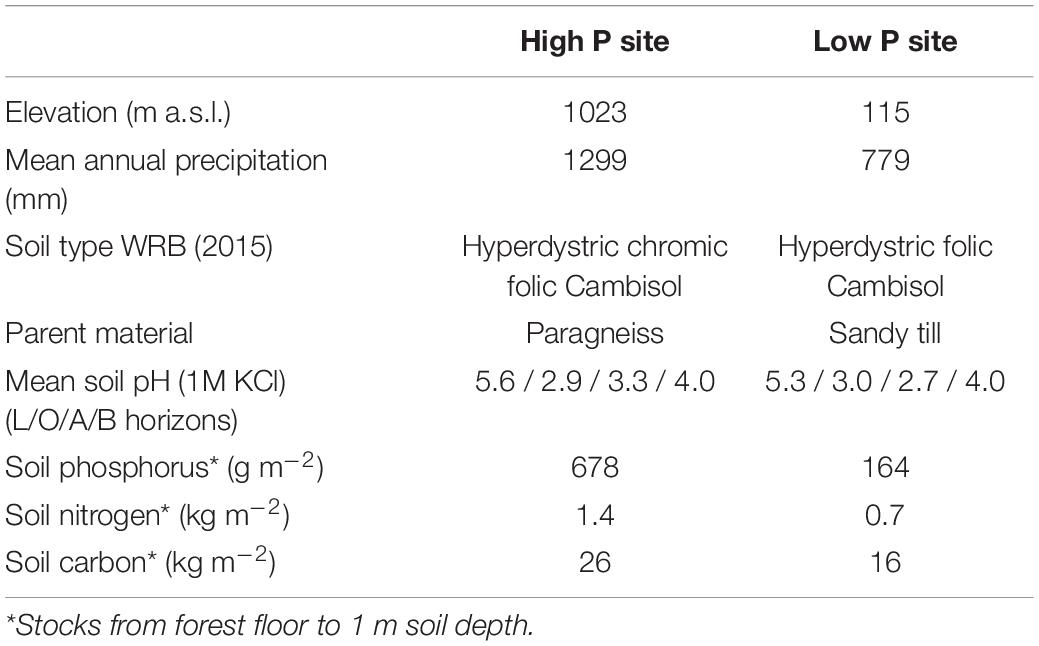
Table 1. Site characteristics of the study sites Mitterfels (high P site) and Lüss (low P site), according to Lang et al. (2017).
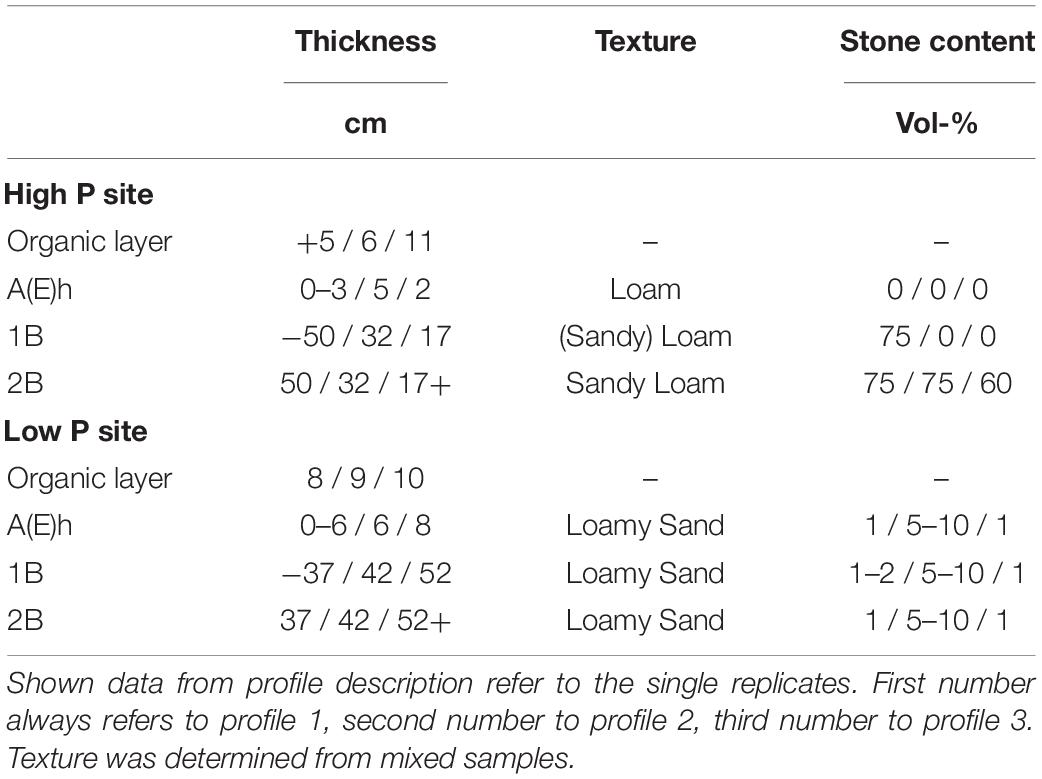
Table 2. Soil properties of the two study sites Mitterfels (high P site) and Lüss (low P site).
Experimental Setup
At each site, three trenches with a minimum length of 2.5 m and a depth of 1 m were dug. The trenches served as replicates to cope with small-scale site variability. All plots possessed the same site-specific properties of tree age and parent material and are located near each other according to the experimental design of the whole research program (DFG priority programme SPP 1685 “Ecosystem Nutrition: Forest strategies for limited Phosphorus Resources”).
In each trench, three zero-tension pan lysimeters were installed next to each other. The lysimeters made from polyethylene (Singh et al., 2017) had a size of 50−40 cm. A 4–5 cm rim ensured a slope within the lysimeter and promoted water flow toward the outlet in the corner with the 5-cm rim (Jemison and Fox, 1992). Additionally, the rim prevented outflow of sampled water. For a good connection to the overlying soil and to create a capillary barrier preventing matrix flow sampling, the lysimeters were filled with coarse, pre-cleaned quartz sand (>200 μm). A schematic setup and a picture of a built-in sampler are given in Makowski et al. (2020). The upper lysimeters were located at 12–16 cm depth. Middle lysimeters were installed in 35–40 cm depth. The lower lysimeters were installed in the lower subsoil, in depths between 70 and 100 cm depending on profile depth and stone content (Table 3). Due to the high stone content at one of the replicates at the high P site, only the upper lysimeter (beneath the A-horizon) and a second lysimeter at a depth of 20 cm were installed in this trench.
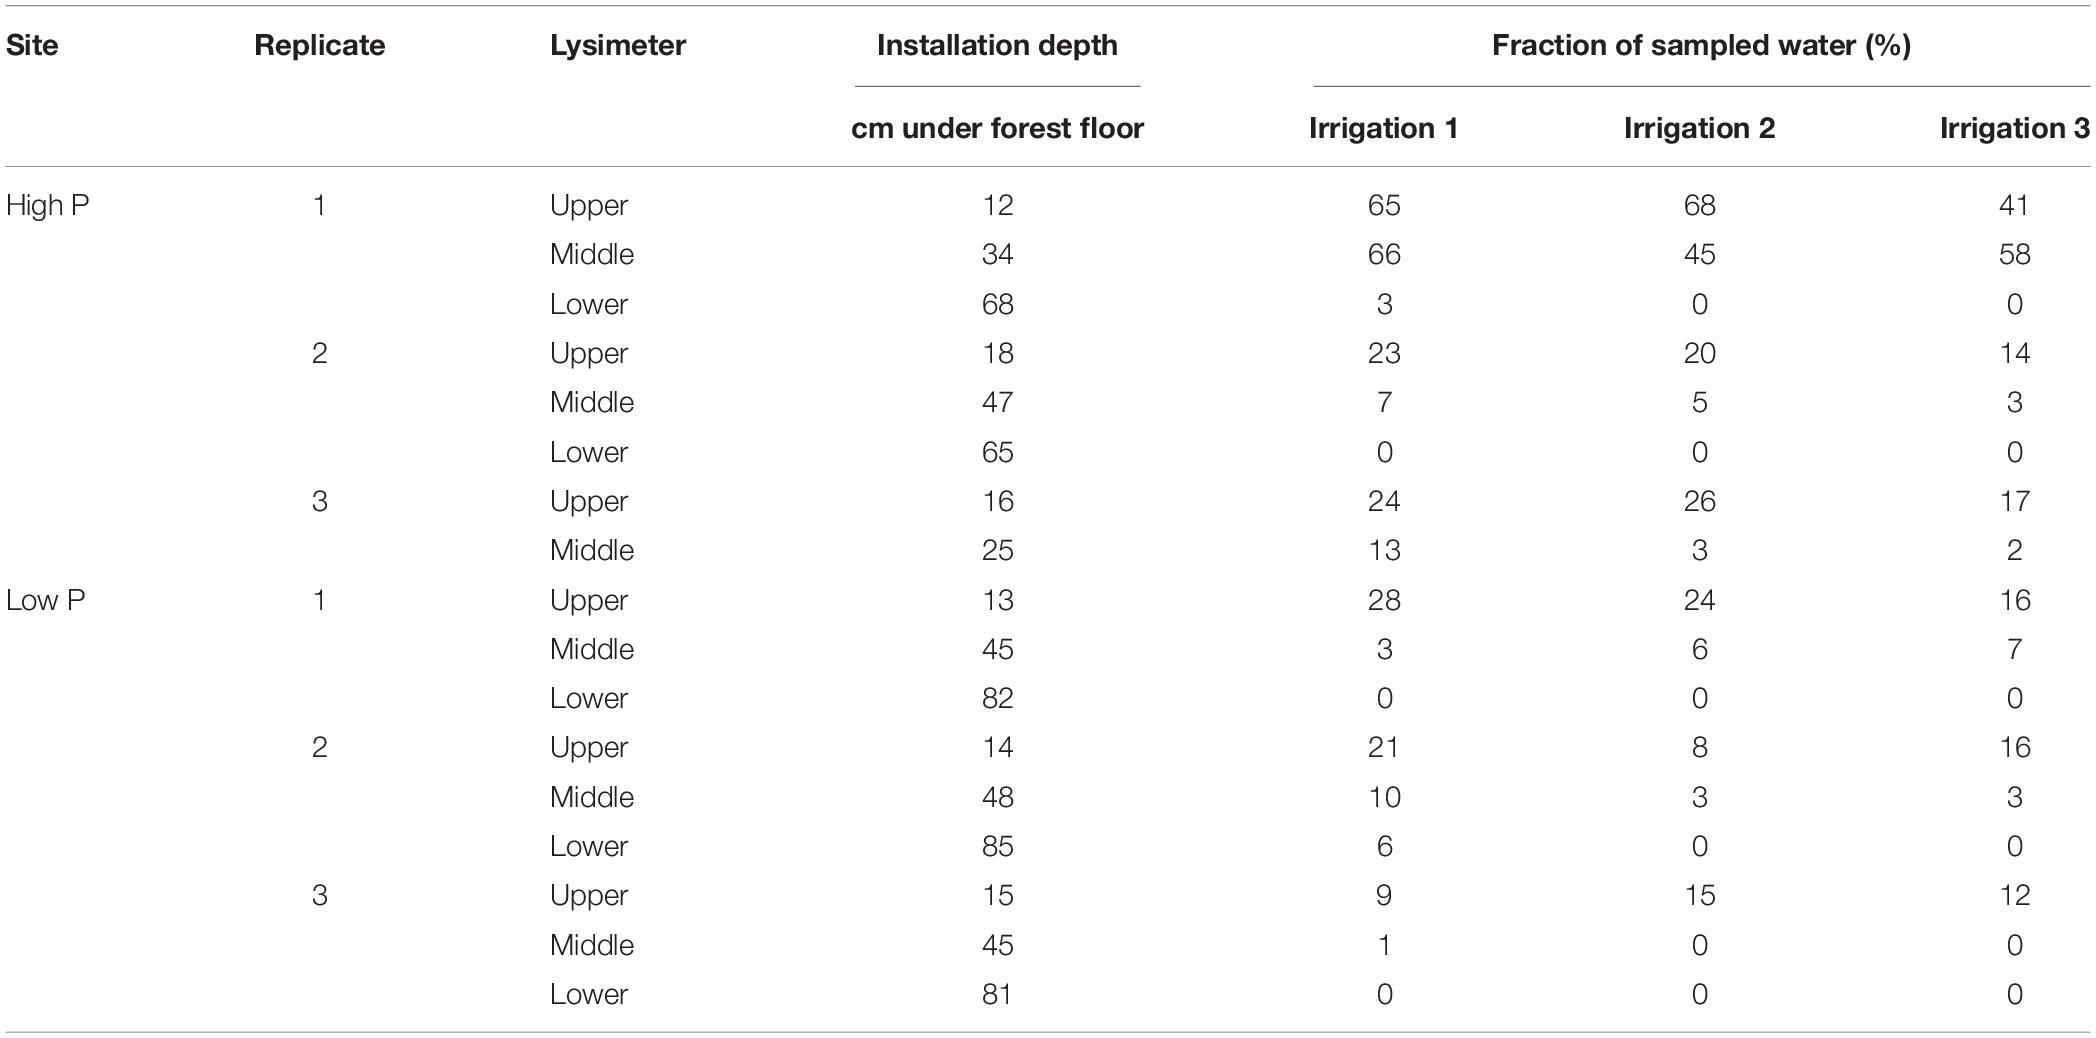
Table 3. Installation depths and the fraction of sampled water of the lysimeters at the high P and low P site.
After lysimeter installation, each sampler was connected to an outlet to collect preferential flow water. Soil above the lysimeters was covered with a tarpaulin to simulate a dry period. The lysimeter plots were left to settle and dry. After 4 weeks, soil moisture was determined with a TDR probe (Trime-Pico 32, IMKO, Ettlingen, Germany) (Table 4). Measurements were taken at the topsoil, around 10 cm below forest floor and additionally from left and right of every lysimeter. Subsequently, we simulated a large rainfall event with a rainfall intensity of 20 L m–2 h–1. Event duration was 4 h, thus in total, 80 L m–2 were irrigated with watering cans. The water was evenly applied over the irrigation course and the above-sampler area. The sampled water was collected in polypropylene bottles which were pre-rinsed with distilled water. The bottles were changed every 500 mL and the elapsed time since beginning of the irrigation recorded. To prevent microbial growth, the samples were stored in cooling boxes. At the end of the day, samples were brought to a refrigeration cell and stored at 5°C. In total, three cycles of drying and rewetting were simulated at each site. Irrigation 1 was conducted in May 2018, irrigations 2 and 3 in September and October 2018, respectively. Due to the seasonal differences, irrigations were not treated as replicates.
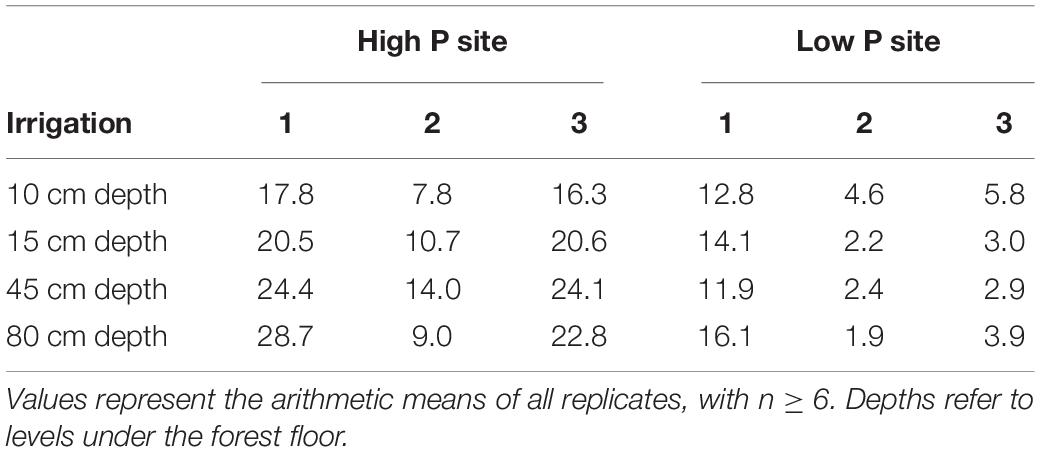
Table 4. Volumetric soil moisture in %, measured with TDR probe directly before irrigations.
Laboratory Work
The volume of all water samples was determined gravimetrically and their pH value and electric conductivity were measured (S20 SevenEasy pH, Mettler Toledo, Gießen, Germany). Total phosphorus (TP) was determined by adding 200 μL of 9 M H2SO4 and 4 mL K2(SO4)2 to 40 mL of the unfiltered sample. The solution was heated in an autoclave for 45 min at 121°C and after cooling, the samples were measured in a spectrophotometer (UV-Mini 1240, Shimadzu Deutschland GmbH, Duisburg, Germany) using the molybdenum-blue method as described in ISO 6878:2004-05 (International Organization for Standardization, 2002, 2004). For determination of the dissolved fractions, the samples were filtered through a 0.45 μm cellulose acetate filter. Total dissolved phosphorus (TDP) was measured as described for TP. Dissolved inorganic phosphorus (DIP) was defined as dissolved molybdate-reactive P and analyzed photometrically within filtrates (UV-Mini 1240, Shimadzu Deutschland GmbH, Duisburg, Germany). Dissolved organic phosphorus (DOP) was calculated by subtracting DIP from TDP. By method, DOP is defined as organic P smaller than 0.45 μm. Particle-bound P (PP) was defined as the difference between TP and TDP. Values below the detection limit (DL) were further proceeded with half of the DL.
Calculations and Statistics
Water flow rates were calculated by dividing the collected sample volume by the lysimeter area (0.2 m2) and collection time. The fraction of sampled water for each lysimeter was calculated with the amount of sampled water as a percentage share of irrigated water amounts. Multiplying measured P concentrations with the amount of collected water of each sample results in the P loads. Summing all loads of one lysimeter for one respective irrigation results in the total (cumulative) P load. Sampling times and number of samples were different for every profile, therefore results on concentrations were split into five time steps, one for each hour of irrigation and one for samples taken after the irrigation process was finished (240 to maximal 420 min after irrigation start). The concentrations and flow rates of the three replicates per site were averaged for every time step, resulting in the mean concentrations and time steps per site. For each site, standard deviations and coefficients of variation were calculated from the mean cumulative loads of every irrigation event (see Table 5 and respective figures). Differences between sites were tested with an unpaired Wilcoxon test on the respective TP loads per lysimeter. Unpaired Wilcoxon tests were performed with RStudio Version 1.2.1335, based on R Version 3.6.1. The ratios of TP load to the TP stock in the soil were calculated. For this, the soil stock up to the respective lysimeter installation depth was taken into account. Soil stock data was taken from Lang et al. (2017).
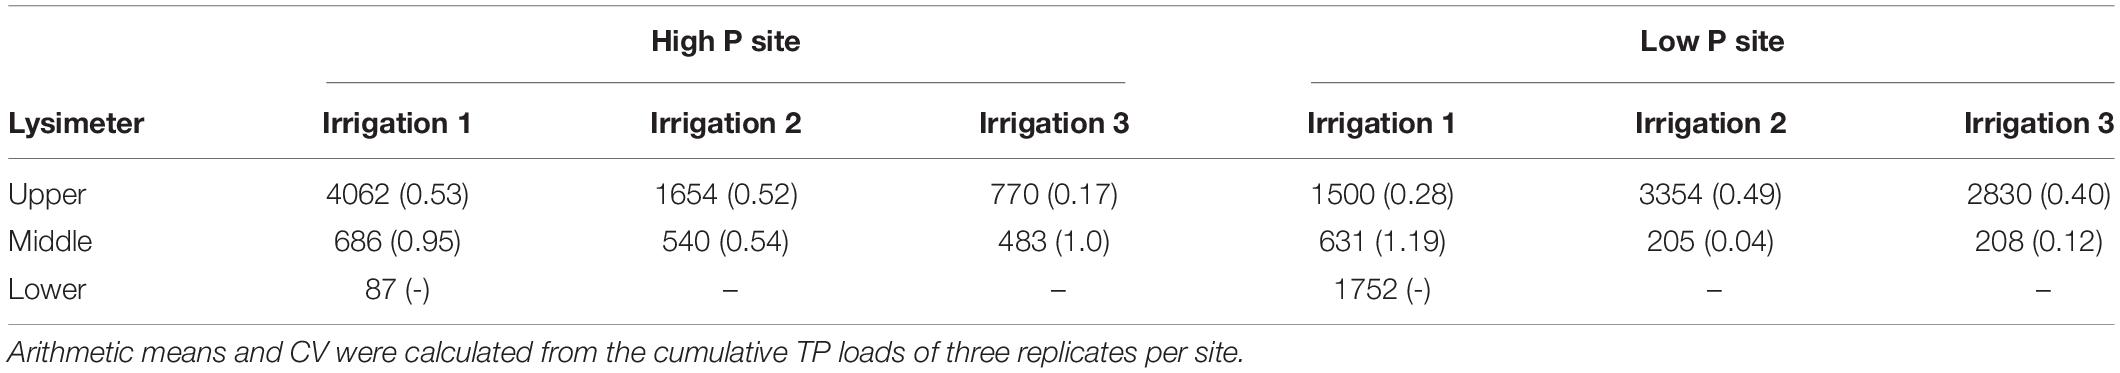
Table 5. Mean cumulative TP loads (in μg m–2) per irrigation, in brackets their coefficient of variation (CV) (−).
Results
Flow Rates and Fraction of Sampled Water
Flow rates at the high P site ranged between 0 and 9 mL m–2 h–1. In all three irrigations, the maximum value was measured in the middle lysimeter of one replicate. At the low P site, flow rates were lower and ranged between 0 and 2.3 mL m–2 h–1. Here, the maximum values were reached by the upper lysimeters. At both sites, the lysimeters started reacting from top to bottom. First samples of each replicate were drawn from the upper lysimeter, followed by the middle lysimeter. In the deep subsoil lysimeters, flow only occurred during the first irrigation experiment (Figure 1). The first samples at the high P site consistently were taken during the first time step, while at the low P site, sampling began during the second time step. Over the course of the individual irrigations, the mean flow rates of the upper lysimeters remained constant. The mean flow rate of the middle lysimeters at the high P site increased clearly during the experiments. Concurrently at the low P site, in the middle lysimeters flow only occurred in the last time step of the experiment. After the end of the irrigation, mean flow rates strongly decreased (see time step 5). At both sites, the range of flow rates and their means decreased with every irrigation. The flow rates and their means were highest at the high P site.
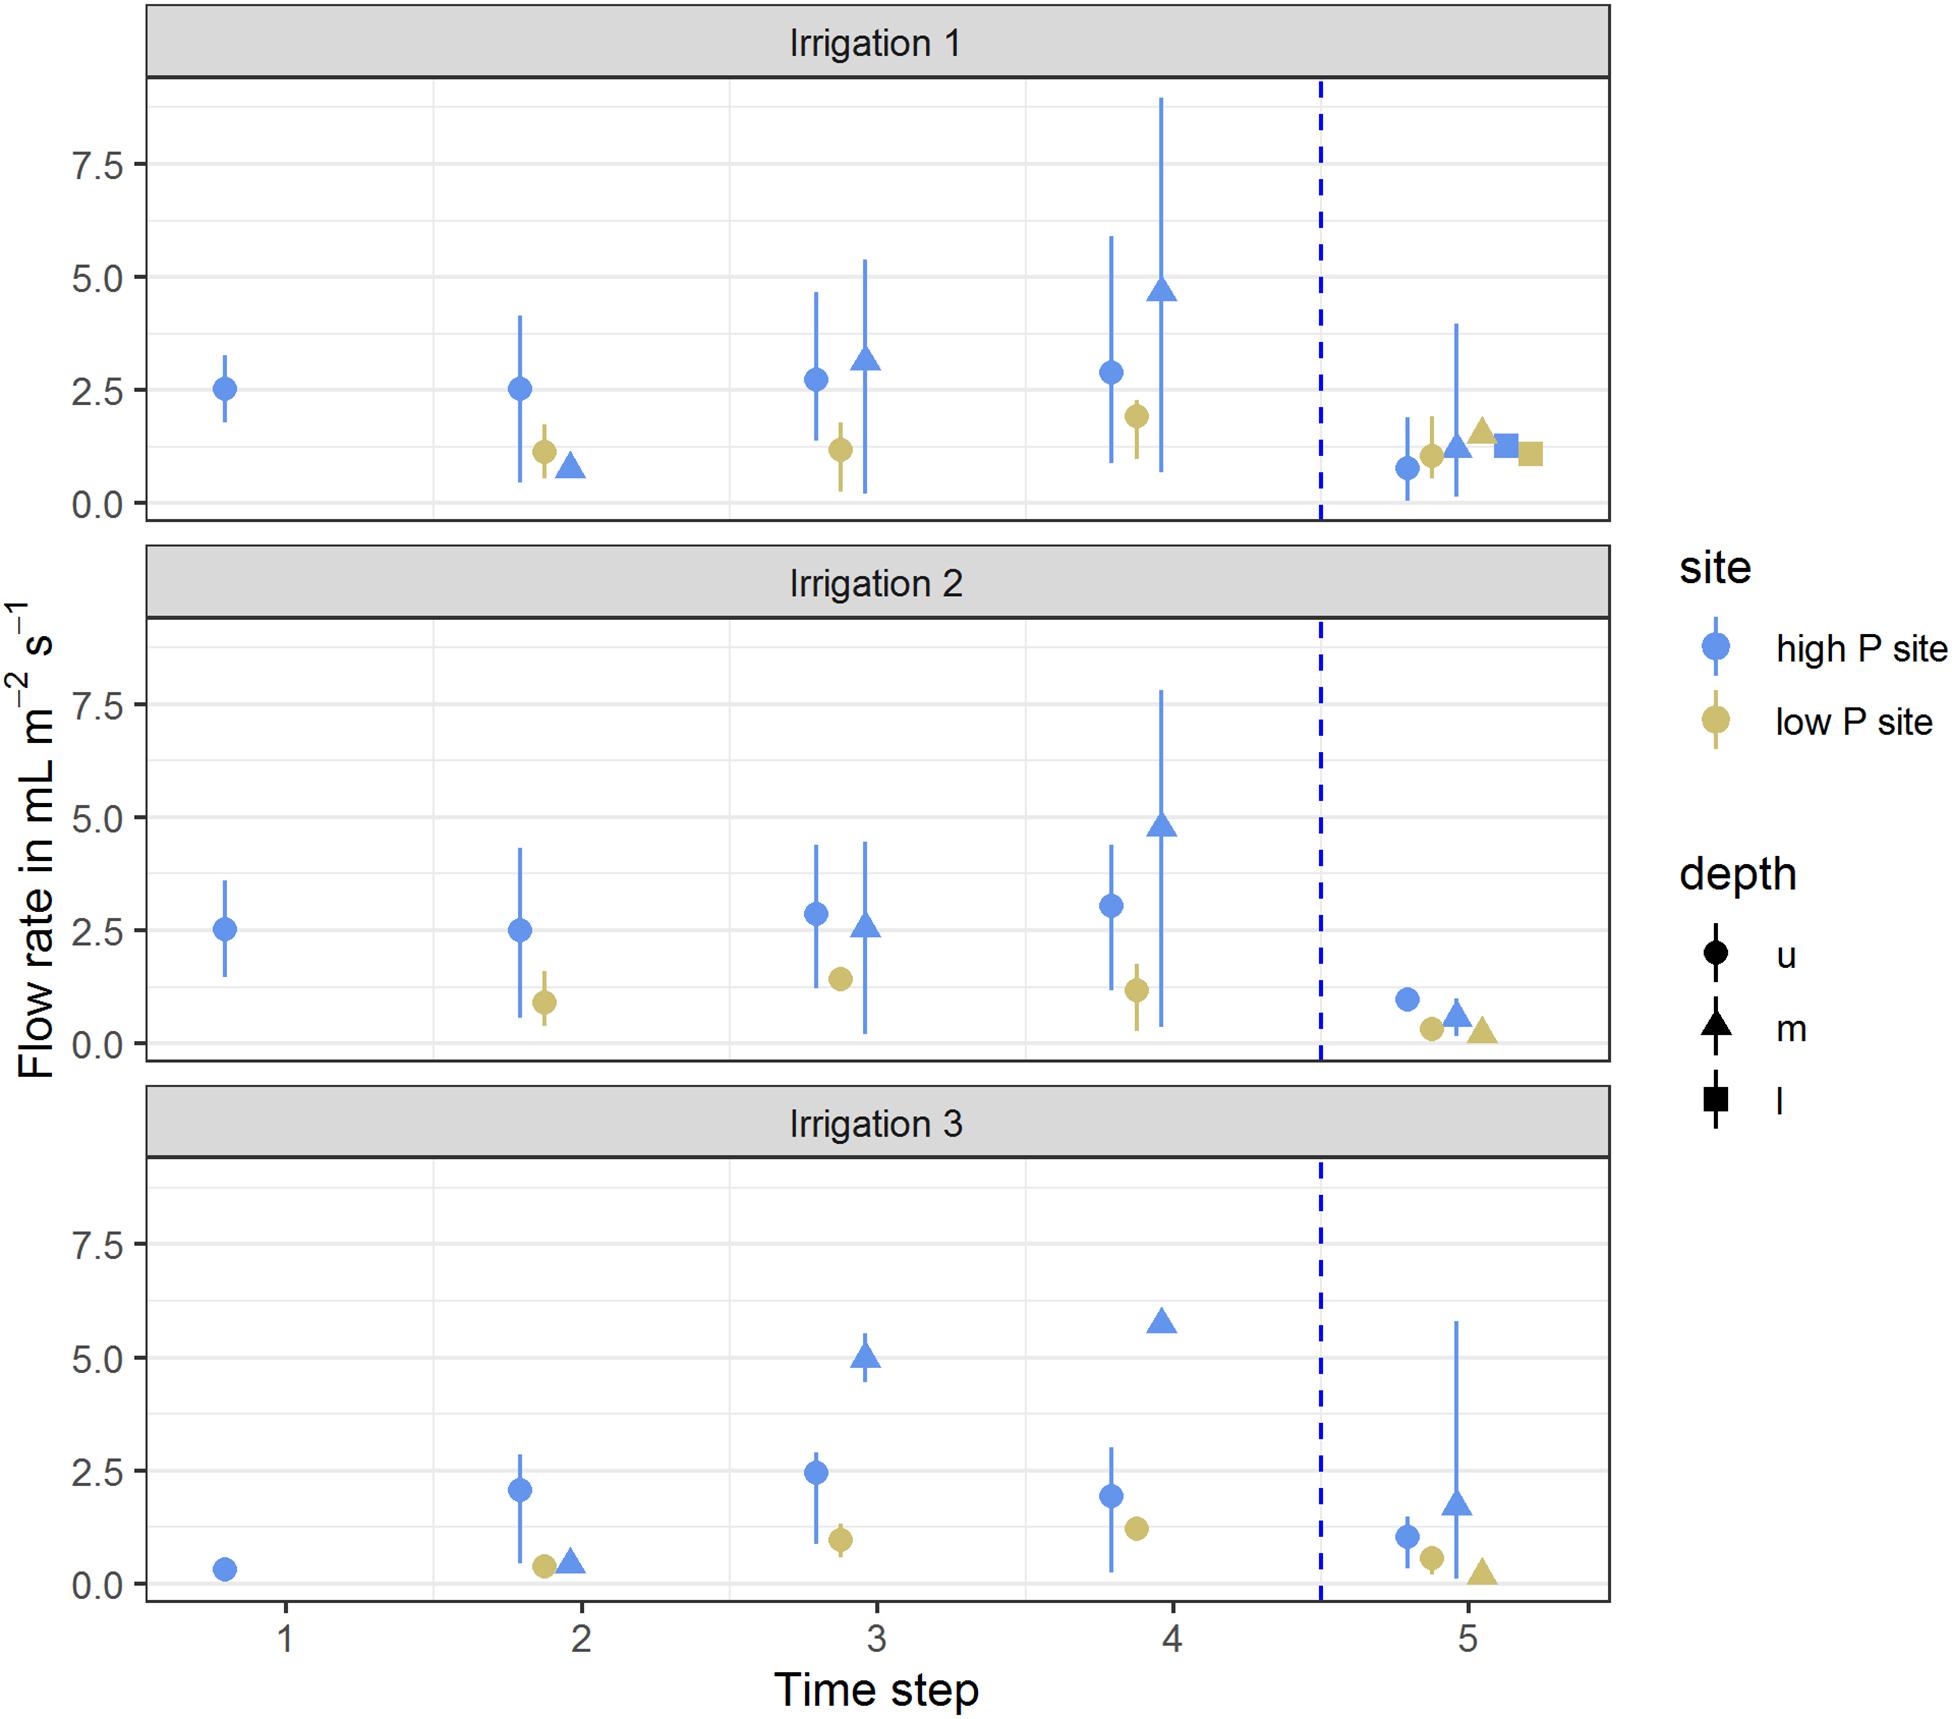
Figure 1. Mean flow rates per time step of high (blue) and low (yellow) P sites. Arithmetic means were calculated from flow rates of all replicates per site for the respective time step. Ranges indicate the span from minimum and maximum values. Time steps 1–4 each represent 60 min of irrigation, time step 5 represents 180 min after the end of the irrigation. Depth represents the lysimeter installation depths (u – upper, m – middle, l – lower). Vertical dotted line represents the end of the irrigation impulse.
The sampled water volume as a proportion of the irrigated water volume ranged from 0 to 68% (corresponding to 0–54 L m–2) at the high P site and from 0 to 28% (0 to 22 L m–2) at the low P site (Table 3). Values of 0% state that no sample was collected from the respective lysimeter. Coefficients of variation (CV) for each lysimeter were high and varied between 0.15 and 0.78. In the upper lysimeters, more flow occurred than in the middle and lower ones.
Concentrations of P Fractions in Preferential Flow Water
All mentioned concentrations refer to the arithmetic mean values of the three plot repetitions and the defined time steps. Standard deviations (SD) at both sites were high and indicate the variability of the replicates (Figures 2, 3). At the high P site, concentrations range from below the limit of quantification (LOQ) of 5 μg L–1 up to 115 μg L–1 DIP in the upper lysimeter. At the low P site, they range from LOQ up to 417 μg L–1 PP found in the lower lysimeter. Highest mean concentrations occurred with the highest standard deviations.
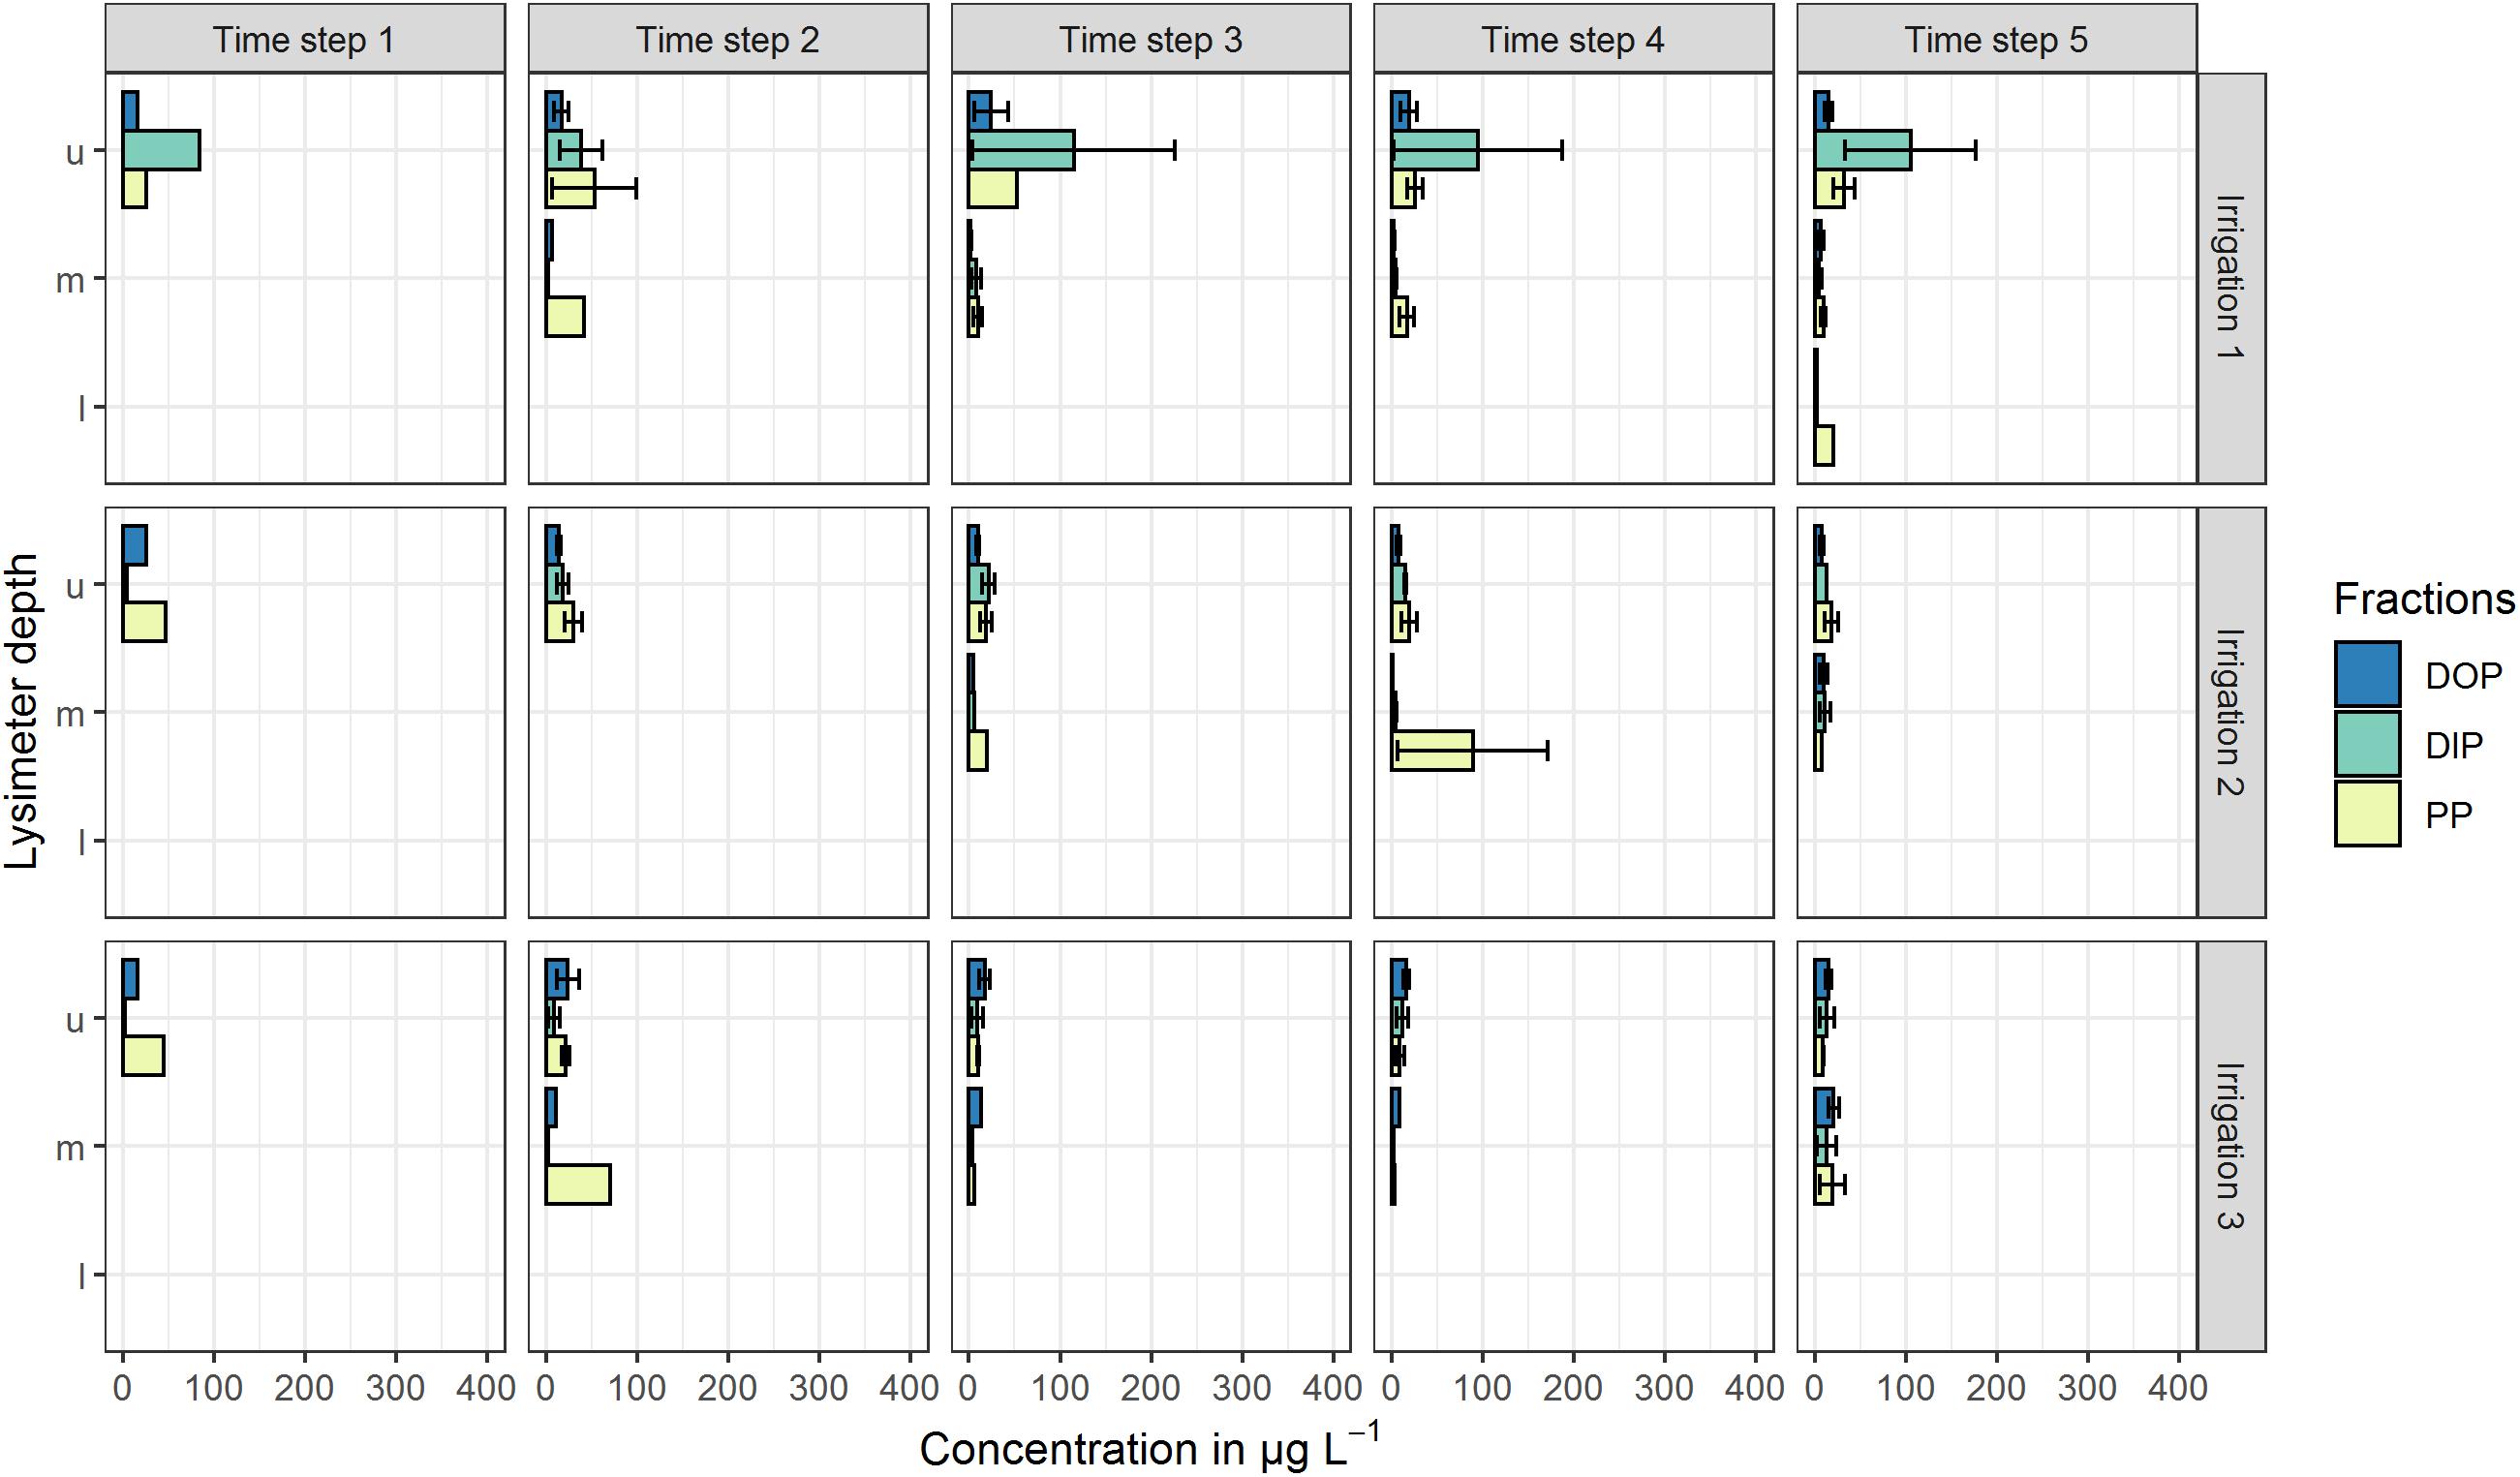
Figure 2. Mean P concentrations in preferential-flow water collected with zero-tension lysimeters during three irrigations at the high P site. Arithmetic means were calculated from all samples drawn in the respective time step. Shown P fractions are DOP (dissolved organic P), DIP (dissolved inorganic P) and PP (particle bound P). Lysimeter depths were indicated by u (upper), m (middle) and l (lower). Time steps 1–4 each represent 60 min of irrigation, time step 5 represents 180 min after the end of the irrigation. No bar indicates that in the respective time step and/or depth, no sample was drawn. Error bars indicate the standard deviation.
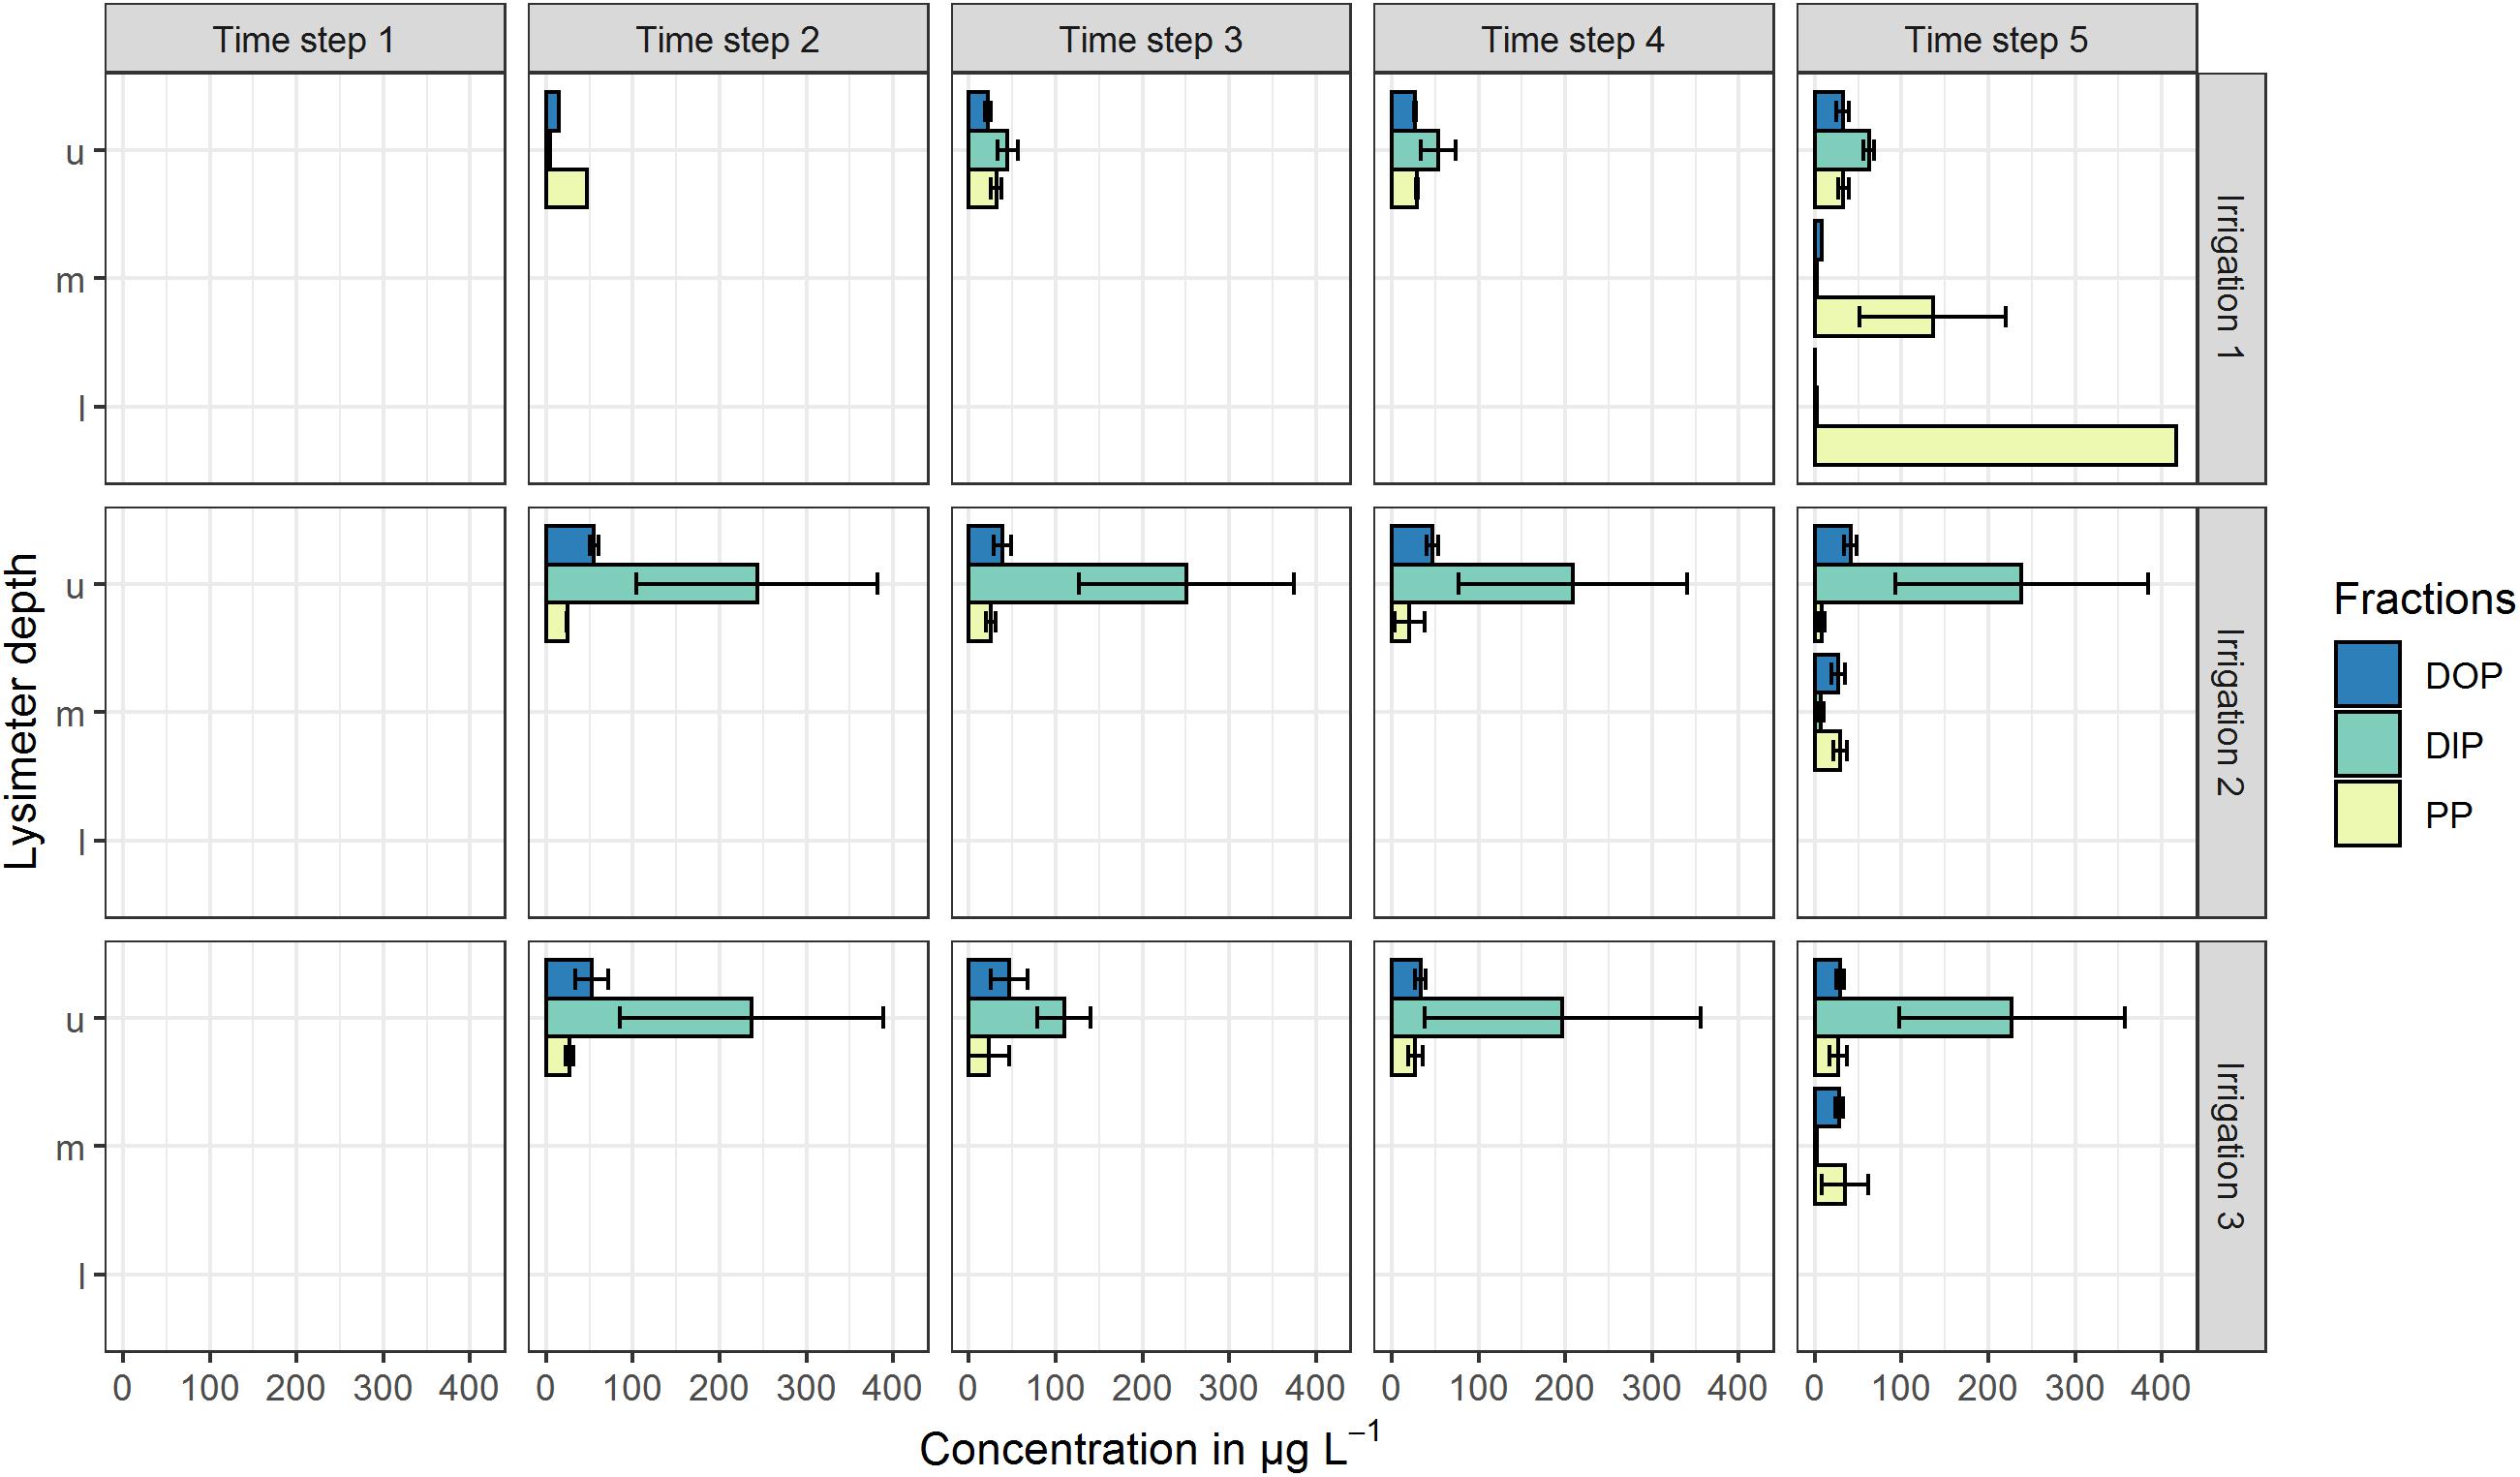
Figure 3. Mean P concentrations in preferential-flow water collected with zero-tension lysimeters during three irrigations at the low P site. Arithmetic means were calculated from all samples drawn in the respective time step. Shown P fractions are DOP (dissolved organic P), DIP (dissolved inorganic P) and PP (particle bound P). Lysimeter depths are indicated by u (upper), m (middle) and l (lower). Time steps 1–4 each represent 60 min of irrigation, time step 5 represents 180 min after the end of the irrigation. No bar indicates that in the respective time step and/or depth, no sample was drawn. Error bars indicate the standard deviation.
In the upper lysimeters of the high P site (Figure 2), high amounts (up to 115 μg L–1) of DIP toward the end of the first irrigation were found. In the following irrigations, DIP concentrations were below 22 μg L–1. During irrigations 2 and 3, no P fraction was clearly prevailing in the upper lysimeters. In the middle lysimeters, DOP and DIP concentrations were around the LOQ during all irrigations with a maximum of 21 μg L–1 (DOP, irrigation 3). PP concentrations were slightly higher and reached a maximum of 89 μg L–1 during the third irrigation. Lower lysimeters sampled only during the fifth time step of the first irrigation. Here, DIP and DOP concentrations were below the LOQ, while PP concentration reached 21 μg L–1.
In the upper lysimeters at the low P site (Figure 3), DIP concentrations were up to 62 μg L–1. During the two following irrigations, DIP concentrations in the upper lysimeters ranged between 109 and 251 μg L–1 and therefore were clearly higher than in the first irrigation. DOP concentrations ranged between 15 and 55 μg L–1, while PP was the smallest fraction with values between 8 and 47 μg L–1. By contrast, in the middle lysimeter samples, DIP concentrations were <10 μg L–1 and DOP concentrations were constant around 30 μg L–1 during all irrigations. The PP fraction was the main fraction during the first irrigation in the middle (136 μg L–1) and lower (417 μg L–1) lysimeters. The PP/TP ratios of 0.93 (middle lysimeter) and 0.99 (lower lysimeter) underline their prominent role.
Cumulative P Loads
The P loads were calculated as means of the replicates per site and time step. Especially in the upper lysimeter, TP loads differ between sites (see Figure 4 and Table 5). The lower lysimeters did not collect any samples in irrigations 2 and 3. Comparing the loads of both sites, they differ significantly (p < 0.001) in the upper lysimeters for the second and third irrigation. The difference between sites was not statistically significant for the results from the first irrigation (p = 0.29). Furthermore, loads between sites in the middle and lower lysimeters did not differ significantly. This is probably due to the high variability of the replicates. The mean TP loads, cumulated per irrigation, range from 87 to 4062 μg m–2 (Table 5). The maximum TP loads were measured in the upper lysimeters at both sites. Still, the high coefficients of variation show the high variability of the replicates at each site. At the high P site, maximum mean cumulative P load (2444 μg m–2 for DIP) occurred in the upper lysimeter during the first irrigation. The low P site also showed maximal values for DIP loads with 2525 μg m–2 during the second irrigation and 2089 μg m–2 during the third irrigation in the upper lysimeter. Cumulative DOP loads followed a similar pattern. The maximum at the high P site was measured in the upper lysimeter during the first irrigation (553 μg m–2), at the low P site during the second and third irrigation (631 μg m–2 and 449 μg m–2). The clear maximum of the PP loads was measured in the upper lysimeter at the high P site and during the first irrigation (1058 μg m–2). The low P sites maximum was 591 μg m–2 (irrigation 1, middle lysimeter) and therefore clearly lower than at the high P site.
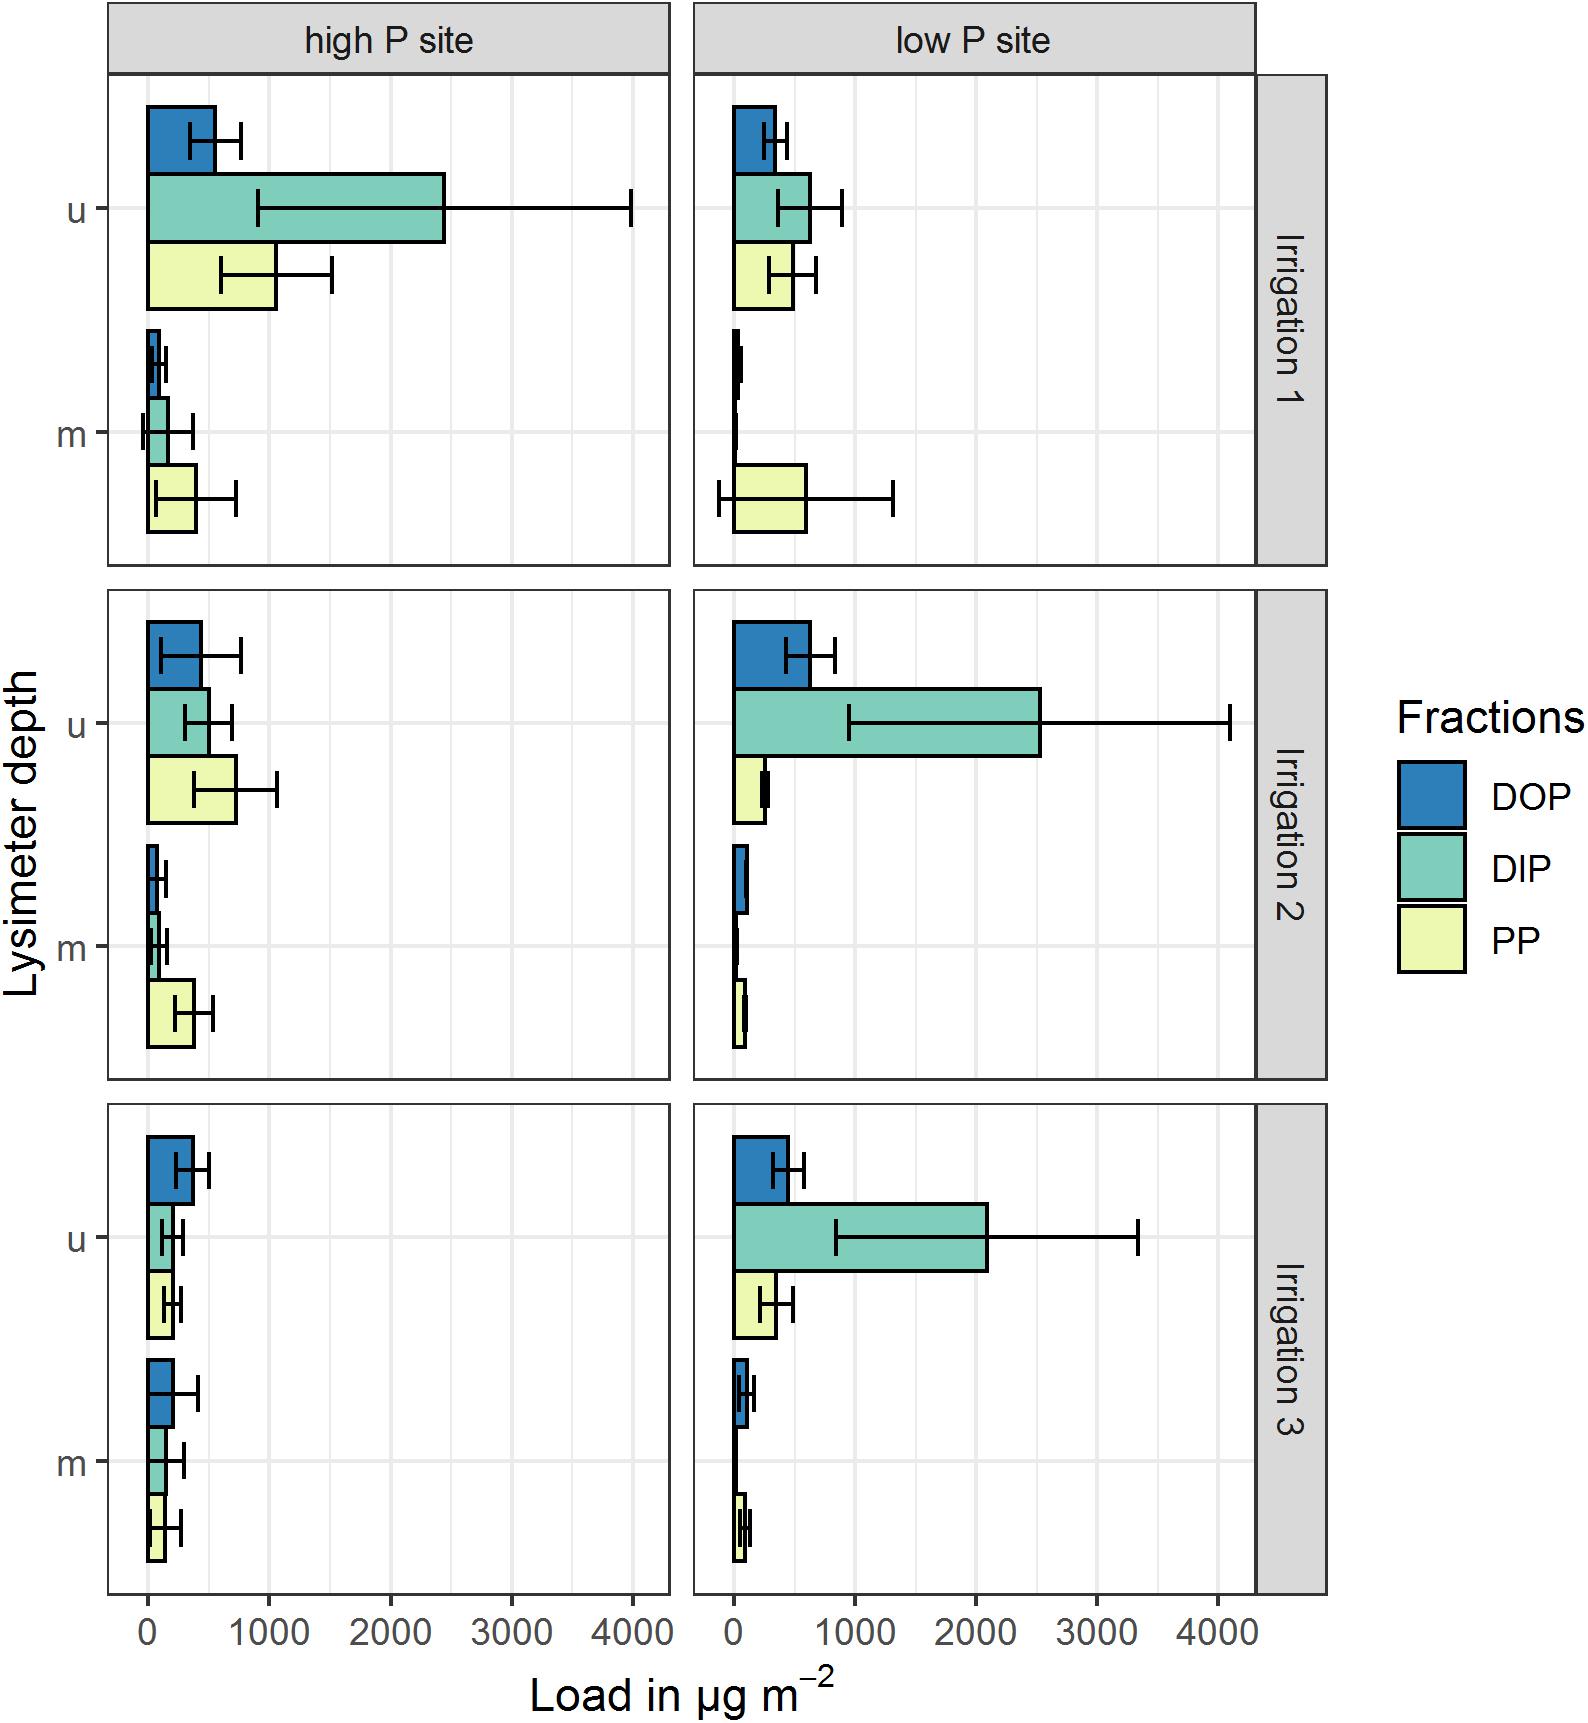
Figure 4. Mean cumulative P loads in preferential flow water collected with zero-tension lysimeters during three irrigations at a high P and a low P site. Shown P fractions are DOP (dissolved organic P), DIP (dissolved inorganic P) and PP (particle bound P). Upper (u) and middle (m) lysimeter data are pictured, lower lysimeter data is not pictured. Values represent arithmetic means of three replicates, cumulated over the experimental period (4 h irrigation + 3 h after irrigation sampling). Error bars represent the standard deviation of the replicates.
The ratios of TP loads to the respective soil P stock of the sites are given in Figure 5. Here, the low P site reveals higher amounts (63–144 μg Pwater g–1 Psoil) of P mobilized in the upper lysimeters, compared to the high P site (7–37 μg Pwater g–1 Psoil). This emphasizes the high loads of mobilized P in the topsoil of the low P site. In the middle lysimeters, load-to-stock P ratios of both sites were similar to each other and clearly lower than in the upper lysimeters. Lower lysimeter ratios could only be calculated for the first irrigation. Here, the low P sites ratio was higher (14 μg Pwater g–1 Psoil) compared to the high P site (0.2 μg Pwater g–1 Psoil).
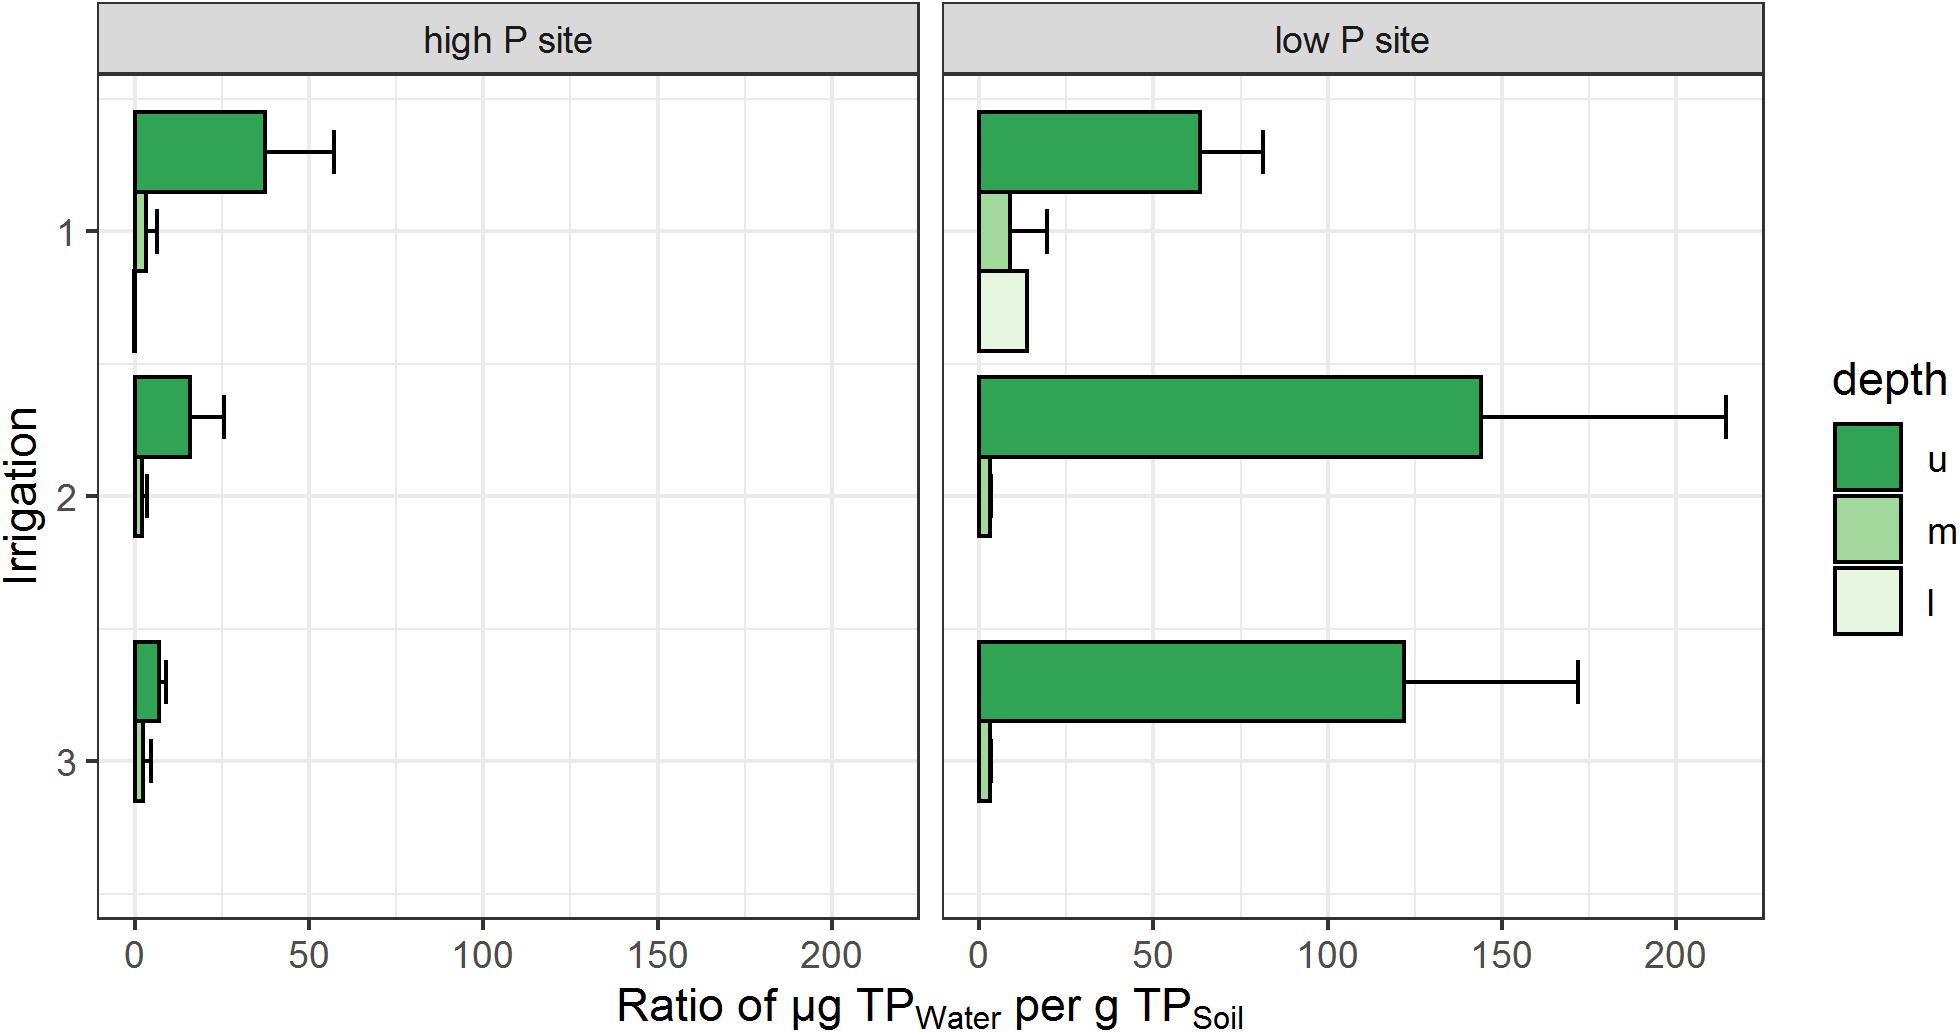
Figure 5. Cumulative total P loads in relation to soil P stock of each site. Depth refers to the respective lysimeter installation depths (u – upper, m – middle, l – lower). Ratios represent the arithmetic means of three replicates per site. No bar indicates no samples from the respective depth and irrigation. Error bars represent the standard deviation of the replicates.
Discussion
Our results demonstrate differences in terms of mobilization and transport of P between sites, depths and events. The dominating P fraction in our results was DIP, which is in line to the findings of similar studies (Dinh et al., 2016; Hömberg and Matzner, 2018; Brödlin et al., 2019), who investigated leachates from organic layers during drying-rewetting cycles in beech forest soils. Dinh et al. (2016) and Brödlin et al. (2019) also sampled A-Horizons, but reported higher DOP and smaller DIP shares than our results from the upper lysimeters. Therefore, preferential flow pathways seem to translocate P, often as DIP, from the organic layers into the mineral topsoil below the A-horizon. Additionally, our results contrast findings from a 27 months experiment, where DOP predominates leachates from the forest floor and mineral soil solution (Kaiser et al., 2003). However, our experiments did not always result in high DIP concentrations in the topsoil. The release of DIP into the soil solution is controlled by biotic and abiotic processes (Frossard et al., 2000). The biotic release of DIP is associated with microbial turnover and mineralization. This is especially important for sites with low P availability, where low abiotic DIP release is assumed (Frossard et al., 2000; Pistocchi et al., 2018). Therefore, high concentrations of DIP in soil water represent high microbial activity in combination with no or little plant uptake. Furthermore, soil moisture controls biotic processes with more inactive microbes and less turnover in dryer soils (Skopp et al., 1990). The microbial release of DIP following drying-rewetting cycles is assumed to be highly relevant at the P poor site (Lang et al., 2017). This is supported by our data showing that DIP was predominating in the second and third drying-rewetting cycle at the low P site. By contrast, the plant-available P fraction (corresponding to DIP) was clearly reduced at the high P site during late summer and autumn in our data. However, our methodical approach does not allow conclusions on elevated DIP uptake by plants or less microbial release as compared to the low P site. For future experimental approaches, corresponding methods should be included to answer questions on DIP release and uptake.
The observed depth transport of PP in our study confirms assumptions on the importance of the particle-bound P fraction in seepage water, also including colloids below the operationally defined size of 0.45 μm (Missong et al., 2017; Makowski et al., 2020). These observations fit to our results, where highest PP loads were found at the low P site. Colloid-associated P fluxes in soil leachates in 20 cm soil depths were detected in a range of 8–51 mg P m–2 a–1 (Bol et al., 2016) and may account for 12–91% of total P leached in forest soils (Missong et al., 2018). Investigations of forest streamwater revealed that colloidal DOP may account for 40–100% of the P losses, which were suggested to be mediated by preferential flow transport during storm events (Bol et al., 2016). The DOP loads in seepage water in our experiments ranged between 0 and 0.63 mg m–2 within a period of 7 h. Literature values on annual DOP fluxes in deciduous forest soil were indicated in a range of 30–62 mg m–2 in organic layers and 2–38 mg m–2 in subsoil [summarized in Bol et al. (2016)]. Against this background, the observed DOP fluxes in our experiments seem to be very low, even if the occurrence of several rain events in the applied extent is considered. However, the methodical approach by using zero-tension lysimeters may explain why other studies, using suction-based approaches, detected a predominance of DOP rather than PP in soil water fluxes.
We were able to collect only few samples from middle and especially lower lysimeters resulting in the assumption that the subsoil is not well connected to water flow from upper soil layers in our experiments. Similar flow patterns were detected in a study by Bogner et al. (2008), who also found low soil moisture to be the reason for missing subsoil preferential flow in forest soils. Research on cultivated soils, which is more frequent, is contradictory concerning soil moisture and depth transport via preferential flow pathways (e.g., Granovsky et al., 1994; Kung et al., 2000), because not all PFP in the soil were activated under drier conditions. Others suggested that site-dependent differences are more dominant than soil moisture with regard to occurrence of depth flow (Weiler and Flühler, 2004). The differences in the occurrence of PFP can in our cases mainly be explained by the differences in texture and stone content. At the high P site, higher stone contents in the B-horizons lead to flow mainly along the stone surface matrix interface (Julich D. et al., 2017). At the low P site with low stone content and a coarser texture, slower and fingering-like flow is pronounced. In sum, factors such as soil moisture, texture, and stone content affect distribution and connection of PFPs to deep water flow, and consequently P fluxes through the soil profile. With regard to our first hypothesis, we can conclude that under certain conditions, preferential flow along specific pathways is able to translocate relevant loads of P into the subsoil. These loads mainly consist of PP and DOP rather than DIP.
Focusing on differences in export dynamics between sites, main aspects are the P contents of the parent material and the resulting soil P stock. Taking the soils P stock and the respective P loads into account, a ratio of load per stock can be specified. In the upper and middle lysimeters, this ratio differs from the P loads of the sites (Table 5 and Figure 5). At the low P site, the ratio of TP in seepage to TP stocks in the overlying soil was clearly higher than at the high P site during all irrigations. This supports the results of Brödlin et al. (2019), who found higher mobilization of P at the low P site than at the high P sites. Further, we were able to detect a strong decrease of the ratios from the upper lysimeter to the middle lysimeter. For irrigations 2 and 3, our data is in line with the assumption by Lang et al. (2017) that low P sites prevent mobilized P from leaching out of the rooting zone, which is a strong indicator for tight recycling of P within the ecosystem. In relation to the soil P stock, both sites had similar amounts of P translocated in the subsoil. The results from irrigation 1 differ from that assumption. Here, high cumulative P loads were found in the lower lysimeters of the low P site and the P load to P stock ratio is higher than at the high P site (Table 5 and Figure 5). However, the sample amount in the lower lysimeters was generally very low with high variability in the replicates, which represents a very small data base but high data uncertainty for the deep subsoil. Nevertheless, as the decrease of the P ratio from topsoil to subsoil is much stronger at the low P site than at the high P site, less P translocation into the subsoil can be expected here. Therefore, we found strong indications which would confirm our second hypothesis.
Furthermore, we found considerable differences between the replicates within the respective sites, indicating a high variability of preferential flow. Ranges and coefficients of variation of our data indicate a high variability of flow rates as well as P concentrations and loads within each site. Recent research on forest soils focused on the differences in nutrient/element distribution between PFP and soil matrix (Bundt et al., 2001; Backnäs et al., 2012; Bogner et al., 2012; Julich D. et al., 2017). Meanwhile, research on the heterogeneity of preferential flow mainly focused on its occurrence (Wiekenkamp et al., 2016) or spatial distribution (Jarvis et al., 2012) rather than nutrient distributions. In addition to the heterogeneous occurrence of preferential flow, distribution of soil P concentrations has shown to be highly variable within a soil profile in dependences of soil depth and contents of soil organic matter as well as pedogenic Al and Fe minerals (Werner et al., 2017). Backnäs et al. (2012) and Julich D. et al. (2017) connected high stone contents with heterogeneous flow and low P sorption conditions. Furthermore, Bundt et al. (2001) emphasized the size and role of microbial biomass in PFP. As a consequence, factors like heterogeneity of soil P, pathway type, pathway distribution and microbial biomass can explain the variability of the presented results. Further research on the spatial and temporal heterogeneity of nutrients in preferential flow appears to be important for a deeper understanding of the role of preferential flow (pathways) for nutrient translocation in natural ecosystems.
Conclusion
In this study, we compared two beech-stocked sites with contrasting soil P status concerning the amount of P in preferential flow at several soil depths. We were able to show that under certain conditions, relevant amounts of P were translocated into the subsoil via preferential flow. Here, low P sites were better adapted by recycling processes and retained higher shares of mobilized P in the main rooting zone than high P sites. Additionally, DIP was the main mobilized P fraction, while PP seemed to be important for depth transport, regardless of the soils P status. Nevertheless, driving factors for P losses from forest ecosystems were hard to identify due to the high variability within the sites. Future research must determine the conditions which lead to P export from forest ecosystems with an emphasis on soil heterogeneity. In summary, our study was able to demonstrate that P is translocated from topsoil to deeper soil regions and to give first numbers on the magnitude of this transport processes.
Data Availability Statement
The raw data supporting the conclusions of this article will be made available by the authors, without undue reservation, to any qualified researcher.
Author Contributions
SJ, K-HF, and DJ conceived the experimental approach. VM was responsible for the installation of equipment in the field, sampling, data analyzes and visual processing, supported by DJ. VM wrote the manuscript as lead author. All authors contributed equally to the discussion of the results, commented on the manuscript, read and approved the submitted manuscript.
Funding
This work was funded by the Deutsche Forschungsgemeinschaft (DFG) as part of the SPP 1685 “Ecosystem Nutrition: Forest Strategies for limited Phosphorus Resources” by grant JU 2940/1-2. The Publication Fund of the TU Dresden funded the Open Access publication.
Conflict of Interest
The authors declare that the research was conducted in the absence of any commercial or financial relationships that could be construed as a potential conflict of interest.
Acknowledgments
We are very grateful to Robert Endrikat for his laboratory work and support during fieldwork. We also thank Gisela Ciesielski for her support in the lab and during fieldwork, Manuela Unger and Thomas Klinger for their lab assistance and Tobias Krause and several student helpers for their help in the field. Additionally, we would like to thank our colleagues at the institute for their helpful input.
References
Allaire, S. E., Roulier, S., and Cessna, A. J. (2009). Quantifying preferential flow in soils: a review of different techniques. J. Hydrol. 378, 179–204. doi: 10.1016/j.jhydrol.2009.08.013
Backnäs, S., Laine-Kaulio, H., and Kløve, B. (2012). Phosphorus forms and related soil chemistry in preferential flowpaths and the soil matrix of a forested podzolic till soil profile. Geoderma 189, 50–64. doi: 10.1016/j.geoderma.2012.04.016
Barzegar, A. R., Herbert, S. J., Hashemi, A. M., and Hu, C. S. (2004). Passive pan sampler for vadose zone leachate collection. Soil Sci. Soc. Am. J. 68, 744–749. doi: 10.2136/sssaj2004.0744
Benning, R., Schua, K., Schwärzel, K., and Feger, K. H. (2012). Fluxes of nitrogen, phosphorus, and dissolved organic carbon in the inflow of the Lehnmühle reservoir (Saxony) as compared to streams draining three main land-use types in the catchment. Adv. Geosci. 32, 1–7. doi: 10.5194/adgeo-32-1-2012
Bogner, C., Borken, W., and Huwe, B. (2012). Impact of preferential flow on soil chemistry of a podzol. Geoderma 175, 37–46. doi: 10.1016/j.geoderma.2012.01.019
Bogner, C., Wolf, B., Schlather, M., and Huwe, B. (2008). Analysing flow patterns from dye tracer experiments in a forest soil using extreme value statistics. Eur. J. Soil Sci. 59, 103–113. doi: 10.1111/j.1365-2389.2007.00974.x
Bol, R., Julich, D., Brödlin, D., Siemens, J., Kaiser, K., Dippold, M. A., et al. (2016). Dissolved and colloidal phosphorus fluxes in forest ecosystems—an almost blind spot in ecosystem research. J. Plant Nutr. Soil Sci. 179, 425–438. doi: 10.1002/jpln.201600079
Brödlin, D., Kaiser, K., Kessler, A., and Hagedorn, F. (2019). Drying and rewetting foster phosphorus depletion of forest soils. Soil Biol. Biochem. 128, 22–34. doi: 10.1016/j.soilbio.2018.10.001
Bundt, M., Widmer, F., Pesaro, M., Zeyer, J., and Blaser, P. (2001). Preferential flow paths: biological “hot spots” in soils. Soil Biol. Biochem. 33, 729–738. doi: 10.1016/S0038-0717(00)00218-212
Damon, P. M., Bowden, B., Rose, T., and Rengel, Z. (2014). Crop residue contributions to phosphorus pools in agricultural soils: a review. Soil Biol. Biochem. 74, 127–137. doi: 10.1016/J.SOILBIO.2014.03.003
Dinh, M., Van, Schramm, T., Spohn, M., and Matzner, E. (2016). Drying-rewetting cycles release phosphorus from forest soils. J. Plant Nutr. Soil Sci. 179, 670–678. doi: 10.1002/jpln.201500577
Frossard, E., Condron, L. M., Oberson, A., Sinaj, S., and Fardeau, J. C. (2000). Processes governing phosphorus availability in temperate soils. J. Environ. Qual. 29, 15–23. doi: 10.2134/jeq2000.00472425002900010003x
Granovsky, A. V., McCoy, E. L., Dick, W. A., Shipitalo, M. J., and Edwards, W. M. (1994). Impacts of antecedant moisture and soil surface mulch coverage on water and chemical transport through a no-till soil. Soil Tillage Res. 32, 223–236. doi: 10.1016/0167-1987(94)90022-90021
Grossmann, J., and Udluft, P. (1991). The extraction of soil water by the suction-cup method: a review. J. Soil Sci. 42, 83–93. doi: 10.1111/j.1365-2389.1991.tb00093.x
Guo, L., and Lin, H. (2018). Addressing two bottlenecks to advance the understanding of preferential flow in soils. Adv. Agron. 147, 61–117. doi: 10.1016/bs.agron.2017.10.002
Hauenstein, S., Neidhardt, H., Lang, F., Krüger, J., Hofmann, D., Pütz, T., et al. (2018). Organic layers favor phosphorus storage and uptake by young beech trees (Fagus sylvatica L.) at nutrient poor ecosystems. Plant Soil 432, 289–301. doi: 10.1007/s11104-018-3804-3805
Heckrath, G., Brookes, P. C., Poulton, P. R., and Goulding, K. W. T. (1995). Phosphorus leaching from soils containing different phosphorus concentrations in the Broadbalk experiment. J. Environ. Qual. 24:904. doi: 10.2134/jeq1995.00472425002400050018x
Hömberg, A., and Matzner, E. (2018). Effects of drying and rewetting on soluble phosphorus and nitrogen in forest floors: an experiment with undisturbed columns. J. Plant Nutr. Soil Sci. 181, 177–184. doi: 10.1002/jpln.201700380
Ilg, K., Wellbrock, N., and Lux, W. (2009). Phosphorus supply and cycling at long-term forest monitoring sites in Germany. Eur. J. For. Res. 128, 483–492. doi: 10.1007/s10342-009-0297-z
International Organization for Standardization (2002). Soil quality - Determination of Particle Size Distribution in Mineral Soil Material - Method by Sieving and Sedimentation. Geneva: ISO.
International Organization for Standardization (2004). Water Quality—Determination of Phosphorus: Ammonium Molybdate Spectrometric Method (DIN EN ISO 6878). Geneva: ISO.
Jarvis, N. J. (2007). A review of non-equilibrium water flow and solute transport in soil macropores: principles, controlling factors and consequences for water quality. Eur. J. Soil Sci. 58, 523–546. doi: 10.1111/j.1365-2389.2007.00915.x
Jarvis, N. J., Moeys, J., Koestel, J., and Hollis, J. M. (2012). “Preferential flow in a pedological perspective,” in Hydropedology, ed. H. Lin (Oxford: Academic), 75–120.
Jemison, J. M., and Fox, R. H. (1992). Estimation of zero-tension pan lysimeter collection efficiency. Soil Sci. 154, 85–94. doi: 10.1097/00010694-199208000-199208001
Julich, D., Julich, S., and Feger, K. H. (2017). Phosphorus in preferential flow pathways of forest soils in Germany. Forests 8:19. doi: 10.3390/f8010019
Julich, S., Benning, R., Julich, D., and Feger, K. H. (2017). Quantification of phosphorus exports from a small forested headwater-catchment in the Eastern Ore Mountains, Germany. Forests 8:206. doi: 10.3390/f8060206
Kaiser, K., Guggenberger, G., and Haumaier, L. (2003). Organic phosphorus in soil water under a European beech (Fagus sylvatica L.) stand in northeastern Bavaria. Germany: seasonal variability and changes with soil depth. Biogeochemistry 66, 287–310. doi: 10.1023/B:BIOG.0000005325.86131.5f
Kung, K.-J. S., Steenhuis, T. S., Kladivko, E. J., Gish, T. J., Bubenzer, G., and Helling, C. S. (2000). Impact of preferential flow on the transport of adsorbing and non-adsorbing tracers. Soil Sci. Soc. Am. J. 64, 1290. doi: 10.2136/sssaj2000.6441290x
Lang, F., Bauhus, J., Frossard, E., George, E., Kaiser, K., Kaupenjohann, M., et al. (2016). Phosphorus in forest ecosystems: new insights from an ecosystem nutrition perspective. J. Plant Nutr. Soil Sci. 179, 129–135. doi: 10.1002/jpln.201500541
Lang, F., Krüger, J., Amelung, W., Willbold, S., Frossard, E., Bünemann, E. K., et al. (2017). Soil phosphorus supply controls P nutrition strategies of beech forest ecosystems in Central Europe. Biogeochemistry 136, 5–29. doi: 10.1007/s10533-017-0375-370
Likens, G. E., Bormann, F. H., Johnson, N. M., Fisher, D. W., and Pierce, R. S. (1970). Effects of forest cutting and herbicide treatment on nutrient budgets in the Hubbard Brook watershed-ecosystem. Ecol. Monogr. 40, 23–47.
Linderholm, K., Mattsson, J. E., and Tillman, A.-M. (2012). Phosphorus flows to and from Swedish agriculture and food chain. Ambio 41, 883–893. doi: 10.1007/s13280-012-0294-291
Makowski, V., Julich, S., Feger, K. H., and Julich, D. (2020). Leaching of dissolved and particulate phosphorus via preferential flow pathways in a forest soil: an approach using zero-tension lysimeters. J. Plant Nutr. Soil Sci. 183, 238–247. doi: 10.1002/jpln.201900216
Missong, A., Bol, R., Nischwitz, V., Krüger, J., Lang, F., Siemens, J., et al. (2017). Phosphorus in water dispersible-colloids of forest soil profiles. Plant Soil 427, 71–86. doi: 10.1007/s11104-017-3430-3437
Missong, A., Holzmann, S., Bol, R., Nischwitz, V., Puhlmann, H. V., Wilpert, K., et al. (2018). Leaching of natural colloids from forest topsoils and their relevance for phosphorus mobility. Sci. Total Environ. 634, 305–315. doi: 10.1016/j.scitotenv.2018.03.265
Newman, E. I. (1995). Phosphorus inputs to terrestrial ecosystems. J. Ecol. 83, 713–726. doi: 10.2307/2261638
Peters, A., and Durner, W. (2009). Large zero-tension plate lysimeters for soil water and solute collection in undisturbed soils. Hydrol. Earth Syst. Sci. 13, 1671–1683. doi: 10.5194/hess-13-1671-2009
Pistocchi, C., Mészáros, É, Tamburini, F., Frossard, E., and Bünemann, E. K. (2018). Biological processes dominate phosphorus dynamics under low phosphorus availability in organic horizons of temperate forest soils. Soil Biol. Biochem. 126, 64–75. doi: 10.1016/j.soilbio.2018.08.013
Qualls, R. G., Haines, B. L., Swank, W. T., and Tyler, S. W. (2000). Soluble organic and inorganic nutrient fluxes in clearcut and mature deciduous forests. Soil Sci. Soc. Am. J. 64:1068. doi: 10.2136/sssaj2000.6431068x
Radulovich, R., and Sollins, P. (1987). Improved performance of zero-tension lysimeters. Soil Sci. Soc.Am. J. 51, 1386–1388. doi: 10.2136/sssaj1987.03615995005100050054x
Sims, J. T., Simard, R. R., and Joern, B. C. (1998). Phosphorus loss in agricultural drainage: historical perspective and current research. J. Environ. Qual. 27:277. doi: 10.2134/jeq1998.00472425002700020006x
Singh, G., Kaur, G., Williard, K., Schoonover, J., and Kang, J. (2017). Monitoring of water and solute transport in the vadose zone: a review. Vadose Zone J. 17:160058. doi: 10.2136/vzj2016.07.0058
Skopp, J., Jawson, M. D., and Doran, J. W. (1990). Steady-state aerobic microbial activity as a function of soil water content. Soil Sci. Soc. Am. J. 54:1619. doi: 10.2136/sssaj1990.03615995005400060018x
Spohn, M., Zavišić, A., Nassal, P., Bergkemper, F., Schulz, S., Marhan, S., et al. (2018). Temporal variations of phosphorus uptake by soil microbial biomass and young beech trees in two forest soils with contrasting phosphorus stocks. Soil Biol. Biochem. 117, 191–202. doi: 10.1016/j.soilbio.2017.10.019
Turner, B. L., and Haygarth, P. M. (2000). Phosphorus forms and concentrations in leachate under four grassland soil types. Soil Sci. Soc. Am. J. 64:1090. doi: 10.2136/sssaj2000.6431090x
Weiler, M., and Flühler, H. (2004). Inferring flow types from dye patterns in macroporous soils. Geoderma 120, 137–153. doi: 10.1016/j.geoderma.2003.08.014
Werner, F., de la Haye, T. R., Spielvogel, S., and Prietzel, J. (2017). Small-scale spatial distribution of phosphorus fractions in soils from silicate parent material with different degree of podzolization. Geoderma 302, 52–65. doi: 10.1016/j.geoderma.2017.04.026
Wiekenkamp, I., Huisman, J. A., Bogena, H. R., Lin, H. S., and Vereecken, H. (2016). Spatial and temporal occurrence of preferential flow in a forested headwater catchment. J. Hydrol. 534, 139–149. doi: 10.1016/j.jhydrol.2015.12.050
Withers, P. J. A., Edwards, A. C., and Foy, R. H. (2001). Phosphorus cycling in UK agriculture and implications for phosphorus loss from soil. Soil Use Manag. 17, 139–149. doi: 10.1111/j.1475-2743.2001.tb00020.x
Wood, T., Bormann, F. H., and Voigt, G. K. (1984). Phosphorus cycling in a northern hardwood forest: biological and chemical control. Science 223, 391–393. doi: 10.1126/science.223.4634.391
WRB (2015). World Reference Base for Soil Resources 2014, Update 2015. International Soil Classification System for Naming Soils and Creating Legends for Soil Maps. World Soil Resources Reports 106. Rome: FAO.
Keywords: heavy rainfall event, dry period, zero-tension lysimeter, P loads, forest soil
Citation: Makowski V, Julich S, Feger K-H and Julich D (2020) Soil Phosphorus Translocation via Preferential Flow Pathways: A Comparison of Two Sites With Different Phosphorus Stocks. Front. For. Glob. Change 3:48. doi: 10.3389/ffgc.2020.00048
Received: 11 February 2020; Accepted: 06 April 2020;
Published: 05 May 2020.
Edited by:
Sebastian Loeppmann, Christian-Albrechts-Universität zu Kiel, GermanyReviewed by:
Jörg Prietzel, Technical University of Munich, GermanyAamir Manzoor, University of Göttingen, Germany
Copyright © 2020 Makowski, Julich, Feger and Julich. This is an open-access article distributed under the terms of the Creative Commons Attribution License (CC BY). The use, distribution or reproduction in other forums is permitted, provided the original author(s) and the copyright owner(s) are credited and that the original publication in this journal is cited, in accordance with accepted academic practice. No use, distribution or reproduction is permitted which does not comply with these terms.
*Correspondence: Vera Makowski, vera.makowski@tu-dresden.de