 Fengfeng Wang
 Fei Meng
 Lili Wang
- Department of Health Technology and Informatics, Hong Kong Polytechnic University, Hong Kong, China
MicroRNAs (miRNAs) are post-transcriptional regulators that regulate gene expression by binding to the 3′ untranslated region of target mRNAs. Mature miRNAs transcribed from the miR-17-92 cluster have an oncogenic activity, which are overexpressed in chronic-phase chronic myelogenous leukemia (CML) patients compared with normal individuals. Besides, the tyrosine kinase activity of BCR-ABL oncoprotein from the Philadelphia chromosome in CML can affect this miRNA cluster. Genes with similar mRNA expression profiles are likely to be regulated by the same regulators. We hypothesize that target genes regulated by the same miRNA are co-expressed. In this study, we aim to explore the difference in the co-expression patterns of those genes potentially regulated by miR-17-92 cluster between the normal and the CML groups. We applied a statistical method for gene pair classification by identifying a disease-specific cutoff point that classified the co-expressed gene pairs into strong and weak co-expression classes. The method effectively identified the differences in the co-expression patterns from the overall structure. Functional annotation for co-expressed gene pairs showed that genes involved in the metabolism processes were more likely to be co-expressed in the normal group compared to the CML group. Our method can identify the co-expression pattern difference from the overall structure between two different distributions using the distribution-based statistical method. Functional annotation further provides the biological support. The co-expression pattern in the normal group is regarded as the inter-gene linkages, which represents the healthy pathological balance. Dysregulation of metabolism may be related to CML pathology. Our findings will provide useful information for investigating the novel CML mechanism and treatment.
Introduction
Chronic myelogenous leukemia (CML) is a clonal myeloproliferative disorder of the hematopoietic stem cells (Salesse and Verfaillie, 2002). The hallmark of CML is the Philadelphia (Ph) chromosome, which results from a balanced reciprocal translocation event t(9;22)(q34;q11) between chromosome 9 and 22 (Nowell and Hungerford, 1960; Rowley, 1973). Fusion BCR-ABL oncoprotein is produced by BCR-ABL oncogene, which combines the Abelson oncogene (ABL) at 9q34 and the breakpoint cluster region (BCR) at 22q11.2 through this translocation (Melo and Barnes, 2007). Such fusion can increase the tyrosine kinase activity of ABL and the autophosphorylation of BCR-ABL oncoprotein, creating more binding sites for the interacting proteins (Melo and Barnes, 2007).
Recently, more microarray studies have been performed in CML, such as the gene differential and co-expression analysis. The differential expression analysis can only identify the upregulation or downregulation of genes, which cannot reflect the functional linkages among genes during signal transduction. The co-expression analysis is very powerful for grouping genes and further analyzing the underlying mechanisms of diseases. In addition, gene co-expression patterns vary among different states and cell types (Torkamani et al., 2010). Hence, the altered co-expression pattern can be served as the signature of a disease. It was reported that genes with similar mRNA expression profiles tend to be regulated by the same mechanism(s), e.g., sharing common regulator (Altman and Raychaudhuri, 2001; Schulze and Downward, 2001).
MicroRNAs (miRNAs) are emerging as a new class of gene regulatory factors regulating human gene expression during the post-transcriptional process. MiRNAs are short and noncoding RNA molecules, with about 22 nucleotides long, which can bind to the complementary sequences in the 3′ untranslated region (3′UTR) of mRNAs (Kumar et al., 2007). MiRNAs are also found to be involved in multiple steps of myeloid differentiation, for example, the differentiation of common progenitor from the early stage to the terminal stage (Bhagavathi and Czader, 2010). The miR-17-92 cluster located in chromosome 13 transcribes to 7 mature miRNAs (miR-17-5p, miR-17-3p, miR-18a, miR-19a, miR-20a, miR-19b, and miR-92-1) (Coller et al., 2007; Aguda et al., 2008). It is worth mentioning that these 7 mature miRNAs have similar expression patterns in hematopoietic cell lines (Yu et al., 2006; Coller et al., 2007). Expressions of these miRNAs were found to promote cell proliferation, inhibit apoptosis, and induce tumor angiogenesis in cancer cells (Mendell, 2008). Moreover, this cluster is overexpressed in chronic-phase CML patients compared to normal individuals, and its overexpression can promote cell cycle progression and proliferation, and inhibit apoptosis (Venturini et al., 2007; Mendell, 2008). Thus, the BCR-ABL tyrosine kinase activity may affect the functions of this miRNA cluster.
In this study, we hypothesize that target genes regulated by the same miRNA should be co-expressed. We explored the difference in the co-expression patterns of those target genes potentially regulated by miR-17-92 cluster between the normal and the CML groups. We applied a statistical method to identify a disease-specific cutoff point for co-expression levels that grouped the co-expressed gene pairs into strong and weak co-expression classes so that one of the classes was best coherent with the CML state (Wang et al., 2014a, 2015a,b; Chan et al., 2015). Previous co-expression analysis calculates a p-value of correlation coefficient for each gene pair to identify significantly co-expressed gene pairs. Our method formed two distributions based on all the correlation coefficients of gene pairs in two different groups. By analyzing the biological meaning of strongly co-expressed gene pairs, we can further explore the underlying mechanisms of CML, and provide useful information for cancer treatment.
Methods
Microarray Expression Data
In this study, we chose the microarray dataset GSE5550, which is publicly available in the Gene Expression Omnibus (GEO) repository database (Diaz-Blanco et al., 2007). The data are normalized by variance stabilizing transformations (VSN) method across the samples. This dataset was obtained from gene expression measurements of 8537 unique mRNAs. CD34 + hematopoietic stem and progenitor cells were collected from bone marrows of untreated chronic-phase CML patients and health controls (Diaz-Blanco et al., 2007). The subjects recruited were Caucasians from Germany. Two groups of sample are included in this dataset: (i) the CML group: nine patients; and (ii) the control group: eight normal individuals. For microarray data, a gene may be interrogated by more than one probe. The average of all the probes for the same mRNA was taken to deal with this situation (Breslin et al., 2005; Kapp et al., 2006).
Identification of Candidate Target Genes Potentially Regulated by miR-17-92 Cluster
The systematic search for genes targeted by miR-17-92 cluster (miR-17-5p, miR-17-3p, miR-18a, miR-19a, miR-20a, miR-19b and miR-92-1) was performed on five miRNA prediction databases (DIANA-microT, MicroCosm-Targets, miRWalk, TargetScan and miRDB). Some prediction databases (e.g., DIANA-microT and TargetScan) predict the miRNA targets based on three basic criteria: (i) complementarity when miRNAs bind to mRNAs in seed regions;(ii) free energy to fold the miRNA-mRNA duplex; and (iii) conservation among different species (Li et al., 2010; Chan et al., 2012; Wang et al., 2014b). In the first step, we obtained the target genes regulated by each mature miRNA from the miR-17-92 cluster using these five prediction databases. In order to increase the prediction accuracy, we selected the mRNAs predicted by at least four out of five databases. In the next step, we combined the target genes from all the seven mature miRNAs as the candidate target genes potentially regulated by miR-17-92 cluster for the following co-expression analysis.
Co-expression Analysis for Candidate Target Genes
Co-expression Measure for Gene Pairs
Pearson correlation coefficient (r) was chosen as the similarity measure to calculate the correlation coefficients of gene pairs in this study. Pearson correlation coefficient is represented by the direction cosine between two vectors normalized by the subtraction of their own means. Generally, similarity measure is regarded as a kernel function between two feature vectors. In this study, each feature vector contained the expression profiles of a gene across all the samples in the normal or the CML group respectively. The absolute values of correlation coefficients (|r| values) were considered, due to that the co-expression measure output a scalar in the range from 0 to 1 where a high output indicated a strong biological relationship in either positive or negative direction, and a low output represented a weak biological relationship. The co-expression level was denoted by Cd(i, j) if the expression profiles of two genes were extracted from the disease (CML) group, and Cn(i, j) for the normal group, as shown in Formulas 1 and 2.
where Cd(i, j) and Cn(i, j) refer to the absolute values of correlation coefficients between the expression profiles of gene i and gene j in the CML group and the normal group, respectively (Horvath and Dong, 2008); xdi and xdj represent the expression profiles of the ith and jth genes in the CML group; xni and xnj refer to the expression profiles of the ith and jth genes in the normal group; cor(xdi, xdj) stands for the Pearson correlation coefficient between the ith and jth genes in the CML group; cor(xni, xnj) represents the Pearson correlation coefficient between the ith and jth genes in the normal group.
Identification of Disease-Specific Cutoff Point
Two sets of correlation coefficients in the normal and CML groups were obtained. These two sets of data formed two different cumulative distributions. In the next step, we performed two-sample Kolmogorov-Smirnov (KS) test to exam if these two sets of correlation coefficients significantly differed in terms of the overall distributions between two different conditions. The significance for KS test was represented by comparing the the maximum deviation between two cumulative distributions of Cd and Cn (Formulas 3-5) to a critical D value (Dcritical) based on our previous developed method (Chan et al., 2015). At the maximum deviation a threshold was identified to classify the co-expressed gene pairs into strong and weak co-expression classes, called the disease-specific cutoff point (C), so that the class was significantly associated with the CML state. The cutoff point represented a co-expression level, at which Fd and Fn were extremely deviated.
where Fd and Fn represent the cumulative distribution functions (CDFs) of Cd and Cn, respectively; D is defined as the maximum deviation; C represents the disease-specific cutoff point.
Classification of Co-expressed Gene Pairs
After the disease-specific cutoff point was identified, the gene pairs were classified into four co-expression classes according to the distributions: (i) strongly co-expressed gene pairs in the normal group: with |r| values bigger than or equal to C in the normal group; (ii) strongly co-expressed gene pairs in the CML group: with |r| values bigger than or equal to C in the CML group; (iii) weakly co-expressed gene pairs in the normal group: with |r| values smaller than C in the normal group; and (iv) weakly co-expressed gene pairs in the CML group: with |r| values smaller than C in the CML group.
For better illustration of the groups' characteristics, we further identified the specifically co-expressed gene pairs to form the co-expression galaxy. The normal-specific strongly co-expressed pairs were the gene pairs strongly co-expressed only in the normal group, which were regarded as the inter-gene linkages maintaining physiological balance in healthy individuals. Apparently, these pairs were the CML-specific weakly co-expressed pairs, which were weakly co-expressed only in the CML group. The CML-specific strongly co-expressed pairs were the gene pairs strongly co-expressed only in the CML group, which represented the characteristics of the disease and may be the pathogenic alternatives. Similarly, these pairs were served as the normal-specific weakly co-expressed pairs.
Functional Annotation for Candidate Target Genes
Gene ontology (GO) provides a systematic language and concept collection to describe genes and their product attributes across all species (Gene Ontology Consortium, 2008). In this study, we applied biological process of gene ontology to annotate the candidate target genes potentially regulated by miR-17-92 cluster, to further explore the biological meaning for the identified co-expressed gene pairs. Database for Annotation, Visualization and Integrated Discovery (DAVID) was applied to perform the functional annotation (Huang da et al., 2009). Functional annotation chart was chosen to select the significant batch annotation and GO terms that were most pertinent to the input data when the candidate target gene list was uploaded to DAVID. The significance of GO term enrichment is calculated based on a modified Fisher's Exact Test with Expression Analysis Systematic Explorer (EASE) score. Using DAVID, we annotated the candidate target genes involved in the significantly associated GO terms for a set of biological processes. The selection criteria for the significant GO terms were: (i) EASE score < 0.05; and (ii) false discovery rate (FDR) < 0.05, for multiple-hypothesis correction. Candidate target genes identified in each significant GO term were called the annotated target genes.
Mapping Co-expressed Gene Pairs to Annotated Gene Pairs
The annotated target genes in each GO term were paired with all the possible combinations to form the annotated gene pairs. In the next step, the annotated gene pairs were mapped to the identified co-expressed gene pairs: the mapped normal-specific strongly, the mapped normal-specific weakly, the mapped CML-specific strongly and the mapped CML-specific weakly co-expressed pairs. Fisher exact test was used to identify if there were more mapped normal-specific strongly co-expressed pairs than mapped CML-specific strongly co-expressed pairs in each GO term for biological process. Therefore, one-sided p-value was chosen to indicate the significance. The multiple-hypothesis correction for the whole set of significant GO terms for biological processes was performed by following a more stringent method, Bonferroni correction. That is, the p-value of each GO term was multiplied by the total number of considered GO terms to correct the p-value. A GO term was significantly mapped if its corrected p-value was still smaller than the error rate (0.05).
Results
Identification of Overall Structural Difference in Co-expression
The candidate target genes potentially regulated by miR-17-92 cluster were collected from the five prediction databases. In order to perform the co-expression analysis, the target genes should be found in the microarray dataset. In all, we identified 288 candidate target genes in the microarray dataset GSE5550 (Table S1). We further extracted the available expression profiles of these 288 genes and calculated the correlation coefficients in the normal group and the CML group, respectively, forming the correlation coefficients of 41,328 gene pairs in each group. The cumulative distributions for these two sets of data were plotted. Two-sample KS test was used to identify the difference from the overall structure. We found that these two distributions in the normal and CML groups were significantly different with p < 0.05 for the maximum deviation D = 0.0567 > Dcritical = 0.009 (Figure 1). The disease-specific cutoff point, C = 0.343, was identified at the maximum deviation (Figure 1). The cutoff point grouped gene pairs into four co-expression classes based on the co-expression levels (Table 1). We can infer that these two co-expression patterns were so distinct that the normal group had more strongly co-expressed (level above ~0.343) and less weakly co-expressed (level below ~0.343) gene pairs compared to the CML group. These candidate target genes tended to be co-expressed in the normal group when compared to the CML group.
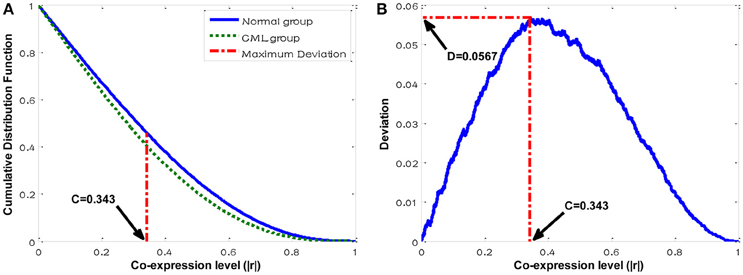
Figure 1. Distribution plots for the co-expression analysis. (A) Cumulative distributions of co-expression levels in the normal and the CML groups. (B) Deviation distribution against different co-expression cutoff points.
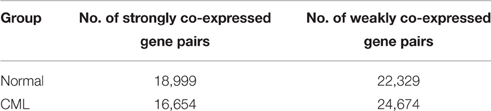
Table 1. Gene pair counts identified by the disease-specific cutoff point.
Co-expression Galaxy and Structures for the Candidate Target Genes Potentially Regulated by miR-17-92 Cluster
The co-expression galaxy was plotted and partitioned into four regions: (i) normal-specific strongly co-expressed pairs (CML-specific weakly co-expressed pairs): the percentage was 27.277%; (ii) common strongly co-expressed pairs: the percentage was 18.694%; (iii) CML-specific strongly co-expressed pairs (normal-specific weakly co-expressed pairs): the percentage was 21.603%; and (iv) common weakly co-expressed pairs: the percentage was 32.426% (Figure 2). From the results, we observed that there were more normal-specific strongly co-expressed pairs than CML-specific strongly co-expressed pairs.
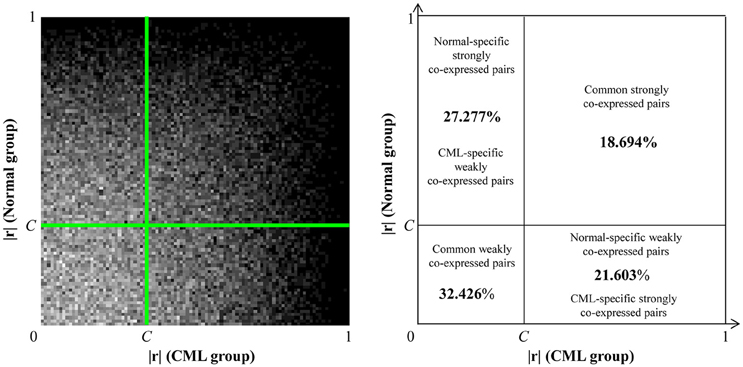
Figure 2. Co-expression galaxy (left) and four regions partitioned by the disease-specific cutoff point, C = 0.343 (right). Each correlation coefficient (|r|) is represented by one white dot in the galaxy. More dots mean that there are more correlation coefficients located in that region.
DAVID Annotation for Enriched Gene Ontology Terms
Based on the selection criteria (EASE score < 0.05 and FDR < 0.05), 11 significant GO terms for biological processes were found (Table 2). We obtained the annotated target genes from each biological process and formed the annotated gene pairs. After that, the co-expressed gene pairs were mapped to the annotated gene pairs. The results revealed that all these 11 biological processes had more mapped normal-specific strongly co-expressed pairs than mapped CML-specific strongly co-expressed pairs (Table 3). Fisher exact test was applied to indicate the significance. Eight of 11 biological processes had significant fisher exact test p-values (p < 0.05) and the corrected p-values for multiple-hypothesis correction was also smaller than 0.05: Positive regulation of nitrogen compound metabolic process, Positive regulation of nucleobase, nucleoside, nucleotide and nucleic acid metabolic process, Positive regulation of biosynthetic process, Positive regulation of cellular biosynthetic process, Positive regulation of macromolecule biosynthetic process, Positive regulation of transcription, DNA-dependent, Positive regulation of RNA metabolic process and Positive regulation of cellular metabolic process. From the results, we observed that most of the processes were related to metabolism, including nitrogen compound metabolic process, cellular biosynthetic process and RNA metabolic process. Moreover, all these eight significant biological processes perform the positive regulation function. Our results demonstrated that genes involved in these processes tended to be more co-expressed in the normal group when compared to the CML group. In other words, the co-expression pattern was dysregulated in CML.
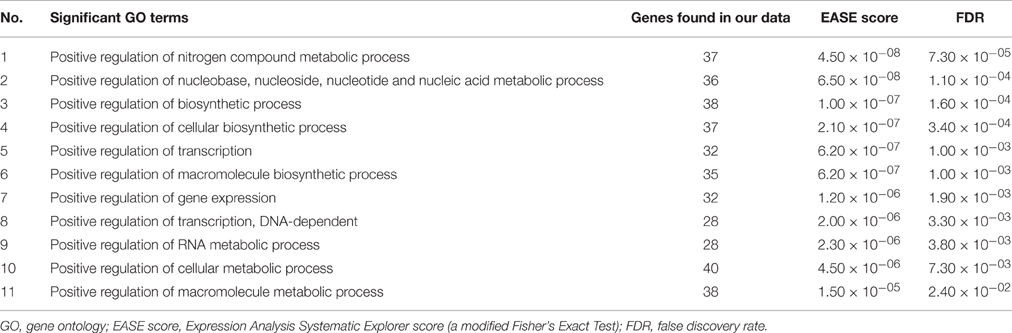
Table 2. Enriched biological process GO terms for functional annotation of candidate target genes.
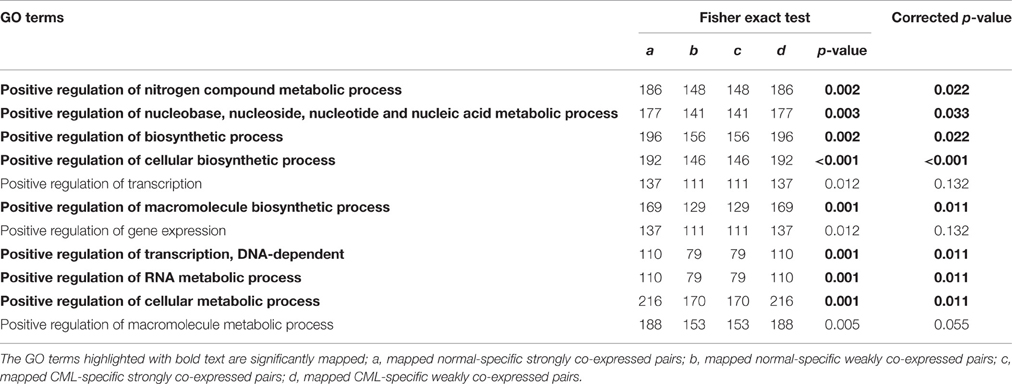
Table 3. Mapping co-expressed gene pairs to annotated gene pairs from each biological process GO term.
Discussion
In this study, we have successfully identified the overall differences in the co-expression patterns of those candidate target genes potentially regulated by miR-17-92 cluster between the normal and the CML groups. Two-sample KS test was performed to indicate the difference (Figure 1). In the first step, the maximum deviation between two cumulative distributions revealed the difference structurally. After that, a disease-specific cutoff point was identified at the maximum deviation to group the co-expressed gene pairs so that the class was best coherent with the CML disease. We further identified the specifically co-expressed gene pairs in different groups to explore the alterations of biological processes.
The functional annotation from DAVID database showed that genes related to metabolism were more likely to be co-expressed in the normal group compared to the CML group (Table 3). Dysregulated mRNA metabolism is regarded as a feature for many human cancers, including CML (Perrotti and Neviani, 2007). BCR/ABL oncoprotein was found to affect the basal mRNA translation machinery by regulating the function of translation factors eukaryotic translation initiation factor 4E and its binding protein (Perrotti and Neviani, 2007). Other researchers reported that the metabolic patterns of untreated CML patients were different from healthy controls, which indicated the metabolic dysregulation in CML patients (Jiye et al., 2010). In addition, CML patients had lower levels of tricarboxylic acid cycle and lipid metabolism when compared to health individuals (Pelicano et al., 2006; Denkert et al., 2008; Jiye et al., 2010) In our study, all these significantly mapped biological processes were found to perform the positive regulation function (Table 3). However, the positive function was dysregulated in the CML group that there were less strongly co-expressed gene pairs found in the CML group compared to the normal group.
Researchers found that genes with similar mRNA expression profiles tend to be regulated by the same mechanism(s), e.g., the same regulator (Altman and Raychaudhuri, 2001; Schulze and Downward, 2001). MiRNA is a post-transcriptional regulator. In this study, we hypothesize that target genes regulated by the same miRNA should be co-expressed. The originality of our study is the application of structural co-expression analysis for the miR-17-92 cluster target genes to identify the different co-expression patterns between the normal and the CML states. The miRNA targets predicted by at least four out of five prediction databases were considered in our study, which made the prediction accuracy more reliable. Some of the predicted targets have been validated by other researchers. MiR-18a targets Dicer (DICER1) in two binding sites, and both sites could suppress expression using luciferase reporter assay in vitro (Tao et al., 2012). MiR-19a and 19b directly target N-Myc (MYCN), and could suppress the endogenous protein expression in a neuroblastoma cell line (Buechner et al., 2011). MiR-20a can down-regulate STAT3 protein expression and inhibit cell proliferation and invasion in pancreatic carcinoma (Yan et al., 2010).
Compared to the gene differential expression analysis, co-expression analysis is more useful to identify the functionally associated linkages among genes during signal transduction. In addition, gene co-expression analysis takes into account the level of correlations that may exist between gene expression patterns (Torkamani et al., 2010). Hence, the gene co-expression analysis is usually used to analyze the underlying mechanisms of diseases. Moreover, the different co-expression pattern can be served as a signature for the disease.
In this study, we presented a method to group the co-expressed gene pairs into strong and weak co-expression classes by identifying a disease-specific cutoff point to form the co-expression galaxy. This method was further applied to explore the differences in the co-expression patterns of those candidate target genes potentially regulated by miR-17-92 cluster. The co-expression pattern differences between the normal and the CML groups were identified from the overall structure. The different co-expression pattern can reflect the biological alterations in the CML state. We also found the dysregulated metabolism processes in CML. Our developed method and significant findings will provide useful information for cancer treatment.
Author Contributions
FW initiated the project and participated in its design. FW designed the co-expression analysis method and gene ontology annotation, and performed the analyses. FM and LW participated in the design and coordination of the study. FW was responsible for writing the manuscript. All the authors participated in discussion and editing of the manuscript.
Conflict of Interest Statement
The authors declare that the research was conducted in the absence of any commercial or financial relationships that could be construed as a potential conflict of interest.
Acknowledgments
We would like to thank the Health and Medical Research Fund (HMRF, Project No. 02131026) to support this project.
Supplementary Material
The Supplementary Material for this article can be found online at: http://journal.frontiersin.org/article/10.3389/fgene.2016.00167
References
Aguda, B. D., Kim, Y., Piper-Hunter, M. G., Friedman, A., and Marsh, C. B. (2008). MicroRNA regulation of a cancer network: consequences of the feedback loops involving miR-17-92, E2F, and Myc. Proc. Natl. Acad. Sci. U.S.A. 105, 19678–19683. doi: 10.1073/pnas.0811166106
Altman, R. B., and Raychaudhuri, S. (2001). Whole-genome expression analysis: challenges beyond clustering. Curr. Opin. Struct. Biol. 11, 340–347. doi: 10.1016/S0959-440X(00)00212-8
Bhagavathi, S., and Czader, M. (2010). MicroRNAs in benign and malignant hematopoiesis. Arch. Pathol. Lab. Med. 134, 1276–1281. doi: 10.1043/2009-0178-RS.1
Breslin, T., Krogh, M., Peterson, C., and Troein, C. (2005). Signal transduction pathway profiling of individual tumor samples. BMC Bioinformatics 6:163. doi: 10.1186/1471-2105-6-163
Buechner, J., Tømte, E., Haug, B. H., Henriksen, J. R., Løkke, C., Flægstad, T., et al. (2011). Tumour-suppressor microRNAs let-7 and mir-101 target the proto-oncogene MYCN and inhibit cell proliferation in MYCN-amplified neuroblastoma. Br. J. Cancer 105, 296–303. doi: 10.1038/bjc.2011.220
Chan, L. W., Lin, X., Yung, G., Lui, T., Chiu, Y. M., Wang, F., et al. (2015). Novel structural co-expression analysis linking the NPM1-associated ribosomal biogenesis network to chronic myelogenous leukemia. Sci. Rep. 5:10973. doi: 10.1038/srep10973
Chan, L. W., Wang, F. F., and Cho, W. C. (2012). Genomic sequence analysis of EGFR regulation by microRNAs in lung cancer. Curr. Top. Med. Chem. 12, 920–926. doi: 10.2174/156802612800166747
Coller, H. A., Forman, J. J., and Legesse-Miller, A. (2007). “Myc'ed messages”: myc induces transcription of E2F1 while inhibiting its translation via a microRNA polycistron. PLoS Genet. 3:e146. doi: 10.1371/journal.pgen.0030146
Denkert, C., Budczies, J., Weichert, W., Wohlgemuth, G., Scholz, M., Kind, T., et al. (2008). Metabolite profiling of human colon carcinoma–deregulation of TCA cycle and amino acid turnover. Mol. Cancer 7:72. doi: 10.1186/1476-4598-7-72
Diaz-Blanco, E., Bruns, I., Neumann, F., Fischer, J. C., Graef, T., Rosskopf, M., et al. (2007). Molecular signature of CD34(+) hematopoietic stem and progenitor cells of patients with CML in chronic phase. Leukemia 21, 494–504. doi: 10.1038/sj.leu.2404549
Gene Ontology Consortium (2008). The gene ontology project in 2008. Nucleic Acids Res. 36, D440–D444. doi: 10.1093/nar/gkm883
Horvath, S., and Dong, J. (2008). Geometric interpretation of gene coexpression network analysis. PLoS Comput. Biol. 4:e1000117. doi: 10.1371/journal.pcbi.1000117
Huang da, W., Sherman, B. T., and Lempicki, R. A. (2009). Systematic and integrative analysis of large gene lists using DAVID bioinformatics resources. Nat. Protoc. 4, 44–57. doi: 10.1038/nprot.2008.211
Jiye, A., Qian, S., Wang, G., Yan, B., Zhang, S., Huang, Q., et al. (2010). Chronic myeloid leukemia patients sensitive and resistant to imatinib treatment show different metabolic responses. PLoS ONE 5:e13186. doi: 10.1371/journal.pone.0013186
Kapp, A. V., Jeffrey, S. S., Langerød, A., Børresen-Dale, A. L., Han, W., Noh, D. Y., et al. (2006). Discovery and validation of breast cancer subtypes. BMC Genomics 7:231. doi: 10.1186/1471-2164-7-231
Kumar, M. S., Lu, J., Mercer, K. L., Golub, T. R., and Jacks, T. (2007). Impaired microRNA processing enhances cellular transformation and tumorigenesis. Nat. Genet. 39, 673–677. doi: 10.1038/ng2003
Li, L., Xu, J., Yang, D., Tan, X., and Wang, H. (2010). Computational approaches for microRNA studies: a review. Mamm. Genome 21, 1–12. doi: 10.1007/s00335-009-9241-2
Melo, J. V., and Barnes, D, J. (2007). Chronic myeloid leukaemia as a model of disease evolution in human cancer. Nat. Rev. Cancer 7, 441–453. doi: 10.1038/nrc2147
Mendell, J. T. (2008). miRiad roles for the miR-17-92 cluster in development and disease. Cell 133, 217–222. doi: 10.1016/j.cell.2008.04.001
Nowell, P. C., and Hungerford, D. A. (1960). A minute chromosome in human chronic granulocytic leukemia. Science 132:1497.
Pelicano, H., Martin, D. S., Xu, R. H., and Huang, P. (2006). Glycolysis inhibition for anticancer treatment. Oncogene 25, 4633–4646. doi: 10.1038/sj.onc.1209597
Perrotti, D., and Neviani, P. (2007). From mRNA metabolism to cancer therapy: chronic myelogenous leukemia shows the way. Clin. Cancer Res. 13, 1638–1642. doi: 10.1158/1078-0432.CCR-06-2320
Rowley, J. D. (1973). A new consistent chromosomal abnormality in chronic myelogenous leukaemia identified by quinacrine fluorescence and giemsa staining. Nature 243, 290–293. doi: 10.1038/243290a0
Salesse, S., and Verfaillie, C. M. (2002). Mechanisms underlying abnormal trafficking and expansion of malignant progenitors in CML: BCR/ABL-induced defects in integrin function in CML. Oncogene 21, 8605–8611. doi: 10.1038/sj.onc.1206088
Schulze, A., and Downward, J. (2001). Navigating gene expression using microarrays–a technology review. Nat. Cell Biol. 3, E190–E195. doi: 10.1038/35087138
Tao, J., Wu, D., Li, P., Xu, B., Lu, Q., and Zhang, W. (2012). microRNA-18a, a member of the oncogenic miR-17-92 cluster, targets Dicer and suppresses cell proliferation in bladder cancer T24 cells. Mol. Med. Rep. 5, 167–172. doi: 10.3892/mmr.2011.591
Torkamani, A., Dean, B., Schork, N. J., and Thomas, E. A. (2010). Coexpression network analysis of neural tissue reveals perturbations in developmental processes in schizophrenia. Genome Res. 20, 403–412. doi: 10.1101/gr.101956.109
Venturini, L., Battmer, K., Castoldi, M., Schultheis, B., Hochhaus, A., Muckenthaler, M. U., et al. (2007). Expression of the miR-17-92 polycistron in chronic myeloid leukemia (CML) CD34+ cells. Blood 109, 4399–4405. doi: 10.1182/blood-2006-09-045104
Wang, F., Chan, L. W., Cho, W., Tang, P., Yu, J. C., Shyu, R., et al. (2014a). Novel approach for coexpression analysis of E2F1–3 and MYC target genes in chronic myelogenous leukemia. BioMed. Res. Int. 2014:439840. doi: 10.1155/2014/439840
Wang, F., Chan, L. W., Tsui, N. B., Wong, S., Siu, P. M., Yip, S., et al. (2015b). Coexpression pattern analysis of NPM1-associated genes in chronic myelogenous leukemia. BioMed. Res. Int. 2015:610595 doi: 10.1155/2015/610595
Wang, F., Cho, W., Chan, L. W, Wong, S. C., Tsui, N. B., Siu, P. M., et al. (2015a). Gene network exploration of crosstalk between apoptosis and autophagy in chronic myelogenous leukemia. BioMed. Res. Int. 2015:459840. doi: 10.1155/2015/459840
Wang, F., Wong, S. C., Chan, L. W., Cho, W. C., Yip, S. P., and Yung, B. Y. (2014b). Multiple regression analysis of mRNA-miRNA associations in colorectal cancer pathway. BioMed. Res. Int. 2014:676724. doi: 10.1155/2014/676724
Yan, H., Wu, J., Liu, W., Zuo, Y., Chen, S., Zhang, S., et al. (2010). MicroRNA-20a overexpression inhibited proliferation and metastasis of pancreatic carcinoma cells. Hum. Gene Ther. 21, 1723–1734. doi: 10.1089/hum.2010.061
Keywords: microRNA, co-expression, disease-specific cutoff point, metabolism, chronic myelogenous leukemia
Citation: Wang F, Meng F and Wang L (2016) Co-expression Pattern Analysis of miR-17-92 Target Genes in Chronic Myelogenous Leukemia. Front. Genet. 7:167. doi: 10.3389/fgene.2016.00167
Received: 12 July 2016; Accepted: 05 September 2016;
Published: 21 September 2016.
Edited by:
Michael Rossbach, Vela Diagnostics, GermanyReviewed by:
Zofia Szweykowska-Kulinska, Adam Mickiewicz University in Poznań, PolandNicoletta Potenza, Second University of Naples, Italy
Copyright © 2016 Wang, Meng and Wang. This is an open-access article distributed under the terms of the Creative Commons Attribution License (CC BY). The use, distribution or reproduction in other forums is permitted, provided the original author(s) or licensor are credited and that the original publication in this journal is cited, in accordance with accepted academic practice. No use, distribution or reproduction is permitted which does not comply with these terms.
*Correspondence: Fengfeng Wang, fengfeng.wang@connect.polyu.hk