 Zhe Zhang1,2
 Peipei Ma1,2
 Qiumeng Li1,2
 Qian Xiao1,2
 Hao Sun1,2
 Babatunde Shittu Olasege1,2
 Qishan Wang1,2*
 Yuchun Pan1,2*
- 1Department of Animal Science, School of Agriculture and Biology, Shanghai Jiao Tong University, Shanghai, China
- 2Shanghai Key Laboratory of Veterinary Biotechnology, Shanghai, China
The relationship between growth and immune phenotypes has been presented in the context of physiology and energy allocation theory, but has rarely been explained genetically in humans. As more summary statistics of genome-wide association studies (GWAS) become available, it is increasingly possible to explore the genetic relationship between traits at the level of genome-wide summary statistics. In this study, publicly available summary statistics of growth and immune related traits were used to evaluate the genetic correlation coefficients between immune and growth traits, as well as the cause and effect relationship between them. In addition, pleiotropic variants and KEGG pathways were identified. As a result, we found negative correlations between birthweight and immune cell count phenotypes, a positive correlation between childhood head circumference and eosinophil counts (EO), and positive or negative correlations between childhood body mass index and immune phenotypes. Statistically significant negative effects of immune cell count phenotypes on human height, and a slight but significant negative influence of human height on allergic disease were also observed. A total of 98 genomic regions were identified as containing variants potentially related to both immunity and growth. Some variants, such as rs3184504 located in SH2B3, rs13107325 in SLC39A8, and rs1260326 located in GCKR, which have been identified to be pleiotropic SNPs among other traits, were found to also be related to growth and immune traits in this study. Meanwhile, the most frequent overlapping KEGG pathways between growth and immune phenotypes were autoimmune related pathways. Pleiotropic pathways such as the adipocytokine signaling pathway and JAK-STAT signaling pathway were also identified to be significant. The results of this study indicate the complex genetic relationship between growth and immune phenotypes, and reveal the genetic background of their correlation in the context of pleiotropy.
Introduction
Both human growth and immune traits are influenced by inherited genetic variants (Ogata, 2006; Roederer et al., 2015). The heritability of growth traits ranges from moderate (e.g., 40% for birthweight; Johnson et al., 2011) to high (e.g., 80% for adult height; Silventoinen et al., 2003; Macgregor et al., 2006), whereas a broader range of heritability has been observed for immune traits, as they are differentially influenced by genetic and environmental factors (Mangino et al., 2017). In recent decades, studies of the associations between genotypes and phenotypes, or genome-wide association studies (GWAS), have mapped 100s of single nucleotide polymorphisms (SNPs) in association with complex traits (Donnelly, 2008; Hindorff et al., 2009; Visscher et al., 2017). For growth traits, a large number of variants relating to human height (Wood et al., 2014), obesity (Larder et al., 2017), and early growth have been identified, and have been curated by some databases such as Early Growth Genetics Consortium (EGG). Gene mapping studies have also successfully identified immunity-related traits or diseases, and nearly all major immune-mediated diseases have been studied by GWAS (Visscher et al., 2017).
Meanwhile, the increasing number of GWAS indicates the existence of underlying overlapping causal variants that play roles in multiple traits, namely pleiotropy (Visscher et al., 2017). The genetic relationships among multiple traits often result from pleiotropy of a gene and linkage disequilibrium (LD) between genes for different traits (Bolormaa et al., 2014). The former is known as biological pleiotropy, whereas the latter is a type of spurious pleiotropy (Solovieff et al., 2013). Several researches have uncovered the relationship between immune and growth traits. For example, in the context of physiology, several cytokines such as interleukin-1 (IL-1), tumor necrosis factor alpha (TNFα), and interleukin-6 (IL-6) that are released during the immune response are either growth factors (Ozaki and Leonard, 2002) or indirectly involved in the regulation of growth-related processes (Klasing, 1988). On the contrary, receptors for growth hormone (GH) and insulin-like growth factor type I (IGF-1) were found to be distributed on immunological cells (Meazza et al., 2004). The genetic relationship between growth and immunity has been primarily studied on model organisms or livestock, and this relationship has often proved to be inverse (Greer, 2008; Clapperton et al., 2009; van der Most et al., 2011).
Studies of the genetic relationship between growth and immune traits in humans have rarely been reported. This may be so as they appear to be biologically distant. However, some studies have shown that biologically unrelated traits are in fact genetically correlated. For instance, in a study of genetic correlations across human diseases and traits, height was found to be significantly associated with coronary artery disease (Bulik-Sullivan et al., 2015). Moreover, the availability of large numbers of summary statistics from GWAS has enabled increasing numbers of meta-analysis studies to explore the pleiotropy of variants, helping to elucidate the genetic relationship among traits (Han et al., 2016; Pickrell et al., 2016; Zhu et al., 2016).
The objective of this study was to employ the summary statistics of growth- and immunity-related GWAS to explore the genetic relationship between growth and immune traits, and the underlying contribution of pleiotropy across the genome to this relationship.
Materials and Methods
Growth and Immune Summary Statistics
A total of 15 GWAS including summary statistics of 13 growth traits and 13 immune traits were included in this study (Table 1). Summary statistics were selected according to the following standards: (1) non-sex-stratified European ancestry; (2) signed summary statistics; (3) without adjusting for heritable covariates. The growth summary statistics were mainly from the EGG database, height (HEIGHT) (Wood et al., 2014) in the GIANT database, together with two pediatric musculoskeletal traits, bone mineral density (BMD) and total-body lean mass (LM) (Medina-Gomez et al., 2017), distributed in GWAS Catalog database. The immune phenotypes were all from the GWAS Catalog database, and comprised a majority of immune traits belonging to the innate immune system, including a variety of immune cell count phenotypes (Astle et al., 2016). In addition, allergic disease (ALL) (Ferreira et al., 2017), asthma (ATH) (Demenais et al., 2018), and three immunity-related diseases, Crohn’s disease (CD), inflammatory bowel disease (IBD), and ulcerative colitis (UC), were also included. The summary statistics were reformatted according to the 1000 Genomes (1000G) phase 3 using script munge_sumstats.py implemented in ldsc software (URLs), as described previously (Bulik-Sullivan et al., 2015).
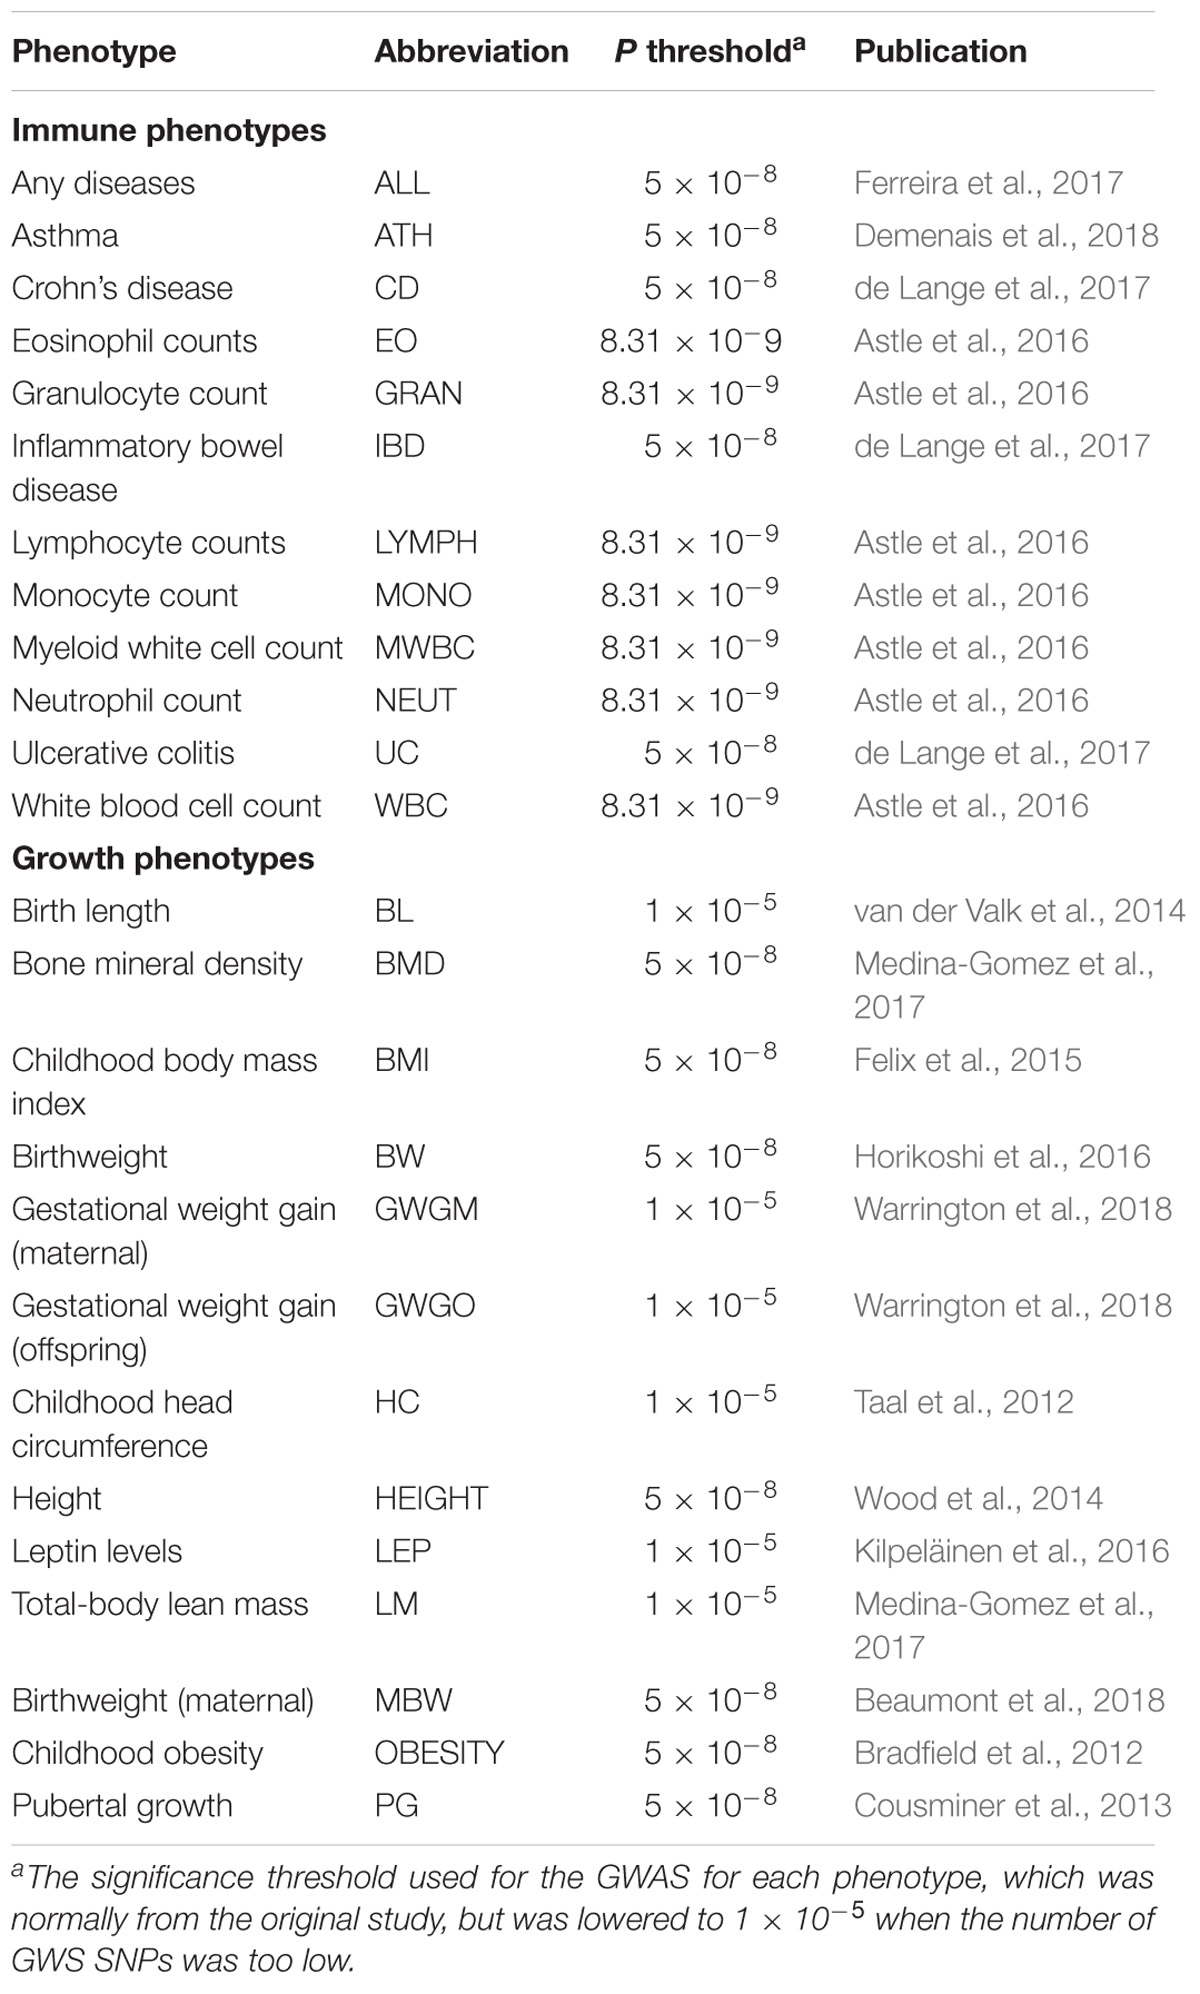
TABLE 1. Name, abbreviation, P-value threshold, and original publication for each phenotype included in this study.
Correlation of Effect Sizes Between GWAS Summary Statistics for Immune and Growth Traits
A cross-trait LD Score regression method (Bulik-Sullivan et al., 2015) was used to evaluate the genome-wide genetic correlation between growth and immune traits. The LD score for a SNP is defined as the sum over all squared correlations between all SNPs with the focal SNP, and indicates how likely a SNP tags its neighbors affecting the phenotype. LD score regression for a single GWAS with χ2 statistics of SNP as a dependent variable can be used to estimate heritability. As instructed by Bulik-Sullivan et al. (2015), the traits with Z scores of heritabilities less than 4 were excluded in this step. When estimating genetic correlation between traits, the dependent variable of LD score regression is the product of two Z statistics. Unlike Mendelian randomization, which simply employs significantly associated SNPs (Davey Smith and Hemani, 2014), cross-trait LD Score regression makes use of the effects of all SNPs to estimate the correlation with the following formula:
Where Zij is the Z statistic for jth locus in study i, ρg is the genetic covariance, lj is the LD Score for jth locus, Ns is the number of overlapping individuals between studies, and ρ is the phenotypic covariance, which equals genetic covariance plus residual covariance between studies. Thus, the overlapping samples between GWAS only affect the intercept from the regression, but not the slope containing the genetic correlation between traits. In this study, we downloaded the LD Score (URLs) that had already been calculated for European ancestry using ldsc software.
Mendelian Randomization Based on Summary Statistics of Immune and Growth Traits
To determine whether there is a cause and effect relationship between each pair of growth and immune traits and to identify the upstream causal factor and the downstream consequence, a bi-directional Generalized Summary-data based Mendelian randomization (GSMR) was performed using GSMR software (Zhu et al., 2018). GSMR belongs to the category of two-sample Mendelian randomization, but also allows bi-directional Mendelian randomization analysis (Zheng et al., 2017). This method first tests for causal associations (bxy) between a risk factor (x) and an outcome (y) based on summary statistics of each SNP (z) for x (bzx) and y (bzy), and then the bxy estimates of all the SNPs are integrated by generalized least squares. Here, pleiotropy is a potential confounding factor for GSMR, because it inflates the cause and effect relationship between exposure and outcome. Therefore, a method called HEIDI-outlier implemented in GSMR was utilized to exclude clear pleiotropic effects on the exposure and outcome phenotypes. As GSMR assumes no overlapping samples between GWAS, the pairs of growth and immune phenotypes that shared overlapping cohorts were excluded. GSMR requires independent genome-wide significant (GWS) SNPs in the analysis, which were identified based on the significance threshold. The threshold for each GWAS is listed in Table 1 according to its original reference, except for birth length (BL), gestational weight gain (maternal) (GWGM), gestational weight gain (offspring) (GWGO), head circumference (HC), leptin levels (LEP), and LM, for which the thresholds were lowered to 1 × 10⁻⁵ due to the small number of GWS SNPs for these phenotypes. Then, the near-independent GWS SNPs were identified using the clumping algorithm in PLINK 1.9 (Purcell et al., 2007) for each trait [with 0.1 as cut-off for r2 in windows predefined by independent LD blocks for European ancestry (URLs)]. The allele frequency and LD information used for GSMR was from the European population in the 1000G Project. The bi-directional causation was then explored by treating growth phenotypes or immune phenotypes as exposures or outcomes alternately.
Detection of Pleiotropy Along the Genome Between Immune and Growth Traits
A hierarchical method was used for co-localization of signals associated with immune and growth traits (Giambartolomei et al., 2014; Pickrell et al., 2016). This method estimates the regional Bayes factors for independent genomic regions along the genome for four models: (1) a genetic variant influencing trait 1 is contained in the region; (2) a genetic variant influencing trait 2 is contained in the region; (3) the region contains a variant that impacts both trait 1 and trait 2; (4) 2 different variants that influence 2 traits separately are contained in the region. In this study, the genomic regions were predefined by independent blocks based on patterns of LD in the European populations as used in GSMR analysis. The software gwas-pw v0.21 (Pickrell et al., 2016) was used to calculate the posterior probability of each genomic region for each pair of immune and growth GWAS. In addition to Z scores, gwas-pw requires variance of effect size of each SNP. The allele frequencies of European ancestry individuals in the 1000G Project were therefore used to estimate the variance of effect size estimates. For pairs of growth and immune GWAS that shared overlapping samples, the genetic correlation between each pair of phenotypes calculated by LD score regression was offered to specify the expected correlation in summary statistics under the null. The genomic regions with posterior probabilities ≥0.9 were considered to be candidate regions containing variants influencing the pairs of traits simultaneously. Meanwhile, the SNPs involved in these candidate regions and had the highest Z scores for the 2 traits, respectively, were annotated functionally based on RefSeq transcripts using ANNOVAR (Wang et al., 2010).
Identification of KEGG Pathways Shared Between Immune and Growth Traits
In order to capture the shared pathways between each pair of immune and growth traits that were beyond the spatial restriction of pleiotropy located on the sharing parts along the genome, enriched KEGG pathways were identified for each trait using GSA-SNP2 software (Yoon et al., 2018). This method is a powerful competitive pathway analysis tool that only requires the P-values of the SNPs in each GWAS. Compared with other methods, GSA-SNP2 can control type I error and maintain higher statistical power, and uses gene scores that indicate accurate pathway analysis results (Yoon et al., 2018). In this study, 218 KEGG pathways included in the GSA-SNP2 software were used as gene sets for enrichment analysis. GSA-SNP2 controls type I error via the SNP-count adjusted gene scores, and corrects for multiple-testing P-values by the false discovery rate (FDR). KEGG pathways with FDR ≤ 0.05 were considered to be significant. The overlapping significant pathways between each pair of immune and growth phenotypes were extracted, and the P-values for overlaps were calculated based on the empirical distributions using permutation with 1000 iterations.
Results
Correlation of Effect Sizes Between Growth and Immune Traits
Z scores of heritabilities for two growth traits, GWGM and GWGO that were less than 4 were excluded in the calculation of genetic correlation between growth and immune traits using cross-trait LD score regression. The pattern of genetic correlation coefficients is shown in Figure 1, and the values can be found in Supplementary Table S1. The P-values were corrected by FDR. The largest correlation coefficient (0.172) was between HC and eosinophil counts (EO). The most significant (FDR = 8.21 × 10⁻⁷) genetic correlation (-0.164) was between BW and white blood cell count (WBC). The significant correlation coefficients were predominately observed between BW, BMI, and several immune cell count phenotypes, and these correlation coefficients were all negative. ALL and ATH often had positive correlations with growth traits, although they were not statistically significant. This pattern was also true for pubertal growth (PG) and LM, which were positively correlated with immune phenotypes.
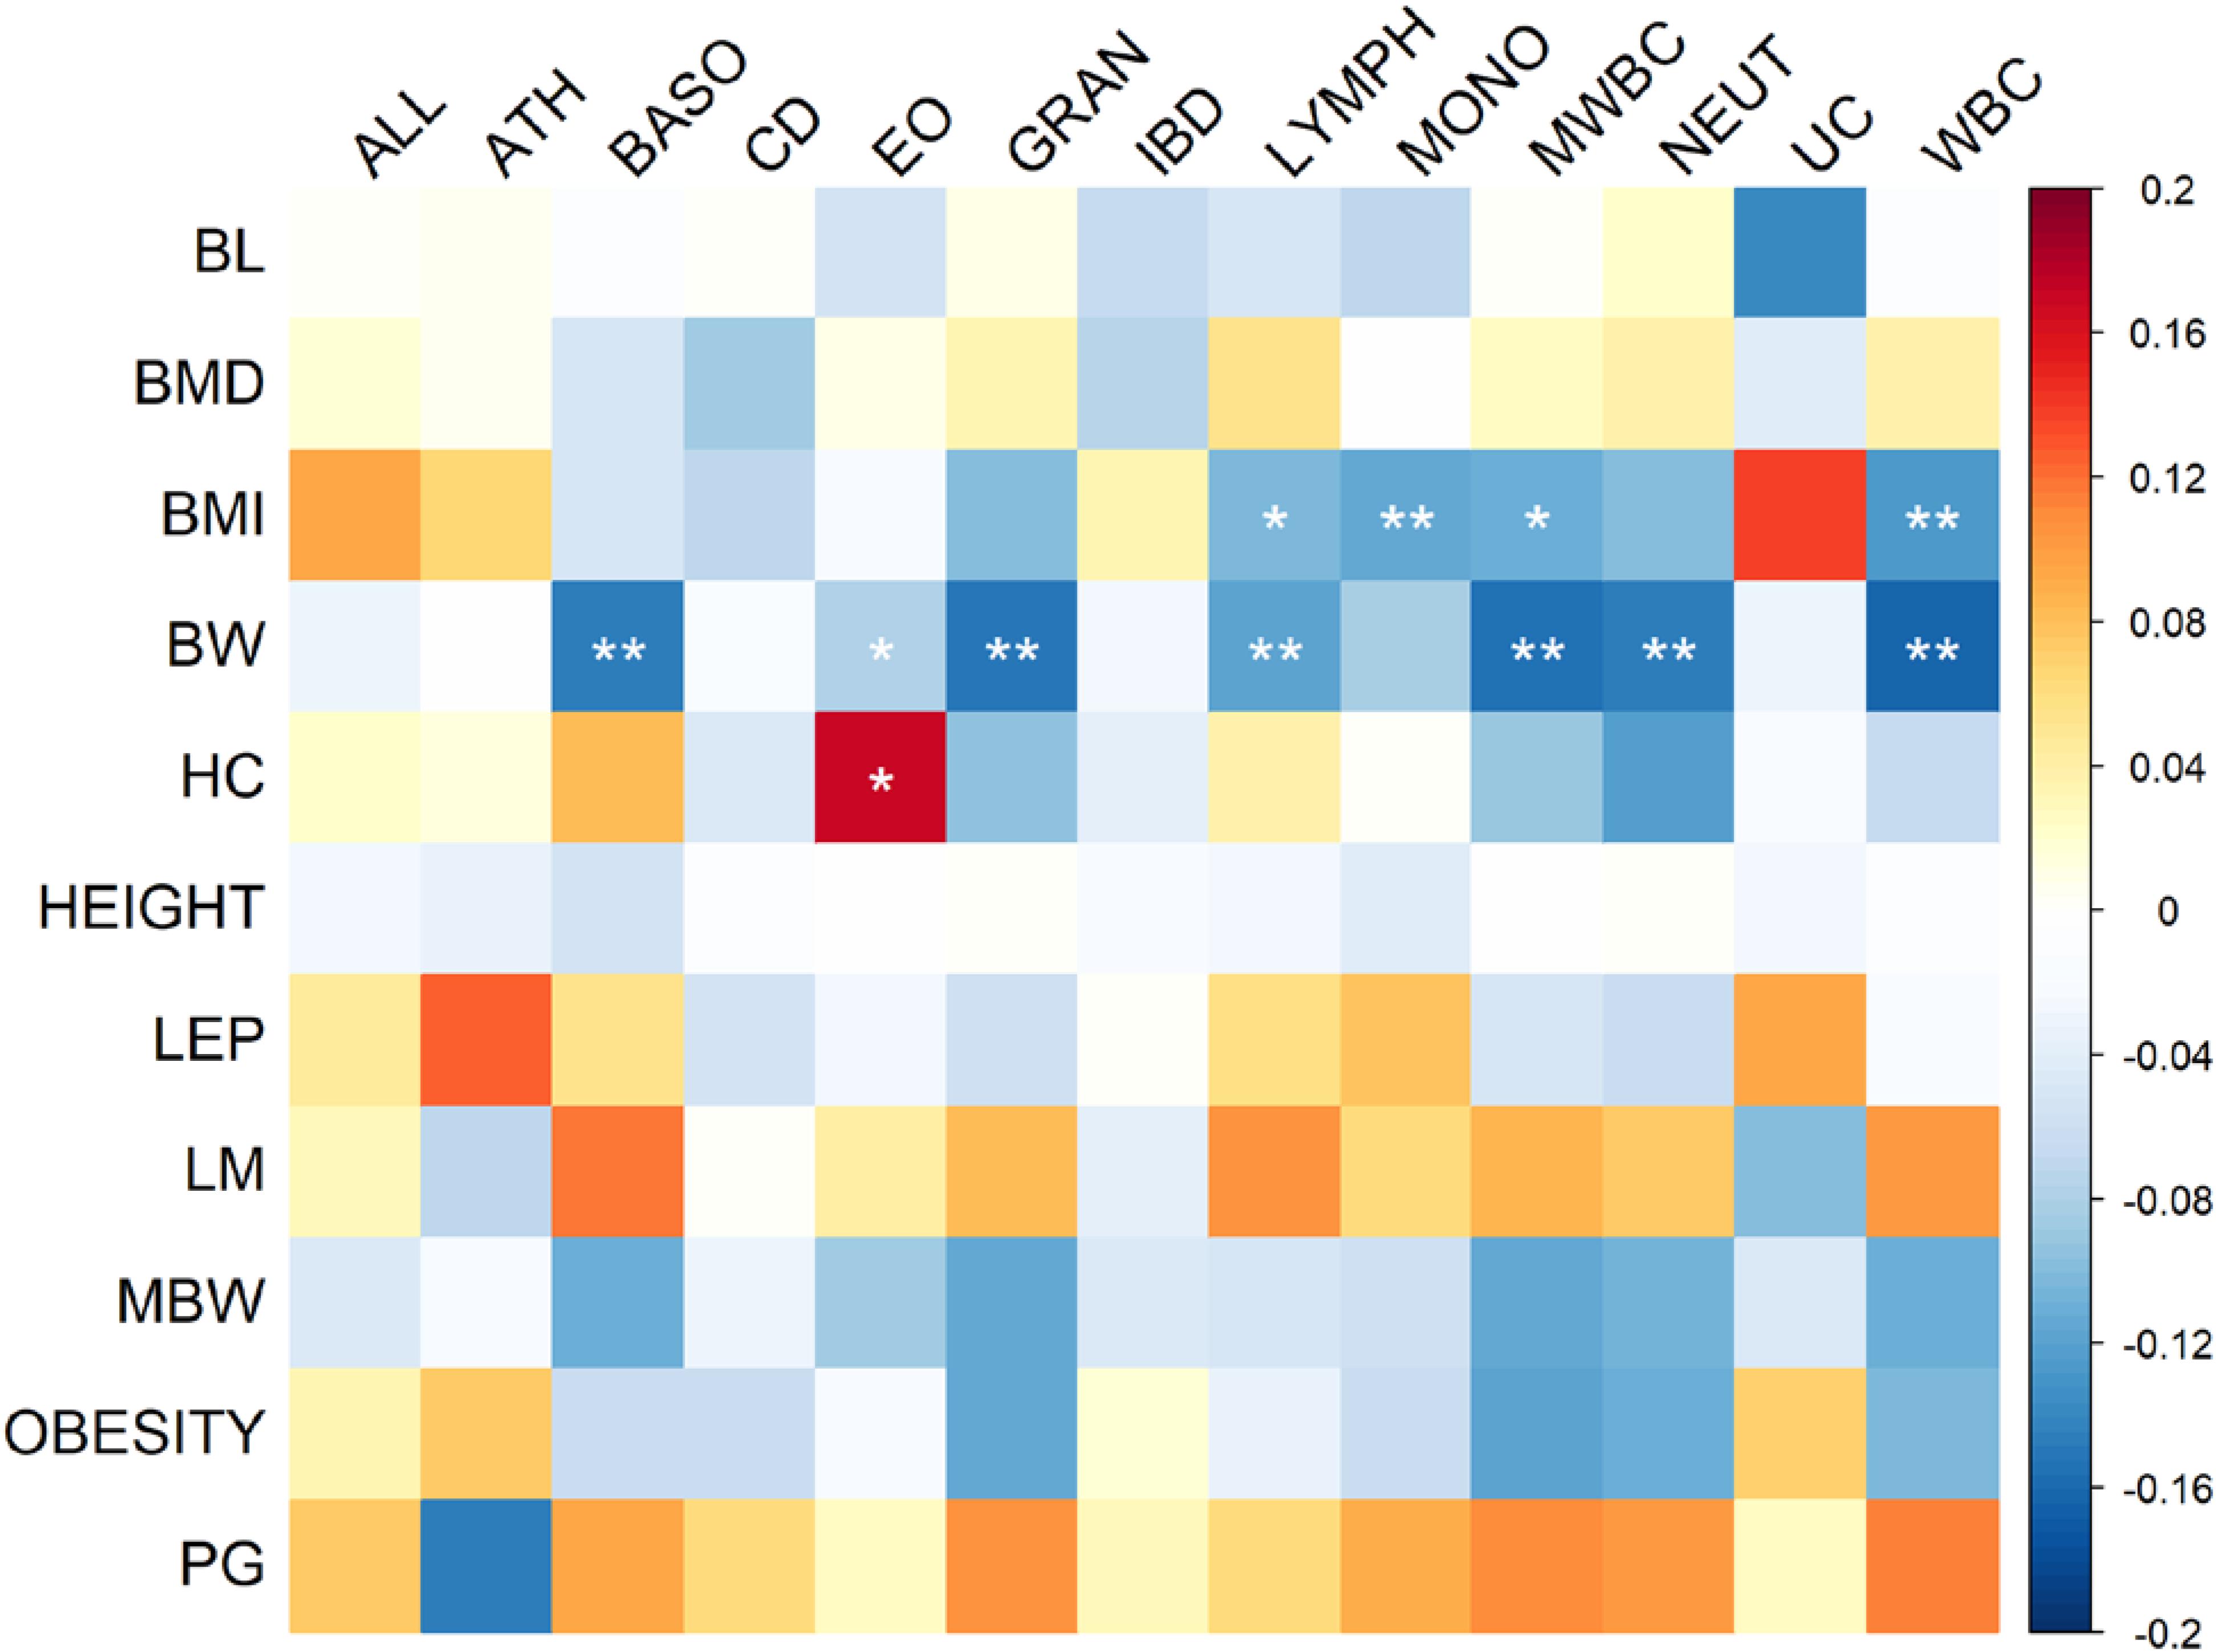
FIGURE 1. Heat map of genetic correlation coefficients between immune and growth phenotypes. The P-values of correlation coefficients were corrected by FDR. Genetic correlations with FDR less than 0.05 are indicated by one star, whereas correlations with FDR less than 0.01 are indicated by two stars.
Bi-directional Mendelian Randomization Between Immune and Growth Traits
After the filtration, GSMR calculated bxy for 206 pairs of exposure and outcome, and the Bonferroni cut-off for statistically significance was therefore set as 0.05/206. Finally, five pairs of exposure and outcome were significant for GSMR analysis with HEIDI-outlier correction (Supplementary Table S2). HEIGHT was the only growth-related phenotype involved, and it was influenced by four immune cell exposures: myeloid white blood count (MWBC), neutrophil count (NEUT), granulocyte count (GRAN), and WBC. Meanwhile, a significant effect from HEIGHT on ALL (bxy = −0.036, SE = 0.01, P = 1.45 × 10⁻⁴) was also observed. These causal relationships were all negative, and the most significant effect was observed from WBC on HEIGHT (bxy = −0.077, SE = 0.013, P = 2.27 × 10⁻⁹, Figure 2).
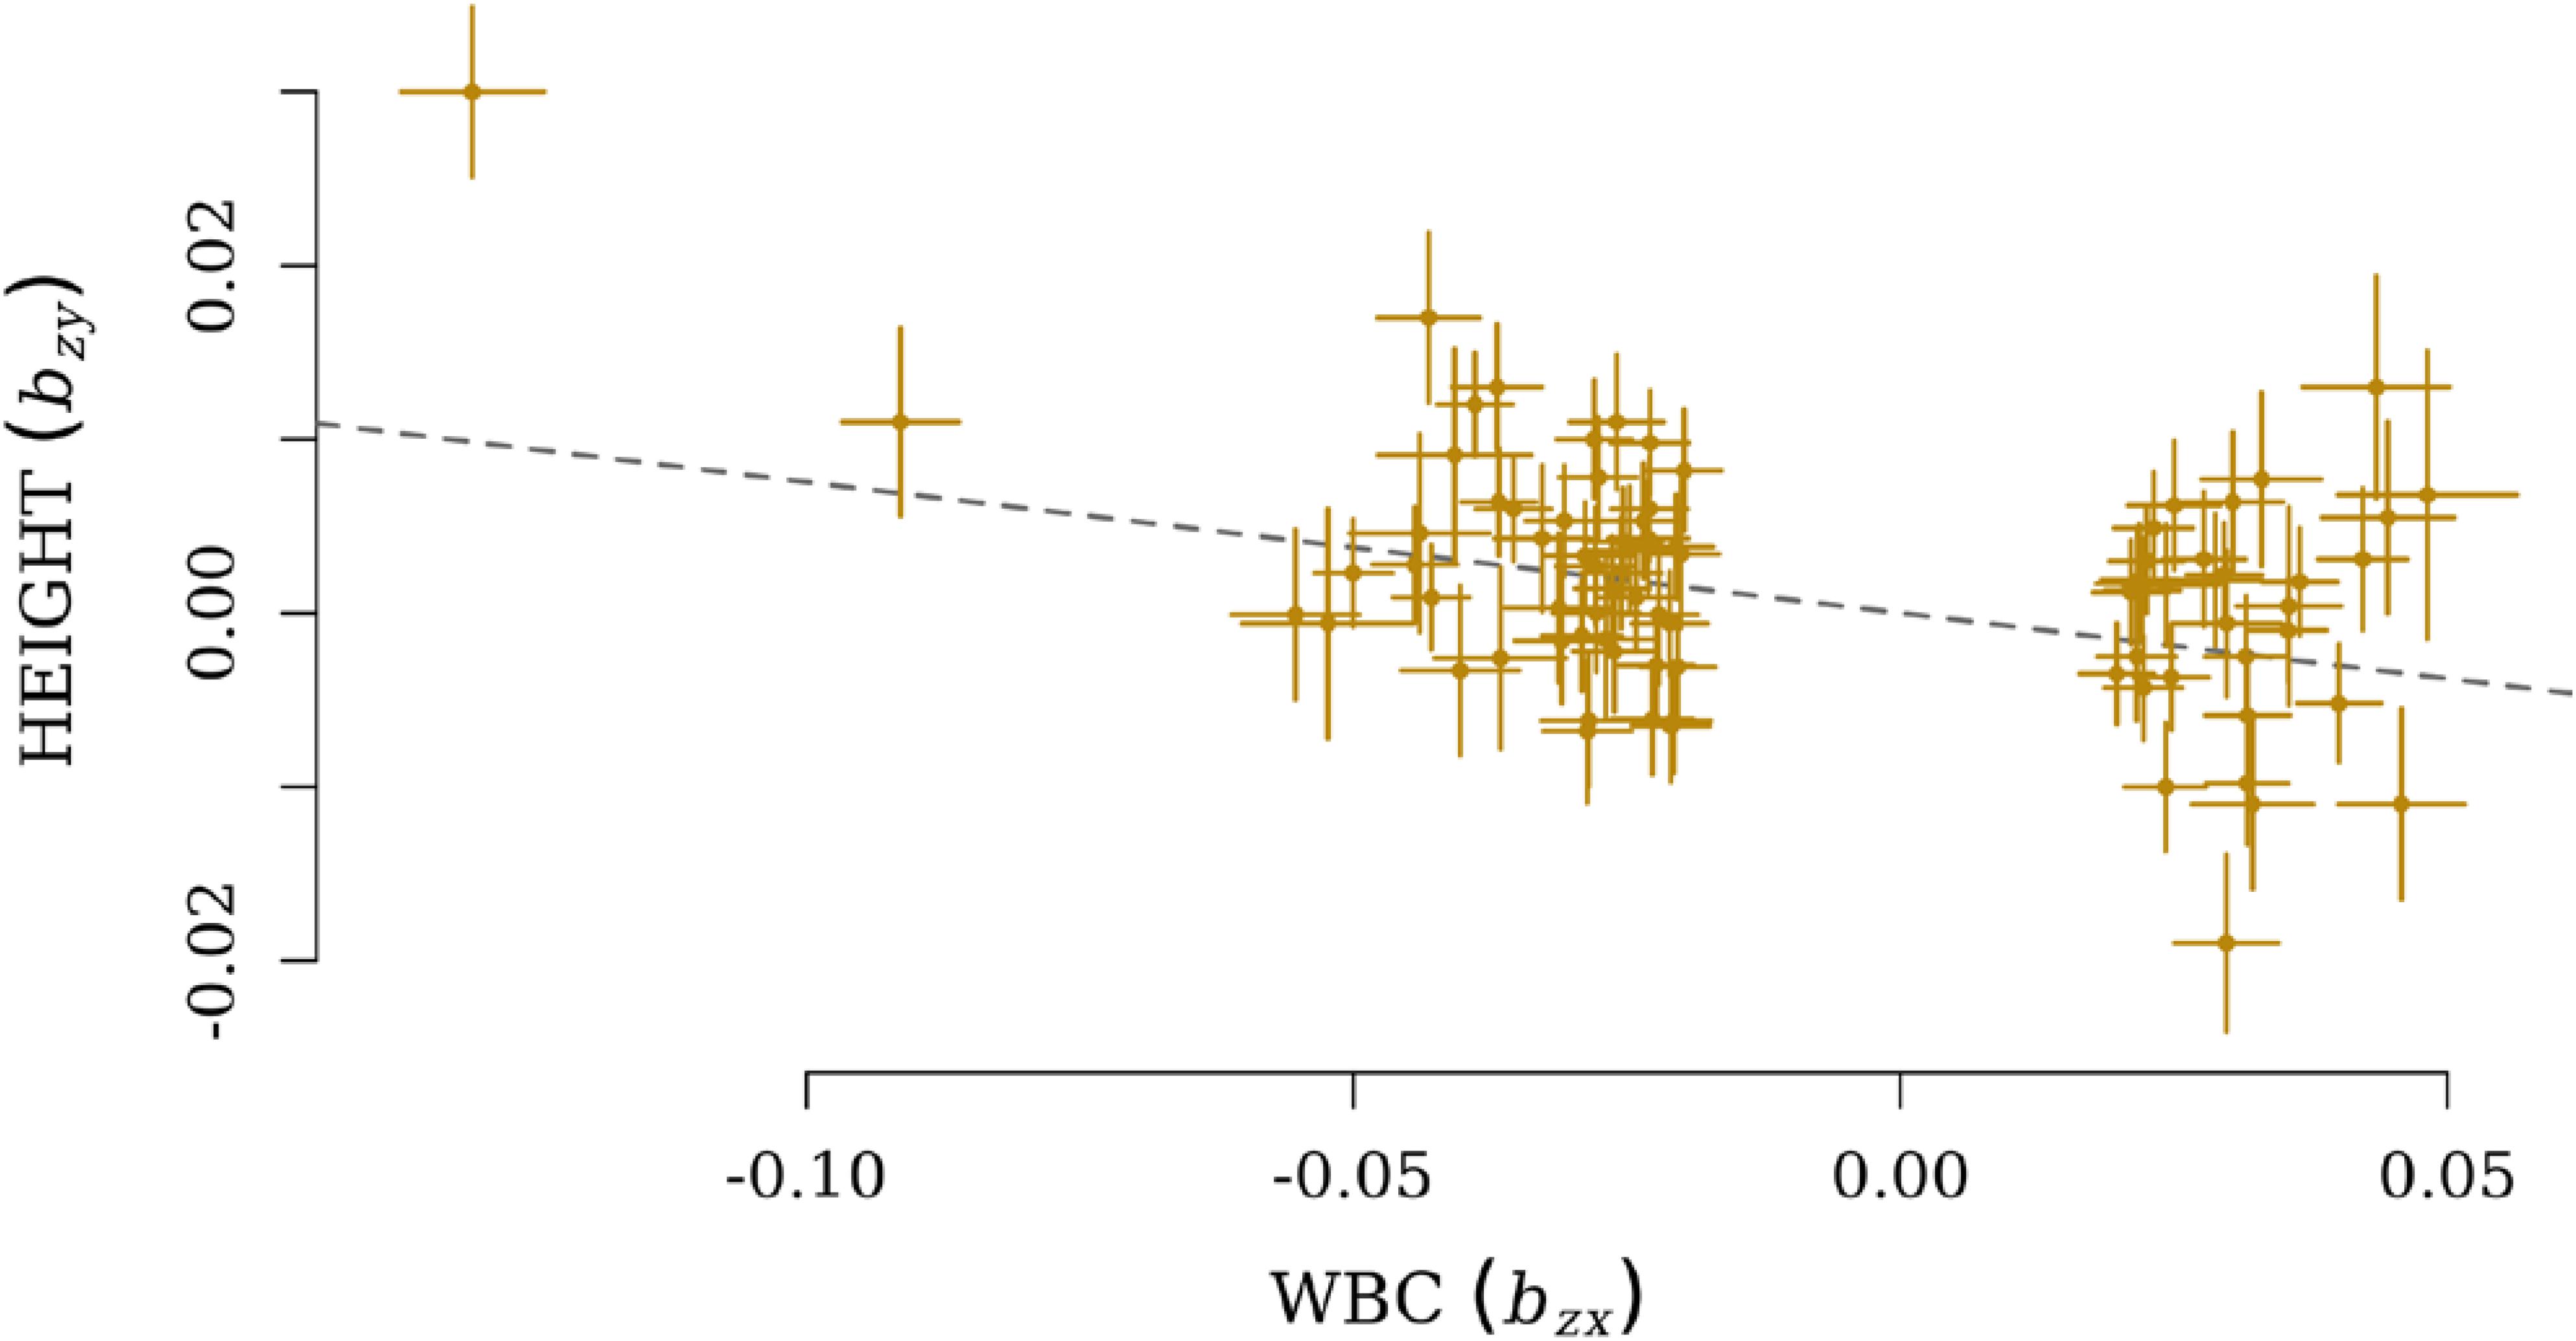
FIGURE 2. Plots of effect sizes of independent lead SNPs for WBC (bzx) on the x-axis and effect size for HEIGHT on the y-axis (bzy). The dotted line represents a line with a slope of (bxy).
Pleiotropic Variants Between Immune and Growth Traits
There were 98 genomic regions potentially containing variants related to immune and growth traits simultaneously (Supplementary Table S3). If a region was identified to be related to more than one pair of immune and growth GWAS, then it could be related to more than two phenotypes. Some regions might contain variants related to multiple phenotypes. For instance, a region (24.69–26.89 Mb) on chromosome 2 contained 5 SNPs related to three growth traits of childhood BMI (BMI), childhood obesity (OBESITY), pubertal growth (PG), and two immune diseases, CD and IBD (Supplementary Table S3). The causal genes might be ADCY3 and DNAJC27 (Table 2), which have previously been identified to be related to obesity (Stergiakouli et al., 2014) and pubertal growth (Cousminer et al., 2013), respectively. Figure 3 shows the numbers of pleiotropic regions between pair-wise immune and growth phenotypes. The pleiotropic regions were more frequently observed between the growth traits BW, HEIGHT, and birthweight (maternal) (MBW), and the immune traits WBC, CD, and IBD (Figure 3). Some regions contained causal pleiotropic variants that had previously been identified to be pleiotropic (Pickrell et al., 2016). For instance, rs13107325 located in the exonic region of zinc transporter SLC39A8 was related to ALL (Z = 4.51, P = 6.6 × 10⁻⁶), CD (Z = 7.06, P = 1.66 × 10⁻¹²), IBD (Z = 4.98, P = 6.44 × 10⁻⁷), BMI (Z = 5.70, P = 1.19 × 10⁻⁸), and HEIGHT (Z = −5.11, P = 3.3 × 10⁻⁷); rs1260326 located in the exonic region of GCKR was related to CD (Z = −6.54, P = 6.31 × 10⁻¹¹), granulocyte count (GRAN) (Z = −8.62, P = 6.81 × 10⁻¹⁸), IBD (Z = −5.33, P = 9.61 × 10⁻⁸), lymphocyte counts (LYMPH) (Z = −7.03, P = 2.11 × 10⁻¹²), MWBC (Z = −7.83, P = 4.95 × 10⁻¹⁵), NEUT (Z = −9.07, P = 1.15 × 10⁻¹⁹), WBC (Z = −9.35, P = 8.75 × 10⁻²¹), and HEIGHT (Z = 6.76, P = 1.4 × 10⁻¹¹). Table 2 lists some potential genetic variants that are both significant for immune and growth traits in these regions and genes affected by these variants. Some pleiotropic variants had opposite Z statistics for immune and growth traits. For example, the SNP (rs3184504) located in the exon of SH2B3 (Figure 4 and Table 2) was significantly associated with MBW (Z = 6.168, P = 6.9 × 10⁻¹⁰) and LYMPH (Z = −24.624, P = 6.93 × 10−134).
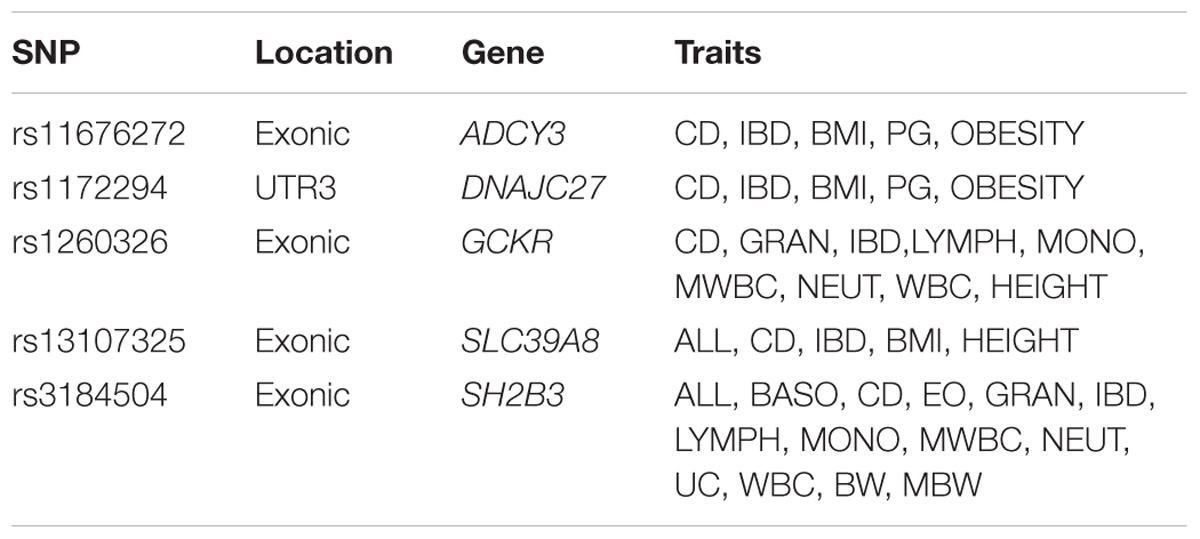
TABLE 2. Pleiotropic SNPs influencing multiple immune and growth phenotypes.
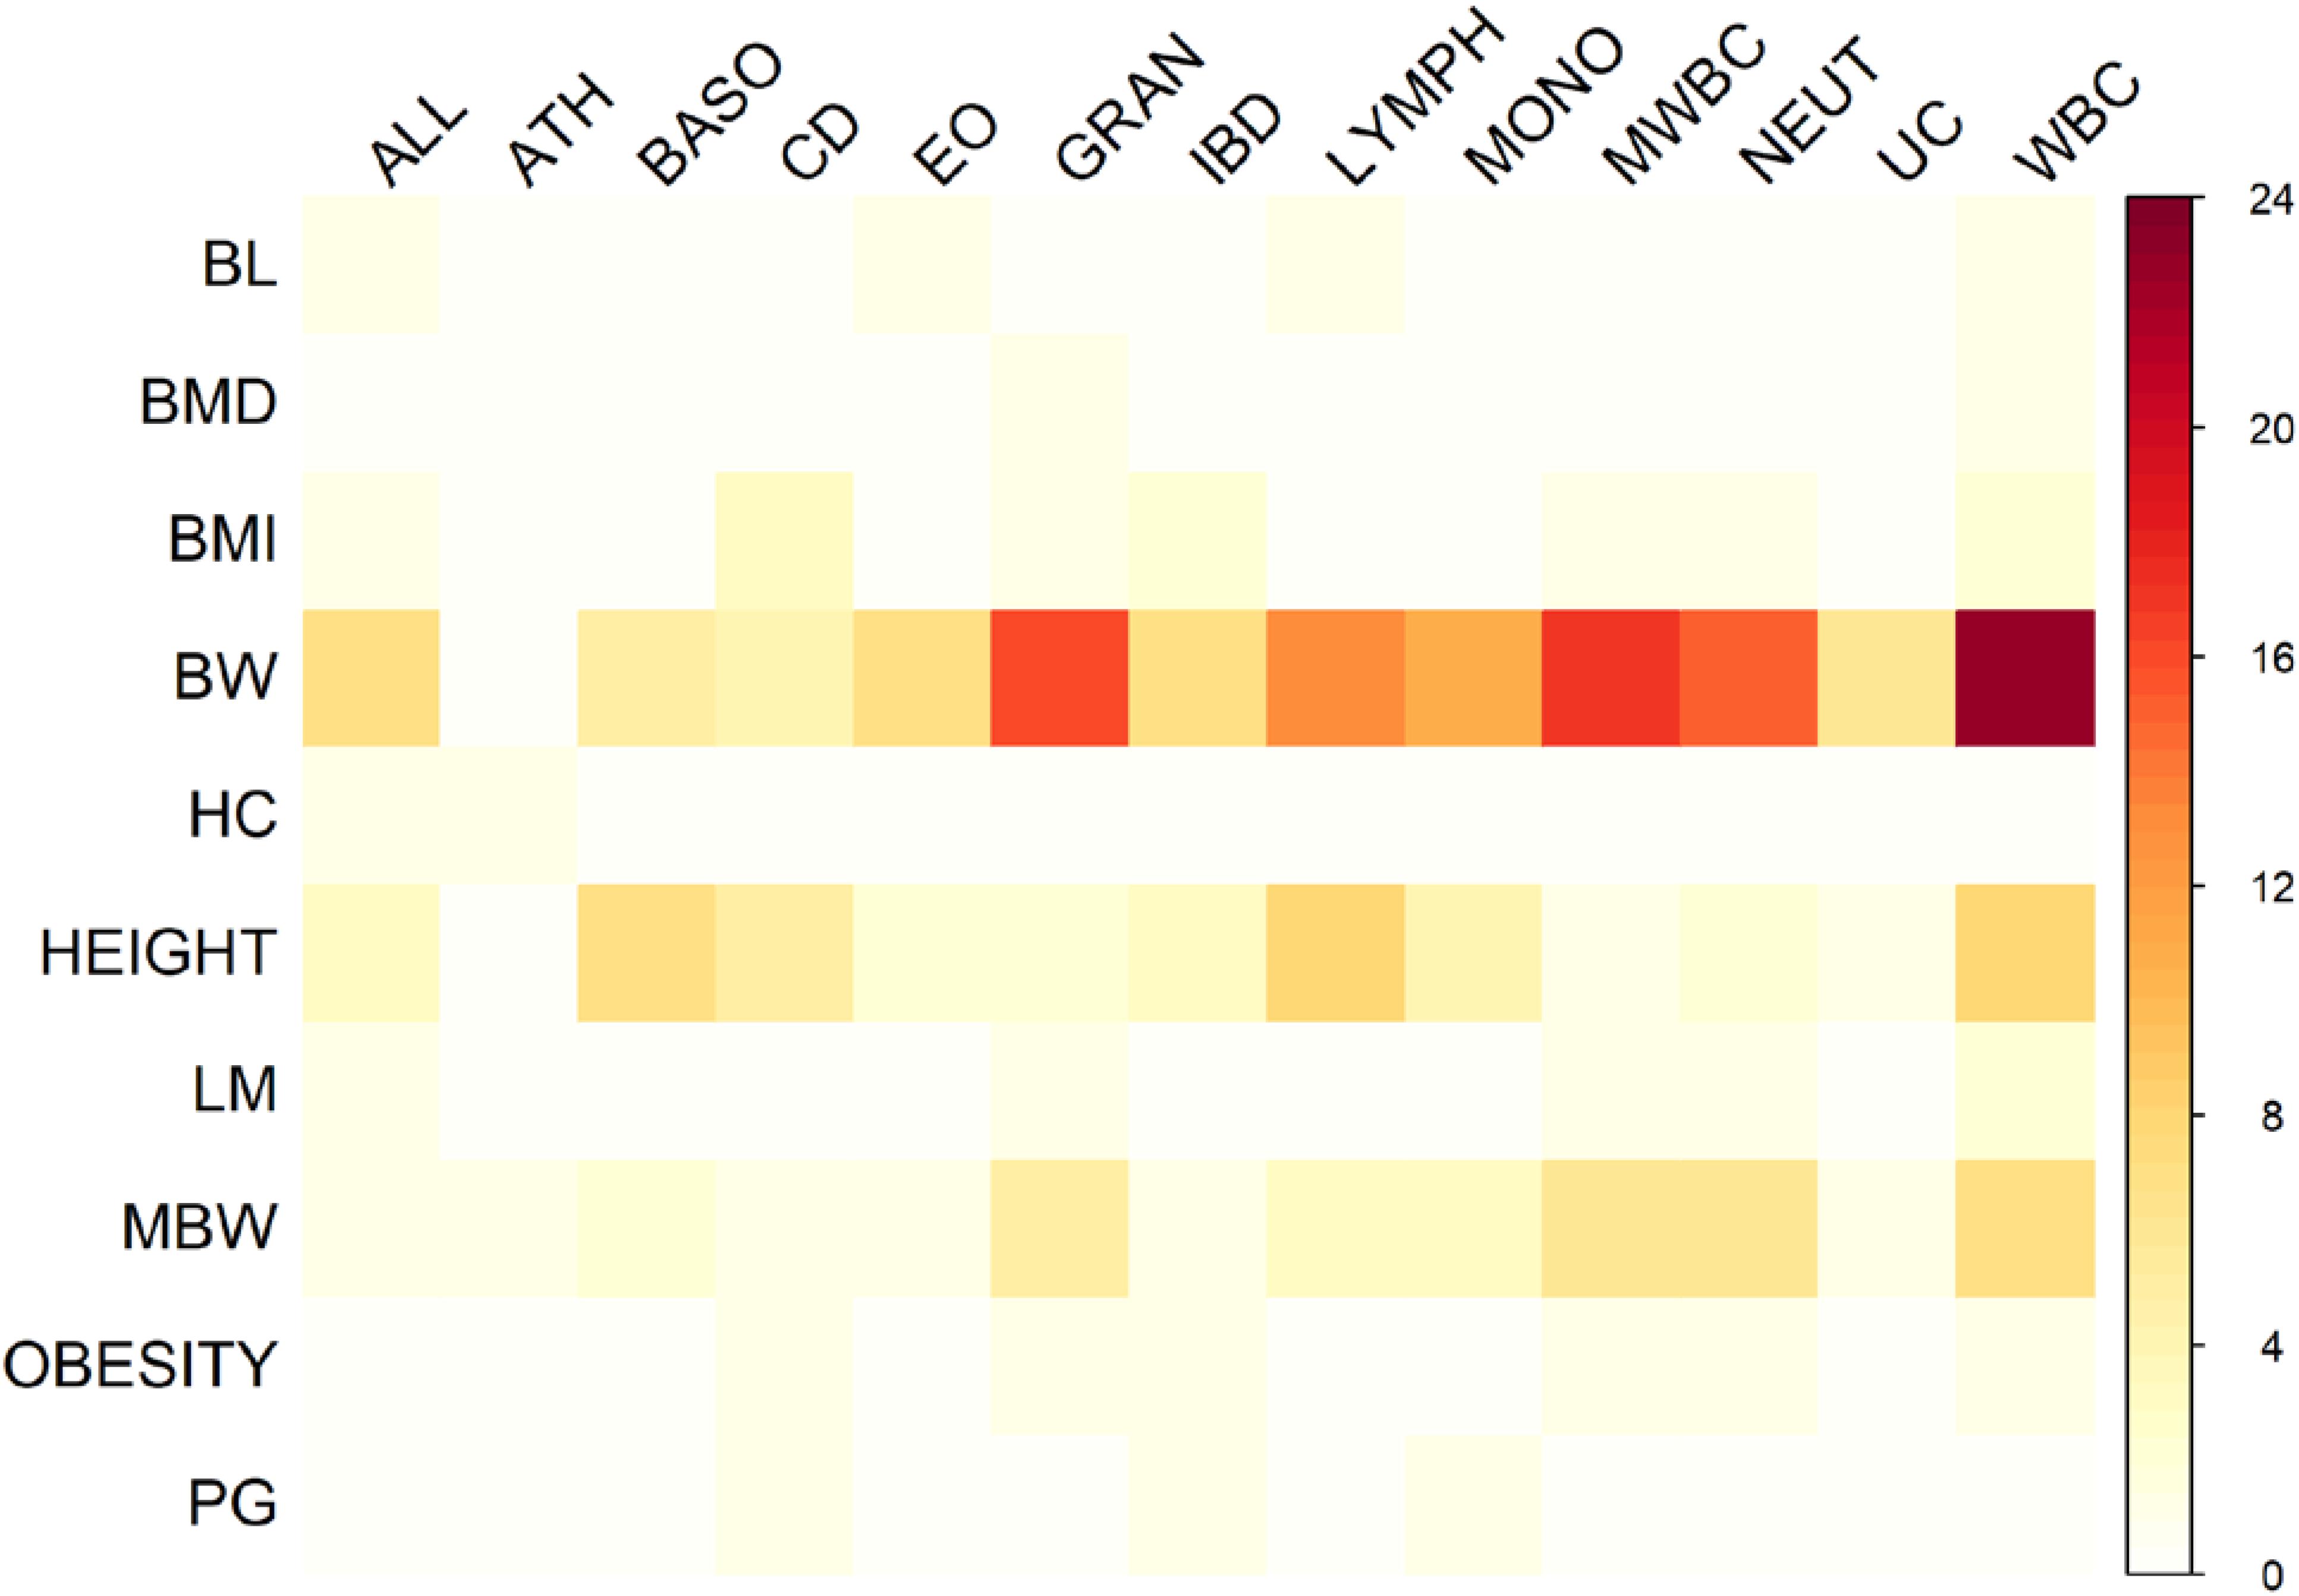
FIGURE 3. Heat map of the number of pleiotropic regions shared between immune and growth phenotypes.
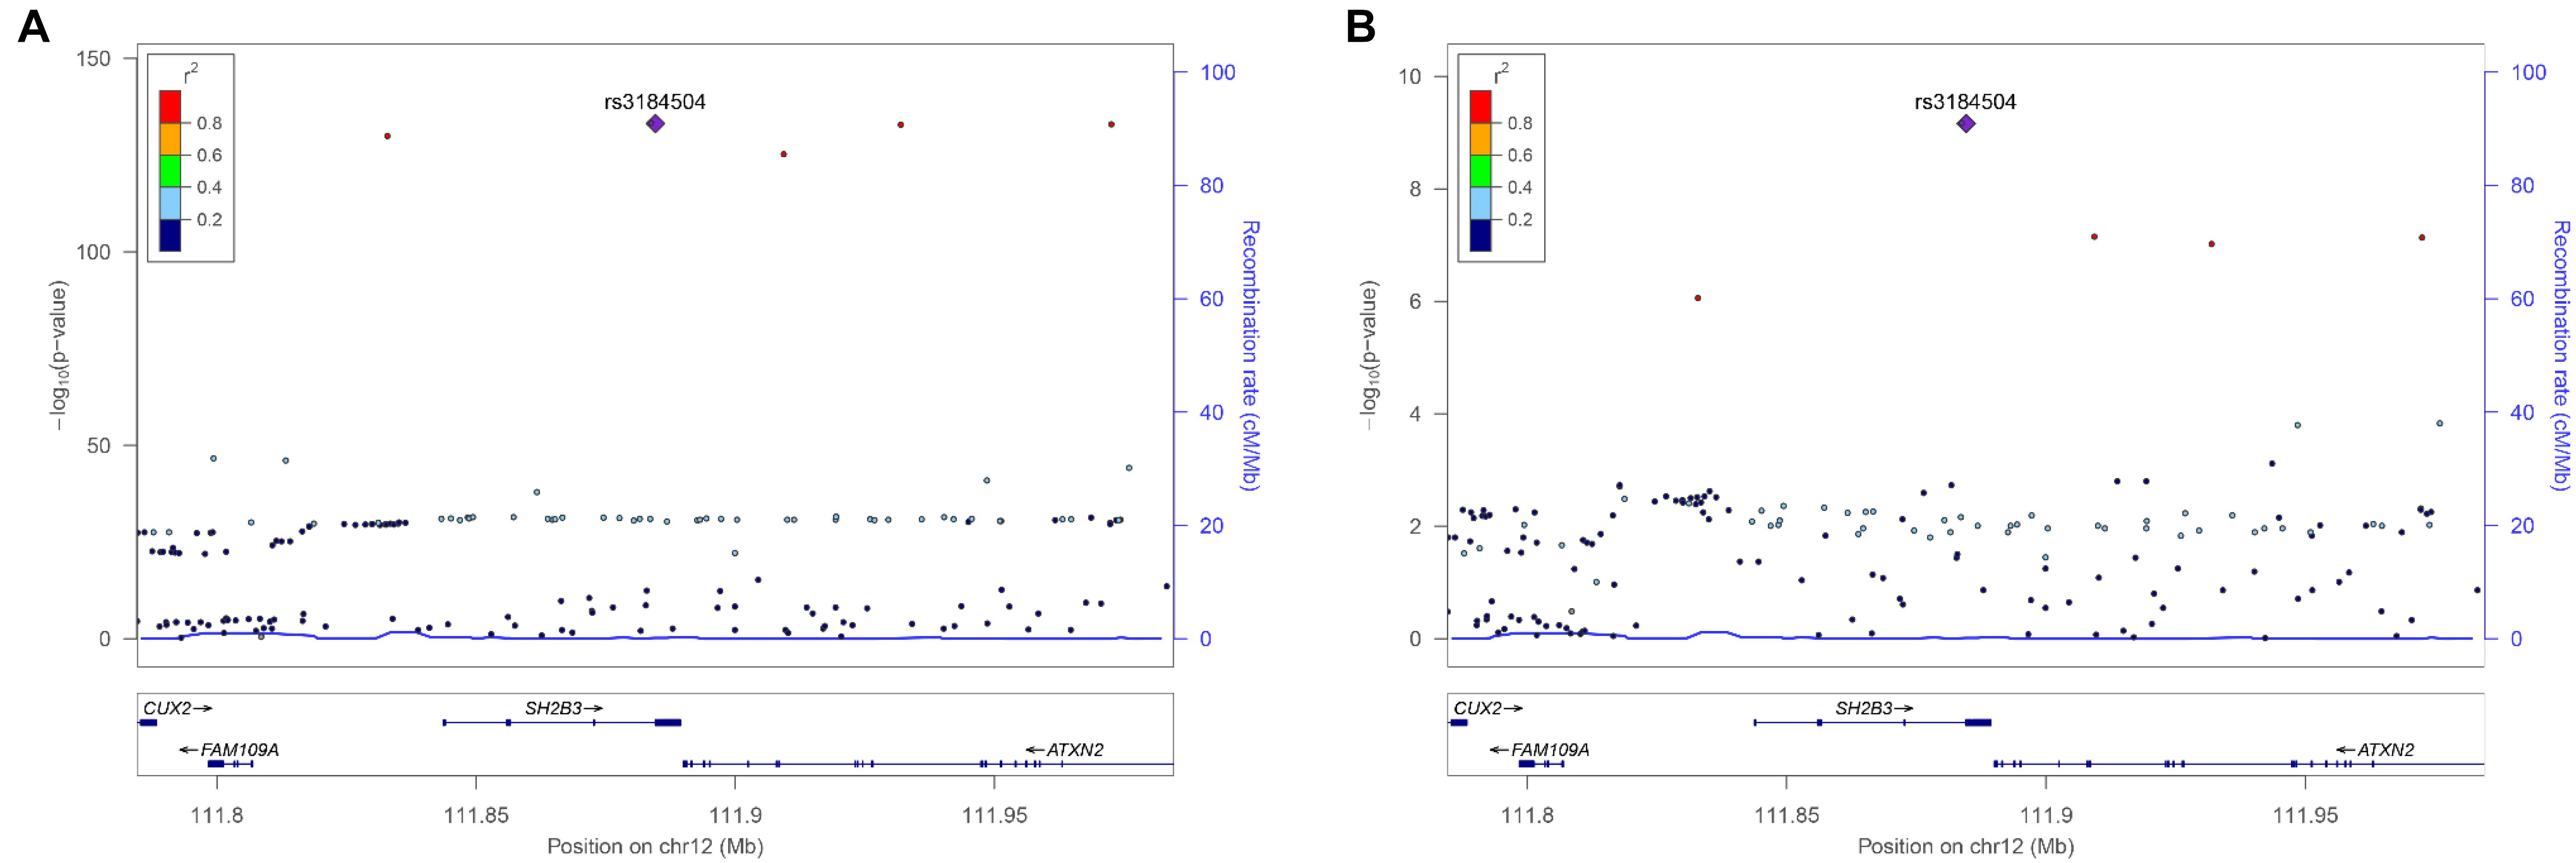
FIGURE 4. Regional association plot of a 100 kb window surrounding the pleiotropic SNP rs6569648 related to (A) HEIGHT and (B) LYMPH.
KEGG Pathways Shared Between Immune and Growth Traits
Figure 5 shows the proportions of the number of overlapping KEGG pathways between immune and growth phenotypes accounting for the size of the union set of KEGG pathways between the pair-wise phenotypes. The significant overlaps were mainly observed between growth traits BMI, GWGM, HC, HEIGHT, and PG, and immune phenotypes. Although the relationship between BW and immune phenotypes was evident in the results of cross-trait LD score regression and pairwise GWAS pleiotropy mapping, no significant overlapping KEGG pathways could be identified between BW and immune traits. Supplementary Table S4 lists the number of pathways that were included in significant overlaps between immune and growth traits. Many disease pathways are present in the top of the list, including the autoimmune diseases [systemic lupus erythematosus (hsa05322), graft-versus-host disease (hsa05332), autoimmune thyroid disease (hsa05320), and asthma (hsa05310)], as well as viral myocarditis (hsa05416) and type I diabetes mellitus (hsa04940). Some pathways were associated with immunity and growth simultaneously, such as the adipocytokine signaling pathway (hsa04920) (Ogunyemi et al., 2013; Procaccini et al., 2013) and JAK-STAT signaling pathway (hsa04630) (Wong and Fish, 2003).
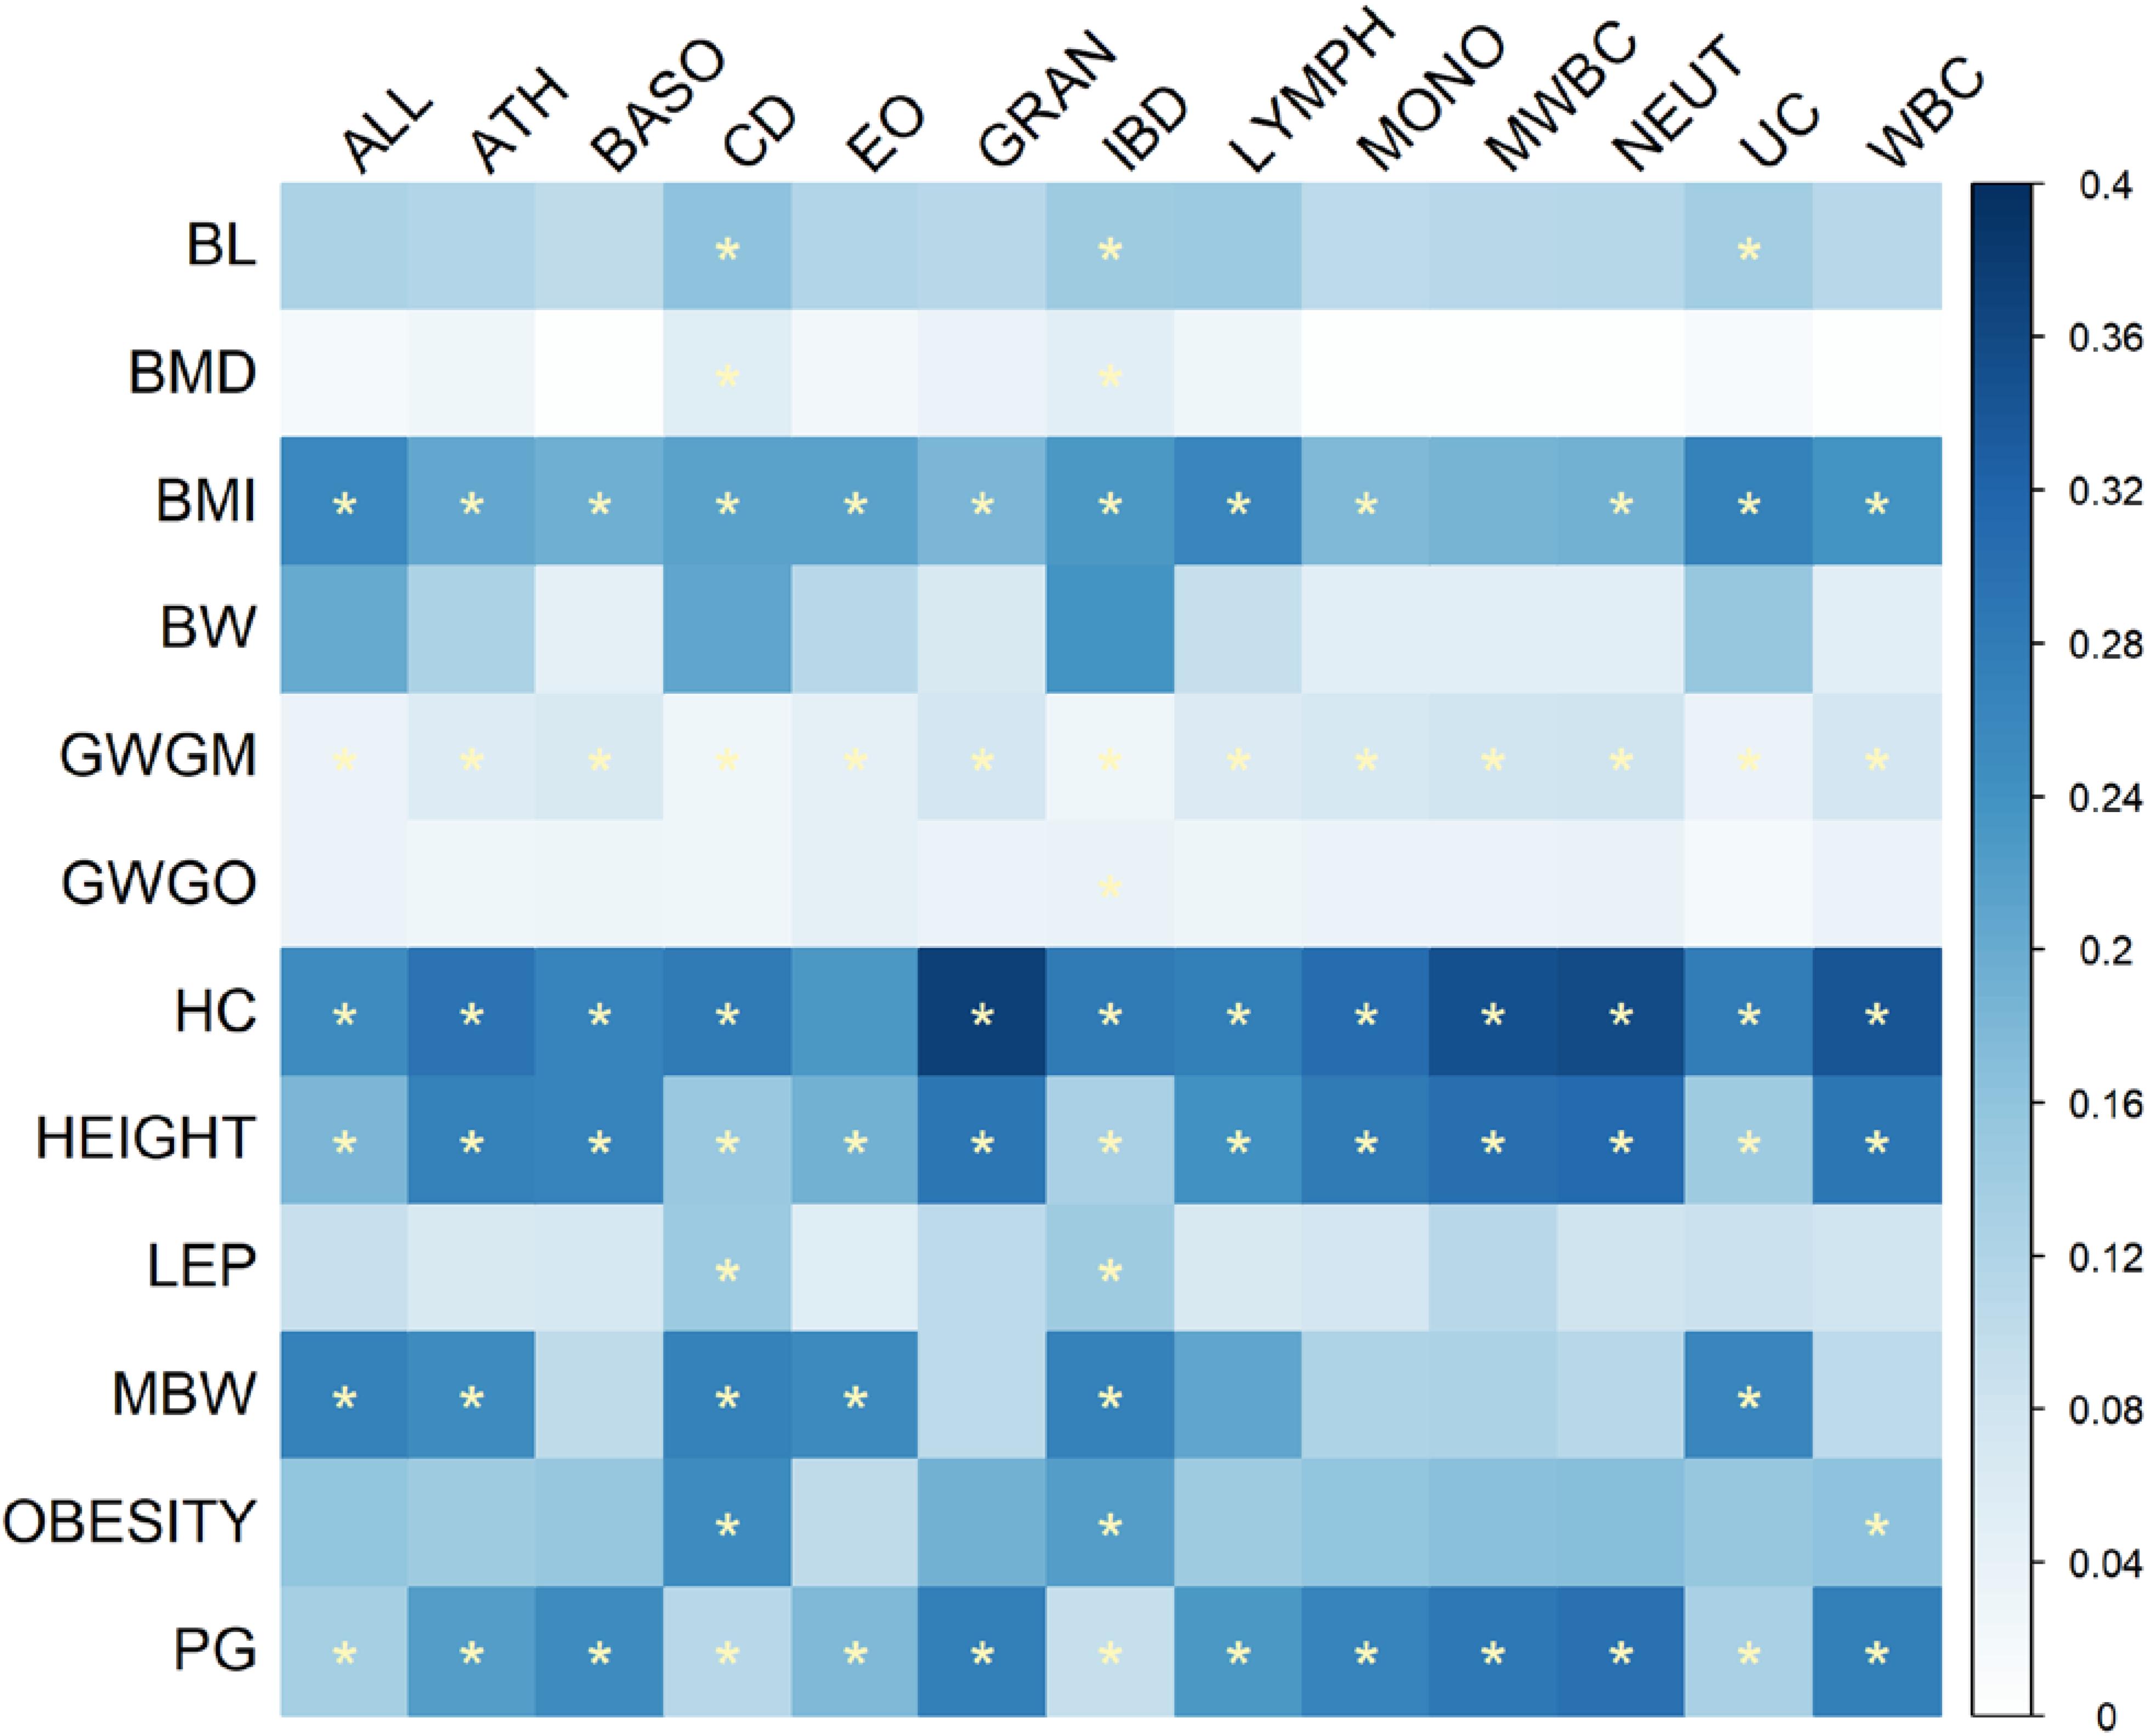
FIGURE 5. Heat map of the proportions of the number of overlapping KEGG pathways between immune and growth phenotypes accounting for the size of union set of KEGG pathways between pair-wise traits. The significant overlaps with Bonferroni-corrected P-values less than 0.05 are indicated by stars.
Discussion
Summary Statistics of Immune and Growth Traits
Although the relationship between immune and growth traits has not been explored specifically in human genetics, their cryptic association has been observed and explained in other contexts. For instance, Urlacher et al. (2018) identified the negative effect of immune activity on growth in a sample of 261 Amazonian forager-horticulturalist Shuar children, because immune function is an energetically costly physiological activity that consumes calories that are needed for less immediately essential life activities such as growth (Urlacher et al., 2018). However, the aim of the current study was to explore their relationship in the context of genetics. Many growth and immune phenotypes were included as growth and immune traits encompass wide biological concepts. Growth is the enlargement of a tissue or organism; thus, the consequence of growth is not only size (HEIGHT, BL, HC, PG, BMD), but weight-related or obesity-related traits (BW, GWGO, GWGM, LM, MBW, OBESITY, BMI, LEP). Some of the relationships among growth traits were negative. For instance, BMI, a ratio trait defined by body weight divided by the square of height, was negatively related to HEIGHT from its definition. This is also the case for LEP, as the increase of LEP levels results in decrease of obesity. In contrast, the relationships among immune traits involved in this study were simple, for the reason that a high level of immune cells in serum is often a marker of autoimmune diseases.
Genetic Correlation Between Immune and Growth Phenotypes
The result of cross-trait LD score regression (Figure 1 and Supplementary Table S1) indicated significant negative correlations between BW and immune cell counts, but there appeared to be no correlation between BW and autoimmune diseases. The original study from which the summary statistics of BW were obtained also recorded a nearly zero correlation coefficient between BW and autoimmune diseases using cross-trait LD score regression (Horikoshi et al., 2016). It has also been confirmed that children with low birthweight are prone to have low immune capacity but higher levels of serum inflammation factors (Raqib et al., 2007). Low birthweight often results from fetal insult or nutritional insufficiency and manifests an increase in immune blood cells, which can cause allergic diseases such as asthma in child- or adulthood (Shaheen et al., 1999). In contrast, the most significant positive correlation was observed between HC and EO. HC appears to have some positive relationships with autoimmune diseases, which has been affirmed in a previous study (Eviston et al., 2015), where a positive correlation between childhood allergy and in utero head circumference was reported. Negative significant correlations were observed between BMI and immune cells (Figure 1 and Supplementary Table S1), but the correlation coefficients between BMI and autoimmune diseases were all positive, although they were not significant. This inconsistent relationship might also help to explain the complex U-shaped pattern of the relationship between BMI and autoimmune diseases, suggesting that low and high BMI are both positively related to high risk of autoimmune diseases (Harpsøe et al., 2014). In addition, the significant genetic correlations were mainly between immune phenotypes and growth phenotypes measured in early age, such as BW, HC, and childhood BMI, indicating that early growth measurements may be suitable indicators for human immunity or allergic disease susceptibility in child- or adulthood. Even though the direction of these correlations varied in different pairs of phenotypes, obesity, low BW, and long HC were generally able to predict immunity problems.
Furthermore, in the absence of original information regarding the measurement of these traits, these genetic correlations might not be completely accurate simply based on summary statistics, and they should not be fully applied in other populations in different environments, as the different LD patterns and genotype by environmental interaction can cause variation in genetic correlation in different ethnic populations. In this study, we focused on the genetic correlation between immune and growth traits in European ancestry. A previous GWAS study performed in a Japanese population showed a significant positive genetic correlation between BMI and asthma, but a negative genetic correlation between BMI and rheumatoid arthritis. In addition, human height was negatively correlated with two autoimmune diseases, Graves’ disease and rheumatoid arthritis, although these correlations were not significant (Kanai et al., 2018). These results are generally consistent with the pattern of genetic correlation in our study, in which positive and negative correlations were both observed between BMI and some immune phenotypes, and negative but not significant correlations were observed between HEIGHT and immune phenotypes, indicating the accuracy of our results to some extent.
Cause and Effect Relationship Between Immune and Growth Phenotypes
The GSMR results show that HEIGHT was negatively affected by different phenotypes of immune cell count. This is consistent with the energy allocation theory, which proposes that activation of immune system has a negative effect on growth (Rauw, 2012). Meanwhile, a unique significant effect of growth on immune phenotype was determined between HEIGHT and ALL. Previous studies have found that allergic diseases such as moderate or severe asthma can cause a delay in puberty stretch and affect final adult height (Hauspie et al., 1976, 1977; Preece et al., 1986; de Góes Antonio et al., 2003). The significant cause and effect between HEIGHT and ALL did not comport with these findings, indicating the complexity of their relationship. The results of GSMR were not consistent with the results that indicated no significant genetic correlation between HEIGHT and immune phenotypes. This might be because the cause and effect relationship between human height and immunity was explored by GWS SNPs shared between the two traits, while the genetic correlations were calculated using overlapping SNP effects across the whole genome. The statistical power of the GSMR analysis increases with the number of instrumental SNPs (Zhu et al., 2018). The small numbers of GWS SNPs for many growth phenotypes were not sufficient for GSMR (at least 10 independent GWS SNPs are required to perform the test); thus, except for HEIGHT, no significant causation relationship was identified for all other growth traits. In addition, with the HEIDI-outlier filtering pleiotropic SNPs, GSMR would further reduce the number of GWS SNPs used. HEIDI-outlier was used to filter SNPs that deviated from the hypothesis under the causal model that the expected values of estimated effects from exposure on outcome were identical for any instrumental SNP. Only five significant pairs were identified after HEIDI-outlier filtration, indicating that the link between growth and immunity might not fully be a cause and effect relationship. HEIDI-outlier was designed to reduce the inflation of GSMR, but not for identification of the true pleiotropic loci that have effects on multiple phenotypes simultaneously.
Identification of Pleiotropic Variants
In this study, we used a hierarchical method to identify pleiotropic SNPs between pairs of immune and growth phenotypes. Methods such as moloc (Giambartolomei et al., 2018), which can identify pleiotropic loci for more than two traits, have high computational demand, and were thus not suitable given the fact that 26 phenotypes were involved in this study. In addition, gwas-pw has the potential to locate pleiotropic loci related to multiple traits. For instance, if the pairwise scan for phenotypes A and B, and phenotypes B and C were both indicated in the same region, it can be counted as those three phenotypes (A, B, and C) sharing an association in the same region (Pickrell et al., 2016). Some multiple-trait sharing regions were consistent with previous results, and some pleiotropic SNPs in this study were also detected in a previous study that explored pleiotropy among many different kinds of phenotypes (Pickrell et al., 2016), such as rs3184504 located in SH2B3, rs13107325 in SLC39A8 gene and rs1260326 located in GCKR. The identification of the pleiotropy of these SNPs for immune and growth traits extended their functional spectrum in different traits. This also means that some pleiotropy among different traits can be explained by the same genetic variants (Visscher et al., 2017). In the era of precision medicine or genome editing, this pleiotropy indicates that it is not adequate to simply focus on a single phenotype, especially when the variants play opposite roles in various phenotypes (Parkes et al., 2013; Gratten and Visscher, 2016). However, for some quantitative phenotypes with polygenic backgrounds, pleiotropy mapping can be helpful not only in guiding drug development or genome editing to avoid loci with opposite functions on multiple phenotypes, but also to focus on the loci that contribute to the multiple phenotypes of interest simultaneously.
Several genes containing pleiotropic SNPs were indeed associated with growth and immune traits. For instance, SH2B3 (Figure 4) is known to regulate cytokine and growth factor signals (Mori et al., 2014). Some pleiotropic findings were in causal genes, which support energy allocation theory for the relationship between immunity and growth. For instance, ADCY3, an obesity related gene, plays a role in energy homeostasis (Saeed et al., 2018). Meanwhile, it can catalyze the formation of cyclic AMP and regulate dendritic cells in the immune response (Chinn et al., 2016). In addition, gwas-pw could not distinguish a single causal variant that is pleiotropic (model 3) from 2 independent causal variants (model 4) if there existed strong LD between the two variants (Pickrell et al., 2016), although these variants could explain the genetic correlation between phenotypes in the context spurious pleiotropy (Solovieff et al., 2013).
Mediated Pleiotropy Indicated by Sharing Pathways
Mediated pleiotropy is another type of pleiotropy (Solovieff et al., 2013) that describes different traits-related genes interacting with each other in pathways or networks (Zhang et al., 2016). The significantly shared pathways (Figure 5) helped complement the genetic explanations of the correlation between immune and growth traits. Although significant genetic correlations were observed between BW and immune traits, there was no pathway significantly shared between them, indicating that the genetic correlation between them primarily results from biological or spurious pleiotropy. The most frequent KEGG pathways included in significant overlaps between immune and growth phenotypes were associated with autoimmune diseases, such as systemic lupus erythematosus (hsa05322) (Supplementary Table S4). Some studies have suggested the relationship between obesity and autoimmune diseases (Harpsøe et al., 2014; Versini et al., 2014). Thus, as a risk factor, obesity might influence autoimmune disease through these pathways. In addition, the growth and immune functions can play roles in common diseases, as in the case of type I diabetes mellitus (hsa04940), which was affected by GH (Holly et al., 1988) and immune dysfunction (Geerlings and Hoepelman, 1999). These findings again indicate the importance of growth measurement for diagnosis of immunity-related diseases, and vice versa.
Conclusion
In this study, we explored the genetic correlation between growth and immune phenotypes using summary statistics of a number of different GWAS. The results show that the directions of these correlations varied in different pairs of phenotypes. In addition, there was a negative cause and effect relationship between height and some phenotypes of immune cell count or allergic disease, which bolsters the energy allocation theory of the relationship between growth and immune traits. The identification of several pleiotropic variants, genomic regions, and pathways extend the pleiotropy of some SNPs and is helpful in our understanding of the genetic background of the relationship between growth and immune traits, and is meaningful for disease diagnosis and drug development.
URLs
EGG, http://egg-consortium.org/; GIANT, http://portals.broadinstitute.org/collaboration/giant/index.php/; GWAS Catalog, http://www.ebi.ac.uk/gwas/downloads/summary-statistics; 1000 Genomes Project, http://www.1000genomes.org/; ldsc, https://github.com/bulik/ldsc/; LD score, https://data.broadinstitute.org/alkesgroup/LDSCORE/; GSMR, http://cnsgenomics.com/software/gsmr/; LD blocks, https://bitbucket.org/nygcresearch/ldetect-data; gwas-pw, https://github.com/joepickrell/gwas-pw; ANNOVAR, http://annovar.openbioinformatics.org/en/latest/; GSA-SNP2, https://sourceforge.net/projects/gsasnp2/.
Author Contributions
YP and QW conceived and designed the whole study. ZZ, PM, QL, QX, HS, and BO performed the analysis. ZZ wrote the manuscript. All authors reviewed and approved the manuscript.
Funding
This work was supported by the National Natural Science Foundation of China (Nos. 31472069 and 31672386).
Conflict of Interest Statement
The authors declare that the research was conducted in the absence of any commercial or financial relationships that could be construed as a potential conflict of interest.
Acknowledgments
We would like to gratefully acknowledge the original GWAS studies and the databases, EGG, GIANT, GWAS Catalog, where the data used in this study are managed and reserved.
Supplementary Material
The Supplementary Material for this article can be found online at: https://www.frontiersin.org/articles/10.3389/fgene.2018.00393/full#supplementary-material
References
Astle, W. J., Elding, H., Jiang, T., Allen, D., Ruklisa, D., Mann, A. L., et al. (2016). The allelic landscape of human blood cell trait variation and links to common complex disease. Cell 167, 1415–1429.e19. doi: 10.1016/j.cell.2016.10.042
Beaumont, R. N., Warrington, N. M., Cavadino, A., Tyrrell, J., Nodzenski, M., Horikoshi, M., et al. (2018). Genome-wide association study of offspring birth weight in 86,577 women identifies five novel loci and highlights maternal genetic effects that are independent of fetal genetics. Hum. Mol. Genet. 27, 742–756. doi: 10.1093/hmg/ddx429
Bolormaa, S., Pryce, J. E., Reverter, A., Zhang, Y., Barendse, W., Kemper, K., et al. (2014). A multi-trait, meta-analysis for detecting pleiotropic polymorphisms for stature, fatness and reproduction in beef cattle. PLoS Genet. 10:e1004198. doi: 10.1371/journal.pgen.1004198
Bradfield, J. P., Taal, H. R., Timpson, N. J., Scherag, A., Lecoeur, C., Warrington, N. M., et al. (2012). A genome-wide association meta-analysis identifies new childhood obesity loci. Nat. Genet. 44, 526–531. doi: 10.1038/ng.2247
Bulik-Sullivan, B., Finucane, H. K., Anttila, V., Gusev, A., Day, F. R., Loh, P.-R., et al. (2015). An atlas of genetic correlations across human diseases and traits. Nat. Genet. 47, 1236–1241. doi: 10.1038/ng.3406
Chinn, A. M., Lee, J., Herdman, S., Raz, E., and Insel, P. A. (2016). Involvement of the cyclic AMP pathway in dendritic cell regulation of Th2 immune responses. FASEB J. 30, 969.19
Clapperton, M., Diack, A. B., Matika, O., Glass, E. J., Gladney, C. D., Mellencamp, M. A., et al. (2009). Traits associated with innate and adaptive immunity in pigs: heritability and associations with performance under different health status conditions. Genet. Sel. Evol. 41:54. doi: 10.1186/1297-9686-41-54
Cousminer, D. L., Berry, D. J., Timpson, N. J., Ang, W., Thiering, E., Byrne, E. M., et al. (2013). Genome-wide association and longitudinal analyses reveal genetic loci linking pubertal height growth, pubertal timing and childhood adiposity. Hum. Mol. Genet. 22, 2735–2747. doi: 10.1093/hmg/ddt104
Davey Smith, G., and Hemani, G. (2014). Mendelian randomization: genetic anchors for causal inference in epidemiological studies. Hum. Mol. Genet. 23, R89–R98. doi: 10.1093/hmg/ddu328
de Góes Antonio, M.Â. R., Ribeiro, J. D., Toro, A. A. D. C., Piedrabuena, A. E., and Morcillo, A. M. (2003). Linear growth in asthmatic children. J. Pneumol. 29, 36–42. doi: 10.1590/S0102-35862003000100008
de Lange, K. M., Moutsianas, L., Lee, J. C., Lamb, C. A., Luo, Y., Kennedy, N. A., et al. (2017). Genome-wide association study implicates immune activation of multiple integrin genes in inflammatory bowel disease. Nat. Genet. 49, 256–261. doi: 10.1038/ng.3760
Demenais, F., Margaritte-Jeannin, P., Barnes, K. C., Cookson, W. O., Altmüller, J., Ang, W., et al. (2018). Multiancestry association study identifies new asthma risk loci that colocalize with immune-cell enhancer marks. Nat. Genet. 50, 42–53. doi: 10.1038/s41588-017-0014-7
Donnelly, P. (2008). Progress and challenges in genome-wide association studies in humans. Nature 456, 728–731. doi: 10.1038/nature07631
Eviston, D. P., Minasyan, A., Mann, K. P., Campbell, D. E., and Nanan, R. K. (2015). In utero head circumference is associated with childhood allergy. Front. Pediatr. 3:73. doi: 10.3389/fped.2015.00073
Felix, J. F., Bradfield, J. P., Monnereau, C., Van Der Valk, R. J., Stergiakouli, E., Chesi, A., et al. (2015). Genome-wide association analysis identifies three new susceptibility loci for childhood body mass index. Hum. Mol. Genet. 25, 389–403. doi: 10.1093/hmg/ddv472
Ferreira, M. A., Vonk, J. M., Baurecht, H., Marenholz, I., Tian, C., Hoffman, J. D., et al. (2017). Shared genetic origin of asthma, hay fever and eczema elucidates allergic disease biology. Nat. Genet. 49, 1752–1757. doi: 10.1038/ng.3985
Geerlings, S. E., and Hoepelman, A. I. (1999). Immune dysfunction in patients with diabetes mellitus (DM). Pathog. Dis. 26, 259–265. doi: 10.1111/j.1574-695X.1999.tb01397.x
Giambartolomei, C., Vukcevic, D., Schadt, E. E., Franke, L., Hingorani, A. D., Wallace, C., et al. (2014). Bayesian test for colocalisation between pairs of genetic association studies using summary statistics. PLoS Genet. 10:e1004383. doi: 10.1371/journal.pgen.1004383
Giambartolomei, C., Zhenli Liu, J., Zhang, W., Hauberg, M., Shi, H., Boocock, J., et al. (2018). A bayesian framework for multiple trait colocalization from summary association statistics. Bioinformatics 34, 2538–2545. doi: 10.1093/bioinformatics/bty147
Gratten, J., and Visscher, P. M. (2016). Genetic pleiotropy in complex traits and diseases: implications for genomic medicine. Genome Med. 8:78. doi: 10.1186/s13073-016-0332-x
Greer, A. (2008). Trade-offs and benefits: implications of promoting a strong immunity to gastrointestinal parasites in sheep. Parasite Immunol. 30, 123–132. doi: 10.1111/j.1365-3024.2008.00998.x
Han, B., Pouget, J. G., Slowikowski, K., Stahl, E., Lee, C. H., Diogo, D., et al. (2016). A method to decipher pleiotropy by detecting underlying heterogeneity driven by hidden subgroups applied to autoimmune and neuropsychiatric diseases. Nat. Genet. 48, 803–810. doi: 10.1038/ng.3572
Harpsøe, M. C., Basit, S., Andersson, M., Nielsen, N. M., Frisch, M., Wohlfahrt, J., et al. (2014). Body mass index and risk of autoimmune diseases: a study within the Danish National Birth Cohort. Int. J. Epidemiol. 43, 843–855. doi: 10.1093/ije/dyu045
Hauspie, R., Susanne, C., and Alexander, F. (1976). A mixed longitudinal study of the growth in height and weight in asthmastic children. Hum. Biol. 48, 271–283.
Hauspie, R., Susanne, C., and Alexander, F. (1977). Maturational delay and temporal growth retardation in asthmatic boys. J. Allergy Clin. Immunol. 59, 200–206. doi: 10.1016/0091-6749(77)90150-6
Hindorff, L. A., Sethupathy, P., Junkins, H. A., Ramos, E. M., Mehta, J. P., Collins, F. S., et al. (2009). Potential etiologic and functional implications of genome-wide association loci for human diseases and traits. Proc. Natl. Acad. Sci. U.S.A. 106, 9362–9367. doi: 10.1073/pnas.0903103106
Holly, J., Amiel, S., Sandhu, R., Rees, L., and Wass, J. (1988). The role of growth hormone in diabetes mellitus. J. Endocrinol. 118, 353–364. doi: 10.1677/joe.0.1180353
Horikoshi, M., Beaumont, R. N., Day, F. R., Warrington, N. M., Kooijman, M. N., Fernandez-Tajes, J., et al. (2016). Genome-wide associations for birth weight and correlations with adult disease. Nature 538, 248–252. doi: 10.1038/nature19806
Johnson, L., Llewellyn, C. H., Van Jaarsveld, C. H., Cole, T. J., and Wardle, J. (2011). Genetic and environmental influences on infant growth: prospective analysis of the Gemini twin birth cohort. PLoS One 6:e19918. doi: 10.1371/journal.pone.0019918
Kanai, M., Akiyama, M., Takahashi, A., Matoba, N., Momozawa, Y., Ikeda, M., et al. (2018). Genetic analysis of quantitative traits in the Japanese population links cell types to complex human diseases. Nat. Genet. 50, 390–400. doi: 10.1038/s41588-018-0047-6
Kilpeläinen, T. O., Carli, J. F. M., Skowronski, A. A., Sun, Q., Kriebel, J., Feitosa, M. F., et al. (2016). Genome-wide meta-analysis uncovers novel loci influencing circulating leptin levels. Nat. Commun. 7:10494. doi: 10.1038/ncomms10494
Klasing, K. C. (1988). Nutritional aspects of leukocytic cytokines. J. Nutr. 118, 1436–1446. doi: 10.1093/jn/118.12.1436
Larder, R., Sim, M. M., Gulati, P., Antrobus, R., Tung, Y. L., Rimmington, D., et al. (2017). Obesity-associated gene TMEM18 has a role in the central control of appetite and body weight regulation. Proc. Natl. Acad. Sci. U.S.A. 114, 9421–9426. doi: 10.1073/pnas.1707310114
Macgregor, S., Cornes, B. K., Martin, N. G., and Visscher, P. M. (2006). Bias, precision and heritability of self-reported and clinically measured height in Australian twins. Hum. Genet. 120, 571–580. doi: 10.1007/s00439-006-0240-z
Mangino, M., Roederer, M., Beddall, M. H., Nestle, F. O., and Spector, T. D. (2017). Innate and adaptive immune traits are differentially affected by genetic and environmental factors. Nat. Commun. 8:13850. doi: 10.1038/ncomms13850
Meazza, C., Pagani, S., Travaglino, P., and Bozzola, M. (2004). Effect of growth hormone (GH) on the immune system. Pediatr. Endocrinol. Rev. 1, 490–495.
Medina-Gomez, C., Kemp, J. P., Dimou, N. L., Kreiner, E., Chesi, A., Zemel, B. S., et al. (2017). Bivariate genome-wide association meta-analysis of pediatric musculoskeletal traits reveals pleiotropic effects at the SREBF1/TOM1L2 locus. Nat. Commun. 8:121. doi: 10.1038/s41467-017-00108-3
Mori, T., Iwasaki, Y., Seki, Y., Iseki, M., Katayama, H., Yamamoto, K., et al. (2014). Lnk/Sh2b3 controls the production and function of dendritic cells and regulates the induction of IFN-γ–producing T cells. J. Immunol. 193, 1728–1736. doi: 10.4049/jimmunol.1303243
Ogata, T. (2006). Genetics of human growth. Clin. Pediatric Endocrinol. 15, 45–53. doi: 10.1297/cpe.15.45
Ogunyemi, D., Xu, J., Mahesan, A. M., Rad, S., Kim, E., Yano, J., et al. (2013). Differentially expressed genes in adipocytokine signaling pathway of adipose tissue in pregnancy. J. Diabetes Mellit. 3, 86–95. doi: 10.4236/jdm.2013.32013
Ozaki, K., and Leonard, W. J. (2002). Cytokine and cytokine receptor pleiotropy and redundancy. J. Biol. Chem. 277, 29355–29358. doi: 10.1074/jbc.R200003200
Parkes, M., Cortes, A., Van Heel, D. A., and Brown, M. A. (2013). Genetic insights into common pathways and complex relationships among immune-mediated diseases. Nat. Rev. Genet. 14, 661–673. doi: 10.1038/nrg3502
Pickrell, J. K., Berisa, T., Liu, J. Z., Ségurel, L., Tung, J. Y., and Hinds, D. A. (2016). Detection and interpretation of shared genetic influences on 42 human traits. Nat. Genet. 48, 709–717. doi: 10.1038/ng.3570
Preece, M., Law, C., and Davies, P. (1986). 2 The growth of children with chronic paediatric disease. Clin. Endocrinol. Metab. 15, 453–477. doi: 10.1016/S0300-595X(86)80006-8
Procaccini, C., De Rosa, V., Galgani, M., Carbone, F., La Rocca, C., Formisano, L., et al. (2013). Role of adipokines signaling in the modulation of T cells function. Front. Immunol. 4:332. doi: 10.3389/fimmu.2013.00332
Purcell, S., Neale, B., Todd-Brown, K., Thomas, L., Ferreira, M. A., Bender, D., et al. (2007). PLINK: a tool set for whole-genome association and population-based linkage analyses. Am. J. Hum. Genet. 81, 559–575. doi: 10.1086/519795
Raqib, R., Alam, D. S., Sarker, P., Ahmad, S. M., Ara, G., Yunus, M., et al. (2007). Low birth weight is associated with altered immune function in rural Bangladeshi children: a birth cohort study. Am. J. Clin. Nutr. 85, 845–852. doi: 10.1093/ajcn/85.3.845
Rauw, W. M. (2012). Immune response from a resource allocation perspective. Front. Genet. 3:267. doi: 10.3389/fgene.2012.00267
Roederer, M., Quaye, L., Mangino, M., Beddall, M. H., Mahnke, Y., Chattopadhyay, P., et al. (2015). The genetic architecture of the human immune system: a bioresource for autoimmunity and disease pathogenesis. Cell 161, 387–403. doi: 10.1016/j.cell.2015.02.046
Saeed, S., Bonnefond, A., Tamanini, F., Mirza, M. U., Manzoor, J., Janjua, Q. M., et al. (2018). Loss-of-function mutations in ADCY3 cause monogenic severe obesity. Nat. Genet. 50, 175–179. doi: 10.1038/s41588-017-0023-6
Shaheen, S. O., Sterne, J. A., Montgomery, S. M., and Azima, H. (1999). Birth weight, body mass index and asthma in young adults. Thorax 54, 396–402. doi: 10.1136/thx.54.5.396
Silventoinen, K., Sammalisto, S., Perola, M., Boomsma, D. I., Cornes, B. K., Davis, C., et al. (2003). Heritability of adult body height: a comparative study of twin cohorts in eight countries. Twin Res. Hum. Genet. 6, 399–408. doi: 10.1375/136905203770326402
Solovieff, N., Cotsapas, C., Lee, P. H., Purcell, S. M., and Smoller, J. W. (2013). Pleiotropy in complex traits: challenges and strategies. Nat. Rev. Genet. 14, 483–495. doi: 10.1038/nrg3461
Stergiakouli, E., Gaillard, R., Tavaré, J. M., Balthasar, N., Loos, R. J., Taal, H. R., et al. (2014). Genome-wide association study of height-adjusted BMI in childhood identifies functional variant in ADCY3. Obesity 22, 2252–2259. doi: 10.1002/oby.20840
Taal, H. R., St Pourcain, B., Thiering, E., Das, S., Mook-Kanamori, D. O., Warrington, N. M., et al. (2012). Common variants at 12q15 and 12q24 are associated with infant head circumference. Nat. Genet. 44, 532–538. doi: 10.1038/ng.2238
Urlacher, S. S., Ellison, P. T., Sugiyama, L. S., Pontzer, H., Eick, G., Liebert, M. A., et al. (2018). Tradeoffs between immune function and childhood growth among Amazonian forager-horticulturalists. Proc. Natl. Acad. Sci. U.S.A. 115, E3914–E3921. doi: 10.1073/pnas.1717522115
van der Most, P. J., De Jong, B., Parmentier, H. K., and Verhulst, S. (2011). Trade-off between growth and immune function: a meta-analysis of selection experiments. Funct. Ecol. 25, 74–80. doi: 10.1111/j.1365-2435.2010.01800.x
van der Valk, R. J., Kreiner-Møller, E., Kooijman, M. N., Guxens, M., Stergiakouli, E., Sääf, A., et al. (2014). A novel common variant in DCST2 is associated with length in early life and height in adulthood. Hum. Mol. Genet. 24, 1155–1168. doi: 10.1093/hmg/ddu510
Versini, M., Jeandel, P.-Y., Rosenthal, E., and Shoenfeld, Y. (2014). Obesity in autoimmune diseases: not a passive bystander. Autoimmun. Rev. 13, 981–1000. doi: 10.1016/j.autrev.2014.07.001
Visscher, P. M., Wray, N. R., Zhang, Q., Sklar, P., Mccarthy, M. I., Brown, M. A., et al. (2017). 10 years of GWAS discovery: biology, function, and translation. Am. J. Hum. Genet. 101, 5–22. doi: 10.1016/j.ajhg.2017.06.005
Wang, K., Li, M., and Hakonarson, H. (2010). ANNOVAR: functional annotation of genetic variants from high-throughput sequencing data. Nucleic Acids Res. 38:e164. doi: 10.1093/nar/gkq603
Warrington, N. M., Richmond, R., Fenstra, B., Myhre, R., Gaillard, R., Paternoster, L., et al. (2018). Maternal and fetal genetic contribution to gestational weight gain. Int. J. Obes. 42, 775–784. doi: 10.1038/ijo.2017.248
Wong, M. M., and Fish, E. N. (2003). Chemokines: attractive mediators of the immune response. Semin. Immunol. 15, 5–14. doi: 10.1016/S1044-5323(02)00123-9
Wood, A. R., Esko, T., Yang, J., Vedantam, S., Pers, T. H., Gustafsson, S., et al. (2014). Defining the role of common variation in the genomic and biological architecture of adult human height. Nat. Genet. 46, 1173–1186. doi: 10.1038/ng.3097
Yoon, S., Nguyen, H. C. T., Yoo, Y. J., Kim, J., Baik, B., Kim, S., et al. (2018). Efficient pathway enrichment and network analysis of GWAS summary data using GSA-SNP2. Nucleic Acids Res. 10:e60. doi: 10.1093/nar/gky175
Zhang, Z., Wang, Z., Yang, Y., Zhao, J., Chen, Q., Liao, R., et al. (2016). Identification of pleiotropic genes and gene sets underlying growth and immunity traits: a case study on Meishan pigs. Animal 10, 550–557. doi: 10.1017/S1751731115002761
Zheng, J., Baird, D., Borges, M.-C., Bowden, J., Hemani, G., Haycock, P., et al. (2017). Recent developments in Mendelian randomization studies. Curr. Epidemiol. Rep. 4, 330–345. doi: 10.1007/s40471-017-0128-6
Zhu, Z., Zhang, F., Hu, H., Bakshi, A., Robinson, M. R., Powell, J. E., et al. (2016). Integration of summary data from GWAS and eQTL studies predicts complex trait gene targets. Nat. Genet. 48, 481–487. doi: 10.1038/ng.3538
Keywords: GWAS, summary statistics, growth, immune, genetic correlation, pleiotropy
Citation: Zhang Z, Ma P, Li Q, Xiao Q, Sun H, Olasege BS, Wang Q and Pan Y (2018) Exploring the Genetic Correlation Between Growth and Immunity Based on Summary Statistics of Genome-Wide Association Studies. Front. Genet. 9:393. doi: 10.3389/fgene.2018.00393
Received: 02 July 2018; Accepted: 29 August 2018;
Published: 14 September 2018.
Edited by:
Daniel Shriner, National Human Genome Research Institute (NHGRI), United StatesReviewed by:
Ricardo U. Sorensen, LSU Health Sciences Center New Orleans, United StatesJing Hua Zhao, University of Cambridge, United Kingdom
Copyright © 2018 Zhang, Ma, Li, Xiao, Sun, Olasege, Wang and Pan. This is an open-access article distributed under the terms of the Creative Commons Attribution License (CC BY). The use, distribution or reproduction in other forums is permitted, provided the original author(s) and the copyright owner(s) are credited and that the original publication in this journal is cited, in accordance with accepted academic practice. No use, distribution or reproduction is permitted which does not comply with these terms.
*Correspondence: Qishan Wang, wangqishan@sjtu.edu.cn Yuchun Pan, panyuchun1963@aliyun.com