Flow and Coral Morphology Control Coral Surface pH: Implications for the Effects of Ocean Acidification
 Neil C. S. Chan
 Daniel Wangpraseurt
 Michael Kühl
 Sean R. Connolly
- 1Department of Marine Biology, College of Marine and Environmental Sciences, James Cook University, Townsville, QLD, Australia
- 2Department of Ocean Microbiology, Plant Functional Biology and Climate Change Cluster, University of Technology Sydney, Sydney, NSW, Australia
- 3Marine Biology Section, Department of Biology, University of Copenhagen, Helsingor, Denmark
- 4ARC Centre of Excellence for Coral Reef Studies, James Cook University, Townsville, QLD, Australia
The future impact of ocean acidification (OA) on corals is disputed in part because mathematical models used to predict these impacts do not seem to capture, or offer a framework to adequately explain, the substantial variability in acidification effects observed in empirical studies. The build-up of a diffusive boundary layer (DBL), wherein solute transport is controlled by diffusion, can lead to pronounced differences between the bulk seawater pH, and the actual pH experienced by the organism, a factor rarely considered in mathematical modeling of ocean acidification effects on corals. In the present study, we developed a simple diffusion-reaction-uptake model that was experimentally parameterized based on direct microsensor measurements of coral tissue pH and O2 within the DBL of a branching and a massive coral. The model accurately predicts tissue surface pH for different coral morphologies and under different flow velocities as a function of ambient pH. We show that, for all cases, tissue surface pH is elevated at lower flows, and thus thicker DBLs. The relative effects of OA on coral surface pH was controlled by flow and we show that under low flow velocities tissue surface pH under OA conditions (pHSWS = 7.8) can be equal to the pH under normal conditions (pHSWS = 8.2). We conclude that OA effects on corals in nature will be complex as the degree to which they are controlled by flow appears to be species specific.
Introduction
Besides harboring a substantial proportion of the ocean's biodiversity, corals reefs are estimated to present an annual net global economic value of about $30 billion. Coral reefs form when scleractinic corals (and a number of other calcifying reef organisms) can produce calcium carbonate (CaCO3) skeletons faster than the sea can erode them (Cesar et al., 2003; Cohen and Holcomb, 2009) and these processes are inherently linked to the inorganic carbon chemistry of the oceans and atmosphere. Over the last half century, anthropogenic CO2 emissions have caused atmospheric CO2 to rise steadily from ~320 to ~390 ppm (IPCC, 2013). About 33% of this enhanced atmospheric CO2 dissolves into the oceans, causing a shift in the seawater carbonate system that results in a decrease in both oceanic pH and the abundance of carbonate ions that corals use to build their skeletons. These effects of enhanced dissolution of CO2 into the oceans are commonly termed ocean acidification (OA) and have been identified as a global threat for coral reefs, predicted to slow coral calcification to a point where the rate of reef erosion exceeds the rate of skeletal accretion (Silverman et al., 2009; van Hooidonk et al., 2013). However, considerable controversy remains about the actual impact of ocean acidification on coral calcification (Pandolfi et al., 2011; Chan and Connolly, 2013).
The build-up of a diffusive boundary layer (DBL) surrounding aquatic organisms, wherein solute transport is controlled by diffusion (Jørgensen and Revsbech, 1985; Boudreau and Jørgensen, 2001), can lead to steep concentration gradients of metabolic gases and ions (Boudreau and Jørgensen, 2001). Such boundary layer effects can lead to pronounced differences between the bulk seawater pH, and the actual pH experienced by the organism, which is modulated by both mass transfer and metabolic activity (Kühl et al., 1995). Microsensor measurements within the DBL thus show elevated pH at the tissue surface of corals during daylight and lower pH in darkness as compared to the bulk seawater (Kühl et al., 1995; de Beer et al., 2000; Al-Horani et al., 2003). Hence, the actual tissue surface pH of corals does not necessarily correspond to values predicted in the bulk water phase by the end of the century, albeit current predictions are based upon such bulk water pH values (Hendriks et al., 2010). The lack of consideration of so-called boundary layer effects has been suggested as one factor leading to differences between early models predicting ocean acidification to be a major threat to marine biodiversity (Kleypas et al., 1999) and actual experimental evidence for the sensitivity of organisms to ocean acidification (Ries et al., 2009; Hendriks et al., 2010).
The tissue surface pH of coralline alga and foraminifera has been shown to be dependent on the metabolic rate of the organism (i.e., photosynthesis, respiration, and calcification) and the thickness of the DBL (Rink et al., 1998; Cornwall et al., 2013). In turn, DBL thickness is largely a function of fluid velocity and surface roughness (Jumars and Nowell, 1984; Denny, 1988). Moreover, metabolic rates are limited by different processes at different flow velocities. At high flows and thin DBLs, metabolic rates are most likely uptake-limited (i.e., limited by how quickly tissue can uptake solutes), whereas at low flows and thick DBLs, metabolic rates are likely to be diffusion-limited (i.e., limited by how quickly solutes can diffuse through the DBL). Although flow regime has a central role in determining coral surface pH, experimental studies on the effects of ocean acidification on coral calcification are just only beginning to recognize the interactive effects of ocean acidification and flow (Comeau et al., 2014). As such, previous studies have been carried out over a large range of flow velocities, ranging from 1 cm s−1 (Ohde and Hossain, 2004) to 20 cm s−1 (Langdon and Atkinson, 2005), making a direct comparison of ocean acidification-related effects difficult. Moreover, experiments have been carried out on a large variety of different species, and the effect of flow on respiration and photosynthesis has been shown to differ by genus (Hoogenboom and Connolly, 2009). Thus, flow velocity-driven differences in tissue surface pH could possibly explain some of the large variation in the response of corals to ocean acidification among experimental studies carried out so far.
In this study, we investigated the drivers that determine tissue surface pH of corals. Specifically, we compared whether flow effects on tissue surface pH differed between massive and branching colonies when exposed to ambient and acidified conditions in the water column. To elucidate the factors determining tissue surface pH, we constructed a basic diffusion-reaction-uptake model that was experimentally parameterized based on direct microsensor measurements of coral tissue surface pH and O2. We evaluated how well the model predicted tissue surface pH in light, across a range of flows for two different coral species (Favites and Pocillopora damicornis), and under ambient vs. acidified conditions.
Methods
The Model
We tested whether a simple diffusion-reaction-uptake model of the DBL, previously developed to describe the inorganic carbon chemistry in the DBL of foraminifera (Wolf-Gladrow et al., 1999), could replicate coral tissue surface pH as measured with microsensors. The model predicts concentration profiles of chemical species in the carbonate system from the coral surface to toward the bulk seawater as a function of distance from the coral surface (x), where x ranges from 0 at the coral surface to xbsw at bulk seawater concentration. The model predicts the concentrations depending on diffusion, chemical conversion and the fluxes generated by metabolic rates.
The following chemical reactions are taken into account (from Zeebe and Wolf-Gladrow, 2001):
where k+i and k−i are the rate (kinetic) constants.
The basic equations of the model are of the following form
where c(x,t) is the concentration of a particular chemical species at distance x from the coral surface, at time t. Specific sources and sinks are added for metabolic fluxes as boundary conditions at the coral surface.
Concentration profiles are predicted as a function of the distance from the tissue surface. The time needed to establish a steady state can be estimated by the diffusional time scale τ = l2/D. where l ≈ 100–2000 μm is the typical coral DBL thickness, and D≈2 × 10⁻⁹ m2 s−1 is the diffusion coefficient for CO2 at 25°C and salinity of 35. Given these values, τ = 5–2000 s. The time scale for the slowest reaction, i.e., the conversion from HCO to CO2 is in the order of 100 s (Wolf-Gladrow et al., 1999). Because the time scale for diffusion and reaction are small compared to typical time scales of photosynthesis, respiration and calcification in the natural environment (hours to days), a steady state of the fluxes will be assumed (as in Wolf-Gladrow et al., 1999). Thus
The complete equations of the model are (Zeebe and Wolf-Gladrow, 2001):
The model was used with two boundary conditions:
1) The concentration of chemical species at the upper boundary of the DBL are set as bulk seawater conditions (either ambient or acidified)
2) The flux of each chemical species through the tissue surface boundary is equal to the net metabolic rate that consumes or releases that species
In the model, the values of the rate parameters are fixed constants (Zeebe and Wolf-Gladrow, 2001). The model also has four variable input parameters—DBL thickness, net photosynthesis, net calcification and bulk seawater chemistry. To test the model, we measured DBL thickness, net photosynthesis and bulk seawater chemistry experimentally (details in following sections). Net calcification was assumed to be a fixed proportion of net photosynthesis as has been found in the literature (Schneider et al., 2009). Because the ratio of net calcification to net photosynthesis was found to remain constant across varying flows (Chan unpublished data), we assumed that the constant of proportionality between calcification and net photosynthesis was independent of flow. Conversely, previous studies have shown that the calcification to net photosynthesis ratio does decrease with ocean acidification (Chauvin et al., 2011), and suggested that different morphologies have different spatial patterns of zooxanthellae distribution and skeletal growth (Jokiel, 2011). Consequently, net calcification as a percentage of net photosynthesis was estimated separately for different colony morphologies and different bulk seawater conditions (see section Calculation of Ratio of Calcification to Photosynthesis below). With regards to DBL thickness, we used DBL thickness determined from O2 profiles as a previous study has found no significant differences between DBL thickness when determined with O2 or pH profiles (Cornwall et al., 2013).
Corals acquire HCO mainly from bulk seawater rather than from internal sources (Goiran et al., 1996; Schrameyer et al., 2014). To keep electric charge neutrality, the uptake of HCO is compensated for by the uptake of an equal amount of H+. Thus the equations used to represent photosynthesis and calcification were:
Photosynthesis: HCO + H+ → CH2O + O2
Calcification: Ca2+ + HCO → CaCO3 + H+(Allemand et al., 2004)
The flux of HCO into the tissue is thus equal to net photosynthesis plus calcification while the flux of H+ into the tissue equals net photosynthesis minus calcification.
Parameter Estimation and Model Validation
To parameterize the model, we required experimental estimates of DBL thickness and net photosynthesis at a number of flow velocities and to evaluate the model, we required experimental estimates of tissue surface pH. We measured these. The experiments were conducted at the University of Technology, Sydney (UTS) using a massive Favites sp. and a branching P. damicornis colony (~3 cm diameter); the corals originated from the local coral holding facility at UTS (see Wangpraseurt et al., 2014 for details). Experiments were run in a custom-made black acrylic flow chamber (0.07 × 0.07 × 0.20 m). Microprofiles of O2 within the DBL and tissue surface pH were measured under four flow velocities (0.1, 1, 2, and 5 cm s−1). We did not investigate beyond flow velocities of 5 cm/s as DBL thickness asymptotically approaches zero as flow increases and effects of flow on coral metabolism have been found to be more pronounced at lower flows (Lesser et al., 1994; Hoogenboom and Connolly, 2009; Mass et al., 2010). Additionally higher flow speeds are difficult to generate in a small laminar flow chamber set up, where the higher speed can generate turbulence. For each flow velocity, corals were allowed to acclimate for 15–20 min (until tentacles were expanded again) before measurements began. Measurements were replicated at 4–6 points on a single colony from each species. Additional measurements were performed to evaluate whether the O2 and pH dynamics are simultaneous. O2 concentration [hereafter (O2)] and pH at the tissue surface was recorded simultaneously as flow velocity was varied in light and darkness. The measurements were thus only performed to evaluate dynamic differences in the behavior of the two parameters and we did not wait until the system was in entire steady state. Measurements were carried out at a temperature of 25.8°C and a salinity of 33.4, which are the prevailing conditions in the coral holding tanks. Microsensor measurements were performed at the branch tips for branching species and on the coenosarc, i.e., the tissue connecting two polyps, for massive species as these regions of the coral have been shown to have the highest calcification rate for each morphology, respectively (de Beer et al., 2000; Jokiel, 2011). Seawater was obtained from a long-term acidification experiment being run at UTS.
To evaluate how well the model captured DBL dynamics under ocean acidification, we carried out additional measurements on the same Favites sp. colony. The colony was placed in acidified seawater (pHSWS = 7.8 (±0.08 SD; n = 10) representative for predicted conditions in the year 2100 under RCP 6.0, and TA = 2325 μmol kg−1 (IPCC, 2013) and allowed to acclimate for 30 mins (until tentacles were expanded again) before measurements began. The O2 and pH profiles within the DBL were measured under the same flow velocities as used in the experiments with normal seawater (see above). Measurements were replicated at 2 points. Acidified seawater was obtained by sparging CO2 gas into tanks controlled via a pH controlling system (7070/2 pH controller set Tunze Aquarientechnik GmbH, Penzberg, DE), allowing for fine automated control of pHSWS (within ± 0.01 pHSWS units) for the duration of the experiment. The pH electrodes of the pH controlling system were calibrated every week using pHSWS 5 and 7 standard buffers (Fluka, Sigma-Aldrich, CH). Bulk seawater pH of the flume was monitored continuously and the water replaced constantly to limit the pH increase (due to equilibrium with air) to 0.05 units.
Measurement of CO2 System Parameters in Bulk Seawater
pH was measured using a Conductivity/TDS-pH meter (WP-81 TPS, Germany) calibrated with standard 4 and 7 buffers (TPS, Germany). Total alkalinity (TA) was measured by titrating 30 g water samples with 0.1 molL−1 hydrochloric acid with an autotitrator (T50 Titrator Mettler Toledo, United States; as in Sinutok et al., 2011). TA was determined from the average of three independent water samples.
Microsensor Measurements
Microscale O2 concentration measurements were done with Clark-type O2 microsensors connected to a pA-meter (PA2000, Unisense A/S, Aarhus, Denmark). The O2 microsensors (OX25, Unisense, Denmark) have excellent temporal and spatial resolution and are further characterized by excellent signal stability. The tip diameter of the O2 sensors was 25 μm and the sensors had a 90% response time of < 0.5 s. The O2 sensors were linearly calibrated using standard procedures (see Wangpraseurt et al., 2012). A two-point calibration was performed from signal readings in air saturated water and anoxic water (flushed with N2). The measurement signal in steady-state was highly reproducible as the signal drift was < 1% (stirring sensitivity < 1%). The O2 sensors provided accurate measurements with a detection limit of 0.3 μM (http://www.unisense.com).The percent air saturation in seawater at experimental temperature and salinity was transformed to O2 concentration (μmol O2 L−1) using gas tables (Ramsing and Grundersen, Unisense, Denmark, http://www.unisense.com/files/PDF/Diverse/Seawater%20&%20Gases%20table.pdf).
Tissue surface pH was measured with pH glass microelectrodes with an outer tip size of 40–60 μm (pH-50 Unisense A/S, Aarhus, Denmark). The microelectrodes were connected to a high impedance mV meter (pH/mV-Meter Unisense A/S, Aarhus, Denmark) measuring the pH-dependent microelectrode potential against a standard calomel reference electrode immersed in the same medium as the microelectrode. The pH microelectrodes were calibrated in standard pH buffers (pH 4, 7, and 10; TPS, Germany) as described previously (Kühl et al., 2012). The sensors exhibited a near-ideal Nernstian response of around 55 mV per pH unit change. The sensor signal was very stable (< 1% deviation) and the pH microsensor provided accurate measurements with a detection limit of 0.1 pH units and a 90% response time of < 10 s (http://www.unisense.com). The difference between bulk seawater pH measured using pH microelectodes and pH electrodes of the pH controlling system (mentioned in section Parameter Estimation and Model Validation above) was used to calculate the offset to convert pH from NBS scale to SWS scale.
Visible light was provided by a tungsten-halogen lamp of constant color temperature (KL2500 Schott AG, Mainz, Germany). The downwelling photon irradiance (PAR, 400–700 nm) was measured with a calibrated spherical quantum sensor (US-SQS/L, Heinz Walz GmbH) connected to a light meter (LI-250A, Li-COR). All measurements were carried out under a downwelling irradiance of 800 μmol photons m−2 s−1.
For profiling, the microsensors were mounted on PC-controlled motorized micromanipulators for automatic profiling (MU1 Pyro-Science GmbH, Germany). The micromanipulators were fixed on a heavy-duty vibration-free metal stand. Positioning of the microsensors was facilitated by the manufacturer's software (Profix, Pyro-Science GmbH, Germany.
Measurements were done with the O2 microelectrode mounted vertically, while the pH microelectrode was mounted at a 45° angle and the light at a 25° angle relative to vertical. Microsensor measurements were done in vertical steps of 25–100 μm. Determination of the tissue surface position was done by observation of the microsensor tip under a dissection microscope while slowly approaching it to the coral surface. In the following, all depths are given relative to the coral tissue surface (depth = 0 μm), where negative depths indicate distance above the tissue surface.
DBL Thickness Calculation
The effective DBL thickness was determined from the intercept between the linear extrapolation of the O2 concentration profile at the coral surface and the bulk seawater concentration (Jørgensen and Revsbech, 1985). The slope of the O2 concentration vs. distance data was fitted using the linear model function (lm) in R (R Core Team, 2013).
Net Photosynthesis Calculation
The diffusive fluxes of O2, J(x) were determined from steady state O2 concentration profiles by Fick's first law of diffusion:
where is δC/δx the slope of the O2 profile at depth x, and D0 is the molecular diffusion coefficient of O2 in water corrected for temperature (2.1707 × 10⁻⁵cm2 s−1), as taken from tabulated values provided by Unisense (Ramsing and Gundersen).
Calculation of Ratio of Calcification to Photosynthesis
The model and data from one flow (5 cm s−1) were used to fit the ratio of net calcification to net photosynthesis. Ratio of net calcification to net photosynthesis was independently fitted for each species and acidified condition. We then tested model predictions against the other three flows (0.1, 1, and 2 cm s−1). We also tested a model where the ratio of net calcification to net photosynthesis was constrained to be equal across species and acidified condition.
Statistical Analysis
To determine whether there was statistical support for calibrating the model differently for different colony morphologies or bulk seawater conditions, ANCOVA was used to test whether species interacted with flow in determining DBL thickness, photosynthesis and tissue surface pH, and to test whether species/bulk seawater pH interacted with flow in determining tissue surface pH. ANCOVAs were carried out using the aov() function in R.
Results
Parameter Estimation
DBL Thickness and Net Photosynthesis
The DBL thickness exhibited a negative power law relationship with flow for both Favites and P. damicornis, i.e., it was thick at low flow and thinned out as flow increased (Figure 1A, see Figure S1 in Data Sheet 1 for examples of O2 microprofiles, see Datasheet 2 for raw O2 microsensor data: depth from tissue surface against percentage air saturation). Likewise, DBL thickness for Favites in acidified seawater also exhibited a negative power law relationship, however the slope was shallower. The largest change in DBL thickness occurred between 0 and 2 cm s−1 (Figure 1A). For any given flow velocity, Favites had a thicker DBL than P. damicornis. Flow and species interacted significantly to affect net photosynthesis, with net photosynthesis increasing more with increasing flow for Favites than for P. damicornis (Figure 1B; Table 1). Flow and bulk seawater pH did not interact significantly to affect net photosynthesis, nor did bulk seawater pH have any effect on net photosynthesis (Table 2).
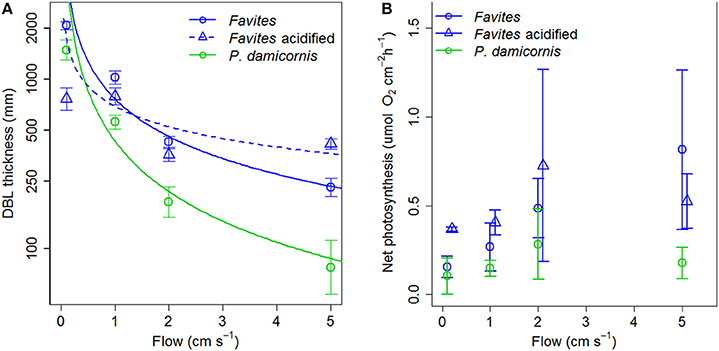
Figure 1. (A) DBL thickness (mm) vs. flow (cm s−1) for Favites (blue circles), Favites (blue triangles) and P. damicornis (green circles). Symbols and error bars represent the mean ± 1.96*SE (n = 2–6). Lines represent the relationship between DBL thickness and flow from fitted power functions (blue solid—DBLFavites = 767 flow −0.738, blue dashed—DBLFavites acidified = 691 flow −0.399, green solid—DBLP.damicornis = 432 flow −0.99). (B) Net photosynthesis at various flows (cm s−1) for Favites (blue circles), Favites under acidified conditions (blue triangles), and P. damicornis (green circles). Symbols with error bars represent the mean ± 1.96*SE (n = 2–6).
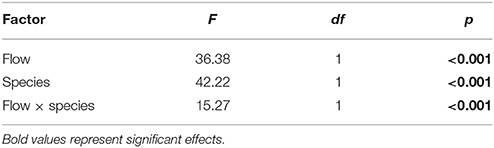
Table 1. ANOVA summary for effects of flow and species on photosynthesis of Favites and P. damicornis.
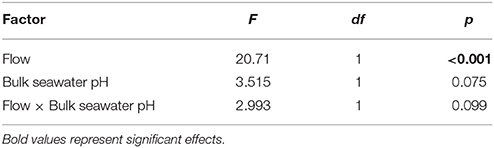
Table 2. ANOVA summary for effects of flow and bulk seawater pH on photosynthesis of Favites.
Microsensor Measurement of Tissue Surface pH
Elevation of tissue surface pH was plotted against flow for various species and acidified conditions (Figure 2A) because we are comparing two different bulk seawater scenarios (ambient pHSWS bulk = 8.2 and acidified pHSWS bulk = 7.8). Using elevation of tissue surface pH allowed us to highlight that tissue surface pH was elevated more under acidified conditions than it was under ambient conditions. Flow significantly affected tissue surface pH with lower flows leading to increased elevation in tissue surface pH (Figure 2A; Table 3). Species also had a significant effect on surface pH, with Favites showing a larger increase in tissue surface pH (0.4–0.6 pH units) than P. damicornis (0–0.3 pH units; Table 3). There was no interaction between flow and species in determining tissue surface pH. For Favites, the highest deviations from bulk seawater pH occurred under flows of 1 and 2 cm s−1, but even at a flow of 0.1 and 5 cm s−1 tissue surface pH was still significantly elevated (Figure 2A). For P. damicornis, tissue surface pH was highest at close to stagnant conditions. Enhanced flow velocities increased tissue surface pH up until a velocity of ~5 cm s−1. Tissue surface pH did not differ from the bulk seawater pH at flow velocities >5 cm s−1 (Figure 2A).
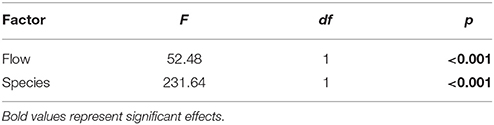
Table 3. ANOVA summary for effects of flow and species on tissue surface pH of Favites and P. damicornis.
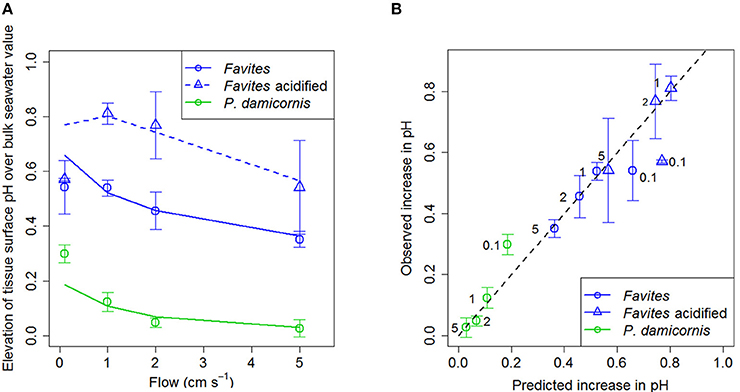
Figure 2. (A) Elevation of tissue surface pH relative to bulk seawater (tissue surface pH – bulk seawater pH) at various flows (cm s−1) for Favites (blue circles), Favites under acidified conditions (blue triangles), and P. damicornis (green circles). Symbols with error bars represent the mean ± 1.96*SE (n = 4–6). Lines represent model predictions. Bulk seawater had a pHSWS of 8.2 (±0.04 SD; n = 10) and TA = 2325 μmol kg− for ambient conditions and a pHSWS of 7.8 (±0.08 SD; n = 10) and TA = 2325 μmol kg−1 for acidified conditions. (B) Observed (measured with microsensor) vs. predicted (from model) values of elevation of tissue surface pH relative to bulk seawater at various flows (cm s−1) for Favites (blue circles), Favites under acidified conditions (blue triangles), and P. damicornis (green circles). Black numbers next to points are the flow velocities. Black dashed line represents the unity line where predicted values equal observed values.
There was a significant effect of bulk seawater pH on elevation of tissue surface pH (Table 4). The tissue surface pH of Favites showed a larger elevation under acidified conditions (bulk seawater pHSWS of 7.8) than under ambient pH conditions (bulk seawater pHSWS of 8.2), at flows of 1 and 2 cm s−1 (Figure 2A), so much so that at flow velocity of 2 cm s−1, there was no difference in tissue surface pH under ambient and acidified conditions (i.e., pH value of 7.8 in bulk seawater + 0.8 elevation = tissue surface pH of 8.6 under acidification, vs. pH value of 8.2 in bulk seawater + 0.45 elevation = tissue surface pH of 8.65 in ambient conditions).
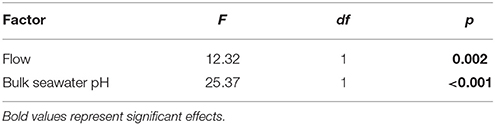
Table 4. ANOVA summary for effects of flow and bulk seawater pH on tissue surface pH of Favites.
Model Predictions
Net calcification was estimated to be 65, 55, and 80% of net photosynthesis in Favites, Favites under acidified conditions, and P. damicornis, respectively. Using these calcification rates, the diffusion-reaction-uptake model predicted tissue surface pH quite well for both Favites and P. damicornis, under ambient and acidified conditions, at all flow velocities except for 0.1 cm s−1 (Figures 2A,B). At a flow velocity of 0.1 cm s−1, the model predicted a higher tissue surface pH for Favites and a lower tissue surface pH for P. damicornis than those observed (Figure 2A). Overall, however, the R2 for a linear regression of observed vs. predicted values was 0.9229 (Figure 2B). Moreover, the slope (0.881) and intercept (0.035) of the linear regression were not significantly different from the slope (1) and intercept (0) of the unity line (where observed values equalled predicted values) (X2 = 3.0811, p = 0.2143). Thus, the model showed both high precision and low bias as a predictor of the coral tissue surface pH. When the ratio of net calcification to net photosynthesis was assumed to be constant (65%) across all species and treatments, the model fit was almost as good, and the slope and intercept for the linear regression of observed vs. predicted values were still not significantly different from those of the unity line (Figure S2 in Data Sheet 1).
Correlation between Net Photosynthesis and Tissue Surface pH
Our measurements showed that (O2) and pH measurements dynamics occurred simultaneously (Figure 3). Changes in (O2) and pH were positively correlated across flow velocities and illumination conditions (light or darkness), with illumination leading to elevation in both (O2) and pH (relative to the bulk seawater) and darkness leading to reductions (Figure 3). The magnitude of elevation/reduction was flow dependent with larger elevation/reduction under lower flows and smaller elevation/reduction at higher flows (Figure 3).
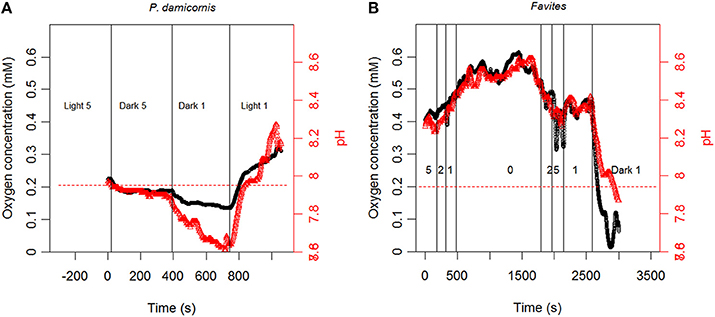
Figure 3. Continuous measurement of tissue surface O2 concentration (black line) and pH (red line) for (A) P. damicornis and (B) Favites under varying light/dark and flow conditions. Conditions in (B) are in light (800 μmol photons m−2 s−1) unless stated otherwise. Numbers in figure represent flow velocity. Red dashed line represents pH in bulk seawater.
Discussion
For benthic macroalgae, it is known that a thickening of the DBL, via reduced flow velocity, causes an elevation of tissue surface pH which reduces the negative effects of ocean acidification (Cornwall et al., 2013, 2014). In corals, it has only recently been shown that water flow modulates the response of coral reef communities to ocean acidification, even though the DBL has long been known to elevate tissue surface pH (Kühl et al., 1995; de Beer et al., 2000; Al-Horani et al., 2003; Comeau et al., 2014). In this study, we found that lower flow and thus thicker DBLs lead to increases in the elevation of tissue surface pH. Moreover, under ocean acidification, elevations in tissue surface pH reached the point where tissue surface pH was similar under ambient and acidified conditions. We also showed that the degree of elevation of tissue surface pH differed with species, where Favites exhibited higher tissue surface pH elevation as compared to P. damicornis.
Generally, the DBL is a function of the local hydrodynamic conditions. These in turn are controlled by surface roughness and microtopography and the ambient flow velocity. The insertion of the microsensors in the water above a solid structure can lead to a local acceleration of flow leading to a compression of the DBL (Glud et al., 1994), but a new steady state is typically established very quickly and local fluxes adjust to the somewhat thinner DBL accordingly (Lorenzen et al., 1995). Using microsensors, we verified that DBL thickness decreases exponentially with increasing flow for both Favites and P. damicornisi under ambient conditions. For Favites under acidification, while we find that higher flow still leads to thinner DBLs, the relationship is less well defined. This effect likely reflects behavioral change of the coral tissue under acidification. Coral tissues can contract and expand and change their surface structure depending on environmental conditions, which can then affect the thickness of the DBL.
The diffusion-reaction-uptake model developed for foraminifera was able to predict the tissue surface pH of Favites and P. damicornis, in light, under ambient and acidified conditions across a range of flows. This suggests that tissue surface pH is driven by diffusion-reaction-uptake kinetics alone and that the two model input parameters (DBL thickness and the difference in coral metabolic rates) are the key factors determining pH at the tissue surface. Thicker DBLs and larger differences in coral metabolic rates lead to larger elevation of tissue surface pH. In line with previous work, we found that photosynthesis increased with flow, with the increase dependent on species (Lesser et al., 1994; Hoogenboom and Connolly, 2009). Moreover, microsensor profiles showed that the dynamics of tissue surface O2 concentration and pH were tightly linked across a range of flows, demonstrating correlation between photosynthesis and elevation of tissue surface pH. Also, the model fits suggest that the ratio of calcification to photosynthesis (gn/pn) is independent of flow. As flow and thus photosynthesis decrease, the constant ratio means that the difference between photosynthesis and calcification rate decreases and so does the elevation of tissue surface pH. However, we found that elevation in tissue surface pH was largest under low flow. Moreover, sensitivity analysis shows that the model is not sensitive to gn/pn [Figure S2 in Data Sheet 1; the similarity of Figure 2B (ratio allowed to vary) and Figure S2 (ratio constrained to be 0.65) illustrates how insensitive the model is to changes in ratio of calcification to photosynthesis]. Thus we are able to conclude that DBL thickness is the major mechanism through which flow influences tissue surface pH. Our results are consistent with the hypothesis that morphology leads to differences in DBL thickness i.e., the DBL of massive species are thicker than those of branching species, despite similar regimes of ambient flow (Jimenez et al., 2011). However, our study species differed in other ways, such as surface roughness (due to corallite size), metabolic rates, tissue thickness and roughness, and zooxanthellae distribution which could also be the driving factors behind this variation. Thus we cannot, at this stage, unambiguously attribute the differences observed to colony morphology: more corals will need to be studied to determine fully the relative importance of these different species traits in driving the differences observed here.
Under ocean acidification conditions, we found that net photosynthesis did not increase, which is consistent with previous work (Reynaud et al., 2003; Schneider and Erez, 2006; Anthony et al., 2008; Marubini et al., 2008; Houlbreque et al., 2012; Agostini et al., 2013). We did however find that, under acidification, Favites had a thinner DBL (compared to ambient treatment) at lower flows and a thicker DBL at higher flows. Moreover, constraining the ratio of calcification to photosynthesis to be the same across treatments did not affect model fit. These observations suggest that the increase in tissue surface pH of Favites under ocean acidification was due to an increase in DBL thickness. This is likely due to behavioral change of the coral tissue under acidification. However, why this occurs, and the extent to which it occurs in other species, is a topic for future research.
The tissue surface pH prediction from the diffusion-reaction-uptake model differed most from the dataset at flows of 0.1 cm s−1 (close to stagnant), over-predicting it for Favites and under-predicting it for P. damicornis. A recent study has shown that, under conditions of zero flow, corals have the ability to use cilia beating to vigorously stir the water at the coral surface, leading to decreased DBLs and increased mass transfer (Shapiro et al., 2014). Under stagnant conditions, this biologically driven mass transport, rather than molecular diffusion, was shown to affect the exchange of nutrients and O2 between the coral surface and the environment (Shapiro et al., 2014). However, for higher flow velocities, tissue surface pH was well predicted by molecular diffusion, thus suggesting that while diffusion is the prime transport mechanism for corals under low and moderate flow velocities, mass transfer may be driven by other processes (e.g., cilia beating) at near stagnant conditions.
Oceanic pH is predicted to decline by 0.3–0.4 pH units by the end of this century (Caldeira and Wickett, 2003). Attempts to experimentally determine the effect this decline in pH will have on coral calcification have found obtained widely varying results, from increases to decreases (Hendriks et al., 2010; Chan and Connolly, 2013; Kroeker et al., 2013). While recent studies have suggested that species specific differences in the capacity of corals to upregulate pH within the calicoblastic layer may be the underlying reason for this large variability in experimental results (McCulloch et al., 2012), our results suggest that differences in species specific boundary layer dynamics, and thus tissue surface pH, also contribute to the variability. The predicted decline in pH due to ocean acidification is well within the range of tissue surface pH elevations measured for massive species (0.2–0.6), but higher than that of branching species (0–0.2; Figure 2A). We found that at flow velocities of 2 cm s−1, tissue surface pH of Favites was elevated to similar absolute values under ambient and acidified treatments, regardless of bulk seawater pH. That is, under acidification, tissue surface pH was elevated above bulk seawater pH by a larger amount than it was under ambient pH. This finding is consistent with that of Agostini et al. (2013) showing that tissue surface pH values of Galaxea fascicularis were not significantly different in seawater equilibrated with atmospheric CO2 levels of 400 and 700 ppm under a flow of 5 cm s−1. This elevation in pH leads to a net increase in aragonite saturation state (a measure of the thermodynamic potential for aragonite, the specific mineral form of calcium carbonate from which coral skeleton is constructed, to precipitate or dissolve) at the tissue surface, especially under acidified conditions, where aragonite saturation state at the tissue surface is double aragonite saturation state in bulk seawater [Figure 4; aragonite saturation state calculated from model projections of tissue surface pH and DIC with the program Seacarb (Lavigne and Gattuso, 2011) in R (R Core Team, 2013)]. However, it is important to bear in mind that corals with more elevated tissue surface pH in light also have more depressed tissue surface pH in darkness. It has been suggested that corals living in environments that frequently experience extreme temperatures may be more resistant to bleaching compared to more stable environments (Jokiel and Coles, 1990; Marshall and Baird, 2000), and we hypothesize that the same may apply to corals—that some corals may be more resistant to ocean acidification because they frequently experience larger pH fluctuations. Consistent with this hypothesis, diurnally oscillating pH has been shown to enhance coral recruit growth as compared to consistent ambient or acidified treatments (Dufault et al., 2012). While increase elevation and reduction in tissue surface pH on a diurnal time scale may enhance resistance to ocean acidification, there is a need to consider the overall effect of thicker DBLs on coral growth as thicker DBLs also hinder nutrient uptake by corals from surrounding seawater and also result in elevated temperatures in the DBL (Jimenez et al., 2011). Lastly, although these elevations in tissue surface pH have been found at relatively low flows compared to that which is typically found on reefs, ranging from 6–35 cm s−1 (Sebens et al., 1997; Fulton and Bellwood, 2005), periods of such low flow (< 5 cm s−1) are not uncommon for shallow reef flats (e.g., Helmuth et al., 1997) or lagoonal habitats under calm weather conditions (e.g., Smith and Birkeland, 2007).
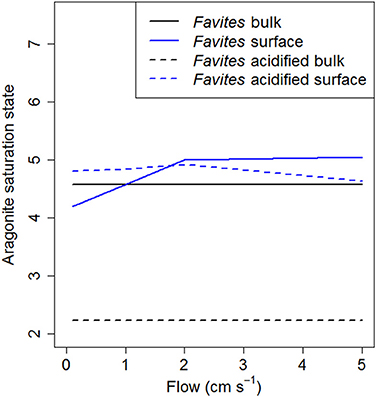
Figure 4. Model predictions of aragonite saturation state at various flows for Favites under ambient (solid lines) and acidified (dashed lines) conditions. Aragonite saturation state of bulk seawater is shown in black and at the tissue surface shown in blue.
Our results also highlight several potentially fruitful areas of future research. Firstly, we have not tested our model against measurements in darkness. As stated above, situations with more elevated tissue surface pH in light will also have more depressed tissue surface pH in darkness, and it is the net effect on tissue surface pH over a 24-h period which will affect coral metabolism. Secondly, we do not know the extent to which the differences in ambient vs. acidification found in this study for Favites are also prevalent in other species. Lastly, our study focused on the effects of unidirectional flow, however oscillatory flow resulting from the propagation and transformation of surface gravity waves can dominate the flow environments of many shallow reef communities. Compared to unidirectional flow of the same velocity, oscillatory flow has been shown to increase the penetration of flow into branching corals, reduce boundary layer thickness, and increase mass transfer to and from the coral (Falter et al., 2005; Reidenbach et al., 2006). Thus, an oscillatory flow with a given magnitude may produce effects comparable to much larger magnitude unidirectional flows.
Our study shows that a basic diffusion-reaction-uptake model is able to predict well tissue surface pH. This suggests that tissue surface pH is driven by boundary layer thickness. Our findings suggest that, due to thicker DBLs some species can have higher elevation (in light) and larger depression (in darkness) of tissue surface pH than others, especially under ocean acidification. However, these elevations in tissue surface pH are strongly flow dependent, most pronounced under low flows, and also species specific. The buffering of ocean acidification effects for some corals, through the establishment of the DBL, will depend on the local flow microenvironment experienced on the reef. We conclude that OA effects on corals in nature will be complex as the degree to which they are controlled by flow appears to be species specific.
Author Contributions
Conceived and designed the experiments: NC. Performed the experiments: NC and DW. Analyzed the data: NC and DW. Contributed reagents/materials/analysis tools: NC, MK, and SC. Wrote the paper: NC, DW, MK, and SC.
Conflict of Interest Statement
The authors declare that the research was conducted in the absence of any commercial or financial relationships that could be construed as a potential conflict of interest.
Acknowledgments
We are grateful to Katherina Petrou for assistance with chemical analysis, and to the four anonymous reviewers and subject editor for providing comments and suggestions that improved the manuscript. Financial support for this project was provided by the Australian Research Council, James Cook University, Danish Council for Independent Research/Natural Sciences, The Plant Functional Biology and Climate Change Cluster, and the University of Technology, Sydney.
Supplementary Material
The Supplementary Material for this article can be found online at: https://www.frontiersin.org/article/10.3389/fmars.2016.00010
References
Agostini, S., Fujimura, H., Higuchi, T., Yuyama, I., Casareto, B. E., Suzuki, Y., et al. (2013). The effects of thermal and high-CO2 stresses on the metabolism and surrounding microenvironment of the coral Galaxea fascicularis. C. R. Biol. 336, 384–391. doi: 10.1016/j.crvi.2013.07.003
Al-Horani, F. A., Al-Moghrabi, S. M., and De Beer, D. (2003). The mechanism of calcification anad its relation to photosynthesis and respiration in the scleractinian coral Galaxea fascicularis. Mar. Biol. 142, 419–426. doi: 10.1007/s00227-002-0981-8
Allemand, D., Ferrier-Pages, C., Furla, P., Houlbreque, F., Puverel, S., Reynaud, S., et al. (2004). Biomineralisation in reef-building corals: from molecular mechanisms to environmental control. C. R. Palevol 3, 453–467. doi: 10.1016/j.crpv.2004.07.011
Anthony, K. R. N., Kline, D. I., Diaz-Pulido, G., and Hoegh-Guldberg, O. (2008). Ocean acidification causes bleaching and productivity loss in coral reef builders. Proc. Natl. Acad. Sci. U.S.A. 105, 17442–17446. doi: 10.1073/pnas.0804478105
Boudreau, B. P., and Jørgensen, B. B. (2001). The Benthic Boundary Layer. New York, NY: Oxford University Press.
Caldeira, K., and Wickett, M. E. (2003). Anthropogenic carbon and ocean pH. Nature 425:365. doi: 10.1038/425365a
Cesar, H., Burke, L., and Pet-Soede, L. (2003). The Economics of Worldwide Coral Reef Degradation. (Arnhem: Cesar Environmental Economics Consulting).
Chan, N. C. S., and Connolly, S. R. (2013). Sensitivity of coral calcification to ocean acidificaiton: a meta-analysis. Glob. Change Biol. 19, 282–290. doi: 10.1111/gcb.12011
Chauvin, A., Denis, V., and Cuet, P. (2011). Is the response of coral calcification to seawater acidification related to nutrient loading? Coral Reefs 30, 911–923. doi: 10.1007/s00338-011-0786-7
Cohen, A. L., and Holcomb, M. (2009). Why corals care about ocean acidification: uncovering the mechanism. Oceanography 22, 118–127. doi: 10.5670/oceanog.2009.102
Comeau, S., Edmunds, P. J., Lantz, C. A., and Carpenter, R. C. (2014). Water flow modulates the response of coral reef communities to ocean acidification. Sci. Rep. 4:6681. doi: 10.1038/srep06681
Cornwall, C. E., Boyd, P. W., Mcgraw, C. M., Hepburn, C. D., Pildtich, C. A., Morris, J. N., et al. (2014). Diffusion boundary layers ameliorate the negative effects of ocean acidification on the temperate coralline macroalga Arthrocardia corymbosa. PLoS ONE 9:e97235. doi: 10.1371/journal.pone.0097235
Cornwall, C. E., Hepburn, C. D., Pildtich, C. A., and Hurd, C. L. (2013). Concentration boundary layers around complex assemblages of macroalgae: implications for the effects of ocean acidification on understorey coralline algae. Limnol. Oceanogr. 58, 121–130. doi: 10.4319/lo.2013.58.1.0121
de Beer, D., Kühl, M., Stambler, N., and Vaki, L. (2000). A microsensor study of light enhanced Ca2+ uptake and photosynthesis in the reef-building hermatypic coral Favia sp. Mar. Ecol. Prog. Ser. 194, 75–85. doi: 10.3354/meps194075
Denny, M. W. (1988). Biology and the Mechanics of the Wave-Swept Environment. Princeton, NJ: Princeton University Press.
Dufault, A. M., Cumbo, V. R., Fan, T. Y., and Edmunds, P. J. (2012). Effects of diurnally oscillating pCO2 on the calcification and survival of coral recruits. Proc. R. Soc. Lond. B 279, 2951–2958. doi: 10.1098/rspb.2011.2545
Falter, J. L., Atkinson, M., and Coimbra, C. F. M. (2005). Effects of surface roughness and oscillatory flow on dissolution of plaster forms: evidence for nutrient mass transfer to coral reef communities. Limnol. Oceanogr. 50, 246–254. doi: 10.4319/lo.2005.50.1.0246
Fulton, C. J., and Bellwood, D. R. (2005). Wave-induced water motion and the functional implications for coral reef fish assemblages. Limnol. Oceanogr. 2005, 255–264. doi: 10.4319/lo.2005.50.1.0255
Glud, R. N., Gundersen, J. K., Revsbech, N. P., and Jorgensen, B. B. (1994). Effects on the benthic diffusive boundary layer imposed by microelectrodes. Limnol. Oceanogr. 39, 462–467. doi: 10.4319/lo.1994.39.2.0462
Goiran, C., Al-Moghrabi, S. M., Allemand, D., and Jaubert, J. (1996). Inorganic carbon uptake for photosynthesis by the symbiotic coral/dinoflagellate association I. Photosynthetic performances of symbionts and dependence on sea water bicarbonate. J. Exp. Mar. Biol. Ecol. 199, 207–225.
Helmuth, B. S. T., Sebens, K. P., and Daniels, T. L. (1997). Morphological variation in coral aggregations: branch spacing and mass flux to coral tissue. J. Exp. Mar. Biol. Ecol. 209, 233–259. doi: 10.1016/S0022-0981(96)02687-1
Hendriks, I. E., Duarte, C. M., and Alvarez, M. (2010). Vulnerability of marine biodiversity to ocean acidification: a meta-analysis. Estuar. Coast. Shelf Sci. 86, 157–164. doi: 10.1016/j.ecss.2009.11.022
Hoogenboom, M. O., and Connolly, S. R. (2009). Defining fundamental niche dimensions of corals: synergistic effects of colony size, light, and flow. Ecology 90, 767–780. doi: 10.1890/07-2010.1
Houlbreque, F., Rodolfo-Metalpa, R., Jeffree, R., Oberhansli, F., Teyssie, J. L., Boisson, F., et al. (2012). Effects of increased pCO2 on zinc uptake and calcification in the tropical coral Stylophora pistillata. Coral Reefs 31, 101–109. doi: 10.1007/s00338-011-0819-2
IPCC (2013). “Declining coral calcification on the Great Barrier Reef,” in The Physical Science Basis. Contribution of Working Group I to the Fifth Assessment Report of the Intergovernmental Panel on Climate Change, eds T. F. Stocker, D. Qin, G. K. Platter, M. M. B. Tignor, S. K. Allen, J. Boschung, A. Nauels, Y. Xia, V. Bex, and P. M. Midgley (Cambridge; New York: NY: IPCC), 1102–1105.
Jimenez, I. M., Kühl, M., Larkum, A. W. D., and Ralph, P. J. (2011). Effects of flow and colony morphology on the thermal boundary layer of corals. J. R. Soc. 8, 1785–1795. doi: 10.1098/rsif.2011.0144
Jokiel, P. L. (2011). The reef coral two compartment proton flux model: a new approach relating tissue-level physiological processes to gross corallum morphology. J. Exp. Mar. Biol. Ecol. 409, 1–12. doi: 10.1016/j.jembe.2011.10.008
Jokiel, P. L., and Coles, S. L. (1990). Response of Hawaiian and other Indo-Pacific reef corals to elevated temperature. Coral Reefs 8, 155–162. doi: 10.1007/BF00265006
Jørgensen, B. B., and Revsbech, N. P. (1985). Diffusive boundary layers and the oxygen uptake of sediments and detritus. Limnol. Oceanogr. 30, 111–122. doi: 10.4319/lo.1985.30.1.0111
Jumars, P. A., and Nowell, A. R. M. (1984). Fluid and sediment dynamic effects on marine benthic community structure. Am. Zool. 24, 45–55. doi: 10.1093/icb/24.1.45
Kleypas, J. A., Buddemeier, R. W., Archer, D., Gattuso, J. P., Langdon, C., and Opdyke, B. N. (1999). Geochemical consequences of increased atmospheric carbon dioxide on coral reefs. Science 284, 118–120. doi: 10.1126/science.284.5411.118
Kroeker, K. J., Kordas, R. L., Crim, R. N., Hendriks, I. E., Ramajo, L., Singh, G. S., et al. (2013). Impacts of ocean acidification on marine organisms: quantifying sensitivities and interaction with warming. Glob. Change Biol. 19, 1884–1896. doi: 10.1111/gcb.12179
Kühl, M., Behrendt, L., Trampe, E., Qvortrup, K., Schreiber, U., Borisov, S. M., et al. (2012). Microenvironmental ecology of the chlorophyll b-containing symbiotic cyanobacterium Prochloron in the didemnid ascidian Lissoclinum patella. Front. Microbiol. 3:402. doi: 10.3389/fmicb.2012.00402
Kühl, M., Cohen, Y., Dalsgaard, T., Jørgensen, B. B., and Revsbech, N. P. (1995). Microenvironment and photosynthesis of zooxanthellae in scleractinian corals studied with microsensors for O2, pH and light. Mar. Ecol. Prog. Ser. 117, 159–172. doi: 10.3354/meps117159
Langdon, C., and Atkinson, M. J. (2005). Effect of elevated pCO2 on photosynthesis and calcification of corals and interactions with seasonal change in temperature irradiance and nutrient enrichment. J. Geophys. Res. 110, C09S07. doi: 10.1029/2004JC002576
Lavigne, H., and Gattuso, J. P. (2011). Seacarb: Seawater Carbonate Chemistry with R. R package version 2.4. Available online at: http://CRAN.R-project.org/package=seacarb
Lesser, M. P., Weis, V. M., Patterson, M. R., and Jokiel, P. L. (1994). Effects of morphology and water motion on carbon delivery and productivity in the reef coral, Pocillopora damicornis (Linnaeus): Diffusion barriers, inorganic carbon limitation, and biochemical plasticity. J. Exp. Mar. Biol. Ecol. 178, 153–179. doi: 10.1016/0022-0981(94)90034-5
Lorenzen, J., Glud, R. N., and Revsbech, N. P. (1995). Impact of microsensor caused changes in diffusive boundary layer thickness on O2 profiles and photosynthetic rates in benthic communities of microorganisms. Mar. Ecol. Prog. Ser. 119, 237–241. doi: 10.3354/meps119237
Marshall, P. A., and Baird, A. H. (2000). Bleaching of corals on the Great Barrier Reef differential susceptibilities among taxa. Coral Reefs 19, 155–163. doi: 10.1007/s003380000086
Marubini, F., Ferrier-Pages, C., Furla, P., and Allemand, D. (2008). Coral calcification responds to seawater acidification: a working hypothesis towards a physiological mechanism. Coral Reefs 27, 491–499. doi: 10.1007/s00338-008-0375-6
Mass, T., Genin, A., Shavit, U., Grinstein, M., and Tchernov, D. (2010). Flow enhances photosynthesis in marine benthic autotrophs by increasing the efflux of oxygen from the organism to the water. Proc. Natl. Acad. Sci. U.S.A. 107, 2527–2531. doi: 10.1073/pnas.0912348107
McCulloch, M., Falter, J., Trotter, J., and Montagna, P. (2012). Coral resilience to ocean acidification and global warming through pH up-regulation. Nat. Clim. Change 2, 623–627. doi: 10.1038/nclimate1473
Ohde, S., and Hossain, M. M. M. (2004). Effects of CaCO3 (aragonite) saturation state of seawater on calcification of Porites coral. Geochem. J. 38, 613–621. doi: 10.2343/geochemj.38.613
Pandolfi, J. M., Connolly, S. R., Marshall, D. J., and Cohen, A. L. (2011). Projecting coral reef futures under global warming and ocean acidification. Science 333, 418–422. doi: 10.1126/science.1204794
R Core Team (2013). R: A Language and Environment for Statistical Computing. Vienna: R Foundation for Statistical Computing. Available online at: http://www.R-project.org/
Reidenbach, M. A., Koseff, J. R., Monismith, S. G., and Genin, A. (2006). Effects of waves, currents and morphology on mass transfer in branched reef corals. Limnol. Oceanogr. 51, 1134–1141. doi: 10.4319/lo.2006.51.2.1134
Reynaud, S., Leclercq, N., Romaine-Lioud, S., Ferrier-Pages, C., Jaubert, J., and Gattuso, J. P. (2003). Interacting effects of CO2 partial pressure and temperature on photosynthesis and calcification in a sclerectinian coral. Glob. Change Biol. 9, 1660–1668. doi: 10.1046/j.1365-2486.2003.00678.x
Ries, J. B., Cohen, A. L., and Mccorkle, D. C. (2009). Marine calcifiers exhibit mixed responses to CO2-induced ocean acidification. Geology 37, 1131–1134. doi: 10.1130/G30210A.1
Rink, S., Kühl, M., Bijma, J., and Spero, H. (1998). Microsensor studies of photosynthesis and respiration in the symbiotic foraminifer Orbulina universa. Mar. Biol. 131, 583–595. doi: 10.1007/s002270050350
Schneider, K., and Erez, J. (2006). The effect of carbonate chemistry on calcification and photosynthesis in the hermatypic coral Acropora eurystoma. Limnol. Oceanogr. 51, 1284–1293. doi: 10.4319/lo.2006.51.3.1284
Schneider, K., Levy, O., Dubinsky, Z., and Erez, J. (2009). In situ diel cycles of photosynthesis and calcification in hermatypic corals. Limnol. Oceanogr. 54, 1999–2002. doi: 10.4319/lo.2009.54.6.1995
Schrameyer, V., Wangpraseurt, D., Hill, R., Kühl, M., Larkum, A. W. D., and Ralph, P. J. (2014). Light respiratory processes and gross photosynthesis in two scleractinian corals. PLoS ONE 9:e110814. doi: 10.1371/journal.pone.0110814
Sebens, K. P., Grace, S. P., Helmuth, B. S. T., Maney, E. J., and Miles, J. S. (1997). Water flow and prey capture by three scleractinian corals, Madracis mirabilis, Montastrea cavernosa and Porites porites in a field enclosure. Mar. Biol. 131, 347–360. doi: 10.1007/s002270050328
Shapiro, O. H., Fernandez, V. I., Garren, M., Guasto, J. S., Debaillon-Vesque, F. P., Kramarsky-Winter, E., et al. (2014). Vortical ciliary flows actively enhance mass transport in reef corals. Proc. Natl. Acad. Sci. U.S.A. 111, 13391–13396. doi: 10.1073/pnas.1323094111
Silverman, J., Lazar, B., Cao, L., Caldeira, K., and Erez, J. (2009). Coral reefs may start dissolving when atmospheric CO2 doubles. Geophys. Res. Lett. 36, L05606. doi: 10.1029/2008GL036282
Sinutok, S., Hill, R., Doblin, M. A., Wuhrer, R., and Ralph, P. J. (2011). Warmer more acidic conditions cause decreased productivity and calcification in subtropical coral reef sediment-dwelling calcifiers. Limnol. Oceanogr. 56, 1200–1212. doi: 10.4319/lo.2011.56.4.1200
Smith, L. W., and Birkeland, C. (2007). Effects of intermittent flow and irradiance level on back reef Porites corals at elevated seawater temperature. J. Exp. Mar. Biol. Ecol. 341, 282–294. doi: 10.1016/j.jembe.2006.10.053
van Hooidonk, R., Maynard, J. A., Manzello, D., and Planes, S. (2013). Opposite latitudinal gradients in projected ocean acidification and bleaching impacts on coral reefs. Glob. Change Biol. 20, 103–112. doi: 10.1111/gcb.12394
Wangpraseurt, D., Larkum, A. W. D., Franklin, J., Szabo, M., Ralph, P. J., and Kuhl, M. (2014). Lateral light transfer ensures efficient resource distribution in symbiont-bearing corals. J. Exp. Biol. 217, 489–498. doi: 10.1242/jeb.091116
Wangpraseurt, D., Larkum, A. W. D., Ralph, P. J., and Kühl, M. (2012). Light gradients and optical microniches in coral tissues. Front. Microbiol. 3:316. doi: 10.3389/fmicb.2012.00316
Wolf-Gladrow, D., Bijma, J., and Zeebe, R. E. (1999). Model simulation of the carbonate chemistry in the microenvironment of symbiont bearing foraminifera. Mar. Chem. 64, 181–198. doi: 10.1016/S0304-4203(98)00074-7
Keywords: Climate change, carbonate chemistry, calcification, diffusive boundary layer
Citation: Chan NCS, Wangpraseurt D, Kühl M and Connolly SR (2016) Flow and Coral Morphology Control Coral Surface pH: Implications for the Effects of Ocean Acidification. Front. Mar. Sci. 3:10. doi: 10.3389/fmars.2016.00010
Received: 10 August 2015; Accepted: 25 January 2016;
Published: 16 February 2016.
Edited by:
Tamotsu Oomori, University of the Ryukyus, JapanReviewed by:
Toshihiro Miyajima, The University of Tokyo, JapanSylvain Agostini, Shimoda Marine Research Center, Japan
Copyright © 2016 Chan, Wangpraseurt, Kühl and Connolly. This is an open-access article distributed under the terms of the Creative Commons Attribution License (CC BY). The use, distribution or reproduction in other forums is permitted, provided the original author(s) or licensor are credited and that the original publication in this journal is cited, in accordance with accepted academic practice. No use, distribution or reproduction is permitted which does not comply with these terms.
*Correspondence: Neil C. S. Chan, nchancs@gmail.com