Dietary Evidence of Mesopelagic and Pelagic Foraging by Atlantic Bluefin Tuna (Thunnus thynnus L.) during Autumn Migrations to the Iceland Basin
 Droplaug Olafsdottir
 Brian R. MacKenzie
 Valérie Chosson-P1
 - 1Marine Resources Section, Marine Research Institute, Reykjavik, Iceland
- 2National Institute of Aquatic Resources (DTU-Aqua), Technical University of Denmark, Charlottenlund, Denmark
Atlantic bluefin tuna (ABFT; Thunnus thynnus) is a large highly mobile predator fish species in the North Atlantic Ocean and Mediterranean Sea. Knowledge of its trophic role in marine food webs in summer feeding areas is presently based on recent (1980–2010s) sampling in the Bay of Biscay, Gulfs of Maine and St. Lawrence, and from historical (1950–1960s) sampling in the Norwegian-North Sea-Kattegat. No study has yet investigated the diets of ABFT in Icelandic waters, where it supported an experimental fishery during 1996–2005, nor in any region north of the Bay of Biscay since the 1960s. However, north Atlantic temperatures and fish species distributions, including some ABFT prey species (e.g., mackerel) have been changing in the 2000s. New knowledge of ABFT diets in previously understudied parts of the species range will be useful for understanding factors affecting the trophic role, migration behavior, and bioenergetics of ABFT. Here, we report the dietary composition of ABFT during autumn migrations to the Iceland Basin south of the continental shelf of Iceland. A total of 36 prey species or higher taxa were observed in 421 stomach samples: 17 teleost fishes, 4 squid, 1 octopus, 12 crustaceans, and 2 other invertebrate species. The most important prey species were European flying squid (Todarodes sagittatus) (%N = 16.70, %W = 48.89; %FO = 87.65), barracudinas (Paralepididae) (%N = 14.05, %W = 28.59, %FO = 76.48), and gonate squid (Gonatus sp.) (%N = 9.17, %W = 7.85, %FO = 75.06). Prey sizes were highly variable relative to ABFT sizes indicating highly opportunistic feeding on diverse sizes. The presence of a large proportion of mesopelagic species in the diet indicates feeding in the mesopelagic layer and extensive dive behavior. These results give new baseline knowledge for future comparison with anticipated oceanographic-biological changes in the region in the coming decades and can be used to help parameterize new models of ABFT migration behavior and trophic role.
Introduction
Atlantic bluefin tuna (Thunnus thynnus; ABFT) is distributed in the pelagic and mesopelagic waters of the North Atlantic and adjacent seas from Brazil to Newfoundland in the West Atlantic and from the Canary Islands to North Norway in the East Atlantic (for review see e.g., Mather et al., 1995; Fromentin and Powers, 2005; ICCAT, 2015). After spawning in the Gulf of Mexico and Mediterranean Sea in the spring, many ABFT migrate into the Atlantic Ocean for feeding heading along the continental coasts and into open waters. Minor proportions of the fish migrate southward along the South American and African coasts toward Brazil and the Canary Islands, respectively. The main routes however, head north along the North American coast to the Gulf of St. Lawrence, Labrador, and Newfoundland, into offshore areas in the NW Atlantic and in the East Atlantic along the Iberian peninsula into the Bay of Biscay and further north along the British Isles and as far north as the Lofoten Islands off the Norwegian coast (e.g., Mather et al., 1995; Cury et al., 1998; Fromentin and Powers, 2005; Fromentin et al., 2013; Druon et al., 2016).
Shifts in the autumn migration and subsequent inter-annual fluctuations in ABFT abundance at the feeding grounds at higher latitudes are known from commercial fishing data (Rooker et al., 2007; Golet et al., 2013; ICCAT, 2015). Tagging experiments have also indictaed that feeding migration and movement patterns of ABFT vary between individuals, years and areas (Lutcavage et al., 2000; Block et al., 2001, 2005). Exploitation of ABFT in northern European waters started in the 1920s with small scale angling and harpoon fisheries in the Norwegian Sea and the North Sea. With introduction and development of purse seine fishing technique the exploitation of ABFT in northern Europe expanded and reached a climax in the 1950s after which it rapidly declined and eventually collapsed in the early 1960s (for review see: MacKenzie and Myers, 2007; Fromentin, 2009; Tangen, 2009; ICCAT, 2015). The offshore waters south of Iceland were poorly explored and not exploited for ABFT during the period of large scale tuna fisheries in northern Europe in the last century. However, similar oceanographic features of the waters south of Iceland and off the Norwegian coast (Malmberg, 2004) and anecdotal records of ABFT schools in Icelandic nearshore waters in 1929 and 1944 (Friðriksson, 1944, 1949) suggest that the fish may have been abundant south of Iceland during this period. Evident confirmation of regular migration of ABFT in the area south of Iceland was first obtained during experimental ABFT fisheries in the Iceland Basin in the autumns of 1996–2005. The fisheries revealed the existence of ABFT migrating into the area in the autumn; however, interannual fluctuations in the catch rates indicated instability in the migration patterns in the area (Olafsdottir, 2004).
The ABFT is generally believed to occupy the surface and subsurface waters and aggregate in relation to foraging in upwelling and high productive areas along ocean fronts (e.g., Bard et al., 1998; Humston et al., 2000; Rouyer et al., 2004, 2014; Wilson and Block, 2009) or in proximity to prey schools (Golet et al., 2013). Analyses using stable nitrogen isotope method have shown that juvenile ABFT forage at the position of trophic level 3–4 whereas the adult fish is at similar ecological position as pelagic sharks and forage at trophic level 4–5 (Estrada et al., 2005; Sarà and Sarà, 2007; Logan, 2009; Logan et al., 2011).
Previous studies of ABFT diet in the North Atlantic and Mediterranean have shown consumption of a large variety of pelagic and mesopelagic prey including fish as well as cephalopod and crustacean species. Young of the year ABFT from the Tyrrhenean Sea in the central Mediterranean Sea feed primarily on odd bobtail squid (Heteroteuthis dispar), common clubhook squid (Onychoteuthis banksi), and Mediterranean sand smelt (Atherina hepsetus) (Sinopoli et al., 2004). Juvenile ABFT mainly target anchovy (Engraulis encrasicolus) in the Ligurian Sea (Orsi Relini et al., 1995, 1999), European pilchard (Sardina pilchardus) and anchovy in the Gulf of Valencia (Sanz Brau, 1990) and immature ABFT feed mainly on krill (Meganyctiphanes norvegica), anchovy, blue whiting, and Atlantic horse mackerel in the Bay of Biscay and the Celtic Sea (Ortiz de Zatare and Cort, 1986; Logan et al., 2011; Pinnegar et al., 2015). Studies on immature ABFT diet from the Mid Atlantic Bight off the east US coast show sand lance (Ammodytae) as the main prey (Eggleston and Bochenek, 1990; Logan et al., 2011).
Adult ABFT in the eastern Mediterranean Sea target greater Argonaut cephalopod (Argonauta argo), lanternfishes (Myctophidae), and horse mackerel (Trachurus sp.) during the spawning season (Karakulak et al., 2009). Benoit's lantern fish (Hygophum benoiti) and Sloane's viperfish (Chauliodus sloani) have been reported as the most frequent prey of adult ABFT from the Strait of Messina in the central Mediterranean Sea followed by the southern shortfin squid (Illex coindetii) (Battaglia et al., 2013). Atlantic herring (Clupea harengus), Atlantic mackerel (Scomber scombrus), sprat (Sprattus sprattus), garfish (Belone belone), and gadoids were reported from ABFT in the Norwegian and North Seas in the 1960s (Tiews, 1978). The most important prey of adult ABFT reported from the NW Atlantic consists of Atlantic menhaden (Brevoortia tyrannus) off the coast of North Carolina (Butler et al., 2010), bullet tuna (Axis sp.) from the coasts off Carolina to New York (Dragovich, 1970), sand lance, Atlantic herring, Atlantic mackerel, bluefish (Pomatomus saltatrix), and squid (Cephalopoda) in the Gulf of Maine (Crane, 1936; Holliday, 1978; Chase, 2002). Diet reported from the area ranging from north of Bermuda to the Azores have shown large importance of pomfrets (Bramidae), tigerfishes (Balistidae), long-spine porcupinefish (Diodon holocanthus), flying gurnard (Dactylopterus volitans) as well as seven-armed octopus [Haliphron atlanticus (= Alloposus mollis)] and unidentified squid (Dragovich, 1970; Matthews et al., 1977).
The objectives of the present study were to improve knowledge of the feeding of large ABFT in offshore areas in the central NE Atlantic, by providing information on species and size composition and potential spatial and temporal variation of the diet. Until now, there have been no dietary studies of ABFT north of the Bay of Biscay/Celtic Sea since the 1960s (Tiews, 1978; Pinnegar et al., 2015). Given the northerly latitude and colder habitat of the Iceland Basin region, better understanding of the feeding ecology of ABFT in these waters may help understand its migration behavior and fluctuations in abundance at higher latitudes. Such knowledge will also provide a valuable baseline against which future diets can be compared as climate changes. In addition, ABFT dietary studies have primarily focused on species composition of the diet instead of size composition and the relationships between prey and predator (ABFT) size. However, a recent study indicates that prey size as well as abundance may be an important factor affecting bluefin tuna condition and foraging success (Golet et al., 2015). New dietary data (both for the species and size composition) from the south Iceland continental shelf break and slope region and during the late 1990s will therefore provide new knowledge of the diet of ABFT in a previously uninvestigated area and time period.
Materials and Methods
Sample Collection
Information on prey occurrence and diet samples from ABFT of 90–290 cm size range were collected during experimental longline fishing operations conducted on five Japanese commercial vessels in the Iceland Basin south of Iceland in August to November in 1998 and 1999 (Table 1). Lines of about 100 km length were laid in the sea, containing 2800–3200 hooks floating at 90–140 m depth. The process of laying the lines started around 6 A.M. and ended around 11 A.M. The retrieval of the lines started around 5 P.M. and took 9–12 h depending on weather and catch. Squid and mackerel were mainly used as bait. Research observers onboard each vessel reported information on start and end location of the line settings and ABFT tuna fork lengths (rounded to the nearest 5 cm). Stomachs of 1643 and 755 ABFT in 1998 and 1999, respectively, were investigated for presence of diet onboard the vessels. Empty stomachs were reported and diet samples were collected and stored at −20°C within 30 min after the fish were hauled from the water.
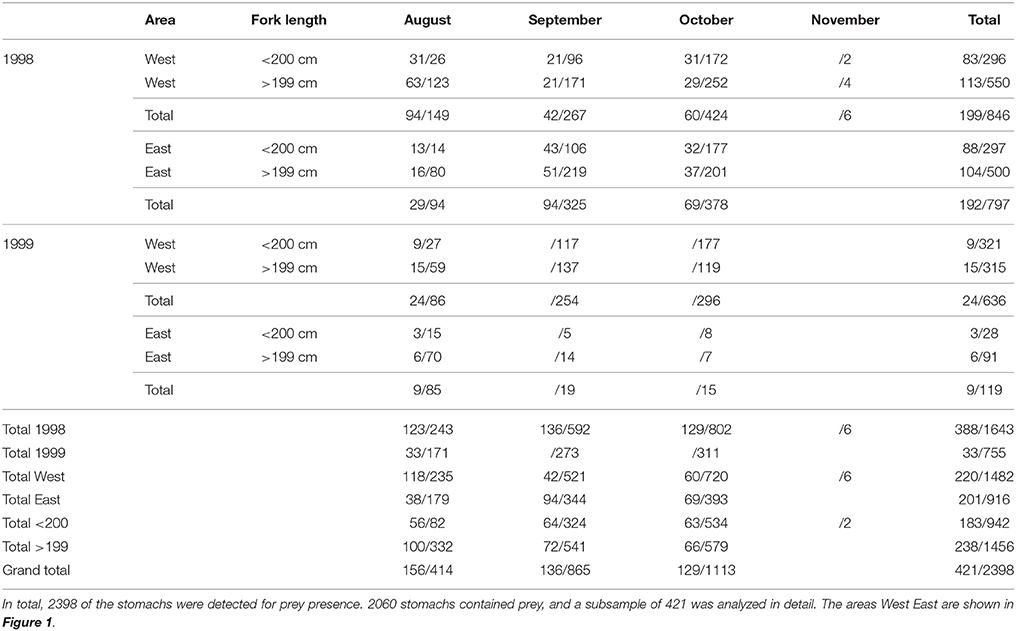
Table 1. Number of Atlantic bluefin tuna Thunnus thynnus stomach samples analyzed for taxonomic and size composition/presence of prey, by year, area, tuna fork length, and month.
Sample Processing and Data Analyses
Food remains from 421 of 2064 ABFT stomachs containing food were identified and counted to the lowest taxa possible under a magnifying glass or a stereoscope. The stomach samples were categorized by year, month, east, or west location separated at 18°25′ meridian and small or large size separated at 200 cm length i.e., the average length of ABFT in the area (Ólafsdóttir and Ingimundardóttir, 2003). Samples were selected for diet analyses from 1998 aiming at even distribution between each area, size, and month category. For interannual comparison of years with various catch per unit of effort [CPUE; overall CPUE in 1998: 183 kg/1000 hooks; 1999: 90 kg/1000 hooks (Olafsdottir, 2004)], a subsample from smaller size category and August were analyzed from 1999 (Table 1).
Digestion levels of the prey were estimated and categorized as (1) undigested, (2) moderately digested, (3) heavily digested: prey remnants consisting only of hard parts (4) severely digested: hard parts too eroded for measurements, species identification or counting. The bait was identified based on the taxa and digestion level and excluded from data analyses.
The number of prey items was estimated by counting individual prey items of digestion levels 1 and 2 and sagittal otolith and beak pairs for fish and squid, respectively, of level 3. Long soaking time of the hooks (about 18 h at maximum) and elevated metabolic rate in ABFT (Carey et al., 1984; Dickson and Graham, 2004; Graham and Dickson, 2004; Blank et al., 2007) probably resulted in high digestion levels of the diet collected in the present study. Therefore, it was deemed feasible to use reconstructed lengths and weights of the prey items in the analyses of the stomach contents. The reconstructions are based on known relationships of body sizes to hard particle sizes: sagittal otolith pairs, lower rostral beak (LRL), and lower hood beak (LHL) for fish, decapod, and octopod cephalopods, respectively (Annex 1). For estimation of the lengths/weights of gonate squid (Gonatus sp.) equations on the relationship of LRL beak to mantle lengths for Boreoatlantic gonate squid (G. fabricii) were applied, and an overall equation on otolith to fish lengths for barracudina (Paralepididae) species was used for barracudina prey (Annex 1). Where available, reconstruction equations for prey from Icelandic waters were used (Vikingsson et al., 2003, reference collection held at the Marine Research Institute, Iceland). In the absence of equations from Icelandic waters, equations from other areas were applied (Clarke, 1980, 1986; Härkönen, 1986; Santos et al., 2001). Severely digested prey whose hard parts were too eroded for size measurements (level 4) and where size could not be obtained due to broken otolith and missing LRL or LHL were not used in analyses on prey lengths. In studies on the importance of prey species in the diet, it is however necessary to estimate total weights of all prey. Therefore, prey items of level 4 and where hard parts were missing were given the overall average weights of the same prey species or taxon in the same stomach. In cases where average weight of a species could not be obtained for a single stomach, the overall average weight of the prey species from all stomachs was used. Estimation of reconstructed sizes was not possible for Greenland argentine (Nansenia groenlandica), rakery beaconlamp (Lampanyctus macdonaldi), shortnose lancetfish (Alepisaurus brevirostris), cornish blackfish (Schedophilus medusophagus), gray sole (Glyptocephalus cynoglossus), monkfish (Lophius piscatorius), and sand lance. For these fish prey, the measured wet weights were used. Average weights of 0.3 g were used for Euphausid krill based on unpublished results from Icelandic waters (Hauksson and Bogason, unpublished data). The overall average wet weight from all ABFT samples in the present study were used for hyperiid amphipod and diogenid anomura. Measured wet weights were also used for unidentified prey and invertebrates where mean weights from previous or the present study were not available (Annex 1).
The contribution of each taxon in the diet was estimated using relative measures of prey quantity described by Hyslop (1980). The numerical index (%N = number of individuals of prey taxon in a stomach/number individuals of all prey taxon in a stomach × 100) and gravimetry index based on reconstructed weight (%W = total weight of prey taxon in a stomach/total weight of all prey taxa in a stomach × 100) were calculated for each stomach sample. Percent frequency of occurrence (%FO = number of stomachs containing prey taxon/ number of stomachs containing any prey in the overall sample) was calculated for the two area and two size classes (see Table 1; Hyslop, 1980).
Cumulative prey curves were constructed for two tuna size classes and two areas (see Table 1) for testing of sample size sufficiency for each group (Ferry and Gaillet, 1996). Cumulative number of unique prey taxa was plotted against number of stomach samples as described by Bizzarro et al. (2007). The average cumulative number of unique prey taxa was calculated on results from 10 iterations of a random reordering of the stomach samples. Sample size sufficiency was tested using linear regression of the four last samples in each category to investigate if the slopes were significantly different from zero (P > 0.05) indicating if the curve had reached a level of asymptote. The slope was formed by the average cumulated number of unique prey for the four last stomach samples and the number of unique prey for the last stomach sample from the 10 random reordering iterations.
Dietary breadth was determined for ABFT by calculating Levin's niche breadth using the relative frequency of occurrence of food items (B = 1/∑p2j, where B is Levin's measure of niche breadth and pj is the fraction of items in the diet that belong to resource category j), and Levin's standardized dietary breadth on a scale from 0 to 1.0 (BA = B − 1/n − 1, where BA is the Levin's standardized niche breadth; B the Levin's measure of niche breadth; n is the number of possible resource categories). B ranges from 0 to n and BA from 0 to 1.0. Values of niche breadth are maximum when the food items are equally distributed among the possible food categories. The niche breadth is minimal when all the food items occur in only one food category (Levins, 1968). Comparisons of niche breadth were performed between ABFT from east and west areas and small and large size categories (see Figure 1; Table 1) using two factor Anova.
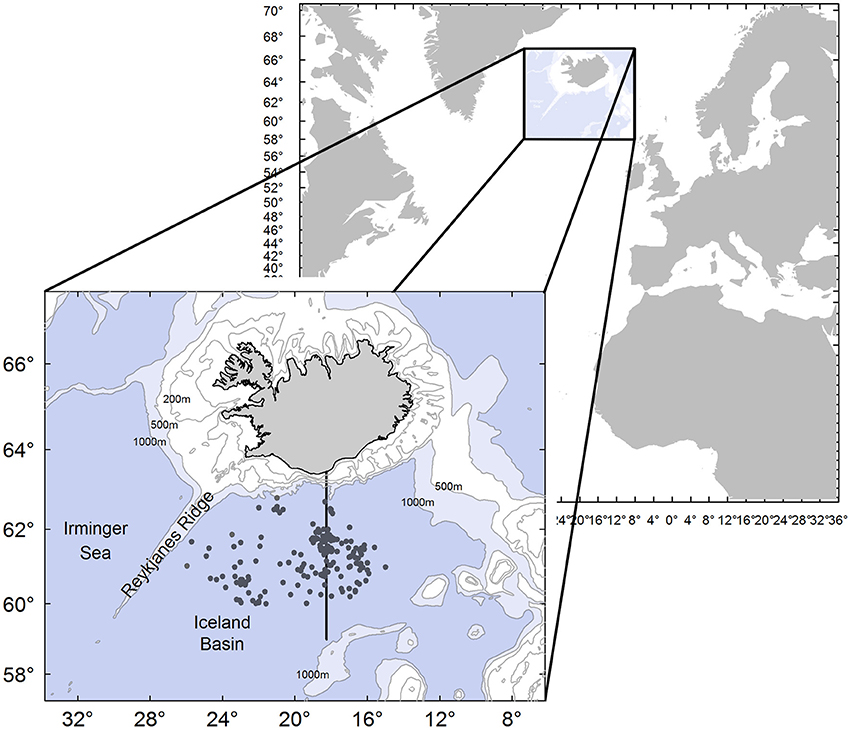
Figure 1. Location of the study area. Each point prepresents the starting location of line settings for 421 Atlantic bluefin tuna Thunnus thynnus used in analyses on prey composition. Division between east and west regions used in the analyses is shown along the meridian 18°25′ W.
The overall relationship between prey size and ABFT size was initially analyzed using linear regression. The relationship of ABFT fork length and prey lengths (total lengths for fish prey and mantle lengths for squid) was analyzed for each of the six most important fish and squid prey species: European flying squid, gonate squid, barracudinas (Paralepididae), squarenose helmetfish (Scopelogadus beanii), Kroyer's lanternfish (Notoscopelus kroyeri), and Mueller's bristlemouth fish (Maurolicus muelleri). Greenland argentine was not included in the analyses due to lack of reconstructed size data (see above).
We used quantile regression (Scharf et al., 1998, 2000) to investigate how prey maximum and minimum sizes varied with ABFT size for each of these six species groups and for the combined community represented by these six species groups. Quantile regression compares percentiles of the dependent variable's frequency distribution in relation to an independent variable. We assumed that the 10th and 90th percentiles approximated the minimum and maximum sizes of prey consumed by bluefin tuna. Quantile regression analyses of these percentiles in relation to tuna size therefore can potentially quantify how these size extremes change with tuna size (length and weight), and whether minimum and maximum sizes both change at the same rates with tuna size. We conducted the prey size-predator size linear and quantile regression relationships using both length and weight estimates of sizes.
We subsequently investigated whether other variables affected the prey size composition of ABFT diets for the six most frequent prey species (see above). The variables considered in addition to ABFT length were those that could have been associated with the temporal (seasonal, inter-annual) and geographic distribution of prey: Julian date, year, latitude, and longitude of ABFT catch locations (i.e., starting location of the line settings). These analyses used generalized linear mixed models (GLMM) with Gaussian link function, and included ABFT length, Julian date, latitude, and longitude as numerical variables and year as a factor variable; individual ABFT was treated as random effect in the models. The best models were selected on the basis of Akaike Information Criteria (AIC) by stepwise removal of explanatory variables. Psuedo-R2 was calculated for the best GLMM models as described by Nakagawa and Schielzeth (2013); marginal R2 (i.e., variance explained by fixed factors) and conditional R2 (i.e., variance explained by fixed and random factors).
The occurrence and overall weight of all prey species in the ABFT diet was analyzed using generalized linear models (GLM). The analysis was performed in two steps as described in Stefánsson and Pálsson (1997). In the first step, the probabilities of empty stomachs using data on overall presence/absence of diet observation from 2398 ABFT were analyzed with logistic modeling using a Bernoulli variable (logit link function). In the second step, contents of the nonempty stomachs which were analyzed in detail for prey and size composition (i.e., N = 421), were modeled with a Gamma variable (inverse link function). Total prey weight in a stomach was treated as the response variable and the explanatory variables considered were ABFT fork length, Julian date, latitude, longitude, and year. The ABFT fork length variable was chosen to detect if large fish had an overall heavier stomach content than smaller fish, and other explanatory variables detected possible geographical and temporal variations in prey availability. We again used AIC and stepwise removal of the explanatory variables to select the best models. Pseudo-R2 or D2-adjusted was calculated to estimate the amount of deviance explained by the best models as equivalent to R2 in linear models as described by Guisan and Zimmermann (2000). We then repeated this two-step analysis for occurrence and prey weight in stomachs for the three most frequent prey species by occurrence and weight (European flying squid, gonate squid, barracudinas). We also estimated the diet weight relative to the predator weight (an indicator of stomach fullness; Butler et al., 2010) for each individual bluefin tuna in our analysis.
Statistical analyses were performed using R (R Core Team, 2013) and SAS (quantile regressions). GLMM were applied with the lme4 package (Bates et al., 2015) and pseudo-R2 analyses for GLMM and GLM models with the MuMIn (Barton, 2015) and modEvA (Barbosa et al., 2014), packages, respectively.
Results
Overall Diet Composition
The overall proportion of non empty stomachs was 85.9%, i.e., 2060 ABFT contained diet of the 2398 fish investigated for prey occurrence (i.e., Tables 1, 2). A total of 36 different prey taxa was observed in the subsample of 421 ABFT stomachs analyzed further for species composition: 17 teleost fishes, 4 squid, 1 octopus, 12 crustaceans (identified to species or higher taxa), and 2 other invertebrate species (Figure 2; Table 2). Calculations of Levin's niche breadth showed low-modest values (range: B = 1.396 – 2.003; BA = 0.016 – 0.046) and reflect unequal importance of prey species in the diet. This means that, although a fairly large number of species was consumed, the diet was dominated by a relatively small number of species (Table 3). Analyses of the niche breadth (B) showed no difference between ABFT size classes (F = 1.006, d.f. = 1; p = 0.499) and difference between East and West areas was slightly below significance level (F = 171.847; d.f. = 1; p = 0.048) (Table 3).
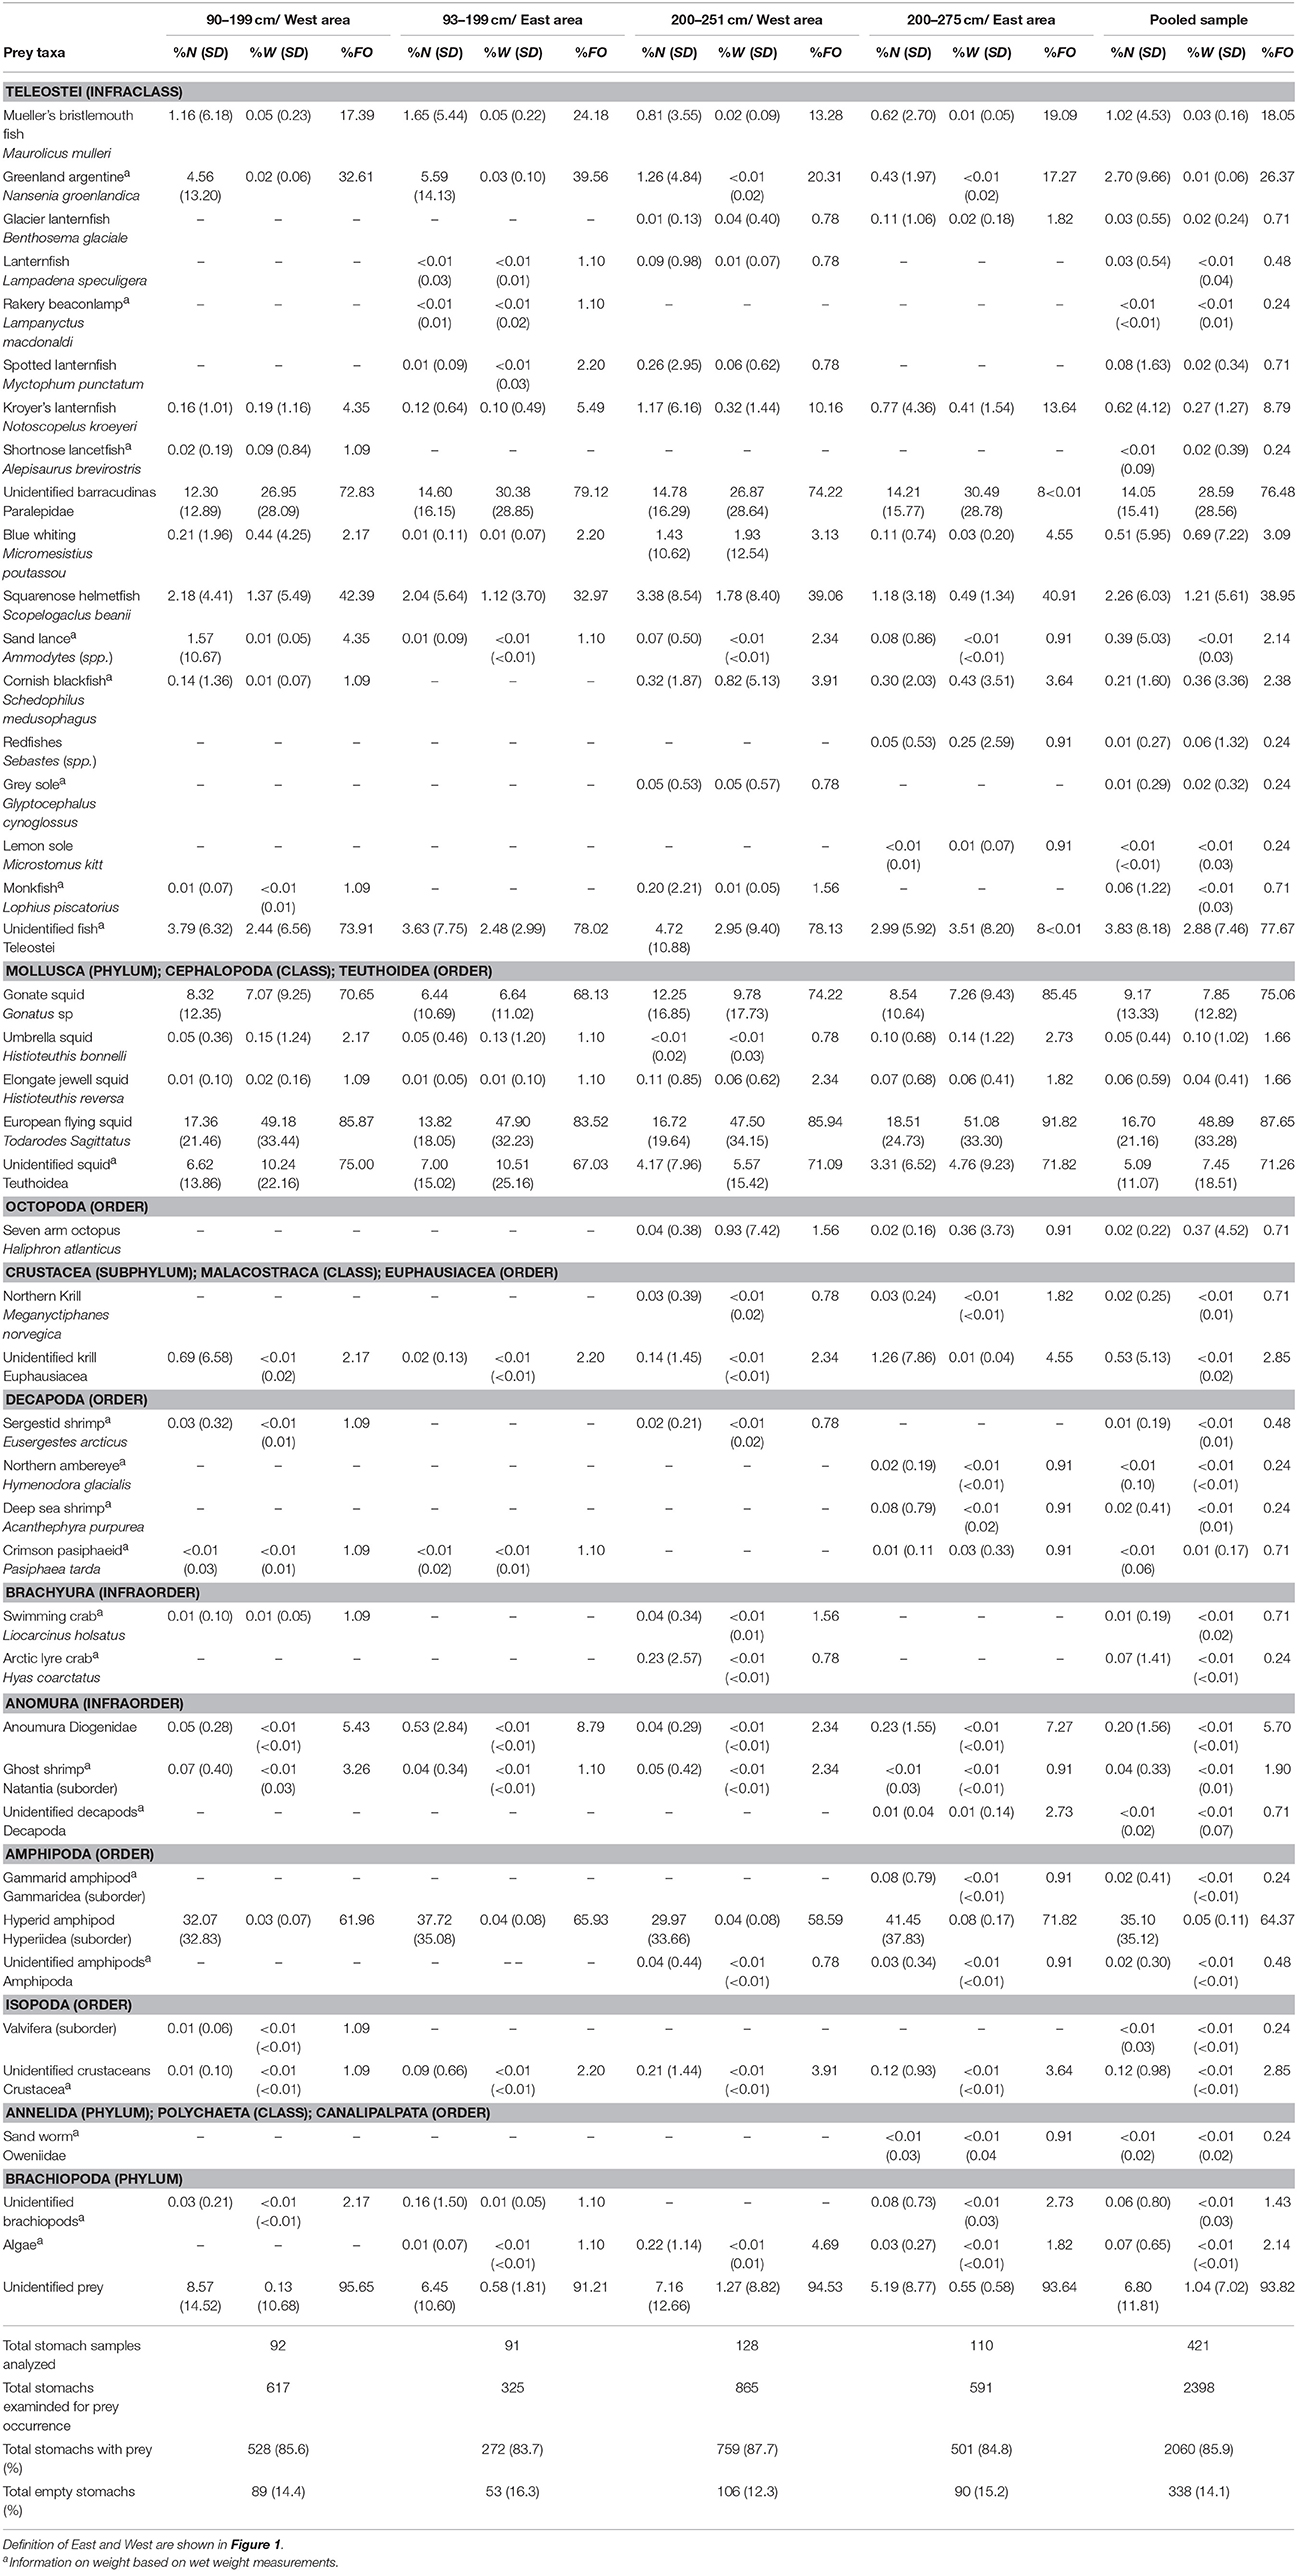
Table 2. Mean and standard deviation (SD) of percent number (%N) and percent weight (%W) and percent frequency of occurrence (%FO) of prey taxa in stomachs of Atlantic bluefin tuna Thunnus thynnus in the Iceland Basin during August to October 1998 and 1999.
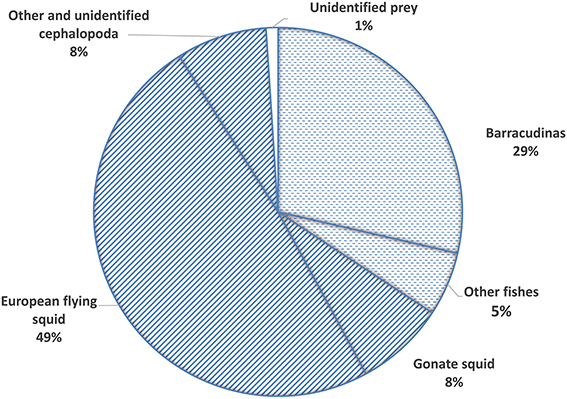
Figure 2. Mean percent weight (%W) of prey groups found in stomachs of Atlantic bluefin tuna Thunnus thynnus in the Iceland Basin in August to October 1998 and August 1999. Diagonal pattern represents squid and other invertebrates, dashed pattern represents fishes.
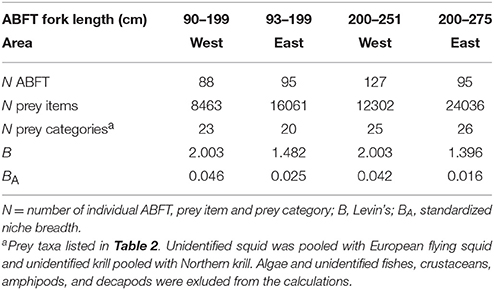
Table 3. Levin's niche breadth (B) and standardized nich breadth (BA) of Atlantic bluefin tuna Thunnus thynnus caught in the Iceland Basin during August to October 1998 and August 1999.
The most important prey species in both areas and size classes were European flying squid (%N = 16.70, %W = 48.89; %FO = 87.65), barracudinas (%N = 14.05, %W = 28.59, %FO = 76.48), and gonate squid (%N = 9.17, %W = 7.85, %FO = 75.06; Table 2). The most important prey species by frequency of number was hyperid amphipods but their small size resulted in minor importance in the overall biomass (%N = 35.10, %W = 0.05, %FO = 64.37). Other frequent prey in all areas were squarenose helmetfish (%N = 2.26, %W = 1.21, %FO = 38.95), Greenland argentine (%N = 2.70, %W = 0.01, %FO = 26.37), and Mueller's bristlemouth fish (%N = 1.02, %W = 0.03, %FO = 18.05) (Table 2).
Cumulative prey curves indicated sufficient sample sizes for the both areas and size categories (Figure 3). The slopes generated from the last four data points of the curves did not differ significantly from a slope of zero in any of the catagoreis, indicating that the curves had reached asymptote: West area and small size (t = 1.0; p = 0.33, d.f. = 19), East area and small size (1.77; p = 0.09; d.f. = 19), West area and large size (t = 1.76; p = 0.09: d.f. = 19), and East area and large size (t = 1.5; p = 0.15; d.f. = 19).
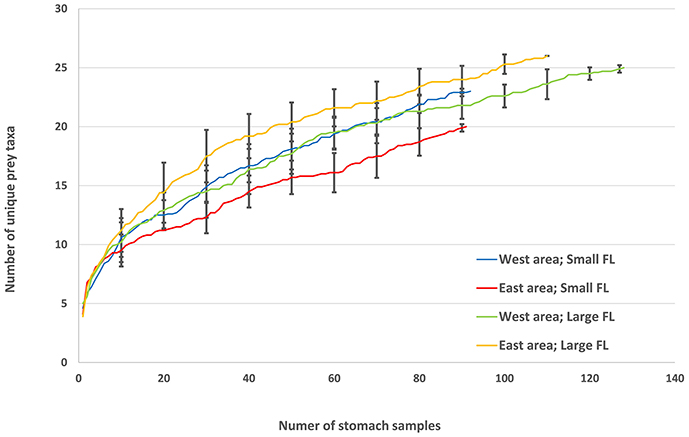
Figure 3. Randomized cumulative prey curves of Atlantic bluefin tuna Thunnus thynnus in the Iceland Basin in August to October 1998 and August 1999 for small (< 200 cm FL) and large (>199 cm FL) individuals in West area (west of 18°25′ W) and East area (east of 18°25′ W). Each point presents an average number of unique prey taxa of 10 random reordering iterations of stomach samples. Error bars show ±SD for every tenth stomach. (West area, < 200 cm: N samples = 88; N unique taxa = 23; East area, < 200: N samples = 95, N unique taxa = 20; West area, >199 cm: N samples = 127, N unique taxa = 25; East area, >199 cm: N samples = 95, N unique taxa = 26).
Prey Lengths
The reconstructed lengths of ABFT prey where length estimation was possible ranged from an estimated 3.8 mm gonate squid to a barradudina specimen of 565 mm. Among the six most important prey species by %FO, Mueller's bristlemouth fish was measured with the smallest average length of 42 mm (range: 24–73 mm) and barracudinas the largest average estimated length of 272 mm (range: 13–565 mm; Figure 4).
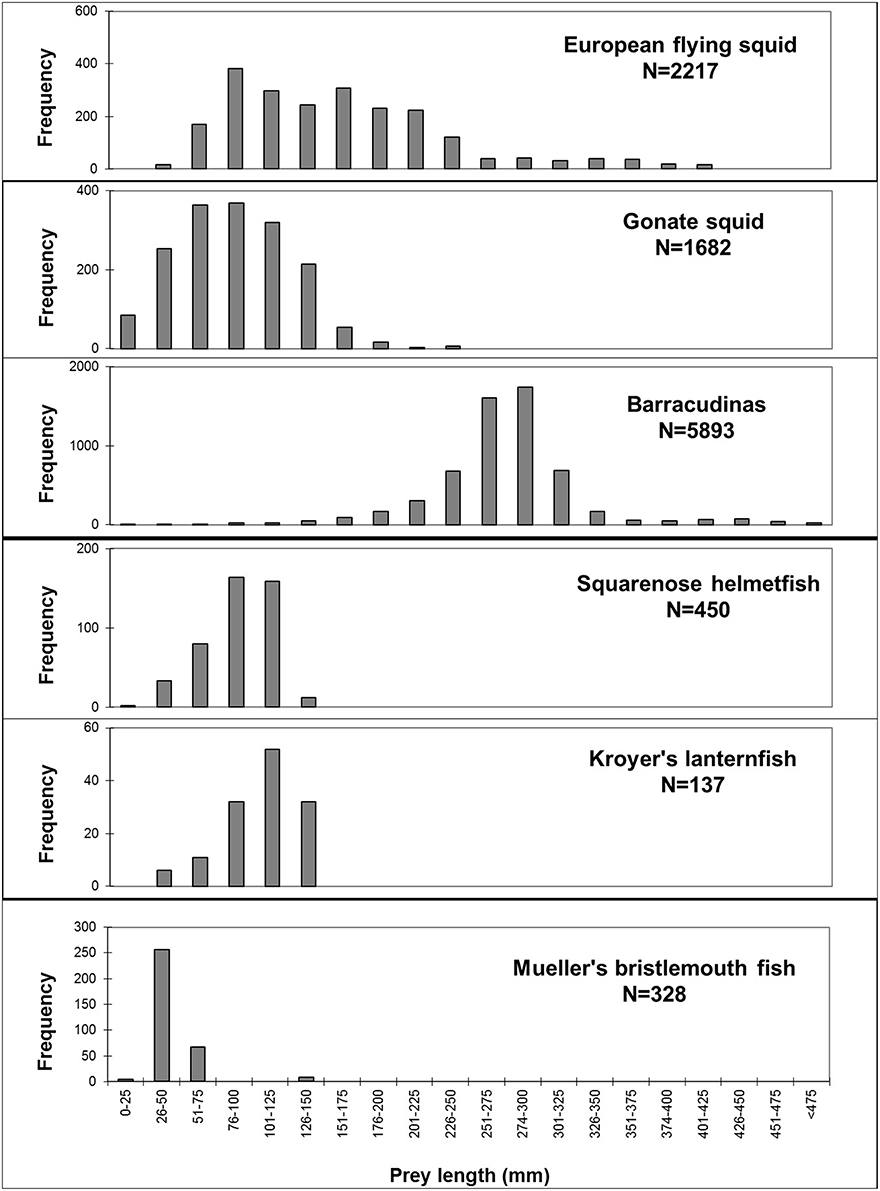
Figure 4. Length distribution of important prey species of Atlantic bluefin tuna Thunnus thynnus in the Iceland Basin, August to October 1998 and August 1999. Prey lengths are reconstructed lengths based on known relationship of hard body part and body lengths for each prey species; mantle lengths for European flying squid Todarodes sagittatus and gonate squid Gonatus sp. and fork lengths for barracudinas, squarenose helmetfish Scopelogadus beanii, Kroyer's lanternfish Notoscopelus kroeyeri, and Mueller's bristlemouth fish Maurolicus muelleri. N = number of measured prey itemes.
Prey length in general had relatively little association with ABFT length for the most important species consumed (Figures 5, 6; Table 4; Annexes 2–4), considered either individually (Figure 5; Annexes 2, 3) or as an aggregation (Figure 6; Annex 4). Although many of the relationships were significant at 5%, the explained level of variation was always very low, regardless of whether linear or quantile regression analyses were used (i.e., < 5%; Figure 5, showing six panels, and also Figure 6 showing the six species aggregated in one quantile regression analysis; Annex 2). When quantile regression relationships were significant they were usually positive, but not always (e.g., squarenose helmetfish). Among the significant quantile regression relationships within a species, slopes tended to be larger for the higher percentiles; however, the large uncertainty associated with all relationships indicates that the differences are not statistically significant (P > 0.05) and likely have minimal ecological importance (Figure 5).
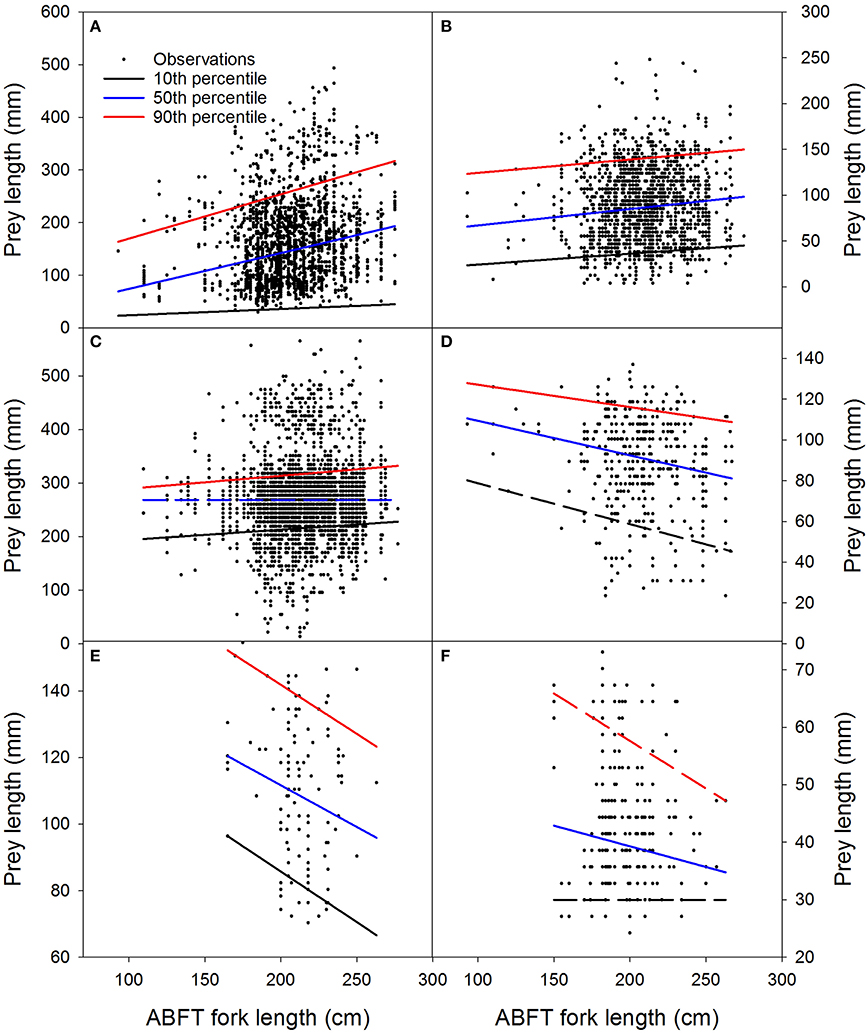
Figure 5. Relationship of Atlantic bluefin tuna Thunnus thynnus fork length and the lengths of the six most important prey species in the Iceland Basin, August to October 1998 and August 1999. (A) European flying squid Todarodes sagittatus, (B) gonate squid Gonatus sp., (C) barracudinas, (D) squarenose helmetfish Scopelogadus beanii, (E) Kroyer's lanternfish Notoscopelus kroeyeri, (F) Mueller's bristlemouth fish Maurolicus muelleri. Prey lengths are reconstructed estimates based on known relationship of hard body part and body lengths for each prey species; (A) and (B): mantle lengths, (C–F): fork lengths. Regression lines shown on the panels correspond to quantile regression lines estimated for the 10, 50, and 90th percentiles of the consumed prey size distributions. Solid lines are significant at P ≤ 0.05 and dashed lines are not significant (P > 0.05; Wald's test). Full statistical results for ordinary least squares and quantile regression analyses for these data are shown in Annexes 2, 3.
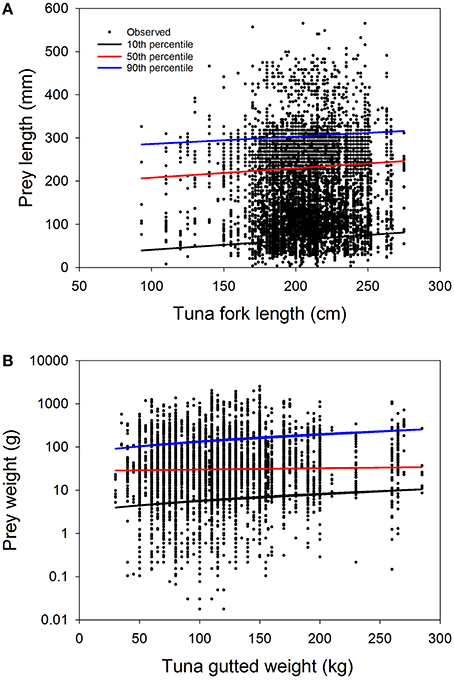
Figure 6. Overall prey—predator size relationships for Atlantic bluefin tuna Thunnus thynnus and its six most important prey groups in the Iceland Basin during late summer-autumn 1998–1999 (Gonataus sp., M. mulleri, N. kroeyeri, Paralepidae (barracudinas), N. beanii, T. sagitatus). (A) Tuna fork length and lengths of all six prey groups. (B) Tuna gutted weight and weights of all six prey groups. Note that in panel B the y-axis is shown with log10 scaling to improve visualization of the data although the regression was performed on untransformed data. Prey lengths and weights are reconstructed estimates based on known relationship of hard body part and body weights/lengths for each prey species where equations are available (see text for further clarification). Regression lines shown on the panels correspond to quantile regression lines estimated for the 10, 50, and 90th percentiles of the consumed prey size distributions. Full statistical results for quantile and ordinary least squares regression analyses for these data are shown in Annex 4.
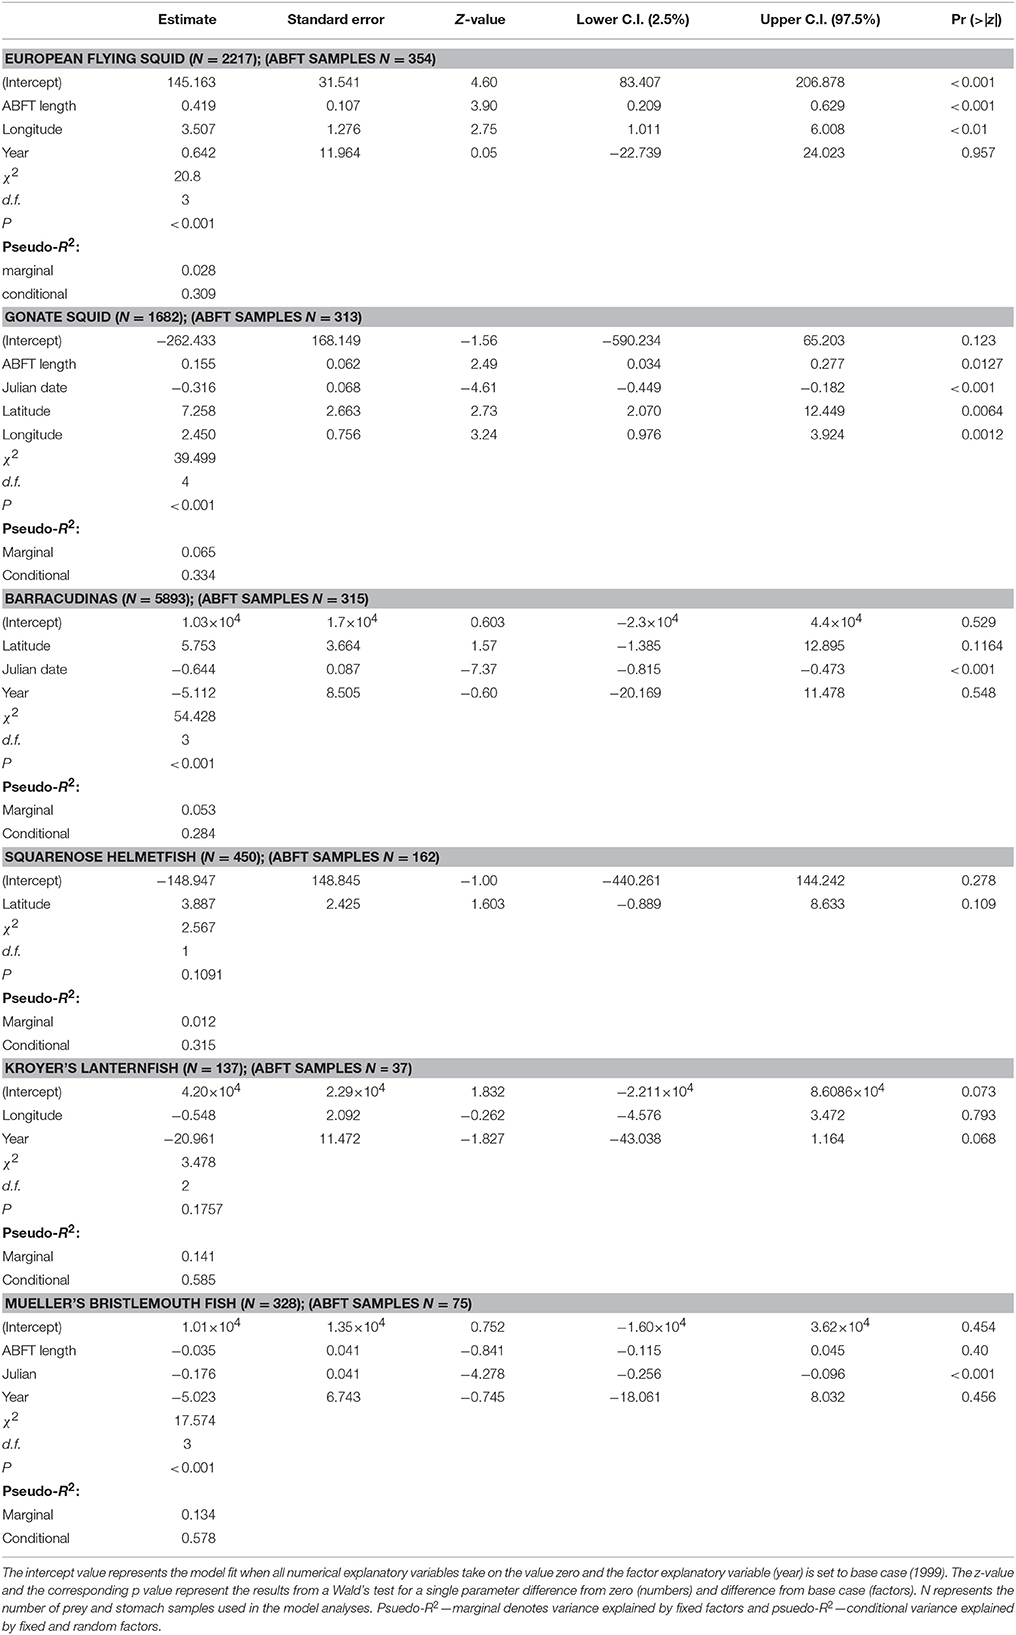
Table 4. Summary of the variables of the best GLMM models (with stomach sample as random effect), in terms of AIC, for the reconstructed body lengths of important Atlantic bluefin tuna Thunnus thynnus prey species (European flying squid Todarodes sagittatus, gonate squid Gonatus sp., barracudinas, squarenose helmetfish Scopelogadus beanii, Kroyer's lanternfish Notoscopelus kroeyeri, Mueller's bristlemouth fish Maurolicus muelleri).
GLMM analyses of the dependence of the prey total lengths on ABFT length, Julian date, latitude, and longitude showed that the lengths of European flying squid, gonate squid, and squarenose helmetfish were significantly correlated with the length of ABFT (although explained variances were very low), and that the lengths of barracudinas, Kroyer's lanternfish, and Mueller's bristlemouth fish varied independently of ABFT length (Figure 5). The GLMM analyses also showed some effects of other explanatory variables on the length distribution of the prey giving indications of temporal or geographical changes in the size distribution of these prey species during the feeding season (Table 4). Mantle lengths of European flying squid in ABFT stomachs increased from western to eastern longitudes (P < 0.01). For gonate squid, Julian date (P < 0.001), latitude (P < 0.01), and longitude (P < 0.01) explained significant variation in mantle lengths in ABFT stomachs: mantle lengths decreased throughout the season but increased with increasing latitude and from western to eastern longitude. Julian date explained some variations in barracudina and Mueller's bristlemouth fish lengths in ABFT stomachs (P < 0.001 for each species) and showed that the lengths declined throughout the season in both prey species.
Diet Weight
In the 421 diet samples analyzed further, the median weight of stomach content was 1097 g (75% quartiles: 416–2507 g) and the average weight was 1953 g, based on reconstructed weights. The maximum weight observed was 23299 g in a stomach from a 235 cm ABFT caught in October 1998. The diet weight as proportion of body weight (i.e., stomach fullness) ranged between 0–12%, with mean, median, and standard deviation equal to 1.4, 0.8, and 1.7%.
As observed above for prey length-ABFT length relationships, ABFT weight explained little variation (≤ 4%) in prey weight using linear regression. Linear and quantile relationships were often not significant for individual species (3 of 6 linear regressions, and 8 of 18 quantile regressions; Annexes 2, 3). Linear regressions were significant for flying squid, gonate squids and squarenose helmetfish. Quantile regression relationships were all significant (P < 0.05) for European flying squid, gonate squids and the barracudinas (Annex 3) and the aggregation of six species (Annex 4).
GLM analyses of the total diet weight and weight of three most important prey species in terms of %W representing about 89% of the total weight (European flying squid, gonate squid, and barracudinas) were performed in two steps. The first step testing for presence of diet in ABFT stomachs with a logistic model (N = 2398) showed that presence of any prey species was best explained according to AIC by a model with sampling year (p < 0.001) and latitude (p < 0.1) as explanatory variables (Table 5). The proportion of empty stomachs was 15.3 and 11.5% in 1998 and 1999, respectively, and the median latitude was 61.11 (75% range: 60.53–61.63) for empty stomachs and 61.12 (75 range: 60.55–61.73) for stomachs containing diet. This model explained 0.7% of the deviance in prey occurrence, and the biological meaning of the significant differences is therefore probably low. The best model in the second step in the analyses included ABFT fork length (p < 0.001) as an explanatory variable (Table 6), and explained 5.6% of the deviance in prey weight in the ABFT stomachs.
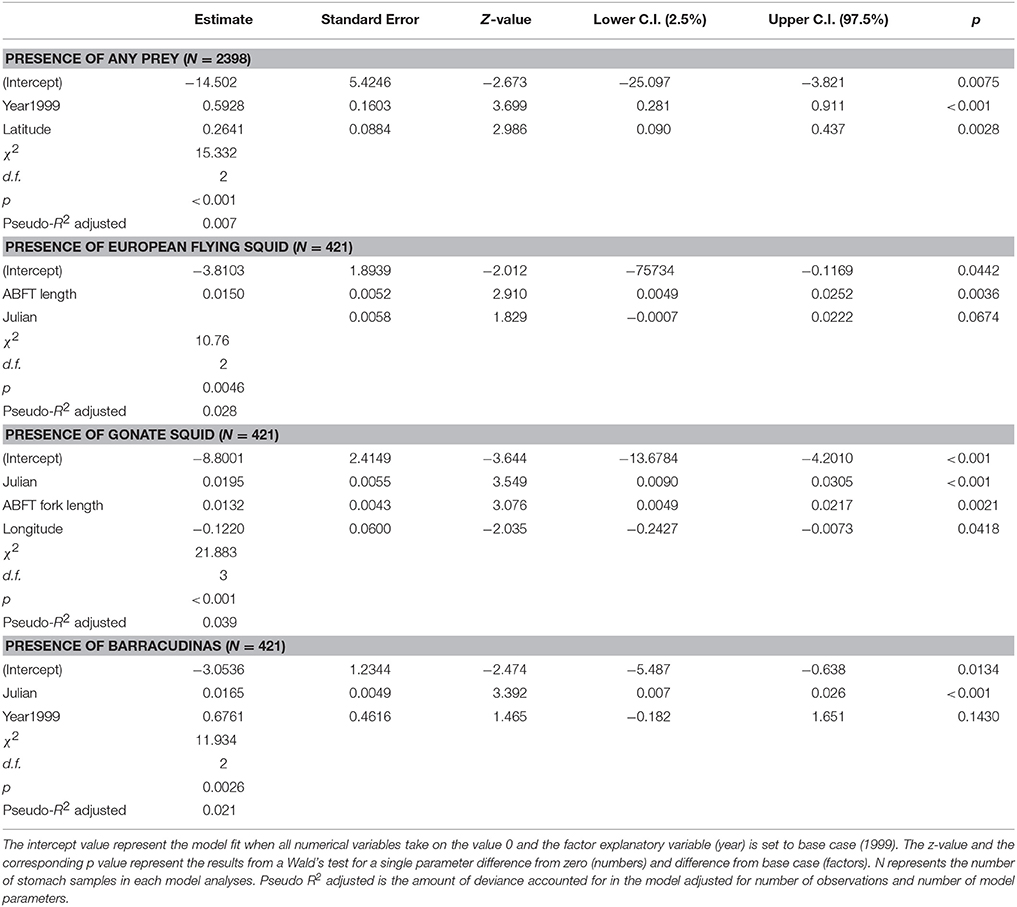
Table 5. Summary of the best GLM models in terms of AIC, for presence/absence of any prey in Atlantic bluefin tuna Thunnus thynnus stomachs (N = 2398) and for presence/absence of three most important prey species in tuna stomach samples containing prey (N = 421; European flying squid Todarodes sagittatus, gonate squid Gonatus sp., barracudinas).
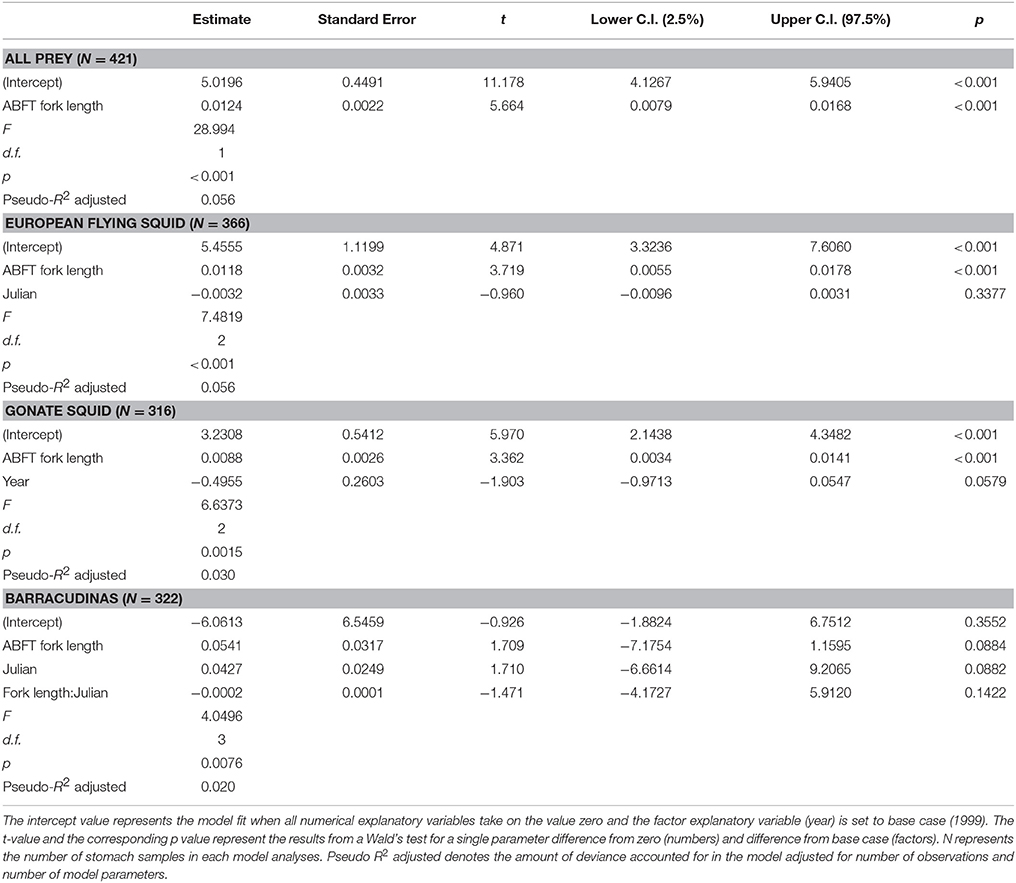
Table 6. Summary of the best GLM model in terms of AIC, for total weight of all prey in Atlantic bluefin tuna Thunnus thynnus stomachs containing prey (N = 421) and weight of three most important prey species in tuna stomachs containing the analyzed prey (European flying squid Todarodes sagittatus (N = 366), gonate squid Gonatus sp. (N = 316), barracudinas (N = 322).
The results of the GLM analyses on European flying squid showed that the presence of this species was best explained by ABFT fork length (p < 0.001) and Julian date (n.s) however, this model only explained 2.8% of the deviance (Table 5). The median fork length of ABFT where the squid was absent was 199 cm (75% quartiles: 180–212 cm) and in ABFT where the squid was present was 204 cm (75% quartiles: 189–220 cm). The best model in the second step also included ABFT length (p < 0.001) and Julian date (n.s.) and explained 5.6% of the deviance in weight of European flying squid in ABFT stomachs (Table 6).
The model best explaining the presence of gonate squid in the ABFT diet included ABFT length (p < 0.01), Julian date (p < 0.001), and longitude (p < 0.05) as independent variables, and explained 3.9% of the deviance in the occurrence of gonate squid in ABFT diets (Table 5). The median Julian date was 268 (75% range: 252–281) and 271 (75% range: 253–282) for ABFT with gonate squid absent and present, respectively. The median fork length of ABFT where the squid was absent was 199 cm (75% quartiles: 181–215 cm) and in ABFT where the squid was present was 205 cm (75% quartiles: 190–220 cm). The model in the second step of the analyses explaining best the gonate squid weight in the ABFT stomachs included ABFT fork length (p < 0.001) and sampling year (p < 0.05) as independent variables, explaining 3.0% of the deviance (Table 6).
GLM analyses of the weight of barracudinas in the ABFT stomachs showed that presence of this species in the ABFT diet was best explained by sampling year (n.s.) and Julian date (p < 0.001) however the model explained only 3% of the deviance in the data (Table 5). The best model in the second step of the analyses included ABFT fork length, Julian date as independent variables, and interaction between the two variables (P < 0.05). Neither variable showed significant effect and the overall model only explained 2.0% of the deviance in the data (Table 6).
Discussion
This study revealed a generalistic feeding behavior of ABFT during the autumn migration in the Iceland Basin. The prey composition indicates that the main feeding occurs in the mesopelagic layer at 200–400 m depth. The diet consists of prey of a wide size range and large variety of species, although most of the diet was dominated by a few key species. The results showed little spatial variation in the diet within the study area or temporal variation within the feeding season (1998) or between years of lower (1999) and higher (1998) ABFT CPUE.
Overall Diet Composition
The overall probability of occurrence of prey in the ABFT stomachs was 86%, which is consistent with previous studies on large ABFT in the North Atlantic [(81% off the coast of North Carolina, U.S.A (Butler et al., 2010); 91% in the Strait of Messina, central Mediterranean Sea (Battaglia et al., 2013), and somewhat higher than in some other areas e.g., 39% in the Levantine Sea, east Mediterranean Sea (Karakulak et al., 2009) and 35 and 69% reported off the east U.S. coast (Dragovich, 1970; Chase, 2002)]. Comparison of emptiness between studies may be somewhat ambiguous. Some of the between-region variability could be due to differences in post-capture survival time of the tunas before samples are taken e.g., in longline and trap fisheries. The dietary weight relative to ABFT weight had mean and median values of ca. 1%, which is similar to, or slightly higher than that found for ABFT in other regions (e.g., shelf waters near North Carolina: Butler et al., 2010; New England/Gulf of Maine: Crane, 1936; Chase, 2002) and similar to some other large migratory fish species in the northwest Atlantic (swordfish Xiphias gladius: Stillwell and Kohler, 1985).
The diet of the ABFT in the Iceland Basin in the present study was dominated by mesopelagic squid and fishes followed by krill and other crustaceans. The results are consistent with previous studies in the North Atlantic positioning large ABFT as a generalist predator feeding on a variety of fishes, cephalopods and crustaceans (Crane, 1936; Dragovich, 1970; Matthews et al., 1977; Holliday, 1978; Tiews, 1978; Chase, 2002; Karakulak et al., 2009; Battaglia et al., 2013). The results from the Iceland Basin differ however from studies on similarly sized ABFT from summer and autumn feeding areas in neritic zones in the North Atlantic where the diet consisted mainly of sublittoral and epipelagic species (e.g., sand lance, Atlantic menhaden, anchovy, herring, mackerel, and bullet tuna) (Crane, 1936; Dragovich, 1970; Matthews et al., 1977; Tiews, 1978; Chase, 2002; Butler et al., 2010; Battaglia et al., 2013). These differences reflect different oceanographic conditions, and consequently biogeographic distributions of potential prey species, in the neritic zones compared with conditions and distributions in the Iceland Basin where depth exceeds 1000 m (Malmberg, 2004) and in other offshore areas where mesopelagic fishes and squid species have been reported as larger component of the ABFT diet (Dragovich, 1970; Matthews et al., 1977; Karakulak et al., 2009). Information on diving profiles from archival tagging studies on ABFT have shown different feeding behavior in coastal and offshore areas (Wilson and Block, 2009). Diving patterns related to feeding activities in coastal areas was usually shallower (50–150 m) and with frequent surface returns. Feeding dives in offshore area near Florida and Bahamas showed deeper dives and with longer duration (Wilson and Block, 2009). Unpublished data from the Wilson and Block (2009) study showed both types of feeding dives in the Iceland Basin indicating that the tuna may feed in the upper layers as well as at larger depths (Wilson and Block, unpublished data).
The feeding migration of ABFT to northern areas is believed to have evolved partly to enable the species to forage on energy-rich prey species (Cury et al., 1998; Block and Stevens, 2001). Bluefin tuna possess an efficient thermoregulatory ability that allows an otherwise temperate-tropical species to inhabit boreal-temperate waters for several months each year (Block and Stevens, 2001), and allows a higher power output of swimming muscles (Block et al., 2001). These behavioral and physiological adapatations are rare among marine fishes (Cury et al., 1998; Block and Stevens, 2001). Given the long distance between spawning and foraging areas, it is therefore relevant to evaluate how large the energy content of the dominant prey species in the Iceland Basin was in comparison to that of other common bluefin tuna prey in foraging areas, particularly given that this region is one of the remotest from spawning areas among bluefin tuna foraging sites.
For the three main species that dominated ABFT diets, lipid, and energy content information is scarce and based on limited sampling. For example, the lipid content of European flying squid was estimated to be < 1% of wet weight, based on three individuals from the Adriatic Sea (Perugini et al., 2006); its energy density was estimated to be 3.8 kJ/g (Åsgård, 1987), and therefore considered to be similar to that of lean fish. Squids belonging to Gonatus sp. have a lipid content of 10.9% (wet weight basis), which is moderate and nearly as high as herring (13.7%; Lawson et al., 1998); Gonatus energy content (6.9 kJ/g wet weight) is higher than that of mackerel (6.0), but lower than herring (9.4; Steimle and Terranova, 1985; Lawson et al., 1998). The dominant fish species group preyed on by ABFT in the Iceland Basin was barracudinas and other mesopelagic fish. There are few studies of the energy content of this species, but one study based on one sampling event off Cape Breton, Nova Scotia, Canada showed that its lipid content was 17% by wet weight (Ackman et al., 1972). This amount is considerably higher than the lipid content of other prey species consumed by ABFT and considered to be lipid-rich (Steimle and Terranova, 1985; Lawson et al., 1998; Litzow et al., 2006). The lipid content of other mesopleagic fish in this region is not known but in other regions, mesopelagic fish are known to have relatively high lipid levels (e.g., 15–25%; Saito and Murata, 1998). The limited lipid and energy density information suggests that ABFT fed on a diet comprising both lipid-rich and -poor species (respectively, barracudinas and squids) in 1998–99. However, new measurements of the lipid and energy content of the dominant prey species in this region are necessary to confirm these preliminary interpretations, and to address the energetic benefits and costs of migration to this region (Chapman et al., 2011). Such information could be used to improve parameterisations of advanced migratory behavior and habitat use models (Mariani et al., 2015; Druon et al., 2016).
Predator to Prey Size Relationship
The size of ABFT prey in this study ranged from small invertebrates and fishes to 56 cm barracudinas. Significant predator to prey length relationships as detected by for example quantile regression were observed for European flying squid, gonate squid prey, barracudinas and squarenose helmetfish and the aggregation of the six most important species considered collectively, but the variation explained was low (< 5%). This result indicates that other factors have important effects on the size of prey consumed by ABFT, such as for example the relative abundance and spatial distributions of different potential prey species. The largest average and maximum prey lengths were observed for barracudinas but also for this species group, whose sample size was also largest, the level of explained variation in the prey-predator length relationship was low (< 1%). On the other hand, the squarenose helmetfish with an overall size range of 93–267 mm decreased significantly in length with increased ABFT length. Previous studies on adult ABFT diet from the NE Atlantic have also reported a wide overall range of prey sizes [off New England coast: 104–273 mm (Chase, 2002); off eastern US coast, north of Bermuda to Azores: 30–800 mm (Matthews et al., 1977)]. A significant predator to prey relationship was observed for sand lance and mackerel off New England (Chase, 2002).
The quantile regression analyses showed that the extremes of the consumed prey size distributions (i.e., 10th or 90th percentiles) changed at different rates than the medians, at least for some individual prey species (e.g., European flying squid, barracudinas; Annex 3). These patterns indicate that the overall range of prey sizes consumed by ABFT changes with ABFT size. It is however not possible in this study to resolve whether these patterns reflect a true change in feeding behavior or preference for different prey sizes by the tuna at different sizes, or a difference in abundance of, or encounter with (e.g., via diving), differently sized prey for small and large tunas.
The weak predator-prey size relationships we observed demonstrates that ABFT is a generalistic consumer and that the length and weight distributions observed in the diet may be more strongly affected by spatial or temporal changes in the distribution and availability of different prey sizes rather than a strong preference by ABFT for prey of specific sizes. For example, now that mackerel have become more common in Icelandic and east Greenland waters in the last 5–10 years and that these mackerel are primarily adults (ca. 19–40 cm long) (Astthorsson et al., 2012; Jansen et al., 2016; Olafsdottir et al., 2016), they may become an important prey in bluefin tuna diets in this region, as they are in other northern foraging regions (Tiews, 1978; Chase, 2002). Consequently the relative size composition of bluefin tuna diets might shift to larger size groups. Consumption of relatively large prey, if available in high concentrations, may confer energetic advantages, relative to smaller prey and could help ABFT achieve high body condition (Golet et al., 2015). New studies are needed to assess how these dietary patterns affect other aspects of ABFT ecology in the region.
Main Prey Species of ABFT in the Iceland Basin
European flying squid was the most important prey species for ABFT in the Iceland Basin in terms of frequency of occurrence and weight. The model analyses showed that total weights and individual lengths of the European flying squid in ABFT stomachs were significantly related to predator size. The European flying squid lengths in stomachs also co-varied with longitude which may suggest spatial variations in the distribution of the squid. All size classes of the squid reported previously in the autumn from the areas southwest of Iceland and west of Scotland and Ireland were present in the ABFT diet (Jonsson, 1998; Lordan et al., 2001). However, the distribution of European flying squid is stratified in the water column by length, and squid larger than 250 mm, which were rare in the ABFT diet, are most frequent below 400 m west of Scotland and Ireland (Lordan et al., 2001). Ontogenic horizontal or vertical migration of European flying squid is known from western European waters in the autumn where smaller squid migrate into shallow waters presumably to feed (Lordan et al., 2001). The observed increase in the mantle lengths of European flying squid from western to eastern longitudes in the present study may be caused by shifts in distribution in relation to these migrations (Jonsson, 1998; Lordan et al., 2001).
Autumn migrations of European flying squid into shallow waters south of Iceland have been sporadic and irregular in the past (Jonsson, 1980, 1998). Fluctuations in historical catches in the waters west of Scotland are also known and are presumably caused by ecological or environmental factors rather than overfishing (Lordan et al., 2001). The immense importance of the European flying squid in the ABFT diet in the ocean south of Iceland observed in the present study may lead to the conjecture that ABFT autumn feeding migration into the area may to some extent be affected by the abundance of European flying squid.
Gonate squid was an important component of the diet in the Iceland Basin. The gonate squid in the ABFT diet probably consist of two sympatric species with overlapping distribution in the waters south of Iceland. These are the Arctic and subarctic species Boreoatlantic gonte squid (Gonatus fabricii) and the temperate species Atlantic gonate squid (G. steenstrupi; Kristensen, 1981; Bjørke, 2001). The biology and ecology of the species are similar. The larvae and juvenile squid are found in the epipelagic zone but the squid submerge to deeper waters when reaching mantle lengths of approximately 50–70 mm. Larger gonate squid may be found near the surface at night but are mainly distributed at depths below 200 m and into the bathypelagic zone (Kristensen, 1981; Bjørke, 2001; Hastie et al., 2009). The size distribution in the ABFT diet consists of medium sized squid but the smallest and largest length groups were rare. This size range in the ABFT stomachs suggests that foraging on gonate squids mainly takes place below 200 m.
Total weights of gonate squid in ABFT stomachs and individual mantle lengths in the diet were affected by ABFT length according to the GLM and GLMM analyses, respectively. Gonate squid lengths were also affected by other factors and decreased slightly throughout the season but increased from south to north and from west to east. These effects suggest temporal and geographical or vertical shifts in the distribution of gonate squid in the area. More information on the biology and distribution of gonate squid species in the area is necessary to interpret their importance in the ABFT diet.
Barracudinas were the most important fish species or group in the ABFT diet in the Iceland Basin. The total weight of barracudinas in stomachs did not show any clear pattern but its presence in ABFT stomachs was significantly associated with Julian date in the GLM analyses showing increased occurrence throughout the sampling period. Simultaneously the fish lengths of barracudinas decreased. These results are difficult to interpret without proper species identification of baracudina species in the diet and better information on the distribution of the species in the area.
Three barracudina species are found in mesopelagic and bathipelagic zones in offshore waters south of Iceland. White barracudina (Arctozenus risso), reaches 30 cm and is mainly distributed at 200–1000 m. Atlantic barracudina (Magnisudis atlantica), reaches 56 cm and is mainly distributed at 50–2000 m and lancetfish (Paralepis coreogonoides), reaches 50 cm and is distributed from 50 m to below 1000 m (Jonsson et al., 2006). White barracudina is the most abundant barracudina species caught in mesopelagic trawls in the Irminger Sea (Magnusson, 1996; Sigurdsson et al., 2002). The length distribution reported from the catches in the Irminger Sea also resembles the size distribution in the ABFT diet in the present study, giving further indications that the barracudina species in the ABFT diet south of Iceland belongs to white barracudina. However, possibility of selectivity of the fishing gear or seasonal difference in the distribution of barracudinas cannot be excluded as the trawl surveys were conducted in June to July (i.e., 2–4 months before the tuna were caught).
Caveats and Potential Biases of Stomach Content Data
Several factors which may affect prey sample collection and analyses must be considered when interpreting stomach content results and prey size data based on reconstructed estimations (for review see Pierce and Boyle, 1991). The long soaking time of the fishing gear in the present study and possible post-entanglement survival of the tunas and relatively fast digestion in tunas (Carey et al., 1984; Dickson and Graham, 2004; Graham and Dickson, 2004; Blank et al., 2007) may have resulted in underestimation of the occurrence of fast digested prey such as small invertebrates and fish with small otoliths compared to larger prey with slowly digested hard particles. For the same reason: i.e., relatively high digestion level of the prey it was considered more feasible to use reconstructed prey sizes rather than direct size measurements in the data analyses. Application of reconstructed prey sizes may have its disadvantages as some hard parts such as squid beaks and otoliths may accumulate in the predators' stomachs (Bowen, 2000; see reviews in Pierce and Boyle, 1991). Prey sample contents may therefore represent longer consumption than the last meal and the prey with the slowest turnover rate in the stomachs will be overestimated. Another underestimation bias may occur in the frequency of weight for prey where wet weight was used in the absence of equations for estimation of reconstructed sizes. This probably had most effects on the estimation of Greenland argentine leading to overall underestimation of its importance in the ABFT diet. The fish was found in 26% of the stomach samples but was estimated below 5% of the frequency of weight.
Feeding Niche of ABFT in the Iceland Basin Ecosystem
Here, we have found that ABFT diets were dominated by a relatively small number of species, which primarily are associated with mesopelagic habitat. The prey consumed by bluefin tuna in this region is assumed to some extent to reflect the availability of species and sizes in their surrounding habitat. However, information on the ecosystem and the trophic interactions in the Iceland Basin is still limited. A series of trawl and acoustic surveys targeting pelagic redfish (Sebastes mentella) in the Irminger Sea southwest of Iceland that is separated from the Iceland Basin by the Reykjanes ridge (Figure 1), may give an indication of the mesopelagic and bathypelagic fishes in the adjacent Iceland Basin (Magnusson, 1996; Sigurdsson et al., 2002; Lamhauge et al., 2008; ICES, 2013). This information should however be viewed with precautions when concluding on the ecosystem in the Iceland Basin. The oceanography of the basins differs and studies have shown lower biomass and deeper vertical distributions on the eastern side of the Reykjanes ridge than on the western side (Sutton and Sigurdsson, 2008).
Acoustic surveys in the Irminger Sea show a horizontal layer of echo sounding scatter from fish swim bladders, called the deep scattering layer (DSL), in the mesopelagic zone. Seasonal changes in the depth of the DSL have been observed as well as extensive diurnal vertical movements. The upper border of the layer at daytime ranges from about 500 m in June/July to about 400 m in September and the lower border extends to 600–700 m depths. At dusk part of the DSL ascends toward the epipelagic zone and remains there until dawn (Magnusson, 1996; Reynisson and Sigurdsson, 1996; ICES, 2013).
Results from trawl surveys in the Irminger Sea show some similarities in species composition of the DSL in the Irminger Sea and the ABFT diet in the Iceland Basin. High abundance of squid and lanternfishes (Mytophydae) in the trawls is consistent with the results of ABFT diet in the present study (Magnusson, 1996; Sigurdsson et al., 2002). Furthermore, Magnusson (1996) observed a large abundance of white barracudina (Notolepis rissoi = Arctozenus risso) in surveys from 1993–1995 that may resemble the unidentified barracudinas in the ABFT diet. The trawl surveys have shown some changes in species composition with depth and many species with the highest abundance at depths below 500 m were rare or absent in the ABFT diet, e.g., viperfish (Chauliodus sloani), rakery beakonlamp (Lampanyctus macdonaldi), sawtooth snipe cat (Serrivomer beanie), Goiter blacksmelt (Bathylagus euryops), boa dragonfish (Stomias boa ferox), and crested bigscale (Poromitra crassiceps) (Magnusson, 1996; Sigurdsson et al., 2002). This may give indications that ABFT feed in the upper layers of the DSL.
Studies from the Norwegian Sea and off Great Britain show large abundances of Müller's bristlemouth fish and Kroyer's lantern fish which is in agreement with the present study (Gjøsæter and Kawaguchi, 1980). Large abundance of glacier lanternfish in many areas of the NE-Atlantic are on the other hand not reflected in the ABFT diet in the present study (Gjøsæter and Kawaguchi, 1980; Sutton and Sigurdsson, 2008).
Studies of ABFT migration and diving patterns using archival tagging and ultrasonic telemetry have shown that ABFT may sustain temperature as low as 3°C and as high as 30°C (Block et al., 2001) and that ABFT frequently dive to depth of 500 to 1000 m (Lutcavage et al., 2000; Brill et al., 2002; Block et al., 2005; Walli et al., 2009; Wilson and Block, 2009). Unpublished data from an ABFT tagged as 205 cm in January 2003, entering the Iceland Basin in August to September in 2003 and 2004 showed frequent feeding dives to depths as deep as 300–400 m (Wilson and Block, unpublished data).
Comparisons of the archival tag diving information, species and size distribution of ABFT prey and information on the zooplankton in the Iceland Basin indicate that the ABFT in the area feeds during daytime at depths above 300–400 m. The species composition of the diet shows that the ABFT does not feed below the mesopelagic layer. The size distribution of the prey and information from archival tags indicate that ABFT feeds as deep as the upper border of the DSL. It is not known to what extent the diving behavior of ABFT is affected by physiological constraints. Low temperature and high energetic cost of diving to large depths are plausible factors limiting the diving range (Dickson and Graham, 2004; Graham and Dickson, 2004).
ABFT Feeding in Changing Environment in Northern Regions
Oceanographic conditions are changing in the North Atlantic, and the biogeographic distributions of living organisms will also likely change. Rapid changes in the distribution of fishes observed in the neritic and epipelagic regions of NE-Atlantic in the past decades have been explained by climate changes (Astthorsson and Pálsson, 2006; Astthorsson et al., 2012). The most prominent change observed in the waters off Iceland in recent years is the large migration of Atlantic mackerel in the summer and early autumn (Astthorsson and Pálsson, 2006; Oskarsson et al., 2012; Jansen et al., 2016). It is, however, unclear how and whether the distribution and abundance of the mesopelagic species that comprised ABFT diets in our study have changed in the last two decades or if Atlantic mackerel has become prominent in the ABFT diet in the area since our study.
If mesopelagic oceanographic conditions respond to climate change at similar rates as pelagic conditions, then any newly immigrating ABFT to the region would probably have a different and more diverse menu of prey species in the area than was present during our study. New dietary studies should be conducted to investigate how the trophic role of ABFT might change due to changes in the prey community, and the consequences of such changes for ABFT growth and fat content (Golet et al., 2007; Goñi and Arrizabalaga, 2010). Further, studies should also aim to explore ABFT's ability to adapt to changes in vertical distribution of the prey species and possible physiological constraints limiting ABFTs' ability to exploit the preferred depths e.g., thermoregulation and energetics which may vary by ABFT size and body condition (Dickson and Graham, 2004; Graham and Dickson, 2004).
It is likely that ABFT has re-entered the Iceland Basin region after a period of low abundance in the preceding 10–12 years. Iceland (and Norway) had commercial fishing quotas for the species in their waters in 2014 and 2015 (Nora Region Trends, 2014; UndercurrentNews, 2014; Iceland Review, 2015), and the species may have traversed the region on the way to the Denmark Strait where it was captured in the summers of 2012 (MacKenzie et al., 2014) and 2014 (Government of Greenland, 2014). Further, monitoring and understanding of the dynamics of the mesopelagic and pelagic ecosystem in northern regions would strengthen the understanding of factors affecting the migration and distribution of ABFT at northern feeding grounds, the feeding preferences and trophic role of ABFT in these food webs and the impact of this feeding on ABFT growth and fat content.
Author Contributions
DO organized the diet sample analyses, planned, and conducted the statistical analyses, interpreted results and lead the writing process of the MS. BM participated in planning and conducting statistical analyses, interpreting results, and writing of the MS. VC organized sampling, measurements, and analyses of otolith samples from prey species used as reference source in the analyses, participated in diet sample analyses and interpretation of results. TI organized the surveys and collection of diet samples and participated in analyses of samples.
Conflict of Interest Statement
The authors declare that the research was conducted in the absence of any commercial or financial relationships that could be construed as a potential conflict of interest.
Acknowledgments
The data and sample collection were part of experimental longline fisheries operated as cooperation of the Marine Research Institute, Iceland and MAR Company Ltd, Japan. The crews of the vessels: Houken-Maru no. 8, Kenkyu-Maru no. 38, Ryou-Maru no. 28, Tokuyu-Maru no. 38, Yasu-Maru no. 28 are thanked for the assistance and hospitality onboard the vessels. The research observers: Birgir Stefánsson, Einar Ásgeirsson, Elva Björk Einarsdóttir, Friðrik Friðriksson, Guðmundur Arason, Guðmundur Gunnarsson, Guðmundur Magnússon, Haukur Friðjófsson, Hilmar Árnason, Hlynur Pétursson, Kjartan Kjartansson, Kristinn H. Guðmundsson, Lúðvík Karlsson, Magnús Ástvaldsson, Martin Eamon Tighe, Ólafur Freyr Gíslason, Páll Jóhann Pálsson, Sævar Helgason, Sigmar Sveinsson, Sigurvin Jónsson, and Suni Olsen are thanked for their hard work under harsh condition during the operation. Mr. Ogino Yuzuru is thanked for his invaluable role as language and culture interpreter during the surveys. Mr. Erlingur Hauksson and Mr. Valur Bogason gave access to unpublished fish otolith equations and Dr. Steven G. Wilson and Dr. Barbara A. Block from Stanford University to unpublished data from archival tag No. A0618 on ABFT diving profiles from the Iceland Basin in August to September in 2003 and 2004. The project received funding from the European Commission FP7 projects EURO-BASIN (European Basin-Scale Analysis, Synthesis, and Integration; Grant Agreement 264933) and NACLIM (North Atlantic Climate; Grant Agreement 308299).
Supplementary Material
The Supplementary Material for this article can be found online at: https://www.frontiersin.org/article/10.3389/fmars.2016.00108
References
Ackman, R. G., Hooper, S. N., Epstein, S., and Kelleher, M. (1972). Wax esters of barracudina lipid: a potential replacement for sperm whale oil. J. Am. Oil Chem. Soc. 49, 378–382. doi: 10.1007/BF02633394
Åsgård, T. (1987). Squid as feed for salmonids. Aquaculture 61, 259–273. doi: 10.1016/0044-8486(87)90154-2
Astthorsson, O. S., and Pálsson, J. (2006). New Fish Records and Records of Rare Southern Fish Species in Icelandic Waters in the Warm Period 1996-2005. ICES CM. Available online at: http://www.ices.dk/sites/pub/CM%20Doccuments/2006/C/C2006.pdf [Accessed January 9, 2016].
Astthorsson, O. S., Valdimarsson, H., Guðmundsdottir, A., and Oskarsson, G. J. (2012). Climate related variations in distribution and abundance of mackerel (Scomber scombrus) in Icelandic waters. ICES J. Mar. Sci. 69, 1289–1297. doi: 10.1093/icesjms/fss084
Barbosa, A. M., Brown, J., Jiménez-Valverde, A., and Real, R. (2014). modEvA: Model Evaluation and Analysis. R Package, Version 1.1. Available online at: http://modeva.r-forge.r-project.org/ [Accessed July 1, 2014].
Bard, F. X., Pascal, B., and Josse, E. (1998). Habitat, Ecophysioligie des Thons. Col. Vol. Sci. Pap. ICCAT 50, 319–341. Available online at: http://iccat.es/Documents/CVSP/CV050_1998/no_1/CV050010319.pdf [Accessed July 1, 2015].
Barton, K. (2015). MuMIn: Multi-Model Inference. R Package Version 1.15.1. Available online at: http://CRAN.R-project.org/package=MuMIn
Bates, D., Maechler, M., Bolker, B. M., and Walker, S. (2015). Fitting Linear Mixed-Effects Models using lme4. ArXiv E-Print J. Stat. Softw. Available online at: http://arxiv.org/abs/1406.5823>.
Battaglia, P., Andaloro, F., Consoli, P., Esposito, V., Malara, D., and Musolino, S. et. al. (2013). Feeding habits of the Atlantic Bluefin Tuna, Thunnus Thynnus (L. 1758), in the Central Mediterranean Sea (Strait of Messina). Helgol. Mar. Res. 67, 97–107. doi: 10.1007/s10152-012-0307-2
Bizzarro, J. J., Robinson, H. J., Rinewalt, C. S., and Ebert, D. A. (2007). Comparative feeeding ecology of four sympatric skate species off central California, USA. Environ. Biol. Fishes 80, 197–220. doi: 10.1007/s10641-007-9241-6
Bjørke, H. (2001). Predators of the squid Gonatus fabricii (Lichtenstein) in the Norwegian Sea. Fish. Res. 52, 113–120. doi: 10.1016/S0165-7836(01)00235-1
Blank, J. M., Farwell, C. J., Morrissette, J. M., Schallert, R. J., and Block, B. A. (2007). Influence of swimming speed on metabolic rates of juvenile pacific bluefin tuna and yellowfin tuna. Phys. Biochem. Zool. 80, 167–177. doi: 10.1086/510637
Block, B. A., Dewar, H., Blackwell, S. B., Williams, T. D., Prince, E. D., Farwell, C. J., et al. (2001). Migratory movements, depth preferences, and thermal biology of Atlantic Bluefin Tuna. Science 293, 1310–1314. doi: 10.1126/science.1061197
Block, B. A., and Stevens, E. D. (2001). Tuna: Physiology, Ecology and Evolution. San Diego, CA: Academic Press, 468.
Block, B. A., Teo, S. L. H., Walli, A., Boustany, A., Stokesbury, M. J. W., Farwell, C. J., et al. (2005). Electronic tagging and population structure of Atlantic bluefin tuna. Nature 434, 1121–1127. doi: 10.1038/nature03463
Bowen, W. D. (2000). Reconstruction of pinniped diets: Accounting for complete digestion of otoliths and cephalopod beaks. Can. J. Fish. Aquat. Sci. 57, 898–905. doi: 10.1139/f00-032
Brill, R. W., Lutcavage, M. E., Metzger, G., Bushnell, P. G., Arendt, M., Watson, C., et al. (2002). Horizontal and vertical movements of juvenile bluefin tuna (Thunnus thynnus) in relation to oceanographic conditions of the western North Atlantic, determined with ultrasonic telemetry. Fish. Bull. 100, 155–167. Available online at: http://fishbull.noaa.gov/1002/01brillf.pdf [Accessed August 8, 2015].
Butler, C. M., Rudershausen, P. J., and Buckel, J. A. (2010). Feeding Ecology of Atlantic Bluefin Tuna (Thunnus Thynnus) in North Carolina: Diet, Daily Ration, and Consumptionof Atlantic Menhaden (Brevoortia Tyrannus). Fish. Bull. 108, 56–69. Available online at: http://fishbull.noaa.gov/1081/butler.pdf [Accessed August 8, 2015].
Carey, F. G., Kanwisher, J. W., and Stevens, E. D. (1984). Bluefin tuna warm their viscera during digestion. J. Exp. Biol. 109, 1–20.
Chapman, E. W., Jørgensen, C., and Lutcavage, M. E. (2011). Atlantic bluefin tuna (Thunnus thynnus): a state dependent energy allocation model for growth, maturation, and reproductive investment. Can. J. Fish. Aquat. Sci. 68, 1934–1951. doi: 10.1139/f2011-109
Chase, B. C. (2002). Differences in diet of Atlantic bluefin tuna (Thunnus thynnus) at five seasonal feeding grounds on the New England continental shelf. Fish. Bull. Natl. Ocean. Atmospheric Adm. 100, 168–180. Available onine at: http://www.mass.gov/eea/docs/dfg/dmf/publications/cont-shelf-tuna-diet.pdf [Accessed December 29, 2013].
Clarke, M. R. (1980). Cephalopoda in the diet of sperm whales of the southern hemisphere and their bearing on sperm whale biology. Discov. Rep. 37, 1–324.
Clarke, M. R. (1986). A Handbook for the Identification of Cephalopod Beaks. Oxford: Clarendon Press, 273.
Crane, J. (1936). Notes on the biology and ecology of giant tuna, Thunnus thynnus Linnaeus observed at Portland, Maine. Zool. N.Y. 212, 207–212.
Cury, P., Anneville, O., Bard, F. X., Fonteneau, A., and Rey, C. (1998). Obstinate North Atlantic bluefin tuna (Thunnus thynnus thynnus): an evolutionary perspective to consider spawning migration. Col. Vol. Sci. Pap. ICCAT 50, 239–247.
Dickson, K. A., and Graham, J. B. (2004). Evolution and consequences of endothermy in fishes. Physiol. Biochem. Zool. 77, 998–1018. doi: 10.1086/423743
Dragovich, A. (1970). The Food of Bluefin Tuna (Thunnus thynnus) in the Western North Atlantic Ocean. Trans. Am. Fish. Soc. 99, 726–731.
Druon, J.-N., Fromentin, J.-M., Hanke, A. R., Arrizabalaga, H., Damalas, D., Tičina, V., et al. (2016). Habitat suitability of the Atlantic bluefin tuna by size class: an ecological niche approach. Prog. Oceanogr. 142, 30–46. doi: 10.1016/j.pocean.2016.01.002
Eggleston, D. B., and Bochenek, E. A. (1990). Stomach Contents and Parasite Infestation of School Bluefin Tuna Thunnus thynnus Collected from the Middle Atlantic Bight, Virginia. Fish. Bull. 88, 389–395.
Estrada, J. A., Lutcavage, M., and Thorrold, S. R. (2005). Diet and trophic position of Atlantic bluefin tuna (Thunnus thynnus) inferred from stable carbon and nitrogen isotope analysis. Mar. Biol. 147, 37–45. doi: 10.1007/s00227-004-1541-1
Ferry, L. A., and Gaillet, G. M. (1996). “Sample size and data analysis: are we characterizing and comparing diet properly?,” in Feed. Ecol. Nutr. Fish Proc Symp Feed. Ecol. Nutr. Fish Int Congr. Biol. Fishes San Franc. Am. Fish. Soc. San Franc., ed M. K Shear, 70–81. Available online at: http://fishphysiology.org/wp-content/uploads/2014/02/Ferry1.pdf
Friðriksson, Á. (1949). Boreo-tended changes in the marine vertebrate fauna of Iceland during the the last 25 years. Rapp. Proc. Verb 125, 30–32.
Fromentin, J.-M. (2009). Lessons from the past: investigating historical data from bluefin tuna fisheries. Fish Fish. 10, 197–216. doi: 10.1111/j.1467-2979.2008.00311.x
Fromentin, J.-M., Bonhommeau, S., and Beaugrand, G. (2013). Oceanographic changes and exploitation drive the spatio-temporal dynamics of Atlantic bluefin tuna (Thunnus thynnus). Fish. Oceanogr. 23, 147–156. doi: 10.1111/fog.12050
Fromentin, J.-M., and Powers, J. E. (2005). Atlantic bluefin tuna: population dynamics, ecology, fisheries and management. Fish Fish. 6, 281–306. doi: 10.1111/j.1467-2979.2005.00197.x
Gjøsæter, J., and Kawaguchi, K. A. (1980). A review of the world resources of mesopelagic fish. FAO Fish Tech Pap 193, 1–151.
Golet, W. J., Cooper, A. B., Campbell, R., and Lutcavage, M. E. (2007). Decline in condition of northern bluefin tuna (Thunnus thynnus) in the Gulf of Maine. Fish. Bull. 105, 390–395. Available at: http://fishbull.noaa.gov/1053/golet.pdf [Accessed August 8, 2015].
Golet, W. J., Galuardi, B., Cooper, A. B., and Lutcavage, M. E. (2013). Changes in the distribution of Atlantic Bluefin Tuna (Thunnus thynnus) in the Gulf of Maine 1979-2005. PLoS ONE 8:e75480. doi: 10.1371/journal.pone.0075480
Golet, W. J., Record, N. R., Lehuta, S., Lutcavage, M. E., Galuard, B., Cooper, A. B., et al. (2015). The paradox of the pelagics: why bluefin tuna can go hungry in a sea of plenty. Mar. Ecol. Prog. Ser. 527, 181–192. doi: 10.3354/meps11260
Goñi, N., and Arrizabalaga, H. (2010). Seasonal and interannual variability of fat content of juvenile albacore (Thunnus alalunga) and bluefin (Thunnus thynnus) tunas during their feeding migration to the Bay of Biscay. Prog. Oceanogr. 86, 115–123. doi: 10.1016/j.pocean.2010.04.016
Government of Greenland (2014). Den største makrelfangst ved Grønland. Gov. Greenl. Available online at: http://naalakkersuisut.gl/da/Naalakkersuisut/Nyheder/2014/08/290814-Den-stoerste-makrelfangst-ved-Groenland [Accessed June 22, 2015].
Graham, J. B., and Dickson, K. A. (2004). Tuna comparative physiology. J. Exp. Biol. 207, 4015–4024. doi: 10.1242/jeb.01267
Guisan, A., and Zimmermann, N. E. (2000). Predictive habitat distribution models in ecology. Ecol. Model. 135, 147–186. doi: 10.1016/S0304-3800(00)00354-9
Härkönen, T. (1986). Guide to the Otoliths of the Bony Fishes of the Northeast Atlantic. Hellerup: Danbiu ApS Biological consultants, 256
Hastie, L. C., Pierce, G. J., Wang, J., Bruno, I., Moreno, A., Piatkowski, U., et al. (2009). Cephalpopods in the north-eastern Atlantic: species, biogeography, ecology, exploitation and conservation. Oceanogr. Mar. Biol. Annu. Rev. 47, 111–190. doi: 10.1201/9781420094220.ch3
Holliday, M. (1978). Food of Atlantic Bluefin Tuna, Thunnus Thynnus (L), from the Coastal Waters of North Carolina to Massachusetts. M. S. Thesis, Long Island University, Long Island, NY.
Humston, R., Ault, J. S., Lutcavage, M., and Olson, D. B. (2000). Schooling and migration of large pelagic fishes relative to environmental cues. Fish. Oceanogr. 9, 136–146. doi: 10.1046/j.1365-2419.2000.00132.x
Hyslop, E. J. (1980). Stomach contents analysis - a review of methods and their application. J. Fish Biol. 17, 411–429. doi: 10.1111/j.1095-8649.1980.tb02775.x
ICCAT (2015). ICCAT Manual. International Commission for the Conservation of Atlantic Tuna. Available online at: http://www.iccat.int/en/ICCATManual.asp [Accessed: June 22, 2015].
Iceland Review (2015). “Top Quality” icelandic tuna airlifted to market. Icel. Rev. Available online at: http://icelandreview.com/news/2015/08/13/top-quality-icelandic-tuna-airlifted-market [Accessed August 15, 2015].
ICES (2013). Report of the Working Group on Redfish Surveys (WGRS), ICES Headquarters, Hamburg, Germany. ICES CM 2013/SSGESST 14 56pp. Available online at: http://www.ices.dk/community/Documents/Science%20EG%20ToRs/SSGIEOM/2015/2013%20WGIDEEPS%20Multi-Annual%20ToRs.pdf
Jansen, T., Post, S., Kristiansen, T., Óskarsson, G. J., Boje, J., MacKenzie, B. R., et al. (2016). Ocean warming expands habitat of a rich natural resource and benefits a national economy. Ecol. Appl. doi: 10.1002/eap.1384. [epub ahead of print].
Jonsson, E. (1980). Biological studies on squid, Todarodes sagittatus (Lamarck) in Icelandic waters during the autumn 1979 with notes on its distribution and migration. Progress report [icelandic]. Mar. Res. Icel. 7, 1–22. Available online at: http://www.hafro.is/Bokasafn/Timarit/fjolr-007.PDF [Accesssed January 9, 2016].
Jonsson, E. (1998). Study of European flying squid, Todarodes sagittatus (Lamarck), occurring in deep water south of Iceland. ICES CM M:48, 1–14.
Jonsson, G., Palsson, J., and Hlidberg, J. B. (2006). Íslenskir Fiskar. Reykjav-k: Vaka-Helgafell, 336.
Karakulak, F. S., Salman, A., and Oray, I. K. (2009). Diet composition of bluefin tuna (Thunnus thynnus L. 1758) in the Eastern Mediterranean Sea, Turkey. J. Appl. Ichthyol. 25, 757–761. doi: 10.1111/j.1439-0426.2009.01298.x
Kristensen, T. K. (1981). The Genus Gonatus Gray, 1849 (Mollusca: Cephalopoda) in the North Atlantic; a revision of the North Atlantic species and description of Gonatus steenstrupi n. sp. Steenstrupia 7, 61–99.
Lamhauge, S., Jacobsen, J. A., Jákupsstovu, H., Valdemarsen, J. W., Sigurdsson, T., Bardarsson, B., et al. (2008). Fishery and Utilisation of Mesopelagic Fishes and Krill in the North Atlantic. Copenhagen: Nordic Council of Ministers. Available online at: http://www.diva-portal.org/smash/get/diva2:702486/FULLTEXT01.pdf [Accessed August 8, 2015].
Lawson, J. W., Magalhaes, A. M., and Miller, E. H. (1998). Important prey species of marine vertebrate predators in the northwest Atlantic: proximate composition and energy density. Mar. Ecol. Prog. Ser. 164, 13–20. doi: 10.3354/meps164013
Levins, R. (1968). Evolution in Changing Environments: Some Theoretical Explorations. Princeton, NJ: Princeton University Press.
Litzow, M. A., Bailey, K. M., Prahl, F. G., and Heintz, R. (2006). Climate regime shifts and reorganization of fish communities: the essential fatty acid limitation hypothesis. Mar. Ecol. Prog. Ser. 315, 1–11. doi: 10.3354/meps315001
Logan, J. (2009). Tracking Diet and Movement of Atlantic Bluefin Tuna (Thunnus Thynnus) using Carbon and Nitrogen Stable Isotopes. Ph. D. Thesis, University of New Hampshire. Available online at: http://www.researchgate.net/publication/220028002_Tracking_diet_and_movement_of_Atlantic_bluefin_tuna_(Thunnus_thynnus)_using_carbon_and_nitrogen_stable_isotopes/file/f2faf4f43ba1811972.pdf [Accessed December 29, 2013].
Logan, J. M., Rodríguez-Marín, E., Goñi, N., Barreiro, S., Arrizabalaga, H., Golet, W., et al. (2011). Diet of young Atlantic bluefin tuna (Thunnus thynnus) in eastern and western Atlantic foraging grounds. Mar. Biol. 158, 73–85. doi: 10.1007/s00227-010-1543-0
Lordan, C., Collins, M. A., Key, L. N., and Browne, E. D. (2001). The biololgy of the ommastrephid squid, Todarodes sagittatus, in the north-east Atlantic. J. Mar. Biol. Assoc. U. K. 81, 299–306. doi: 10.1017/S0025315401003770
Lutcavage, M. E., Brill, R. W., Skomal, G. B., Chase, B. C., Goldstein, J. L., and Tutein, J. (2000). Tracking adult North Atlantic bluefin tuna (Thunnus thynnus) in the northwestern Atlantic using ultrasonic telemetry. Mar. Biol. 137, 347–358. doi: 10.1007/s002270000302
MacKenzie, B. R., and Myers, R. A. (2007). The development of the northern European fishery for north Atlantic bluefin tuna Thunnus thynnus during 1900–1950. Fish. Res. 87, 229–239. doi: 10.1016/j.fishres.2007.01.013
MacKenzie, B. R., Payne, M., Boje, J., Højer, J. L., and Siegstad, H. (2014). A cascade of warming impacts brings bluefin tuna to Greenland waters. Glob. Change Biol. 20, 2484–2491. doi: 10.1111/gcb.12597
Magnusson, J. (1996). The deep scattering layers in the Irminger Sea. J. Fish Biol. 49, 182–191. doi: 10.1111/j.1095-8649.1996.tb06075.x
Malmberg, S.-A. (2004). The Iceland Basin, Topography and Oceanographic Features. Report No. 109, Marine Reseach Institute, 34. Available online at: http://www.hafro.is/Bokasafn/Timarit/fjolr-109.pdf [Accessed January 9, 2016].
Mariani, P., Krivan, V., MacKenzie, B. R., and Mullon, C. (2015). The migration game in habitat network: the case of tuna. Theor. Ecol. 9, 219–232. doi: 10.1007/s12080-015-0290-8
Mather, F. J., Mason, J. M., and Jones, A. C. (1995). Historical Document: Life History and Fisheries of Atlantic Bluefin Tuna. NOAA Technical Memorandum NMFS-SEFSC-370, Miami: Fla. Available online at: https://archive.org/details/historicaldocume00math[Accessed August 8, 2015].
Matthews, F. D., Damkaer, D. M., Knapp, L. W., and Collette, B. B. (1977). Food of western north Atlantic tunas (Thunnus) and lancetfishes (Alepisaurus). NOAA Tech. Rep. NMFS SSRF 706, Available online at: http://spo.nmfs.noaa.gov/SSRF/SSRF706.pdf [Accessed March 4, 2016].
Nakagawa, S., and Schielzeth, H. (2013). A general and simple method for obtaining R2 from generalized linear mixed-effects models. Methods Ecol. Evol. 4, 133–142. doi: 10.1111/j.2041-210x.2012.00261.x
Nora Region Trends (2014). Iceland and Norway get bluefin tuna trial quotas. Dly. Updat. N. Atl. Arct. Available online at: http://www.noraregiontrends.org/marineresources/marinenews/article/iceland-and-norway-get-bluefin-tuna-trial-quotas/87/ [Accessed June 22, 2015].
Ólafsdóttir, D., and Ingimundardóttir, T. (2003). Experimental fisheries for bluefin tuna (Thunnus thynnus) within the Icelandic EES in 1996-2001. Col. Vol. Sci. Pap. ICCAT 55, 1254–1260. Available online at: https://iccat.int/Documents/CVSP/CV055_2003/no_3/CV055031254.pdf [Accessed March 26, 2015].
Olafsdottir, A. H., Slotte, A., Jacobsen, J. A., Oskarsson, G. J., Utne, K. R., and Nottestad, L. (2016). Changes in weight-at-length and size-at-age of mature Northeast Atlantic mackerel (Scomber scombrus) from 1984 to 2013: effects of mackerel stock size and herring (Clupea harengus) stock size. ICES J. Mar. Sci. 73, 1255–1265. doi: 10.1093/icesjms/fsv142
Olafsdottir, D. (2004). ICCAT Rep. Biennial Period 2002-03 PART II 2003 Vol. 3, National report of Iceland, 50–52. Available online at: http://www.iccat.int/Documents/BienRep/REP_EN_02-03_II_3.pdf [Accessed August 8, 2015].
Orsi Relini, L., Cima, C., Palandri, G., Relini, M., and Garibaldi, F. (1999). Feeding of the juvenile bluefin tuna in the offshore pelagic ecosystem of the Ligurian Sea. Sea Biol. Mar. Mediterr. 6, 295–302.
Orsi Relini, L., Garibaldi, F., Cima, C., and Palandri, G. (1995). Feeding of the swordfish, the bluefin and other pelagic nekton in the western Ligurian Sea. ICCAT Coll. Vol. Sci. Pap. 44, 283–286.
Ortiz de Zatare, V., and Cort, J. L. (1986). Stomach Contents Study of Immature Bluefin Tuna in the Bay of Biscay. ICES CM H:26, 10. Available online at: http://www.ices.dk/sites/pub/CM%20Doccuments/1986/H/1986_H26.pdf [Accessed January 9, 2016].
Oskarsson, G. J., Sveinbjornsson, S., Guðmundsdottir, A., and Sigurdsson, T. (2012). Ecological impacts of recent extension of feeding migration of NE-Atlantic mackerel into the ecosystem around Iceland. ICES CM M:03, 1–25. Available at: http://www.ices.dk/sites/pub/CM%20Doccuments/CM-2012/M/M0312.pdf [Accessed January 9, 2016].
Perugini, M., Giammarino, A., Olivieri, V., Di Nardo, W., and Amorena, M. (2006). Assessment of edible marine species in the Adriatic sea for contamination from polychlorinated biphenyls and organochlorine insecticides. J. Food Prot. 69, 1144–1149. Available online at: http://www.ingentaconnect.com/contentone/iafp/jfp/2006/00000069/00000005/art00025 [Accessed September 1, 2015].
Pierce, G. J., and Boyle, P. R. (1991). A review of methods for diet analysis in piscivorous marine mammals. Oceanogr. Mar. Biol. Annu. Rev. 29, 409–486.
Pinnegar, J. K., Goñi, N., Trenkel, V. M., Arrizabalaga, H., Melle, W., Keating, J., et al. (2015). A new compilation of stomach content data for commercially important pelagic fish species in the northeast Atlantic. Earth Syst. Sci. Data 7, 19–28. doi: 10.5194/essd-7-19-2015
R Core Team (2013). R: A Language and Environment for Statistical Computing. Vienna: R Foundation for Statistical Computing. Available online at: http://www.R-project.org/
Reynisson, P., and Sigurdsson, T. (1996). Diurnal variation in the acoustic intensity and target strength measurements of Oceanic Redfish (Sebastes mentella) in the Irminger Sea. ICES CM G:25, 15. Available online at: http://www.ices.dk/sites/pub/CM%20Doccuments/1996/G/1996_G25.pdf [Accessed January 9, 2016].
Rooker, J. R., Bremer, J. R. A., Block, B. A., Dewar, H., De Metrio, G., Corriero, A., et al. (2007). Life history and stock structure of Atlantic bluefin tuna (Thunnus thynnus). Rev. Fish. Sci. 15, 265–310. doi: 10.1080/10641260701484135
Rouyer, F., Fromentin, J. M., and Gaspar, P. (2004). Association between bluefin tuna schools and oceanic features in the western Mediterranean. Mar. Ecol. Prog. Ser. 269, 249–263. doi: 10.3354/meps269249
Rouyer, T., Fromentin, J. M., Hidalgo, M., and Stenseth, N. C. (2014). Combined effects of exlpoitation and temperature on fish stocks in the Northeast Atlantic. ICES J. Mar. Sci. 71, 1554–1562. doi: 10.1093/icesjms/fsu042
Saito, H., and Murata, M. (1998). Origin of the monoene fats in the lipid of midwater fishes: relationship between the lipids of myctophids and those of their prey. Mar. Ecol. Prog. Ser. 168, 21–33. doi: 10.3354/meps168021
Santos, M. B., Clarke, M. R., and Pierce, G. J. (2001). Assessing the importance of cephalopods in the diets of marine mammals and other top predators: problems and solutions. Fish. Res. 52, 121–139. doi: 10.1016/S0165-7836(01)00236-3
Sanz Brau, A. (1990). Sur la nourriture des jeunes thons rouges Thunnus thynnus (L. 1758) des côtes du Golfe de Valence. Rapp. Comm. Int. Explor. Sci. Mer. Méditerr. 32, 274.
Sarà, G., and Sarà, R. (2007). Feeding habits and trophic levels of bluefin tuna Thunnus thynnus of different size classes in the Mediterranean Sea. J. Appl. Ichthyol. 23, 122–127. doi: 10.1111/j.1439-0426.2006.00829.x
Scharf, F. S., Buckel, J. A., Juanes, F., and Conover, D. O. (1998). Predation by juvenile piscivorous bluefish (Pomatomus saltatrix): the influence of prey to predator size ratio and prey type on predator capture success and prey profitability. Can. J. Fish. Aquat. Sci. 55, 1695–1703. doi: 10.1139/f98-056
Scharf, F. S., Juanes, F., and Rountree, R. A. (2000). Predator size-prey size relationships of marine fish predators: interspecific variation and effects of ontogeny and body size on trophic-niche breadth. Mar. Ecol. Prog. Ser. 208, 229–248. doi: 10.3354/meps208229
Sigurdsson, T., Jonsson, G., and Pálsson, J. (2002). Deep scattering layer over Reykjanes Ridge and in the Irminger Sea. ICES CM M:09, 22. Available online at: http://www.ices.dk/sites/pub/CM%20Doccuments/2002/M/M0902.PDF [Accessed January 9, 2016].
Sinopoli, M., Pipitone, C., Campagnuolo, S., Campo, D., Castriota, L., Mostarda, E., et al. (2004). Diet of young-of-the-year bluefin tuna, Thunnus thynnus (Linnaeus, 1758), in the southern Tyrrhenian (Mediterranean) Sea. J. Appl. Ichthyol. 20, 310–313. doi: 10.1111/j.1439-0426.2004.00554.x
Stefánsson, G., and Pálsson, Ó. K. (1997). Statistical evaluation and modelling of the stomach contents of Icelandic cod (Gadus morhua). Can. J. Fish. Aquat. Sci. 54, 169–181. doi: 10.1139/f96-246
Steimle, F. W. Jr., and Terranova, R. J. (1985). Energy equivalents of marine organisms from the continental shelf of the temperate northwest Atlantic. J. Northwest Atl. Fish. Sci. 6, 117–124. doi: 10.2960/J.v6.a11
Stillwell, C. E., and Kohler, N. E. (1985). Food and feeding ecology of the swordfish Xiphias gladius in the western North-Atlantic Ocean with estimates of daily ration. Mar. Ecol. Prog. Ser. 22, 239–247. doi: 10.3354/meps022239
Sutton, T., and Sigurdsson, T. (2008). Vertical and horizontal distribution of mesopelagic fishes along a transect across the northern Mid-Atlantic ridge. ICES CM C:16, 1–12. Available online at: http://www.ices.dk/sites/pub/CM%20Doccuments/CM-2008/C/C1608.pdf [Accessed August 8, 2015].
Tangen, M. (2009). The Norwegian fishery for Atlantic bluefin tuna. Collect. Vol. Sci. Pap. ICCAT 63, 79–93. Available online at: http://www.iccat.int/Documents/CVSP/CV063_2009/no_1/CVOL63010079.pdf [Accessed August 8, 2015].
Tiews, K. (1978). On the disappearance of bluefin tuna in the North sea and its ecological implication for herring and mackerel. Rapp. Procès Verbaux La Réun. Cons. Int. Pour L'Exploration Mer. 172, 301–309.
UndercurrentNews (2014). Icelandic Group selling Visir-caught bluefin tuna in Japan. Seaf. Bus. News Surf. Available online at: http://www.undercurrentnews.com/2014/09/26/icelandic-group-selling-visir-caught-bluefin-tuna-in-japan/ [Accessed June 22, 2015].
Vikingsson, G. A., Olafsdottir, D., and Sigurjonsson, J. (2003). Diet of harbour porpoises (Phocoena phocoena) in Icelandic coastal waters. NAMMCO Sci. Publ. 5, 243–270. doi: 10.7557/3.2829
Walli, A., Boustany, A., Farwell, C. J., and Williams, T. (2009). Seasonal movements, aggregations and diving behavior of Atlantic bluefin tuna (Thunnus thynnus) revealed with archival tags. PLoS ONE 4:e6151. doi: 10.1371/journal.pone.0006151
Keywords: Atlantic bluefin tuna, diet, mesopelagic, Iceland, squid, barracudina, trophic role, food web
Citation: Olafsdottir D, MacKenzie BR, Chosson-P V and Ingimundardottir T (2016) Dietary Evidence of Mesopelagic and Pelagic Foraging by Atlantic Bluefin Tuna (Thunnus thynnus L.) during Autumn Migrations to the Iceland Basin. Front. Mar. Sci. 3:108. doi: 10.3389/fmars.2016.00108
Received: 30 January 2016; Accepted: 09 June 2016;
Published: 28 June 2016.
Edited by:
David W. Sims, The Marine Biological Association, UKReviewed by:
Nigel Edward Hussey, University of Windsor, CanadaNuno Queiroz, University of Porto, Portugal
Copyright © 2016 Olafsdottir, MacKenzie, Chosson-P and Ingimundardottir. This is an open-access article distributed under the terms of the Creative Commons Attribution License (CC BY). The use, distribution or reproduction in other forums is permitted, provided the original author(s) or licensor are credited and that the original publication in this journal is cited, in accordance with accepted academic practice. No use, distribution or reproduction is permitted which does not comply with these terms.
*Correspondence: Droplaug Olafsdottir, droplaug@vedur.is
†Present Address: Droplaug Olafsdottir, Icelandic Meteorological Office, Reykjavik, Iceland