Novel Indicators of Anthropogenic Influence on Marine and Coastal Ecosystems
 Blake E. Feist
 Phillip S. Levin
- Conservation Biology Division, Northwest Fisheries Science Center, National Marine Fisheries Service, National Oceanic and Atmospheric Administration, Seattle, WA, USA
Human populations are concentrated along coastal regions worldwide, placing a disproportionate stress on coastal marine ecosystems. Ironically, biogenic habitats may be adversely affected by human activities though they serve to attenuate the impacts of global change on coastal cities. Surprisingly, simple, coastwide indicators of anthropogenic influences in relation to the spatial distribution of biogenic habitats are relatively underdeveloped. In this paper, we introduce a spatially explicit index of coastal as well as upland riverine human population proximity, based on human population and river dynamics datasets on the West- and Gulf-Coasts of the US. We then examine the relationship between these indices and biogenic habitats (kelp and mangrove forests). Finally, we identify patterns of landscape-scale biodiversity with human populations, and explore occurrence of biogenic habitats within and outside of marine protected areas (MPAs). We found that biogenic habitats were negatively associated with human populations and that MPAs were generally placed away from people. Landscape-scale patterns of biodiversity did not differ within and outside kelp forests and MPAs on the West Coast, but had a negative association with mangroves and a positive association with MPAs on the Gulf Coast. This index can be used anywhere in the world, can project into the future using various human population growth forecasts, and can serve as an important method for conservation triage.
Introduction
Nearly 37% of the Earth's seven billion people live within 100 km of the coast (Sale et al., 2014). This coastal region is 20% of Earth's total land area; thus, it bears a disproportionate brunt of human impacts (von Glasow et al., 2013; Barragán and de Andrés, 2015). Moreover, in the future, coastal populations are expected to rise at greater rates relative to inland ones (Seto et al., 2011; Neumann et al., 2015), further exacerbating this problem. This disparity between coast and inland areas is particularly pronounced in the United States. By 2050, the population is expected to increase by 44.2 million with the majority of the increase occurring within 100 km of the coast, where population density increases are projected to be 6.1 times that of inland densities (Bengtsson et al., 2006).
As human populations grow, so too will impacts on coastal and nearshore ecosystems. And evidence of the impact from exposure to human populations, either directly via geographic proximity or indirectly via adjacency to river mouths, is overwhelming. Development and urbanization of marine coastline results in the input of thousands of toxicants, industrial contaminants, and pesticides from storm water runoff (Venkatesan et al., 1999; Zeng and Venkatesan, 1999; Van Dolah et al., 2008; Hwang et al., 2009). Additionally, alteration of the landscape often increases rates of sedimentation (Crossland et al., 2005; Syvitski et al., 2005; Syvitski and Milliman, 2007) that can smother sessile species or reduce their viability by altering light levels. Agricultural activities and sewage effluent lead to eutrophication in these systems (Scott et al., 1999; Costanzo et al., 2001; Rabalais et al., 2009, 2010), and shoreline hardening and other physical alterations can disrupt coastal ecosystems (Rice, 2006; Jackson et al., 2008; Morley et al., 2012). All of these insults collectively alter and destroy biogenic habitats occurring in marine coastal regions (Duarte et al., 2008, 2013; McLeod et al., 2011; Fourqurean et al., 2012; Watanabe and Kuwae, 2015). Given these and other impacts of humans, the sustainability of coastal and nearshore ecosystems depend on effectively anticipating and mitigating current and future human pressures.
While it is, perhaps, obvious that combating the negative impacts of humans is paramount for sustainability, operationalizing this truism is challenging. A major hurdle is a lack of data. Comprehensive, direct measures of human activities are available in only a few locations, and these are primarily only in developed countries (e.g., Halpern et al., 2009; Micheli et al., 2013; Andersen et al., 2015). Even in regions that might be considered data-rich, appropriate data are rare. Thus, there is a need for spatially explicit indicators of potential human impacts in coastal zones (depths < 50 m), given cumulative impacts from human stressors are increasing the most in coastal areas (Halpern et al., 2015). Many have argued that human population density, in and of itself, can be a suitable proxy for anthropogenic impacts in coastal regions (Steele, 1998; Gorman et al., 2009; Mora et al., 2011; Sale et al., 2014). Consequently, developing an index of coastal human population, which could be developed and applied anywhere on the earth, would be useful. In this paper, we introduce indices that are based on simple, globally available data. We then pilot the use of these indices for two case study locations in the United States characterized by distinct biogenic habitats: kelp forests of the West Coast, and mangroves of the Gulf of Mexico (Figure 1).
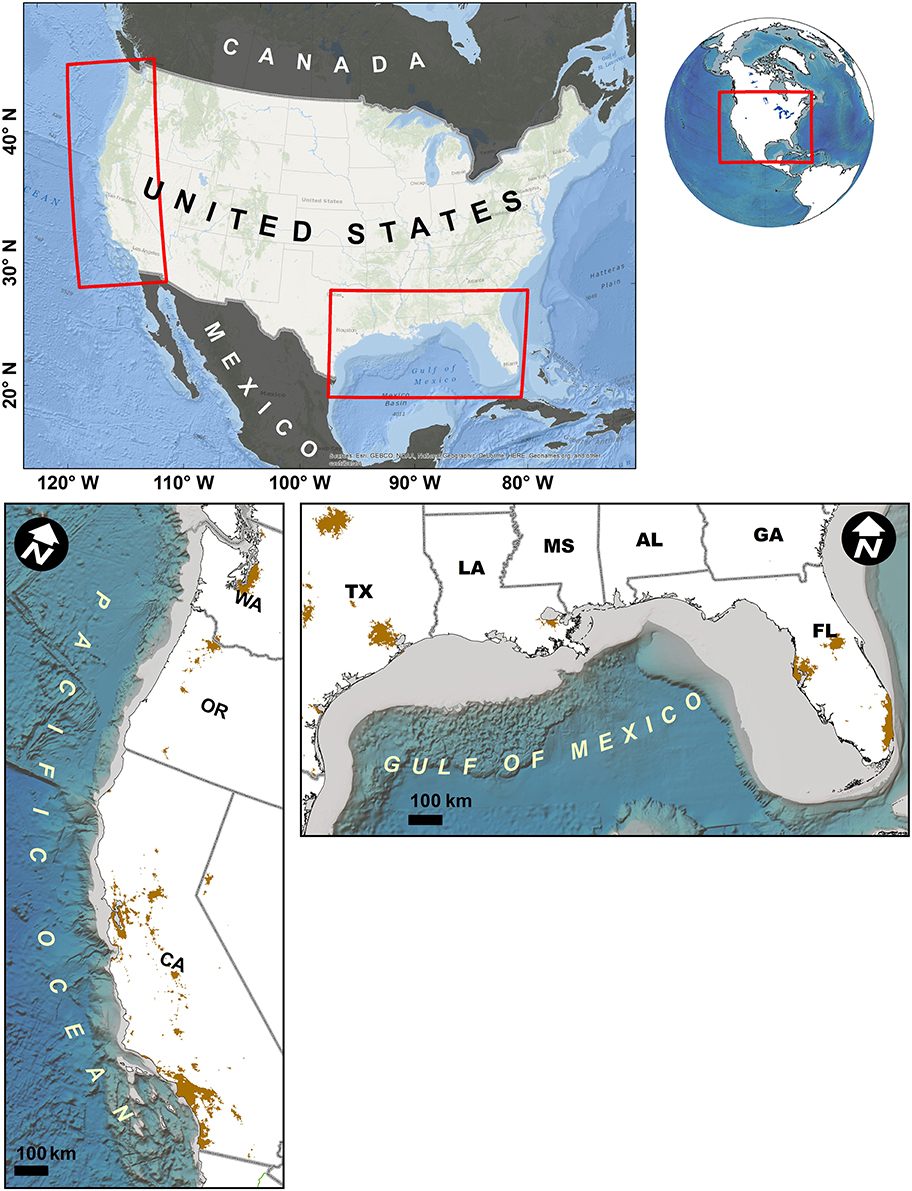
Figure 1. Locations of study regions, West and Gulf Coasts of the United States. Continental shelf zone (< 200 m depth) indicated by light blue region adjacent to shore. Brown regions on land indicate urban areas with population density >900/km2 (U.S. Census Bureau, 2012).
Materials and Methods
Development of Indices
Below we describe the development of two indices that represent the degree of proximity to human populations in coastal and nearshore ecosystems. The Population Proximity Index (PPI) describes the magnitude of population proximity with humans occurring along marine coasts. The Riverine Population Index (RPI) describes the magnitude of population proximity associated with river basins that discharge into and impact coastal areas. We generate these indices for the West and Gulf Coasts of the United States. Lastly, in order to demonstrate the potential to use these indices to forecast future human pressures, we develop a Population Projections Index for the Contiguous United States, which is based on 2010–2050 human population projections, segregated by coastal and inland regions (see Supplementary Material).
Population Proximity Index—PPI
To approximate the proximity of human populations in the nearshore (defined as the region between the shoreline and the 50 m isobath; Steele, 1998; Erlandson and Rick, 2008), we used the “focalmean” tool in ArcCatalog to extrapolate the PPI on our nearshore source grid. “Focalmean” calculates a new value for each grid cell in an existing grid, based on the average value of grid cells falling within our defined search radius of ~20 km. We chose this radius as it reasonably approximates the nearshore in our study regions. We created a source grid for our focal mean calculations by combining the LandScan (Bright et al., 2012) grid with the nearshore grid. Each of the grid cells in the nearshore source grid had an initial value of 0, and all of the terrestrial grid cells had the corresponding population count information from LandScan. After running the focalmean tool, we set all land grid cells in the resulting PPI grid to a value of no data. The output grid in the remaining nearshore region was standardized to values ranging from 0 to 100.
Data: Human Populations
We used the 2011 LandScan (Bright et al., 2012) global, gridded (30-arcsecond spatial resolution, ~900 m), human population count data as the basis for our two indices (PPI and RPI) of human population influence. This data layer is the highest resolution currently available and is based on an algorithm which uses spatial data and imagery analysis technologies and a multi-variable dasymetric modeling approach to disaggregate census counts within an administrative boundary (Bright et al., 2012).
For human population projections in coastal vs. inland regions, from 2010 to 2050, we used a data layer generated by Bengtsson et al. (2006). We used the IPCC SRES (Special Report on Emissions Scenarios) B2 scenario family population projection from Bengtsson et al. (2006), which was “based on the long-term UN Medium 1998 population projection of 10.4 billion by 2100” (IPCC, 2000).
Riverine Population Index—RPI
To represent the relative proximity of human populations residing within river basins that flow into the coastal zone, we multiplied predicted river discharge (see Supplementary Material) values (Cohen et al., 2014) by the corresponding total LandScan (Bright et al., 2012) human population count for each basin that flowed directly into our two coastal study regions. We then generated inverse distance weighted grids (calculated from the corresponding mouth of each river) across the coastal zone defined in the PPI, for each river basin. Finally, we summed all of the resulting inverse distance weighted grids into a single composite grid and standardized values to range from 0 to 100.
Piloting the Use of the Indices
We explored the utility of our indices for two cases: kelp forests in the California Current along the U.S. West Coast; and, mangrove forests in the U.S. Gulf of Mexico (Figure 1). We focus on these two cases of biogenic habitat because they provide important nursery, refuge and foraging habitat (Ewel et al., 1998; Steneck et al., 2002; Graham, 2004; Mumby et al., 2004; Aburto-Oropeza et al., 2008), and they protect coastlines from storm events and sea-level rise (Arkema et al., 2013). In addition, they are sensitive to a variety of anthropogenic impacts including nutrient loading, sedimentation, pollution and physical disturbance (Valiela et al., 2001; Duke et al., 2007; Mangialajo et al., 2008; Foster and Schiel, 2010). We used the Population Proximity and Riverine Population Indices to explore the degree to which these habitats, and the biodiversity therein, are potentially influenced by proximity to human populations (PPI) or their effluent (RPI). Additionally, we explore the degree to which one spatial management tool (Marine Protected Areas, MPAs) used to protect these habitats are associated with human populations. Finally, using future human population predictions, we investigate how the spatial distribution of human pressures may change in the future.
Pilot Study Data
Kelp
We used the most recent surface kelp forest geospatial data layers from the following state agencies: California Department of Fish and Game (1989, 1999, 2002-2006, 2008, and 2009; CDFW, 2012), Oregon Department of Fish and Wildlife (1990, and 1996-1999; ODFW, 2008), and, Washington State Department of Natural Resources (1989-1992, and 1994-2004; WADNR, 2005). All of these data layers were designed to map the maximum known extent of kelp canopy and were suitable for our study in that they are the best available set of data that adequately represent the spatial extent of kelp forests occurring off the California, Oregon and Washington coasts (see Supplementary Material).
Mangroves
We used a geospatial data layer of global mangrove forest distributions, which was based on classification of LANDSAT TM satellite imagery (Giri et al., 2011a,b).
Bathymetry
We used National Geophysical Data Center (NGDC) 3-arcsecond (~90 m), gridded bathymetry data (see Supplementary Material), to identify the elevation range occupied by kelp and mangrove forests, which we then used to define the elevation range over which we ran our spatial analyses on the West and Gulf Coasts (NOAA, 2003).
Biodiversity
To explore biodiversity, we used a global, gridded (360-arcsecond, ~11 km) geospatial datalayer of the Gini-Simpson index (OBIS, 2013), which is defined as the probability that two samples taken at random will contain different species (see Supplementary Material).
Marine protected areas
We used geospatial data layers of marine protected areas (MPAs) from the National Marine Protected Areas Center (http://marineprotectedareas.noaa.gov/sciencestewardship/gis/). We limited our analyses to “no access” or “no take” MPAs, which have the strictest regulations with respect to use and access.
Pilot Study Spatial Analyses
We used various GIS software to spatially overlay the geospatial data layers with each other in order to measure the degree of overlap between them (see Supplementary Material). We summarized the overlay analyses in two different ways: area weighted mean (AWM) and cumulative area distribution plots. AWM provides a general “snapshot” comparison of the various indices (PPI, RPI, and biodiversity) within and outside the biogenic habitats and MPAs, whereas cumulative area plots afford greater detail about the spatial distributions of biogenic habitats and MPAs relative to the aforementioned indices. We calculated AWM values within and outside of biogenic habitats and MPAs using the following equation:
i is a unique index value for a given group of grid cells, a is the total area of grid cells with the corresponding index value and A is the total area of all grid cells within or outside a given biogenic habitat or MPA.
Cumulative area distribution curves and plots are used for a variety of applications, including geomorphology (Perera and Willgoose, 1998), spatial pattern analysis (Bogaert et al., 2002), and landscape ecology (Broadbent et al., 2008; Schnell et al., 2013). We generated cumulative area plots by ranking a given index (i.e., PPI, RPI, and biodiversity) from low to high, calculating the relative proportion (% based on area) of those values and then tallying a running sum of the proportion. We generated cumulative area plots for areas within and outside of kelp, mangroves and MPAs as a function of the various indices. Cumulative area plots for the region outside of a given biogenic habitat or MPA were assumed to be the underlying cumulative area distribution for a given index, and the cumulative area plots of the various biogenic habitats and MPAs were then compared with those underlying distribution plots. Plotting consistently to the left of a given underlying distribution suggests negative correlation with a given index and plotting to the right indicates positive correlation. Plotting essentially on top of the underlying distribution suggests no correlation between a given index and MPAs or a given biogenic habitat.
Results
Human Population Indices
The PPI in the California Current was relatively low off the Washington and Oregon coast (Figure 2A) but substantial near San Francisco (Figure 2B) and southern California in general (Figure 2C). Based on the projected population analyses (Supplementary Figure 1), the total population within the West Coast study region is expected to increase by 8.3 million, with ~83% of that increase occurring within 100 km of the coast. The greatest increases were concentrated around existing large urban areas (San Francisco Bay and Los Angeles/San Diego), which would disproportionately increase the PPI in these areas. Northern California and the outer coast of Washington and Oregon were not predicted to experience major population increases by the year 2050 (Supplementary Figure 1).
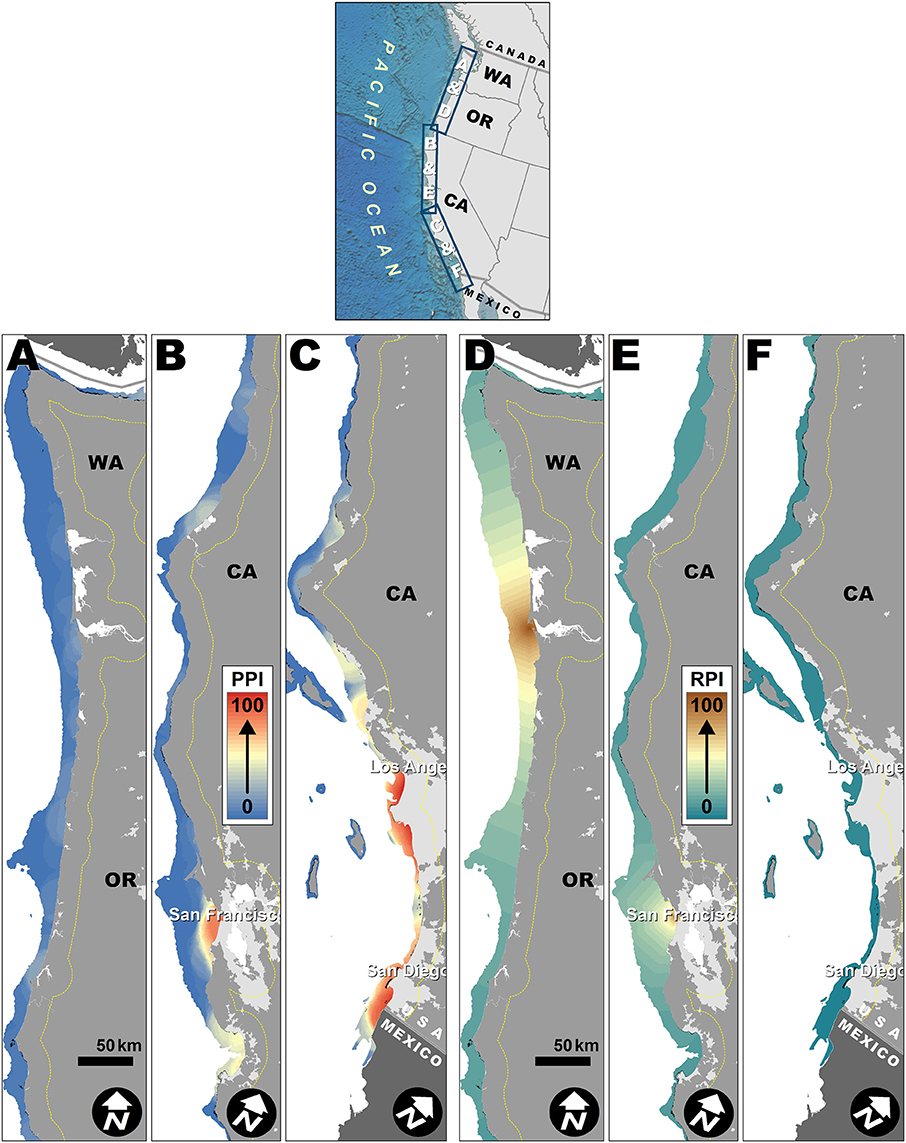
Figure 2. Population proximity index (PPI) and Riverine Population Index (RPI) spatial patterns off the West Coast. Dashed yellow lines mark ~20 km buffer used for generating PPI from LandScan population grid. Lighter gray areas on land indicate urban areas with population density >900/km2 (U.S. Census Bureau, 2012). Small black patches off coast are kelp. (A) PPI enlargement of coastal Washington and Oregon. (B) PPI enlargement of coastal Northern California. (C) PPI enlargement of coastal Southern California. (D) RPI enlargement of coastal Washington and Oregon. (E) RPI enlargement of coastal Northern California. (F) RPI enlargement of coastal Southern California.
The RPI in the California Current was dominated by the Columbia River and Sacramento River basins, home to 6.7 and 9.0 million people, respectively (Figures 2D,E). The RPI was relatively low off the southern California coast (Figure 2F). As for the PPI, the total regional population is expected to increase by 8.3 million by 2050, but only ~17% of that increase is projected to occur more than 100 km away from the coast. The greatest inland population increases were within the Sacramento River basin, draining into the San Francisco Bay, which would disproportionately increase the RPI off the coast of San Francisco.
There were fewer stretches along the Gulf Coast with lower PPI values (Figure 3), with marked foci near Houston and Corpus Christi, TX (Figure 3A), New Orleans, LA, Mobile, AL, and Pensacola, FL (Figure 3B), and many regions off the South Florida coast (Figure 3C). Based on the projected population analyses (Supplementary Figure 1), the total population within the Gulf Coast study region is expected to increase by 21.7 million, with ~23% of that increase occurring within 100 km of the coast. The Houston, New Orleans, Tampa/St. Petersburg, and Miami metropolitan areas were projected to experience substantial population increases by 2050 (Supplementary Figure 1), which would disproportionately increase the PPI is these areas.
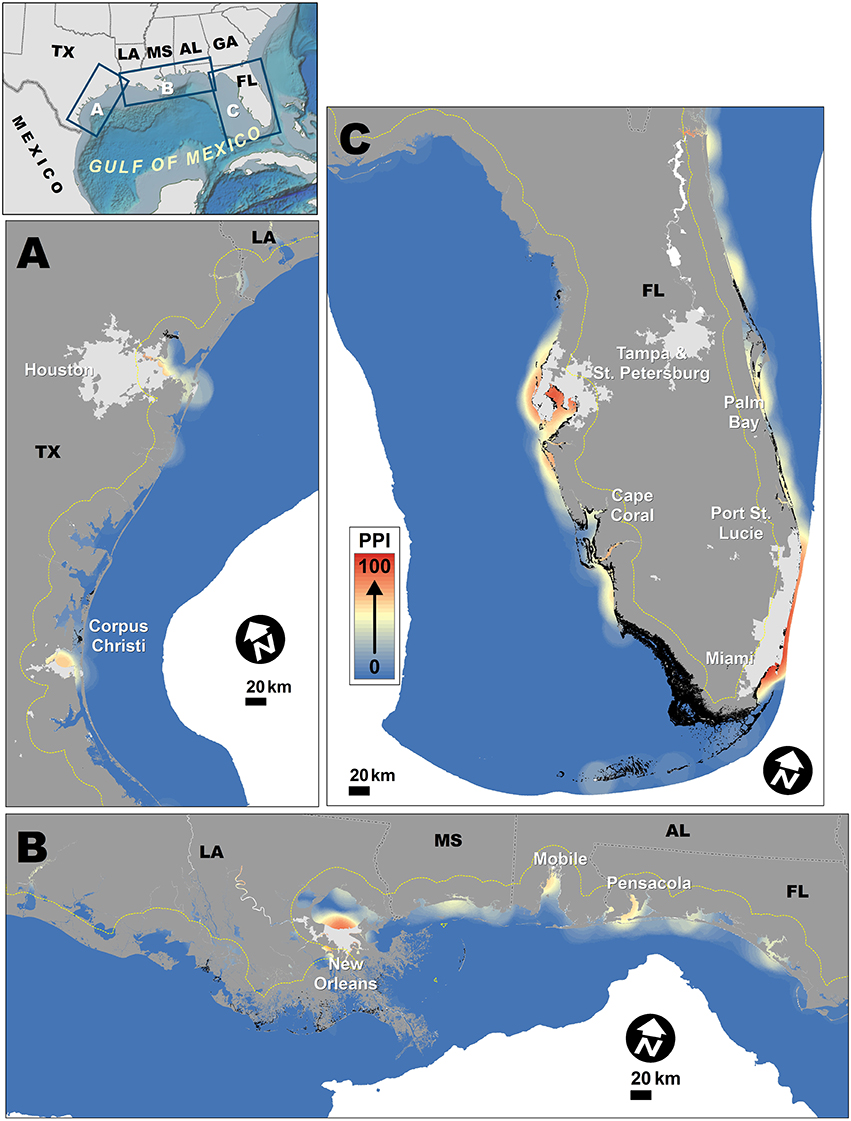
Figure 3. Population proximity index spatial patterns for Gulf Coast. Dashed yellow line indicates ~20 km buffer used for generating PPI from LandScan population grid. Lighter gray areas on land indicate urban areas with population density >900/km2 (U.S. Census Bureau, 2012). Small black patches off coast are mangroves. (A) Enlargement of coastal Texas. (B) Enlargement of coastal Louisiana, Mississippi, Alabama, and the Florida Panhandle. (C) Enlargement of coastal Southern Florida.
The RPI off the Gulf Coast was dominated by the Mississippi River basin (Figure 4B), which is currently home to ~81 million people. There were other sizable rivers with significant discharge rates and human populations living within their basins, namely, Mobile, Apalichicola, Naches/Sabine, and Pascagoula Rivers (Figures 4A,C). Based on the projected population analyses (Supplementary Figure 1), the total population within the Gulf Coast study region is expected to increase by 21.7 million by 2050, with the vast majority of that (~77%) projected to occur inland (>100 km of the coast). The greatest inland population increases were within the Mississippi River basin, which would disproportionately increase the RPI off the coast of New Orleans and the Mississippi River delta. There were also significant increases projected to occur in the Trinity River and Colorado River basins, which would disproportionately increase the RPI off the coasts of Galveston and Freeport, respectively, the latter of which currently has a relatively low RPI and PPI.
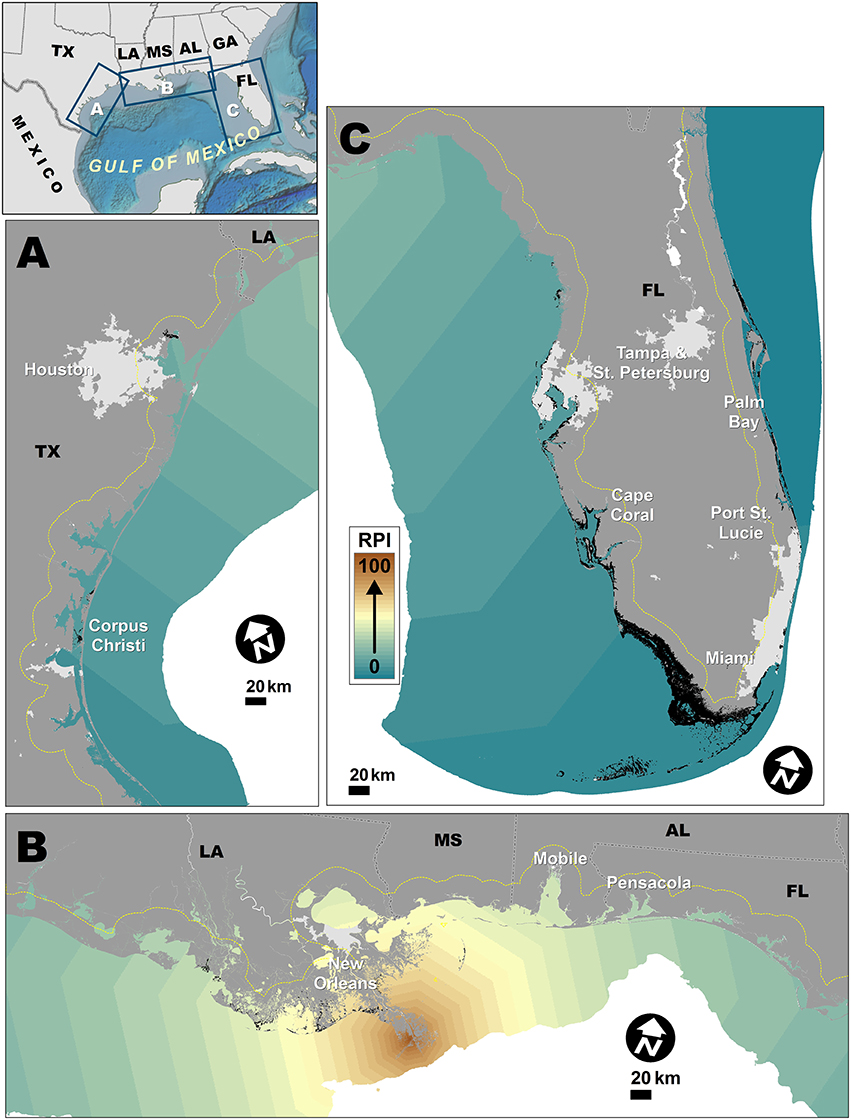
Figure 4. Riverine population index (RPI) spatial patterns of the Gulf Coast. Dashed yellow lines indicate ~20 km inland boundary, for reference. Lighter gray areas on land indicate urban areas with population density >900/km2 (U.S. Census Bureau, 2012). Small black patches off coast are mangroves. (A) Enlargement of coastal Texas. (B) Enlargement of coastal Louisiana, Mississippi, Alabama, and the Florida Panhandle. (C) Enlargement of coastal Southern Florida.
Biodiversity
Across the West and Gulf Coasts, there was no significant correlation between the PPI or RPI and biodiversity, based on the raw grid cell regression plots (Supplementary Figures 2, 3). Similarly, looking across the West Coast as a whole, biodiversity within and outside kelp forests and MPAs (see inset bar charts in Supplementary Figures 4A,B) was similar. The cumulative area distribution of biodiversity in kelp forests and MPAs was essentially identical to the underlying distribution of biodiversity, so biodiversity within kelp forests and MPAs was similar to what would be expected if kelp forests and MPAs were randomly distributed with respect to biodiversity (Supplementary Figures 4A,B).
On the Gulf Coast, biodiversity was generally lower within mangrove forests but slightly higher within MPAs (see inset bar charts in Supplementary Figures 5A,B). The cumulative area distribution of biodiversity within mangrove forests was always to the left of the underlying distribution of biodiversity, so biodiversity within mangroves was lower than would be expected if mangroves were randomly distributed with respect to the biodiversity (Supplementary Figure 5A).
Approximately 15% of the total area outside of MPAs along the Gulf Coast had a biodiversity of zero (note y-intercept of blue line on Supplementary Figure 5B). Within MPAs in the same elevation region, no grid cells had a biodiversity value of zero (note y-intercept on Supplementary Figure 5B). Overall, AWM biodiversity was slightly higher within (0.78) compared to outside (0.70) MPAs (see inset bar chart in Supplementary Figure 5B). Biodiversity within 29% of the total area of MPAs was higher than would be expected if the mangroves were randomly distributed with respect to biodiversity (note cumulative area value occurring at within- and outside-MPA line intersection in Supplementary Figure 5B). The cumulative area distribution of biodiversity outside MPAs was to the left of the within MPA distribution, up until a biodiversity of 0.61 or 29% of the total area (Supplementary Figure 5B). Conversely, about 71% of the total MPA area occurred in areas with a biodiversity >0.61 (note remaining cumulative area value occurring at within- and outside-mangrove line intersection in Supplementary Figure 5B).
Pilot Study Results
Population Proximity Index and Biogenic Habitats
Our examination of the proximity of human populations and kelp forests revealed that the PPI on the West Coast was almost 50% lower within kelp forests than in areas outside of kelp forests (AWM 3.57 and 7.60, respectively, see inset bar charts in Figure 5A). All kelp forests had at least some people living within 20 km, given none of the patches fell within PPI grid cells with an index of zero (Figure 5A). The cumulative area distribution of PPI in kelp forests was always to the left of the underlying distribution of the PPI, so the PPI within kelp forests was lower than would be expected if kelp forests were randomly distributed with respect to the PPI (Figure 5A).
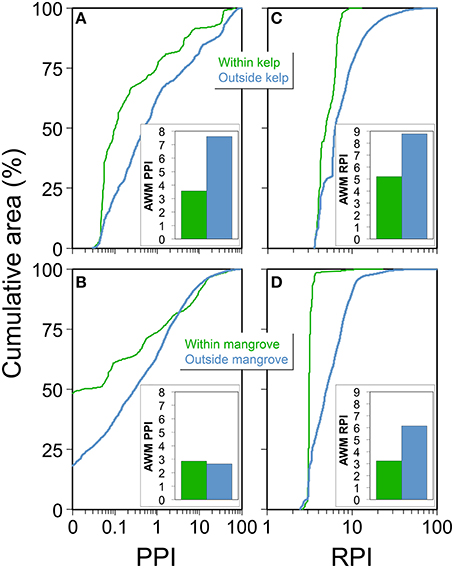
Figure 5. Summary patterns of population proximity index (PPI) and riverine population index (RPI) within and outside of biogenic habitats. (A) Cumulative area of PPI grid cells from depths of 0 to −30 m within (green line) and outside (blue line) kelp forests on the West Coast. (B) Cumulative area of PPI grid cells from depths of +1 to −1 m within (green line) and outside (blue line) mangrove forests on the Gulf Coast. (C) Cumulative area of RPI grid cells from depths of 0 to −30 m within (green line) and outside (blue line) kelp forests on the West Coast. (D) Cumulative area of RPI grid cells from depths of +1 to −1 m within (green line) and outside (blue line) mangrove forests on the Gulf Coast. Inset bar charts illustrate overall area weighted mean (AWM) PPI and RPI across the entire study region within and outside kelp and mangroves. Cumulative area lines plotting to the right of the blue line implies positive correlation while plotting to the left implies negative correlation with the PPI or RPI.
Over 47% of the total area of mangroves along the Gulf Coast occurred at least 20 km away from any humans (PPI = 0, note y-intercept on Figure 5B). In the same elevation region (+1 to −1 m) outside mangroves, only 11% of the area was at least 20 km from any humans (PPI = 0, note y-intercept on Figure 5B). However, AWM PPI was similar within (2.86) compared to outside (2.65) mangroves. The PPI within 83% of mangroves was lower than would be expected if the mangroves were randomly distributed with respect to the PPI (note cumulative area value occurring at within- and outside-mangrove line intersection in Figure 5B). The cumulative area distribution of PPI in mangroves was to the left of the non-mangroves distribution, up until a PPI of 3.44 or 83% of the total area (Figure 5B), which accounted for the apparent disparity between AWM- and cumulative area-PPI scores. This is due to the fact that about 17% of the total mangrove area occurred in areas with a PPI > 3.44 (note remaining cumulative area value occurring at within- and outside-mangrove line intersection in Figure 5B).
Riverine Population Index and Biogenic Habitats
On the West Coast, the RPI was on average ~40% lower within kelp compared with areas outside (AWM 5.21 and 8.78, respectively, see inset bar charts in Figure 5C). The cumulative area distribution of RPI in kelp forests was always to the left of the underlying distribution of the RPI, so the RPI within kelp forests was lower than would be expected if the kelp forests were randomly distributed with respect to the RPI (Figure 5C).
AWM RPI scores within mangroves were ~50% lower than those found outside mangroves (3.23 and 6.15, respectively, Figure 5D inset). The cumulative area distribution of RPI within mangrove forests was always to the left of the corresponding areas outside mangroves, so the RPI within mangroves was lower than would be expected if the mangroves were randomly distributed with respect to the RPI (Figure 5D).
Population Proximity Index and Marine Protected Areas
On the West Coast, MPAs have generally been placed in areas away from people, given AWM PPI within was ~30% lower than that found outside MPAs (2.20 and 3.16, respectively, see inset bar charts in Figure 6A). However, 6% of the total area of MPAs had a PPI of zero and 15% of the area outside MPAs had a PPI of zero (note y-intercepts of within- and outside-MPA lines, Figure 6A). The cumulative area distribution of PPI in MPAs was always to the left of the underlying distribution of the PPI, so the PPI within MPAs was lower than would be expected if the MPAs were placed randomly with respect to the PPI (Figure 6A). Given the projected large increases in human populations size concentrated near central and southern California (Supplementary Figure 1), and the fact that the vast majority of MPAs considered in this study were located off the coast of California, MPA isolation from human influence is likely to decrease by the year 2050.
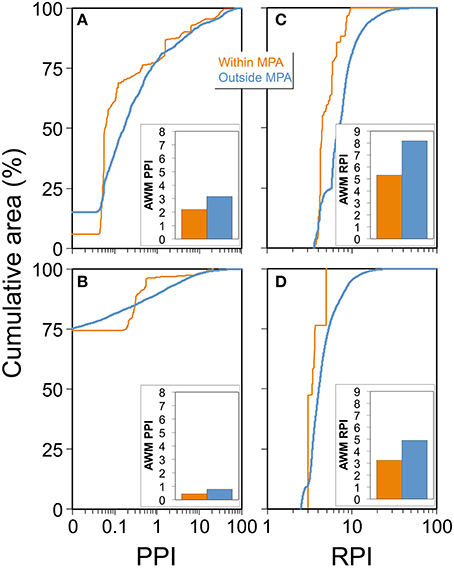
Figure 6. Summary patterns of population proximity index (PPI) and riverine population index (RPI) within and outside of marine protected areas (MPAs). (A) Cumulative area of PPI grid cells from depths of 0 to −100 m within (green line) and outside (blue line) no access or no take MPAs on the West Coast. (B) Cumulative area of PPI grid cells from depths of 0 to −100 m within (green line) and outside (blue line) no access or no take MPAs on the Gulf Coast. (C) Cumulative area of RPI grid cells from depths of 0 to −100 m within (green line) and outside (blue line) no access or no take MPAs on the West Coast. (D) Cumulative area of RPI grid cells from depths of 0 to −100 m within (green line) and outside (blue line) no access or no take MPAs on the Gulf Coast. Inset bar charts illustrate overall area weighted mean (AWM) PPI and RPI across the entire study region within and outside of MPAs. Cumulative area lines plotting to the right of the blue line implies positive correlation while plotting to the left implies negative correlation with the PPI or RPI.
On the Gulf Coast, 74% of the total area of MPAs had a PPI score of 0, and nearly 73% of the region outside MPAs had a PPI of 0 (note y-intercepts of within- and outside-MPA lines, Figure 6B). The cumulative area distribution of PPI in MPAs was to the right of the distribution of PPI in the same elevation region outside MPAs up until a PPI of 0.293, so the PPI within MPAs was higher than would be expected if the MPAs were randomly distributed with respect to the PPI (Figure 6B). However, in areas with PPI scores >0.293, MPAs were more prevalent in lower PPI scoring regions (the cumulative area distribution of PPI in MPAs was to the left for PPI scores greater than 0.293). Similarly, the AWM PPI within MPAs (0.44) was nearly half that found outside MPAs (0.79, see inset bar chart in Figure 6B).
Riverine Population Index and Marine Protected Areas
On the West and Gulf Coasts, AWM RPI within was lower than those found outside MPAs (see inset bar charts in Figures 6C,D). The cumulative area distribution of RPI in MPAs was always to the left of the underlying distribution of the RPI, so the RPI within MPAs was lower than would be expected if the MPAs and were placed randomly with respect to the RPI (Figures 6C,D).
Biogenic Habitats and Marine Protected Areas
On the West Coast, kelp forest cover was three times higher and on the Gulf Coast, mangrove cover was 17 times higher within MPAs, compared with similar depth zones outside MPAs (Supplementary Table 1).
Discussion
The population proximity and riverine population indices we have developed provide a simple, easily generated and valuable tool for assessing the degree of proximity between humans and coastal systems. Because of their modest data requirements (e.g., global gridded population and topographical data), they can be used virtually anywhere in the world where a rapid assessment of potential human impact could be useful. And given the availability of global time series of human population data, these indices can be used to identify retrospective and future patterns of coastal human population based pressures. While the PPI and RPI do not directly measure specific anthropogenic alterations, such as shoreline hardening, pollution, recreational and commercial fishing, when constrained to shallow (< 100 m) depths and within 20 km of the coast, these two indices are a reasonable proxy for the degree of anthropogenic influence in this zone (Steele, 1998; Erlandson and Rick, 2008). This is especially true in developing countries where marine resource exploitation is more likely to occur in close proximity to people (Mora et al., 2011; Sale et al., 2014). For example, Obura et al. (2016), have already used the PPI as a proxy for human pressures in coastal regions of the northern Mozambique Channel. In this system, there is considerable risk of resource overexploitation, and incorporating spatially explicit indicators of human pressures is a critical component of developing regional partnerships for all stakeholders.
There are other indices of marine anthropogenic impacts that are available globally (Halpern et al., 2008) and have been fine tuned for specific large marine ecosystems (Halpern et al., 2009). Importantly, however, these spatially explicit anthropogenic impact maps are based on dozens of geospatial data layers and thus can be difficult to employ quickly or in data-poor regions (Halpern and Fujita, 2013). While the PPI and RPI is admittedly simple in design, we have tested its correlation with detailed data on biogenic habitats using spatially explicit techniques and demonstrated that biogenic habitats are negatively correlated with humans. The greatest drawback of our approach is that the indices do not identify which human impacts are causing the observed patterns in biogenic habitats. This deficiency can be addressed by further refining these indices by specific regions. For example, regions supporting vast complexes of tropical coral reefs, which are largely concentrated in developing countries, are at much greater risk from future human population increases, owing to the close proximity of these systems to people (Mora et al., 2011). In contrast, the steeper topography of the continental shelf found off the West Coast of the United States, as well as established regulatory controls, may reduce the direct risks posed by coastal human populations.
While we designed the PPI to serve as a rough proxy for the degree of human influence in coastal regions, the RPI serves a different role–it represents the influence of humans distant from coastal regions, via riverine delivery. Expanses of the U.S. West Coast with low PPI scores have high RPI scores (e.g., the mouth of the Columbia River near the Washington and Oregon border), making them vulnerable to human influences, despite the lack of large human populations along the coast in these same areas. Other regions (e.g., near San Francisco and the western Gulf of Mexico) have a coincidence of high PPI and RPI scores. In such regions, it becomes clear that mitigating human pressures may require management in both coastal zones as well as upstream in the watershed. Indeed, the Mississippi River in the Gulf of Mexico, has a substantial future risk trend, given the infrastructure engineering that has been implemented to offset the vast anthropogenic alterations to the system (Tessler et al., 2015). Continued population expansion along the coast and within the vast drainage basin will serve to exacerbate stressors imposed by future global climate change (e.g., sea level rise, frequency and severity of extreme weather events, etc.).
Importantly, we also develop a means to forecast how the PPI and RPI will change. This is particularly important since populations are increasing disproportionately within 100 km of marine coasts (Small and Nicholls, 2003; Sale et al., 2014). Our analysis reveals population pressure in coastal regions will increase in the next four decades, but increase varies spatially. For example, the coasts off Washington and Oregon State are not projected to experience significant increases in coastal or inland populations by 2050. In contrast, south Texas currently does not have a high PPI, but with the expected growth in this region, we would expect an increase in the potential human population proximity there. Both examples provide useful information to managers who may wish to set aside areas in reserves or take other measures to mitigate human pressures. Finally, given the predictive capability of the indices we have developed, they could be coupled with global climate change models and improve predictions of climate change impacts on humans.
Our two cases studies highlight the potential value of these new indices. For example, our analyses revealed that no-access and no-take MPAs off the West and Gulf Coasts of the United States are generally sequestered from human populations, and have higher than average proportions (3–17 times as much) of biogenic habitat compared with areas outside MPAs. Given future coastal population patterns off southern California, however, existing MPAs, especially within shallower depths, will not continue to be as isolated from humans. Additionally, identifying areas that currently have high PPI or RPI is useful for risk analyses associated with future human population expansion interacting with biogenic habitats. For example, mangrove forests are experiencing range expansion to higher latitudes in some regions due to global warming (Cavanaugh et al., 2014; Godoy and Lacerda, 2015). Given the “blue carbon” potential of mangroves, this could result in increased sequestration of organic carbon to offset global CO2 emissions. However, if potential mangrove range is constrained along the coast by ever expanding human populations, this important global climate change amelioration may not be realized.
It was never our intention to explicitly demonstrate mechanistic connections between human populations and the biogenic habitats (kelp forests and mangroves) we used in our pilot study. There are certainly many other covariates besides human populations that drive the spatio-temporal distributions of kelp forests and mangroves (Dayton, 1985; Steneck et al., 2002; Dayton et al., 2005; Reed et al., 2011). However, the mechanisms linking humans to the degradation and destruction of macro algae, kelp forests and mangroves, worldwide, are well established (Alongi, 2002; Dayton et al., 2002, 2005; Steneck et al., 2002; Lotze et al., 2006; Duke et al., 2007; Coleman et al., 2008; Connell et al., 2008; Giri et al., 2011b; Hutchison et al., 2014). Causes include fisheries overexploitation, direct habitat destruction, degraded water quality and global climate change. Further, there is substantial evidence that humans have sought areas rich in biogenic habitats for thousands of years (Dayton et al., 2002; Steneck et al., 2002), rather than avoid them. Therefore, it seems unlikely that humans would intentionally avoid settling, establishing and expanding their populations in areas distant from such critical biogenic habitats, which provide so many crucial marine ecosystem services that humans are dependent upon.
In this paper, we developed a simple tool for assessing the magnitude of human populations on the West and Gulf Coasts of the United States, and examined patterns of biogenic habitats as a function of this population index. Quantifying the spatial distribution of human populations is imperative if we wish to forecast future impacts of humans, and thus rapid, simple, coast-wide indicators of anthropogenic impacts in coastal marine regions is crucial to resource managers. While our indices are coarse tools, they can be used anywhere in the world (Sale et al., 2014; Obura et al., 2016), can project into the future using various human population growth forecasts (e.g., Gaffin et al., 2004; Yetman et al., 2004; Bengtsson et al., 2006), and can serve as an important method for conservation triage (Bottrill et al., 2008).
Author Contributions
Study conception and design (BF, PL), acquisition of data (BF), analysis and interpretation of data (BF), drafting of manuscript (BF, PL), critical revision (BF, PL).
Funding
This research was funded by the National Oceanic and Atmospheric administration (NOAA).
Conflict of Interest Statement
The authors declare that the research was conducted in the absence of any commercial or financial relationships that could be construed as a potential conflict of interest.
Acknowledgments
We thank Peter F. Sale for providing the fundamental ideas behind much of our analyses and for his input and support of this project. We also thank Jameal F. Samhouri for his constructive reviews of this manuscript.
Supplementary Material
The Supplementary Material for this article can be found online at: https://www.frontiersin.org/article/10.3389/fmars.2016.00113
References
Aburto-Oropeza, O., Ezcurra, E., Danemann, G., Valdez, V., Murray, J., and Sala, E. (2008). Mangroves in the Gulf of California increase fishery yields. Proc. Natl. Acad. Sci. U.S.A. 105, 10456–10459. doi: 10.1073/pnas.0804601105
Alongi, D. M. (2002). Present state and future of the world's mangrove forests. Environ. Conserv. 29, 331–349. doi: 10.1017/S0376892902000231
Andersen, J. H., Halpern, B. S., Korpinen, S., Murray, C., and Reker, J. (2015). Baltic Sea biodiversity status vs. cumulative human pressures. Estuar. Coast. Shelf Sci. 161, 88–92. doi: 10.1016/j.ecss.2015.05.002
Arkema, K. K., Guannel, G., Verutes, G., Wood, S. A., Guerry, A., Ruckelshaus, M., et al. (2013). Coastal habitats shield people and property from sea-level rise and storms. Nat. Clim. Chang. 3, 913–918. doi: 10.1038/nclimate1944
Barragán, J. M., and de Andrés, M. (2015). Analysis and trends of the world's coastal cities and agglomerations. Ocean Coast. Manage. 114, 11–20. doi: 10.1016/j.ocecoaman.2015.06.004
Bengtsson, M., Shen, Y., and Oki, T. (2006). A SRES-based gridded global population dataset for 1990–2100. Popul. Environ. 28, 113–131. doi: 10.1007/s11111-007-0035-8
Bogaert, J., Zhou, L., Tucker, C. J., Myneni, R. B., and Ceulemans, R. (2002). Evidence for a persistent and extensive greening trend in Eurasia inferred from satellite vegetation index data. J. Geophys. Res. 107, ACL 4-1–ACL 4-14. doi: 10.1029/2001JD001075
Bottrill, M. C., Joseph, L. N., Carwardine, J., Bode, M., Cook, C., Game, E. T., et al. (2008). Is conservation triage just smart decision making? Trends Ecol. Evol. (Amst). 23, 649–654. doi: 10.1016/j.tree.2008.07.007
Bright, E. A., Coleman, P. R., Rose, A. N., and Urban, M. L. (2012). LandScan 2011, 2011 Edn. Oak Ridge, TN: Oak Ridge National Laboratory.
Broadbent, E. N., Asner, G. P., Keller, M., Knapp, D. E., Oliveira, P. J. C., and Silva, J. N. (2008). Forest fragmentation and edge effects from deforestation and selective logging in the Brazilian Amazon. Biol. Conserv. 141, 1745–1757. doi: 10.1016/j.biocon.2008.04.024
Cavanaugh, K. C., Kellner, J. R., Forde, A. J., Gruner, D. S., Parker, J. D., Rodriguez, W., et al. (2014). Poleward expansion of mangroves is a threshold response to decreased frequency of extreme cold events. Proc. Natl. Acad. Sci. U.S.A. 111, 723–727. doi: 10.1073/pnas.1315800111
Cohen, S., Kettner, A. J., and Syvitski, J. P. M. (2014). Global suspended sediment and water discharge dynamics between 1960 and 2010: continental trends and intra-basin sensitivity. Glob. Planet. Change 115, 44–58. doi: 10.1016/j.gloplacha.2014.01.011
Coleman, M. A., Kelaher, B. P., Steinberg, P. D., and Millar, A. J. K. (2008). Absence of a large brown macroalga on urbanized rocky reefs around Sydney, Australia, and evidence for historical decline. J. Phycol. 44, 897–901. doi: 10.1111/j.1529-8817.2008.00541.x
Connell, S. D., Russell, B. D., Turner, D. J., Shepherd, S. A., Kildea, T., Miller, D., et al. (2008). Recovering a lost baseline: missing kelp forests from a metropolitan coast. Mar. Ecol. Prog. Ser. 360, 63–72. doi: 10.3354/meps07526
Costanzo, S. D., O'Donohue, M. J., Dennison, W. C., Loneragan, N. R., and Thomas, M. (2001). A new approach for detecting and mapping sewage impacts. Mar. Pollut. Bull. 42, 149–156. doi: 10.1016/S0025-326X(00)00125-9
Crossland, C. J., Kremer, H. H., Lindeboom, H. J., Marshall Crossland, J. I., and Le Tissier, M. D. A. (2005). Coastal Fluxes in the Anthropocene. Berlin: Springer Berlin Heidelberg.
Dayton, P., Curran, S., Kitchingman, A., Wilson, M., Catenazzi, A., Restrepo, J., et al. (2005). “Coastal systems,” in Millenium Ecosystem Assessment, eds J. Baker, P. M. Casasola, A. Lugo, A. S. Rodríguez and L. D. L. Tang (Washington, DC: Island Press), 513–549.
Dayton, P. K. (1985). Ecology of kelp communities. Annu. Rev. Ecol. Syst. 16, 215–245. doi: 10.1146/annurev.es.16.110185.001243
Dayton, P. K., Thrush, S., Coleman, F. C., and Commission, P. O. (2002). Ecological Effects of Fishing in Marine Ecosystems of the United States. Arlington, VA: Pew Oceans Commission.
Duarte, C. M., Dennison, W. C., Orth, R. J. W., and Carruthers, T. J. B. (2008). The charisma of coastal ecosystems: addressing the imbalance. Estuar. Coast. 31, 233–238. doi: 10.1007/s12237-008-9038-7
Duarte, C. M., Losada, I. J., Hendriks, I. E., Mazarrasa, I., and Marba, N. (2013). The role of coastal plant communities for climate change mitigation and adaptation. Nat. Clim. Change 3, 961–968. doi: 10.1038/nclimate1970
Duke, N. C., Meynecke, J.-O., Dittmann, S., Ellison, A. M., Anger, K., Berger, U., et al. (2007). A world without mangroves? Science 317, 41–42. doi: 10.1126/science.317.5834.41b
Erlandson, J. M., and Rick, T. C. (2008). “Archaeology, marine ecology, and human impacts on marine environments,” in Human Impacts on Ancient Marine Ecosystems: A Global Perspective, eds T. C. Rick and J. M. Erlandson (Berkely, CA; Los Angeles, CA; London, UK: University of California Press), 1–14.
Ewel, K. C., Twilley, R. R., and Ong, J. E. (1998). Different kinds of mangrove forests provide different goods and services. Glob. Ecol. Biogeogr. Lett. 7, 83–94. doi: 10.2307/2997700
Foster, M. S., and Schiel, D. R. (2010). Loss of predators and the collapse of southern California kelp forests (?): alternatives, explanations and generalizations. J. Exp. Mar. Biol. Ecol. 393, 59–70. doi: 10.1016/j.jembe.2010.07.002
Fourqurean, J. W., Duarte, C. M., Kennedy, H., Marba, N., Holmer, M., Mateo, M. A., et al. (2012). Seagrass ecosystems as a globally significant carbon stock. Nat. Geosci. 5, 505–509. doi: 10.1038/ngeo1477
Gaffin, S. R., Rosenzweig, C., Xing, X., and Yetman, G. (2004). Downscaling and geo-spatial gridding of socio-economic projections from the IPCC special report on emissions scenarios (SRES). Glob. Environ. Change 14, 105–123. doi: 10.1016/j.gloenvcha.2004.02.004
Giri, C., Ochieng, E., Tieszen, L. L., Zhu, Z., Singh, A., Loveland, T., et al. (2011a). Global Distribution of Mangroves Forests of the World Using Earth Observation Satellite Data. Cambridge, UK: UNEP World Conservation Monitoring Centre.
Giri, C., Ochieng, E., Tieszen, L. L., Zhu, Z., Singh, A., Loveland, T., et al. (2011b). Status and distribution of mangrove forests of the world using earth observation satellite data. Glob. Ecol. Biogeogr. 20, 154–159. doi: 10.1111/j.1466-8238.2010.00584.x
Godoy, M. D. P., and Lacerda, L. D. (2015). Mangroves response to climate change: a review of recent findings on mangrove extension and distribution. An. Acad. Bras. Ciênc. 87, 651–667. doi: 10.1590/0001-3765201520150055
Gorman, D., Russell, B. D., and Connell, S. D. (2009). Land-to-sea connectivity: linking human-derived terrestrial subsidies to subtidal habitat change on open rocky coasts. Ecol. Appl. 19, 1114–1126. doi: 10.1890/08-0831.1
Graham, M. H. (2004). Effects of local deforestation on the diversity and structure of Southern California giant kelp forest food webs. Ecosystems 7, 341–357. doi: 10.1007/s10021-003-0245-6
Halpern, B. S., Frazier, M., Potapenko, J., Casey, K. S., Koenig, K., Longo, C., et al. (2015). Spatial and temporal changes in cumulative human impacts on the world's ocean. Nat. Commun. 6, 7. doi: 10.1038/ncomms8615
Halpern, B. S., and Fujita, R. (2013). Assumptions, challenges, and future directions in cumulative impact analysis. Ecosphere 4, art131. doi: 10.1890/ES13-00181.1
Halpern, B. S., Kappel, C. V., Selkoe, K. A., Micheli, F., Ebert, C. M., Kontgis, C., et al. (2009). Mapping cumulative human impacts to California Current marine ecosystems. Conserv. Lett. 2, 138–148. doi: 10.1111/j.1755-263X.2009.00058.x
Halpern, B. S., Walbridge, S., Selkoe, K. A., Kappel, C. V., Micheli, F., D'Agrosa, C., et al. (2008). A global map of human impact on marine ecosystems. Science 319, 948–952. doi: 10.1126/science.1149345
Hutchison, J., Manica, A., Swetnam, R., Balmford, A., and Spalding, M. (2014). Predicting global patterns in mangrove forest biomass. Conserv. Lett. 7, 233–240. doi: 10.1111/conl.12060
Hwang, H. M., Green, P. G., and Young, T. M. (2009). Historical trends of trace metals in a sediment core from a contaminated tidal salt marsh in San Francisco Bay. Environ. Geochem. Health 31, 421–430. doi: 10.1007/s10653-008-9195-4
IPCC (2000). Intergovernmental Panel on Climate Change (IPCC) Special Report on Emissions Scenarios, eds N. Nakicenovic and R. Swart. Cambridge: Cambridge University Press.
Jackson, N. L., Smith, D. R., and Nordstrom, K. F. (2008). Physical and chemical changes in the foreshore of an estuarine beach: implications for viability and development of horseshoe crab Limulus polyphemus eggs. Mar. Ecol. Prog. Ser. 355, 209–218. doi: 10.3354/meps07211
Lotze, H. K., Lenihan, H. S., Bourque, B. J., Bradbury, R. H., Cooke, R. G., Kay, M. C., et al. (2006). Depletion, degradation, and recovery potential of estuaries and coastal seas. Science 312, 1806–1809. doi: 10.1126/science.1128035
Mangialajo, L., Chiantore, M., and Cattaneo-Vietti, R. (2008). Loss of fucoid algae along a gradient of urbanisation, and structure of benthic assemblages. Mar. Ecol. Prog. Ser. 358, 63–74. doi: 10.3354/meps07400
McLeod, E., Chmura, G. L., Bouillon, S., Salm, R., Björk, M., Duarte, C. M., et al. (2011). A blueprint for blue carbon: toward an improved understanding of the role of vegetated coastal habitats in sequestering CO2. Front. Ecol. Environ. 9, 552–560. doi: 10.1890/110004
Micheli, F., Halpern, B. S., Walbridge, S., Ciriaco, S., Ferretti, F., Fraschetti, S., et al. (2013). Cumulative human impacts on mediterranean and black sea marine ecosystems: assessing current pressures and opportunities. PLoS ONE 8:e79889. doi: 10.1371/journal.pone.0079889
Mora, C., Aburto-Oropeza, O., Ayala Bocos, A., Ayotte, P. M., Banks, S., Bauman, A. G., et al. (2011). Global human footprint on the linkage between biodiversity and ecosystem functioning in reef fishes. PLoS Biol. 9:e1000606. doi: 10.1371/journal.pbio.1000606
Morley, S. A., Toft, J. D., and Hanson, K. M. (2012). Ecological effects of shoreline armoring on intertidal habitats of a Puget Sound urban estuary. Estuar. Coast. 35, 774–784. doi: 10.1007/s12237-012-9481-3
Mumby, P. J., Edwards, A. J., Ernesto Arias-Gonzalez, J., Lindeman, K. C., Blackwell, P. G., Gall, A., et al. (2004). Mangroves enhance the biomass of coral reef fish communities in the Caribbean. Nature 427, 533–536. doi: 10.1038/nature02286
Neumann, B., Vafeidis, A. T., Zimmermann, J., and Nicholls, R. J. (2015). Future coastal population growth and exposure to sea-level rise and coastal flooding - a global assessment. PLoS ONE 10:e0118571. doi: 10.1371/journal.pone.0118571
NOAA (2003). U.S. Coastal Relief Model - Northwest Pacific. Boulder, CO: National Geophysical Data Center, NESDIS, NOAA, U.S. Department of Commerce.
OBIS (2013). Global Biodiversity Indices from the Ocean Biogeographic Information System. Arlington, VA: Intergovernmental Oceanographic Commission of UNESCO.
Obura, D. O., Burgener, V., Ralison, H. O., Scheren, P., Nuñes, P., Samoilys, M., et al. (2016). “Northern Mozambique Channel - a capitals approach to a blue economy future,” in Handbook on the Economics and Management for Sustainable Oceans, eds L. E. Svensson, P. A. L. D. Nunes, P. Kumar, and A. Markandya (Cheltenham, UK: Edward Elgar Publishing).
ODFW (2008). Oregon Canopy Kelp Composite Layer, ODFW, 1990, 1996-1999. Newport, OR: Oregon Department of Fish and Wildlife.
Perera, H., and Willgoose, G. (1998). A physical explanation of the cumulative area distribution curve. Water Resour. Res. 34, 1335–1343. doi: 10.1029/98WR00259
Rabalais, N. N., Diaz, R. J., Levin, L. A., Turner, R. E., Gilbert, D., and Zhang, J. (2010). Dynamics and distribution of natural and human-caused hypoxia. Biogeosciences 7, 585–619. doi: 10.5194/bg-7-585-2010
Rabalais, N. N., Turner, R. E., Diaz, R. J., and Justic, D. (2009). Global change and eutrophication of coastal waters. ICES J. Mar. Sci. 66, 1528–1537. doi: 10.1093/icesjms/fsp047
Reed, D. C., Rassweiler, A., Carr, M. H., Cavanaugh, K. C., Malone, D. P., and Siegel, D. A. (2011). Wave disturbance overwhelms top-down and bottom-up control of primary production in California kelp forests. Ecology 92, 2108–2116. doi: 10.1890/11-0377.1
Rice, C. A. (2006). Effects of shoreline modification on a Northern Puget Sound beach: microclimate and embryo mortality in surt smelt (Hypomesus pretiosus). Estuar. Coast. 29, 63–71. doi: 10.1007/BF02784699
Sale, P. F., Agardy, T., Ainsworth, C. H., Feist, B. E., Bell, J. D., Christie, P., et al. (2014). Transforming management of tropical coastal seas to cope with challenges of the 21st century. Mar. Pollut. Bull. 85, 8–23. doi: 10.1016/j.marpolbul.2014.06.005
Schnell, J. K., Harris, G. M., Pimm, S. L., and Russell, G. J. (2013). Quantitative analysis of forest fragmentation in the atlantic forest reveals more threatened bird species than the current red list. PLoS ONE 8:e65357. doi: 10.1371/journal.pone.0065357
Scott, G. I., Fulton, M. H., Moore, D. W., Wirth, E. F., Chandler, G. T., Key, P. B., et al. (1999). Assessment of risk reduction strategies for the management of agricultural nonpoint source pesticide runoff in estuarine ecosystems. Toxicol. Ind. Health 15, 200–213. doi: 10.1191/074823399678846673
Seto, K. C., Fragkias, M., Güneralp, B., and Reilly, M. K. (2011). A meta-analysis of global urban land expansion. PLoS ONE 6:e23777. doi: 10.1371/journal.pone.0023777
Small, C., and Nicholls, R. J. (2003). A global analysis of human settlement in coastal zones. J. Coast. Res. 19, 584–599. doi: 10.2307/4299200
Steele, J. H. (1998). Regime shifts in marine ecosystems. Ecol. Appl. 8, S33–S36. doi: 10.2307/2641361
Steneck, R. S., Graham, M. H., Bourque, B. J., Corbett, D., Erlandson, J. M., Estes, J. A., et al. (2002). Kelp forest ecosystems: biodiversity, stability, resilience and future. Environ. Conserv. 29, 436–459. doi: 10.1017/S0376892902000322
Syvitski, J. P. M., and Milliman, J. D. (2007). Geology, geography, and humans battle for dominance over the delivery of fluvial sediment to the coastal ocean. J. Geol. 115, 1–19. doi: 10.1086/509246
Syvitski, J. P. M., Vörösmarty, C. J., Kettner, A. J., and Green, P. (2005). Impact of humans on the flux of terrestrial sediment to the global coastal ocean. Science 308, 376–380. doi: 10.1126/science.1109454
Tessler, Z. D., Vörösmarty, C. J., Grossberg, M., Gladkova, I., Aizenman, H., Syvitski, J. P. M., et al. (2015). Profiling risk and sustainability in coastal deltas of the world. Science 349, 638–643. doi: 10.1126/science.aab3574
U.S. Census Bureau (2012). 2010 Census Urban and Rural Classification and Urban Area Criteria. Washington, DC: U.S. Department of Commerce, U.S. Census Bureau, Geography Division, Geographic Products Branch.
Valiela, I., Bowen, J. L., and York, J. K. (2001). Mangrove forests: one of the world's threatened major tropical environments. Bioscience 51, 807–815. doi: 10.1641/0006-3568(2001)051[0807:MFOOTW]2.0.CO;2
Van Dolah, R. F., Riekerk, G. H. M., Bergquist, D. C., Felber, J., Chestnut, D. E., and Holland, A. F. (2008). Estuarine habitat quality reflects urbanization at large spatial scales in South Carolina's coastal zone. Sci. Total Environ. 390, 142–154. doi: 10.1016/j.scitotenv.2007.09.036
Venkatesan, M. I., de Leon, R. P., van Geen, A., and Luoma, S. N. (1999). Chlorinated hydrocarbon pesticides and polychlorinated biphenyls in sediment cores from San Francisco Bay1. Mar. Chem. 64, 85–97. doi: 10.1016/S0304-4203(98)90086-X
von Glasow, R., Jickells, T., Baklanov, A., Carmichael, G., Church, T., Gallardo, L., et al. (2013). Megacities and large urban agglomerations in the coastal zone: interactions between atmosphere, land, and marine ecosystems. Ambio 42, 13–28. doi: 10.1007/s13280-012-0343-9
Watanabe, K., and Kuwae, T. (2015). How organic carbon derived from multiple sources contributes to carbon sequestration processes in a shallow coastal system? Glob. Chang. Biol. 21, 2612–2623. doi: 10.1111/gcb.12924
Yetman, G., Gaffin, S. R., and Xing, X. (2004). Global 15 × 15 Minute Grids of the Downscaled Population Based on the SRES B2 Scenario, 1990 and 2025. Palisades, NY: NASA Socioeconomic Data and Applications Center (SEDAC).
Keywords: coastal marine, nearshore, biogenic habitat, indicators, ecosystem based management, human populations, marine protected areas
Citation: Feist BE and Levin PS (2016) Novel Indicators of Anthropogenic Influence on Marine and Coastal Ecosystems. Front. Mar. Sci. 3:113. doi: 10.3389/fmars.2016.00113
Received: 24 March 2016; Accepted: 15 June 2016;
Published: 28 June 2016.
Edited by:
Thomas Wernberg, The University of Western Australia, AustraliaReviewed by:
Thibaut De Bettignies, Muséum National d'Histoire Naturelle, FranceElisabeth Slooten, University of Otago, New Zealand
Copyright © 2016 Feist and Levin. This is an open-access article distributed under the terms of the Creative Commons Attribution License (CC BY). The use, distribution or reproduction in other forums is permitted, provided the original author(s) or licensor are credited and that the original publication in this journal is cited, in accordance with accepted academic practice. No use, distribution or reproduction is permitted which does not comply with these terms.
*Correspondence: Blake E. Feist, blake.feist@noaa.gov