Response of the Eastern Mediterranean Microbial Ecosystem to Dust and Dust Affected by Acid Processing in the Atmosphere
 Michael D. Krom1,2*
  Zongbo Shi3
  Anthony Stockdale2
  Ilana Berman-Frank4
  Antonia Giannakourou5
  Barak Herut6
  Anna Lagaria7
  Nafsika Papageorgiou7
  Paraskevi Pitta7
  Stella Psarra7
  Eyal Rahav4,6 Michael Scoullos8 Eleni Stathopoulou8
  Anastasia Tsiola7,9 Tatiana M. Tsagaraki7,10
- 1Department of Marine Biology, Charney School of Marine Sciences, Haifa University, Haifa, Israel
- 2School of Earth and Environment, University of Leeds, Leeds, UK
- 3School of Geography, Earth and Environmental Sciences, University of Birmingham, Birmingham, UK
- 4Mina and Everard Goodman Faculty of Life Sciences, Bar-Ilan University, Ramat Gan, Israel
- 5Hellenic Centre for Marine Research, Attiki, Greece
- 6National Institute of Oceanography, Israel Oceanographic and Limnological Research, Haifa, Israel
- 7Hellenic Centre for Marine Research, Heraklion, Greece
- 8Laboratory of Environmental Chemistry, University of Athens, Athens, Greece
- 9Department of Biology, University of Crete, Heraklion, Greece
- 10Department of Biology, University of Bergen, Bergen, Norway
Acid processes in the atmosphere, particularly those caused by anthropogenic acid gases, increase the amount of bioavailable P in dust and hence are predicted to increase microbial biomass and primary productivity when supplied to oceanic surface waters. This is likely to be particularly important in the Eastern Mediterranean Sea (EMS), which is P limited during the winter bloom and N&P co-limited for phytoplankton in summer. However, it is not clear how the acid processes acting on Saharan dust will affect the microbial biomass and primary productivity in the EMS. Here, we carried out bioassay manipulations on EMS surface water on which Saharan dust was added as dust (Z), acid treated dust (ZA), dust plus excess N (ZN), and acid treated dust with excess N (ZNA) during springtime (May 2012) and measured bacterioplankton biomass, metabolic, and other relevant chemical and biological parameters. We show that acid treatment of Saharan dust increased the amount of bioavailable P supplied by a factor of ~40 compared to non-acidified dust (18.4 vs. 0.45 nmoles P mg−1 dust, respectively). The increase in chlorophyll, primary, and bacterial productivity for treatments Z and ZA were controlled by the amount of N added with the dust while those for treatments ZN and ZNA (in which excessive N was added) were controlled by the amount of P added. These results confirm that the surface waters were N&P co-limited for phytoplankton during springtime. However, total chlorophyll and primary productivity in the acid treated dust additions (ZA and ZNA) were less than predicted from that calculated from the amount of the potentially limiting nutrient added. This biological inhibition was interpreted as being due to labile trace metals being added with the acidified dust. A probable cause for this biological inhibition was the addition of dissolved Al, which forms potentially toxic Al nanoparticles when added to seawater. Thus, the effect of anthropogenic acid processes in the atmosphere, while increasing the flux of bioavailable P from dust to the surface ocean, may also add toxic trace metals such as Al, which moderate the fertilizing effect of the added nutrients.
Introduction
Atmospheric dust and aerosols represent an important source of dissolved nutrients to the offshore global ocean and can increase primary and bacterial productivity and thus carbon uptake (reviewed in Guieu et al., 2014). This is particularly important in regions of the ocean that are strongly impacted by desert dust such as the Central N. Atlantic, the NW Pacific Ocean and the Mediterranean Sea (Mahowald et al., 2005, 2008). The most important nutrient elements controlling primary productivity in the Eastern Mediterranean are phosphorus (P) and nitrogen (N). Previous studies have demonstrated that the system is P limited in winter during the annual phytoplankton bloom (Krom et al., 1991) and N&P co-limited for phytoplankton during the spring/summer (Thingstad et al., 2005; Zohary et al., 2005; Pitta et al., 2016; Rahav et al., 2016; Tsiola et al., 2016). All of the inorganic N supplied from the atmosphere is bioavailable, since it is present as water-soluble ammonium or nitrate. By contrast, most of the P in Saharan dust is supplied as apatite, and to a lesser extent P bound to iron minerals (Eijsink et al., 2000; Singer et al., 2004; Nenes et al., 2011; Stockdale et al., 2015). These minerals are only poorly soluble in seawater (Atlas and Pytkowicz, 1977). Since dust sediments relatively rapidly through the surface layers of the ocean where phytoplankton grow, only the soluble fraction of P in dust is immediately bioavailable with some additional P dissolving on a timescale of hours to days (Mackey et al., 2012). Mahowald et al. (2008) estimate that, globally, about 17% of total atmospheric P deposited at the sea surface is water-soluble. The soluble fraction, however, is highly variable, with values ranging between 7 and 100% (Mahowald et al., 2008).
Dust in the atmosphere is known to cycle between clouds, where it is frequently the nucleus of cloud droplets, and wet aerosols where the water has evaporated, leaving a thin film of water that can have a much higher pH than the original cloud water (Shi et al., 2015). Nenes et al. (2011) found that acidic atmospheric processes increased the amount of leachable P and suggested that there is a direct feedback mechanism between additional acid gases including NOx and SOx in the atmosphere and the amount of leachable P in the depositing aerosols. Although acid gases in the atmosphere can be formed naturally, e.g., NOx from lightning and SOx from the oxidation of dimethyl sulfide—a gas emitted by phytoplankton, the majority of such gases at present are the result of anthropogenic inputs (Seinfeld and Pandis, 2006). The Eastern Mediterranean Sea (EMS) is a particularly important location for the interaction between mineral dust and anthropogenic gases as dust-laden air masses from the Sahara desert interact with polluted air masses from southern Europe. Stockdale et al. (2015) showed that the amount of P released from dust is a linear function of the amount of H+ ions present in the atmosphere over a wide range of H+ ion addition. When the buffer capacity of atmospheric dust, due mainly to CaCO3 present in the dust, is exceeded, excess acid remains and all of the acid-soluble P bearing minerals are converted to bioavailable labile P.
The fertilizing effect of nutrient input by dust can be moderated by the trace metals that are added simultaneously with the aerosol (Paytan et al., 2009). They particularly identified Cu as being a potent algicide, which may be the cause of reduced phytoplankton biomass, though they noted that other metals, such as Al, may play a role (Paytan et al., 2009). As with P, much of the potentially toxic trace metals in dust are present initially as insoluble minerals. However, it is probable that acid processes in the atmosphere may also increase the amount of dissolved toxic minerals in the atmospheric aerosol at the same time as increasing the amount of leachable P.
The EMS is the largest body of water in the ocean that is known to be P limited (Krom et al., 1991). The atmospheric input of nutrients is particularly important in the ultra-oligotrophic Eastern Mediterranean where ~60% of the externally supplied N and ~30% of the leachable P are supplied via atmospheric deposition (Markaki et al., 2003; Krom et al., 2004). The fertilizing effect of atmospheric dust on the EMS microbial ecosystem has been examined previously (Herut et al., 2005; Ternon et al., 2011). They suggested that the major control on the amount of phytoplankton biomass and primary productivity is the amount of the labile limiting nutrient, which is added via the dust/aerosol. During spring/summer, the surface waters of the EMS are co-limited by N and P (Thingstad et al., 2005), while there is abundant Fe derived mainly from atmospheric input (Statham and Hart, 2005). Thus, it is the amount of leachable N&P and its sources, which are important factors in controlling microbial processes including primary productivity in the EMS.
To determine the amount of labile N&P added to a microcosm/mesocosm experiment, it is usual to carry out separate dust leaching experiments in abiotic seawater (e.g., Guerzoni et al., 1999; Herut et al., 2002; Carbo et al., 2005). Mackey et al. (2012) have shown that for a series of dust samples collected on filters and exposed to seawater, while there was a rapid release of phosphate initially, the amount continued to increase over a period of up to 72 h.
In this study, we added to triplicate microcosms, an untreated mineral aerosol, and the same aerosol that had been treated with acid (pH = 2) to simulate acidic atmospheric processing. The experimental design involved untreated dust, acid treated dust, and both with sufficient ammonium added to relieve the N co-limitation found in EMS surface waters at the time of the experiment. The amount of dissolved inorganic nutrients and trace metals added with dust samples were quantified. Measurements were made to determine the biological response to the modified Saharan dust, including determining the changes in phytoplankton and bacterial biomass and productivity as well as other relevant microbial parameters. The experiment was designed to investigate the net effect of simulated atmospheric acidic processes on the microbial ecosystem and provided initial results of the relative importance of acidic processes on stimulating and inhibiting biological processes in this vulnerable ecosystem. These experiments were carried out simultaneously to a mesocosm experiment in which Saharan dust and Polluted aerosol were added and the biological responses determined (Tsagaraki et al.—this issue).
Materials and Methods
Dust Leaching Experiments
Prior to the leaching of phosphate and ammonia, 120 ml plastic containers were coated with iodine by adding a crystal or two of elemental iodine and placed in oven at 40°C for 10 min. The containers were cooled to room temperature (22°C) and swilled with Milli-Q water to remove all the excess I2. For the nitrate leaching, uncoated 250 ml plastic containers were used. For the phosphate/ammonia leaching experiment, 50 mL of sterile seawater was added to each container in a biological safety cabinet. 0.16 ml of 6 N HCl was added to three of the sample containers to simulate acid conditions in the atmosphere. ~6 mg of accurately weighed dust was then added and the containers were placed on a shaking table for 30 min, 2, 6, 24, and 48 h situated in a light proof box. The duration of the leaching experiment was based on the study of Mackey et al. (2012), which found an increasing amount of leached P after 24–48 h. This was also the period of our microcosm experiment, chosen in that case for practical reasons as the experiment was carried out in parallel to the labor intensive mesocosm experiment. At each sampling, ~7 mL of sample was removed by syringe, filtered through 0.45 μm polycarbonate filters and stored at 4°C for subsequent analysis. For the nitrate leaching experiment, 100 ml of sterile seawater was used and was sampled in the same way as for the other determinants, after 30 min leaching. The length of time used for nutrient leaching was determined by preliminary experiments on samples of dust collected in Rosh Pina, Israel (see Supplementary Information Figures S1A,B, S2A,B). The analysis of all the nitrate and phosphate samples was carried out after the 48 h sample was collected. The ammonium samples were frozen and analyzed subsequently. A series of six blank samples were run through the sampling procedure and the average value subtracted for each sample analyzed (mean blank values were P 3 ± 4 nmol L−1 and nitrate 48 ± 50 nmol L−1. Nutrient content was determined by standard SEAL AA-3 automated methods for phosphate (using the molybdate blue method), nitrate (as nitrite after Cd column reduction) and ammonium (using a fluorescence method). The precision of replicate analysis was 1.8 ± 0.01 μM for phosphate, 6.0 ± 0.05 μM for nitrate and 5.75 ± 0.05 μM for ammonium.
Microcosm Experiment
A dust-enrichment microcosm experiment was carried out using surface (~10 m depth) seawater pumped into holding tanks on-board the R/V Philia from a location 5 nautical miles north of Heraklion (Crete, Greece, 35.4159 N, 25.2407 E) on May 10th, 2012. The experiment was carried out at the CRETACOSMOS facility of the Hellenic Centre for Marine Research (cretacosmos.eu), in 15 translucent 8 L polyethylene (PE) bottles/microcosms, that were washed with 10% hydrochloric acid, rinsed three times with Milli-Q water and finally three times with seawater from the sampling site before filling them.
The 15 microcosms were separated into five sets of triplicates, dependant on the experimental amendments made: (1) Control—original seawater, no addition (C); (2) Original seawater + Saharan dust precursor (Z); (3) Original seawater + Saharan dust precursor + 200 nM NH4 mg−1 dust (ZN); (4) Original seawater + acid treated Saharan dust precursor (ZA); and (5) Original seawater + acid treated Saharan dust precursor + 2000 nM NH4 mg−1 dust (ZNA).
Saharan Dust Proxy Treatment
In order to have enough particulate material of known composition, size fractionated surface soil taken from Northern Libya (32.29237N 22.30437S) was used as proxy for Saharan dust. As in previous experiments (Shi et al., 2011), only the fine-grained fraction (PM10, <10 μm), which corresponds to the material that is transported for long distances, was used. The proxy dust was resuspended using a custom-made resuspension chamber and the PM10 was separated for subsequent use. Previous studies have used similar procedures for experimental work with Saharan dust (Lafon et al., 2006; Guieu et al., 2010; Shi et al., 2011). Within the text we use the term PM10 dust or simply dust for this size fractionated proxy.
To mimic the effect of atmospheric acid processes on dust (Nenes et al., 2011), 200 mg of PM10 were added to 50 ml of milli-Q water, acidified to pH 2, in a plastic vial. They were mixed and shaken for 5 min and then 8 ml of the dust suspension were added to each acidified PM10 treatment microcosm (ZA and ZNA). This gave a final dust concentration of 4 mg L−1 seawater in the microcosm. Similarly, 200 mg of PM10 were added to 50 ml of milli-Q water in a plastic vial and 8 ml of dust suspension were added to each non-acidified PM10 treatment microcosm (Z and ZN). Ammonium Chloride was added to the ammonium-amended treatments (ZN, ZNA) to give final concentrations of the values given in Table 1.
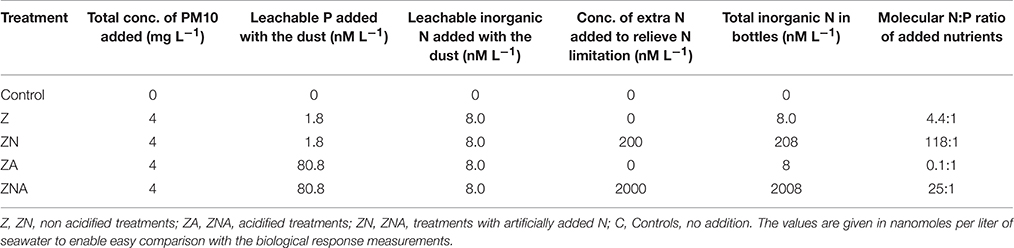
Table 1. Concentration of leachable nutrients (inorganic P and inorganic N) added to each one of triplicate sets of microcosms (treatments).
The bottles were incubated for 48 h in a large pond of seawater under flow-through conditions to maintain ambient temperature and were covered with a layer of neutral density net mimicking light intensity at the depth layer (10 m) from which water was collected. The ambient seawater was also tested/characterized for most biomass and activity variables prior to the seawater being added to the microcosms. All microcosm treatments were sampled once, immediately after material additions (T0), and then daily, at 08:30 a.m. for a period of 2 days after material addition (T24 and T48).
Measurement of Chlorophyll a Concentration
Water samples (500 ml) were filtered through 47 mm diameter polycarbonate membranes of 0.2 μm pore size, using low vacuum pressure (<200 mm Hg). The filters were immediately extracted in 90% acetone at 4°C in the dark overnight (for 14–20 h); Chl-a concentrations were determined using a Turner TD-700 fluorometer (Yentsch and Menzel, 1963).
Primary Production
Primary production (PP) was measured using the 14C incorporation method (Steeman-Nielsen, 1952). Three light and one dark 170 ml polycarbonate bottles were filled with sample water from each microcosm in the morning, inoculated with 20 μCi of NaH14CO3 tracer each, and incubated in the large concrete tank for 3 h around midday. After the incubation, samples were filtered through 0.2 μm polycarbonate filters under low vacuum pressure (<200 mm Hg) and filters were put in scintillation vials where 1 ml of 1% HCl solution was immediately added in order to remove excess 14C-bicarbonate overnight. Then, 4 ml scintillation fluor (BSF, Packard) was added to the vials, and samples were counted in a scintillation counter (Packard Tri-Carb 4000TR). PP (mg C m−3 h−1) was then calculated from the radioactivity (disintegrations per minute, dpm) measured in the light and dark samples, as shown in the following formula:
Where DIC (Dissolved Inorganic Carbon) = 26.400 mg C m−3, 1.05 = correction factor for the lower uptake of 14C as compared to 12C and h = duration of the incubation (hours).
Bacterial Production
Bacterial production (BP) was measured daily in all microcosms, using the 3H-leucine incorporation method modified by Smith and Azam (1992). Water samples (1.5 ml) were collected, in triplicate, in 2 ml Eppedorf tubes and 50 μl of [4,5-3H]-l-leucine (Amersham TRK 636, specific activity 165 Ci mmol−1) was added at 20 nM final concentration. Controls received 90 μl of 100% trichloroacetic acid (TCA) before injection of tritiated leucine. All samples, including controls, were incubated for 2 h in the dark, at in situ temperature. Incubations were stopped with 90 μl of 100% TCA and the samples were stored at 4°C. BP was calculated according to Kirchman (1993), from 3H-leucine incorporation rates. Concentration kinetic experiments were performed in order to verify that the concentration of leucine added (20 nM) was sufficient to saturate incorporation (Van Wambeke et al., 2002).
Measurement of Abundance and Biomass of Heterotrophic Bacteria and Cyanobacteria Synechococcus Spp.
Abundance of heterotrophic bacteria and cyanobacteria Synechococcus spp. was obtained by flow cytometric analyses. A FACS Calibur instrument was used (Becton Dickinson), equipped with an air-cooled laser at 488 nm and standard filters. Milli-Q water was used as sheath fluid. Samples were run at high speed (58 μl min−1) for 1 min for heterotrophic bacteria counts and for 3 min for cyanobacterial counts. Abundance was then calculated using the acquired cell counts and the flow rate. All flow cytometry data were acquired with the CellQuest and analyzed with the Paint-A-Gate software packages (Becton Dickinson).
Samples for heterotrophic bacterial counts were fixed and processed according to Marie et al. (1999). Briefly, fixation was achieved with 0.2 μm pre-filtered 25% glutaraldehyde at 0.5% final concentration. Samples were then kept at 4°C for ~20 min, deep frozen in liquid nitrogen and finally stored at −80°C until enumeration. For heterotrophic bacteria, samples were thawed at room temperature and stained with SYBR Green I nucleic acid dye at a final dilution 4 × 10⁻⁴ of the stock solution. The stained samples were incubated for 10 min in the dark. Heterotrophic bacteria were grouped in two groups according to their SYBR Green I fluorescence intensity (low and high DNA content). Cyanobacteria Synechococcus spp. were counted fresh, without fixation and staining steps, using their characteristic auto-fluorescence chlorophyll/phycoerythrin signals. Multi-fluorescence beads (0.93 μm, Polysciences) were used as an internal standard of fluorescence at all runs.
Abundance data were converted into C biomass using 20 fg C cell−1 for heterotrophic bacteria (Lee and Fuhrman, 1987) and 250 fg C cell−1 for Synechococcus (Kana and Glibert, 1987).
Alkaline Phosphatase Activity (APA)
Samples of APA were collected in triplicate prior the experiment (Ambient), at T0 and T24 and analyzed according to Thingstad and Mantoura (2005). One milliliter of seawater sample was added to the substrate MUF-P. The alkaline phosphatase (AP) hydrolyses the fluorogenic substrate MUF-P and yields a highly fluorescent product (methyllumbelliferon: MUF) and a phosphate group in equimolar concentrations (i.e., Luna et al., 2012). The MUF produced was detected as increase in fluorescence with spectrofluorometer (Hithachi F-2000, excitation-364 nm and emission-448 nm). A standard curve with MUF (Sigma Co.) was used to quantify the amount of MUF produced by APA, so the phosphate liberated in the reaction could be estimated.
Trace Metal Analysis
The samples for the analysis of trace metals (volume of 1 L each), were collected in PTFE bottles (pre-treated overnight with 2N HNO3 and rinsed afterwards with ultrapure Milli-Q water) and within 12 h from their collection, the samples were filtered through pre-weighted nitrocellulose membrane filters (Millipore 0.45 μm pore size) under a clean laminar hood (class 100) in order to separate the particulate from the dissolved form of metals.
The dissolved metals in the filtered samples were determined immediately after filtration through a process of pre-concentration by passing the sample through Chelex-100 resin columns for retaining the metals and elution of them by the use of 10 ml nitric acid 2N s.p. under the clean laminar hood (pre-concentration factor = 100). The pre-concentration procedure is a slight modification (Scoullos et al., 2007) of that proposed by Riley and Taylor (1968) and Kingston et al. (1978).
Trace metals concentrations (Cu, Pb, Zn, Mn, Al, Fe) in the eluates were determined by employing for Zn, Al, Fe, a Varian SpectrAA 200 Flame Atomic Absorption Spectrophotometer (FAAS) and for Cu, Pb, Mn, a Varian SpectrAA-640Z Graphite Furnace Atomic Absorption Spectrophotometer (GFAAS) with Zeeman background correction. The relative standard deviation [Sr = (S/χ) × 100] of the measurements resulting from replicate (3–4) determinations and standard addition experiments was <5%. The details for these methods are given in Table 2.
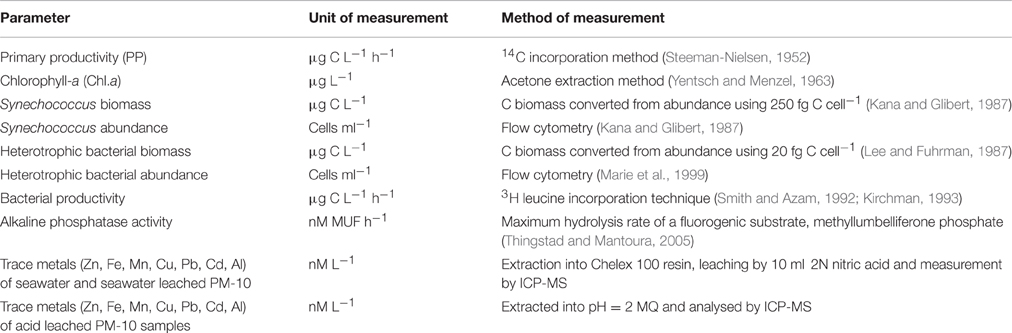
Table 2. Summary table of the methods used to determine biogeochemical changes in the microcosms during this experiment.
Statistical Analyses
Test of statistical significance was carried out using a one-way analysis of variance (ANOVA) followed by Tukey's post-hoc test. This test was used to compare between the controls and the different treatments (P < 0.01) at the conclusion of the microcosm experiment. All tests were performed using the XLSTAT.
Results
The amount of P leached from untreated PM10 dust was 0.45 nmoles P mg dust−1 (averaging the values for 24 and 48 h leaching excluding PM10_2 48 h; Figure 1A) and 2 nmoles N mg dust−1 as nitrate (using the measured value after 30 min; Table S1). It is noted that the phosphate added is a minimum because there may have been some readsorption of phosphate onto the PM10 dust particles during the leaching experiment. The amount of P leached from the acidified dust (0.01 N) was 18.4 nmoles P mg dust−1 also averaged for 24 and 48 h; Figure 1B) and it was assumed that there was also 2 nmoles N mg dust−1 leached from the acid treatment. The concentration of ammonia leached from the dust was 0.08 ± 0.3 nmoles N mg dust−1 (Table S1). This average value is considered below the practical detection limit and assumed to be zero for all subsequent calculation. These values were used to calculate the amount of N & P added to the microcosms shown in Table 1. The pH change caused by the addition of 8 mls of pH = 2 water to 4 L of seawater was −0.02 pH units.
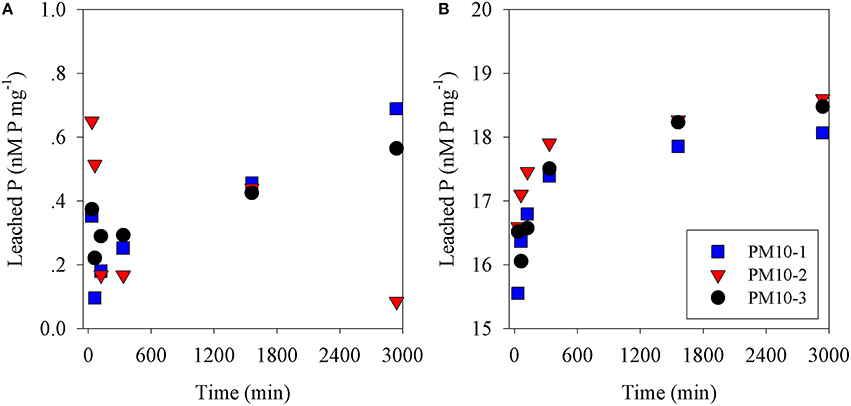
Figure 1. Phosphate leached from (A) PM10 (three replicates) vs. time into seawater and (B) PM10 leached into seawater acidified to pH = 2 (three replicates) expressed as nM phosphate mg dust−1.
The 10 m deep seawater used in this experiment, which is labeled ambient (Amb.), exhibited typical oligotrophic characteristics, with 0.074 μg Chl.a L−1 and 0.22 ± 0.01 μg C L−1 h−1 primary productivity (PP). The bacterial abundance was 2.8 × 10⁵ cells ml−1, resulting in a calculated biomass of 5.57 μg C L−1. Alkaline Phosphatase Activity (APA) was 4.69 ± 0.12 nmoles MUF h−1 (all data from the microcosms are presented in Table S2). The dissolved nutrients (phosphate and nitrate) were below analytical detection limits.
The pattern of observed changes in the microcosms was broadly similar for Chl-a, primary and bacterial productivity (Figures 2–4A). Thus, for Chl-a, the measured concentration in the microcosms at T0 was 0.05 μg chl.a L−1, slightly less than that of ambient values (0.07 μg chl.a L−1; Figure 2). After 48 h, the ZA microcosms showed no measurable increase in Chl.a (0.09 ± 0.01 μg chl.a L−1) compared with the control microcosms (0.09 ± 0.01 μg chl.a L−1; Figure 2). Chl.a in ZN additions was slightly higher than Z additions after 48 h (0.12 ± 0.02 vs. 0.11 ± 0.02 μg chl.a L−1). The greatest increase was in the acidified ZNA treatments, which ended up with a value of 0.30 ± 0.07 μg chl.a L−1 after 48 h which was significantly higher than all other treatments (p < 0.01; Table S3).
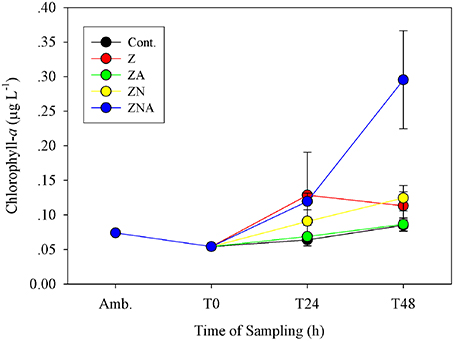
Figure 2. Measured changes in chlorophyll-a concentration in the microcosm treatments compared with the initial ambient values of the water used to inoculate the microcosm bottles.
The primary productivity measured at the ZA microcosms after 48 h was the same as for the control microcosms; 0.23 ± 0.03 μg C L−1 h−1 (Figure 3). Both untreated dust additions (Z and ZN) caused an increase in primary productivity by ca. 50% to 0.37 ± 0.13 and 0.39 ± 0.04 μg C L−1 h−1, respectively, while ZNA, by ca. 500% to 1.16 ± 0.30 μg C L−1 h−1 (Figure 3), significantly greater than all other treatments (p < 0.01; Table S3).
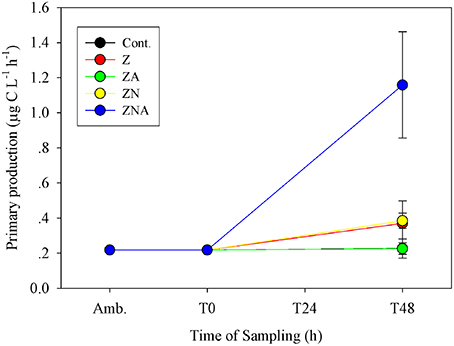
Figure 3. Measured changes in primary productivity rate in the microcosm treatments compared with the initial ambient values of the water used to inoculate the microcosm bottles.
Bacterial biomass in the control increased from 6 μg C L−1 at T0 to 7.6 μg C L−1 after 48 h (Figure 4B). As with bacterial activity, the only treatment that showed a decrease compared with the control was ZA. All the other treatments showed an increase, although the largest one was at Z (11.1 μg C L−1) while ZN (8.3 μg C L−1) and ZNA (9.8 μg C L−1) were somewhat lower. Bacterial productivity showed the largest increase over 48 h at ZNA which, in this case, reached 273 ng C L−1 h−1 compared with 21 ng C L−1 h−1 for the control (Figure 4A) and was significantly greater than all other treatments (p < 0.01; Table S3). For this parameter, ZN was greater (82 ng C L−1 h−1) than Z (53 ng C L−1 h−1) and ZA increased to 58 ng C L−1 h−1 compared with Z.
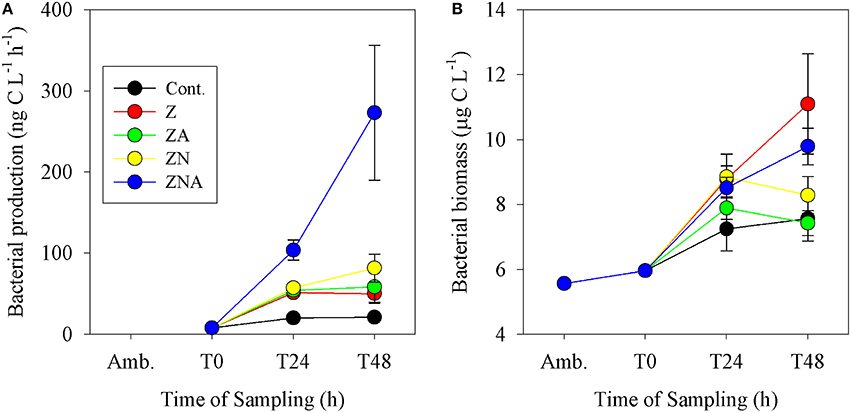
Figure 4. Measured changes in (A) bacterial activity rate and (B) calculated bacterial biomass in the microcosm treatments compared with the initial ambient values of the water used to inoculate the microcosm bottles.
Synechococcus cell numbers in the controls increased from 20260 to 32 ± 4 cells × 103 ml−1 (Figure 5). Compared to the controls, both non-acidified treatments (Z and ZN) showed an increase in Synechococcus cell numbers after 48 h, to 43 ± 7 cells × 103 ml−1 for Z and to 34 ± 1 cells x103 ml−1 for ZN. By contrast, both acid treated microcosms (ZA and ZNA) resulted in a decrease in Synechococcus cell numbers, to values of 27 ± 3 and 27 ± 3 cells × 103 ml−1, respectively.
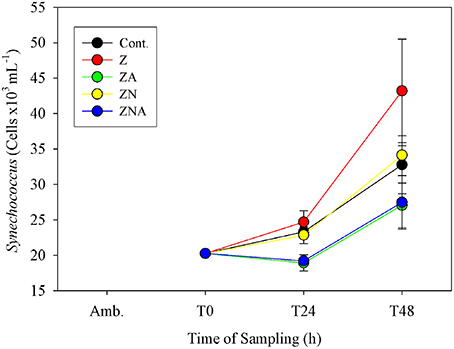
Figure 5. Measured changes in calculated Synechococcus biomass determined by flow cytometry in the microcosm treatments compared with the initial values at the beginning of the experiment.
APA continuously decreased within 24 h of dust addition, from 4.69 nM MUF h−1 to values at or below 1 nM MUF h−1 (Figure 6). This decrease occurred in the treatments where phosphate was added in relatively large amounts (ZA and ZNA), in the Z treatment where P was added with a small deficit of N, and also in the controls. The only treatment where APA first decreased (T0) and then increased to 4 nM MUF h−1 (T24) was ZN where there had been a small increase in P and a relatively large increase in N.
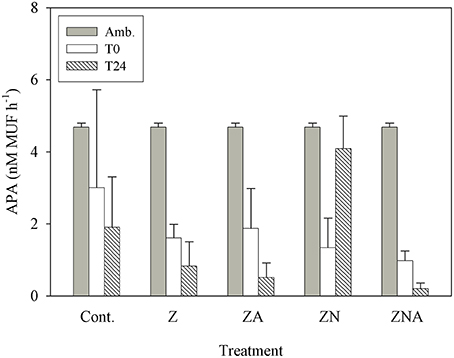
Figure 6. Measured changes in alkaline phosphatase activity between T0 and T24 (hours) for the control and all treatments (Z, ZA, ZN, and ZNA).
Trace metal concentrations increased considerably, particularly those of Al, Mn, and Fe in the acid treated PM10 sample, which represents the dust sample after being affected by acid processes in the atmosphere compared with the untreated PM10 sample (Table 3). The ambient and experimental trace metals were measured after filtration through 0.2 μm filters followed by pre-concentration through ion exchange resins. Thus, the concentrations of trace metals in the experimental microcosms represent dissolved inorganic trace metals in the ambient solution that the organisms are present in. The amount that has been lost from solution has also been calculated in Table 3. This was calculated by assuming that without any PM10 the concentration in solution would be the same as the control. The missing trace metal is then the measured value (the control value plus the added metal from the PM10). Positive numbers represent additional trace metal in solution, while negative numbers represent trace metals missing from solution. It is likely that this missing metal have been taken up by the organisms, or converted into a form that is not determined by the extraction system employed to pre-concentrate the samples. It cannot be entirely excluded that trace metals are adsorbed onto the walls of the container, however this seems unlikely since the control sample was carried out in the same vessels. While the analytical variability is ~5%, the total variability including sampling was higher. Here, we use the measured variability of the control samples (2 × SD) as an estimate of the values above which it is reasonable to interpret the changes as meaningful. These data are marked in bold in Table 3.
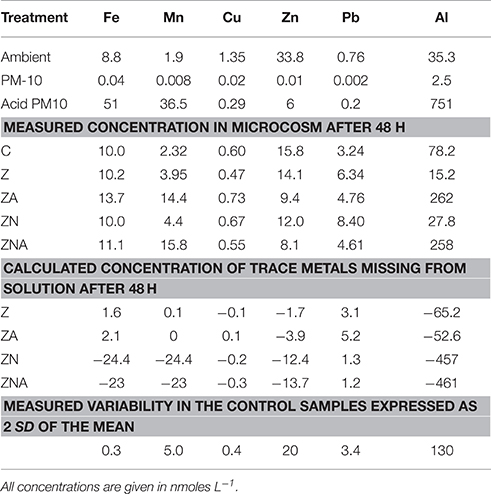
Table 3. Concentration of trace metals in the ambient seawater before the start of the experiment, calculated concentration of trace metals added with the acidified (pH = 2) PM10 and the non-acidified PM10, measured concentration of trace metals in the microcosms after 48 h, and calculated concentrations of trace metals missing from solution (calculated from the final concentration minus the control plus the added trace metals from the PM-10).
In all cases, the amount of trace metals added to the experimental microcosms, when the untreated PM10 dust was added, had no measurable effect on the concentrations observed in the microcosms (Table 3).
The major change in trace metals was for treatments with acidified dust added (ZA and ZNA microcosms). In those treatments, [Al] increased by more than ~180 nM while the Al content in the Z and ZN microcosms decreased by a factor of almost 50% compared to the control. [Mn] also increased as a result of the addition of acidified dust, from 1.9 nM in the ambient to 14.4–15.8 nM in the acidified PM10 additions (ZA and ZNA, respectively). This was approximately half of the added Mn from the PM10 (36.5 nM). Fifty-one nM of dissolved Fe was added to the microcosms with the acid PM10 and yet, the final measured concentrations were only slightly higher in the acidified microcosms (13.7 and 11.1 nM in ZA and ZNA, respectively) compared with the control (10 nM) and the non-acidified microcosms Z and ZN (10.2 and 10.0 nM, respectively). This is likely to be because dissolved Fe is very insoluble at ambient seawater pH's (7.8–8.3) and tends to precipitate rapidly as ferrihydrite. This solid also is a known substrate for trace metal (and phosphate) adsorption. The trace metal most commonly associated with the inhibition of phytoplankton activity is Cu (Paytan et al., 2009; Jordi et al., 2012). In this experiment, the Cu measured in the microcosms was ~half the value measured in the ambient waters. In addition, although 0.29 nM of Cu was added to the acid microcosms ZA and ZNA, the concentration remaining in the microcosms after 48 h (0.73 and 0.55 nM for ZA and ZNA, respectively) was similar to the control (0.60 nM) and the other non-acidified microcosms (0.47 and 0.67 nM for Z and ZN, respectively). All the observed changes in Cu were within the variability found in the replicate control samples (±0.6 nM) and are thus not considered significant. The Zn content in the acidified microcosms ZA and ZNA (9.4 and 8.1 nM, respectively) was less than that in the control (15.8 nM) and the non-acid PM10 additions (14.1 and 12.0 nM in Z and ZN, respectively).
The missing trace metals, showed a similar pattern, with the largest missing amount of trace metal being ~460 nM Al from the acid PM10 samples. There was ~50 nM Fe, and ~24 nM Mn missing from solution in the acidified PM10 samples while the missing Cu, Zn, and Pb (in both acidified and non-acidified samples), and the Al and Fe in the non-acidified samples were within the variability of the control samples. The missing Mn in the non-acidified samples was only ~2 nM.
Discussion
In this study, PM10 samples were leached into surface Eastern Mediterranean seawater to determine how fast N&P were released from untreated dust samples. Our results showed that while nitrate was leached essentially completely within 30 min (Figure S1), phosphate continued to increase from 6 h (0.28 nmoles P mg−1) to 24 h (0.44 nmoles P mg−1) and to 0.45 nmoles P mg−1 after 48 h. This pattern was similar to that observed in our preliminary experiments using Rosh Pina dust (Figures S1A,B). This is similar but not identical to the results obtained by Mackey et al. (2012), who observed that an increasing amount of P was leached from dust samples over the first 24 h followed by a smaller increase over the next 2 days. A similar pattern was obtained from the dust samples used in the mesocosm experiments (Herut et al., submitted—this issue), as well as in experiments using dust collected during a dust storm from Rosh Pina, Israel (Stockdale and Krom; unpublished data). These experiments, all performed with different samples of untreated dust, show small differences in the rate of increase in P leached with time. A possible explanation for these differences is that natural apatite, the major P containing mineral in Saharan dust (Stockdale et al., 2015) exists in several subtly different mineral forms. It is likely that these dissolve at different rates when placed in an excess of seawater. We also note that lower concentrations of dissolved minerals appear to drive faster dissolution of phosphate although this possible effect requires further investigation (Figure S1).
In our microcosm experiment, Chl.a and PP values were characteristic of an ultraoligotrophic environment in early summer (Siokou-Frangou et al., 2010). The Chl.a values were similar to those measured in EMS offshore waters (Psarra et al., 2005; Ignatiades et al., 2009; Rahav et al., 2013), to those in coastal waters off Crete (Psarra et al., 2000; Pitta et al., 2016; Tsiola et al., 2016), and off Israel (Kress et al., 2005; Raveh et al., 2015). PP was somewhat higher than offshore waters and somewhat lower than observations off the Israeli coastal waters recorded at the same season.
It has been suggested that acid processes in the atmosphere result in an increased supply of leachable inorganic P (LIP) resulting from the dissolution of P minerals (apatite and Fe-Bound minerals; Nenes et al., 2011; Stockdale et al., 2015). We chose in this study to dissolve the PM10 dust precursor at pH = 2 with a high water to dust ratio. This pH represents that in wet aerosols that have been in contact with polluted air masses (Meskhidze et al., 2003; Nenes et al., 2011). The LIP of the acidified PM10 dust was 18.4 nM mg dust−1, which was ~40 times higher that of non-acidified samples (0.45 nM mg dust−1, Figure 1). Since it is known that the surface waters of the EMS are N&P co-limited for phytoplankton in May (Thingstad et al., 2005; Zohary et al., 2005), with inorganic nutrients below analytical detection limits, it is possible to predict the effective limiting nutrient in each treatment from the amount of dissolved nutrients added. The amount of N in the PM10 added microcosms (Z and ZA; 2 nM mg dust−1, Table 1) was relatively low, in part because the PM10 soil precursor sample had not been exposed to the hydrophilic N gases in the atmosphere. This low N in the untreated PM10 treatment (Z) meant that after addition to the microcosms, the treatment became N limited with an added N:P ratio of 7.0. The acidified PM10 treatment (ZA) added a similarly low N, while the P concentration was ~40 times higher. This treatment was similarly N limited. By contrast, in those treatments where N was added (ZN and ZNA), the systems became P limited (N:P ratio = 118:1 and 25:1, respectively). The primary response of the treatments reflected these nutrient additions and the resulting limiting nutrient with large and significant increases in Chl.a, PP and BP in the ZNA microcosms (Figures 2–4) reflecting the much higher amount of phosphate added and greater availability of phosphate for primary and bacterial metabolism.
The sequence and approximate magnitude of changes in phytoplankton, as measured by Chl.a, and PP was controlled by the relative amount of the limiting nutrient added. Thus, the response of the Z treatment (N limited) after 48 h as somewhat lower than ZN (P limited) for both variables and was significantly lower than the response of the ZNA treatment where the added limiting nutrient P concentration was 40 times higher than Z and ZN (Figures 2, 3). This confirms that the dust provided a bioavailable (leachable) source of N and P as found in other studies (Herut et al., 1999, 2000, 2002; Migon et al., 2001; Ridame and Guieu, 2002) and relieved the phytoplankton community of N and P co-limitation (Kress et al., 2005; Krom et al., 2005; Pitta et al., 2005; Tanaka et al., 2011).
Ambient levels of APA were found to be high, as is typically found in the EMS (Thingstad and Mantoura, 2005) since the system is strongly P starved (Krom et al., 2005). In all of the treatments where P was added by PM10 addition, the APA decreased as the P deficiency was alleviated (Figure 6). The exception to this was ZN where a small amount of P and a large amount of N were added. In this case, it is suggested that the microbial community increased the APA to try to obtain new P to balance the extra N added externally.
Other microbial responses to the dust addition included bacterial productivity that increased substantially more after ZNA addition compared to other treatments (Figure 4A). It is suggested that greater phytoplankton production in ZNA microcosms (Figure 3) may have produced an increased concentration of labile organic carbon to fuel heterotrophic bacterial respiration (Siokou-Frangou et al., 2010). However, this increase was not matched by an increase in bacterial biomass (Figure 4B). This suggests that although the addition of the highest amount of N and P allowed for an increase in BP, the standing crop of bacteria was controlled by grazers such as heterotrophic nanoflagellates and ciliates (Kress et al., 2005; Pitta et al., 2005; Romero et al., 2011) or that the cell specific BP changed.
The magnitude of the increases in Chl.a and PP were not, however, simply related to the concentration of the added limiting nutrient. Thus, although treatments Z and ZA, both had the same amount of the limiting nutrient (N) added, the response was different. The final Chl.a and PP of the ZA treatment was lower than for the Z treatment, and almost exactly the same as the control (Figures 2, 3). The Chl.a/limiting nutrient ratio for Z, which is only PM10, was 16.6 ng chl.a/nM PO4 (Table 4)—similar to that measured for the ratios for previous dust addition experiments to the EMS, carried out in early summer [9.7–15.7 ng chl-a L−1 nM , Table 4, (Herut et al., 2005)]. It is unlikely that the lower response of ZA was due to higher grazing rates since there is no reason why there should be higher grazing in this treatment compared with the others. It is also unlikely to be due to the “acid” added since the pH change was only a decrease of 0.02 pH units. The probable reason for this partial suppression of both PP and phytoplankton biomass is the trace metals added with the nutrients (Paytan et al., 2009).
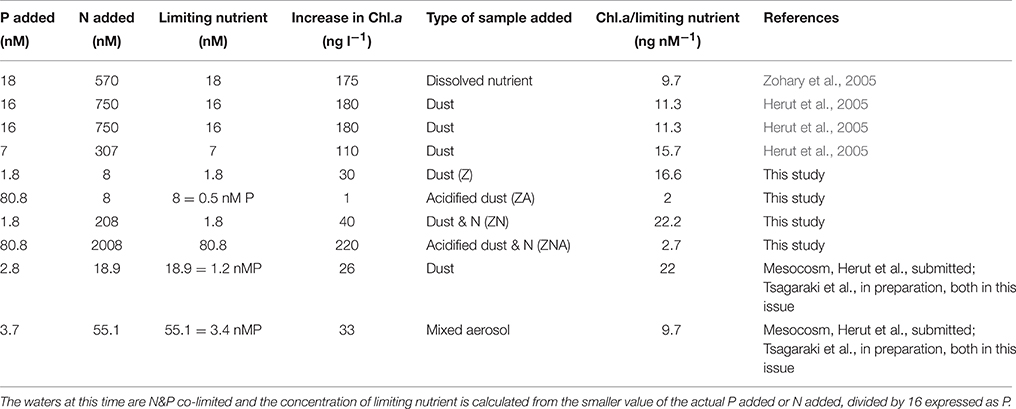
Table 4. Table showing the ratio of Chlorophyll-a increase relative to the controls/concentration of the limiting nutrient added for a series of micro- and mesocosm-experiments carried out in the EMS during May.
Additional evidence suggesting that it is the trace metals released by the acid treatment that caused measurable biological suppression comes from the ZNA treatment in which the Chl.a/limiting nutrient ratio was 2.7 μg chl.a L−1/nM which was similar to that of ZA (2 ng chl-a/nM ) even though the actual chl.a change was much larger 220 ng chl.a L−1 vs. 1 ng chl.a L−1. These two samples had much higher trace metals added compared with the Z and ZN treatments (Table 3). It is also noted that the unpolluted Saharan dust addition to the main mesocosm experiment (see Herut et al., submitted; Tsagaraki et al., in preparation—both in this issue for more details) had a ratio of 22 ng chl.a L−1/nM compared with a ratio of 9.7 ng chl.a L−1/nM for the polluted aerosol addition (Table 4).
One of the characteristics of aerosols from polluted air masses is that they contain higher amounts of potentially bioavailable trace metals. These are derived both from anthropogenic sources and from trace metals being mobilized by atmospheric acids (e.g., Herut et al., 2001; Wuttig et al., 2013; Shi et al., 2015). Our “polluted” analog aerosols in this experiment (ZA and ZNA) had contained much higher amounts of labile trace metals particularly Al, Fe, and Mn compared with non-acidified samples (Table 3). This is similar to the previous results of Spokes and Jickells (1995) who showed that these metals are particularly soluble at the low pH observed in clouds.
Previous studies have shown that phytoplankton activity is inhibited by the addition of trace metals from dust (Paytan et al., 2009; Jordi et al., 2012). In this experiment, Al was the element added in the largest amount (750 nM) and which remained in solution to the highest concentration (~250 nM). Al is a major element in almost all aerosols and is likely to dissolve under the low pH conditions generated in the atmosphere, especially when somewhat polluted cloud droplets evaporate into wet aerosols (Shi et al., 2015). Although Al has been recognized as a phytoplankton toxin, it has mainly been studied in freshwater systems (Gensemer and Playle, 1999); it does not seem to have been considered as potentially toxic in marine systems possibly because the typical concentration of dissolved Al in seawater is relatively low (Hydes, 1983). However, it is likely that when atmospherically supplied dissolved Al reaches seawater, it will first precipitate as nanoparticles in a similar way to dissolved Fe. Recent studies have shown that such Al nanoparticles are more toxic to microalgae than simple dissolved Al (Sadiq et al., 2011). Although Paytan et al. (2009) suggested that Cu is the element most likely to cause phytoplankton inhibition, they mentioned the possibility that Al (or other trace metals) might be a contributory element to phytoplankton toxicity by dust addition. All of the changes in Cu concentration in this study were within sampling and analytical error and thus it is unlikely that Cu toxicity was important in this study. Similarly, it is considered unlikely that Mn or Fe, the two other elements that were leached in large amounts with acidified PM10, caused major phytoplankton inhibition because Mn is generally not considered a plant toxin and Fe is an essential micronutrient.
In addition to inhibiting total chl.a, primary and bacterial activity, the acid treatments also resulted in a smaller increase in Synechococcus biomass compared with both the control and the non-acidified PM10 additions (Figure 5). Paytan et al. (2009) also found that the abundance of Synechococcus was greater in the controls and in European aerosol treatment which had lower trace metal content added compared with their Saharan dust treatment which had increased trace metal supply. It is therefore considered likely that acid mobilization of toxic trace metals in dust particles may have disrupted Synechococcus metabolism.
Conclusions
Overall, the primary control of phytoplankton biomass and productivity was controlled by the amount of limiting nutrient added. When the amount of P was increased by a factor of ~40 as a result of simulated atmospheric acidic processes (suggested by Nenes et al., 2011) converting solid P minerals into labile phosphate, and N limitation was relieved, there was a considerable increase in the phytoplankton growth. Recent results have suggested that atmospheric control is more complex than previously thought and depends on the amount of hydrogen ions present in the water film around aerosol particles and on whether the particles are internally or externally mixed (Stockdale et al., 2015). Here, it was shown that there was also an inhibitory effect of acid treatment on phytoplankton biomass, primary, and bacterial activity (though not bacterial biomass). Our results indicate that this inhibition was caused by the trace metals mobilized by the similar acid processes to those, which caused the P minerals to dissolve. Here, we suggest that Al, and not Cu (Paytan et al., 2009; Jordi et al., 2012), may be a key element in this inhibition, possibly in the form of nanoparticles.
Our acid treatments were designed as analogs for acidic atmospheric processes, particularly where polluted air masses interact with Saharan Dust. Such air masses have higher NOx/SOx, which will increase the amount of LIP formed but will also increase the amount of dissolved trace metals. In addition, such air masses are likely to contain aerosol particles which themselves have high original labile trace metals. The results presented here suggest that although overall acid processes in the atmosphere will increase the amount of labile P added to the photic zone and subsequently the phytoplankton biomass and PP, this is likely to be moderated by increased input of toxic trace metals. Further, research is required to understand and predict the overall balance of effects of these two conflicting processes on the microbial ecosystem.
Author Contributions
Planning of the original experimental design and carrying out of experiment and sampling in the field (MK and ZS). Leaching rate of nutrients from dust (MK and AS). Chlorophyll a concentration (NP). Primary production (AL, SP). Synochocococcus abundance and biomass (AT). Bacterial abundance, biomass and rate (AT, AG). Alkaline phosphatase activity (ER, IB, and BH). Trace metals (ES, MS). Organizing the data sets and calculating simple statistics (ER). Organizing the operation of microcosms and obtaining funding (PP, TT). Writing up manuscript (MK, ZS, AS, PP, IB, ER).
Conflict of Interest Statement
The authors declare that the research was conducted in the absence of any commercial or financial relationships that could be construed as a potential conflict of interest.
Acknowledgments
This work was financed by the European Union Seventh Framework Program (FP7/2007–2013) under grant agreement no. 228224, “MESOAQUA: Network of leading MESOcosm facilities to advance the studies of future AQUAtic ecosystems from the Arctic to the Mediterranean” through grants to MK, ZS, IB, BH, and ER. The authors wish to thank G. Piperakis for his inspired technical assistance, A. Konstantinopoulou for assistance with bacterial production analyses, D. Podaras, and S. Diliberto for assistance during the experiment and N. Sekeris for his help with constructions and ideas on technical solutions. The captain and the crew of the R/V Philia are also thanked for their assistance during the transportation of water from the sea to the CRETACOSMOS facility. Funding was also provided by Leverhulme Trust entitled “Understanding the delivery of phosphorus nutrient to the oceans” Grant Number RPG 406. MDK would like to acknowledge the input from Yasmin Spain, Hannah deFrond and Emily Buckley who did their senior projects at Leeds University and whose input helped me clarify my thoughts on these experiments. Funding allowing the participation of ER, IB, and BH was also provided by the Israel Science Foundation grants (996/08) to IB, BH and ZS by NERC (NE/I021616/1).
Supplementary Material
The Supplementary Material for this article can be found online at: https://www.frontiersin.org/article/10.3389/fmars.2016.00133
Figure S1. (A,B) Phosphate leached from dust collected after two different dust storms in Rosh Pina, Israel into seawater. RPA was sampled in April 2014 and RPS was in September 2015. Note, the difference Y-axis.
Figure S2. (A,B) Nitrate leached from dust collected after two different dust storms in Rosh Pina, Israel into seawater. RPA was sampled in April 2014 and RPS was in September 2015. Note, that the Nitrate concentration remained essentially constant after 30 min leaching. Note the difference Y-axis.
Table S1. Ammonia and nitrate leached from 3 PM10 dust samples (PM10_1, PM10_2, PM10_3). Results are shown in nM N mg dust−1.
Table S2. Table showing the values of all the biological parameters used in this study as well as the calculated average values and standard deviations.
Table S3. Summary of the statistical comparison (one-way ANOVA followed by Tukey's post-hoc test) between the different treatments (C, Z, ZN, and ZNA) at the conclusion of the microcosm experiment (2 days). Significant differences are in bold (P < 0.05).
References
Atlas, E., and Pytkowicz, R. M. (1977). Solubility behaviour of apatites in sea water. Limnol. Oceanogr. 22, 290–300. doi: 10.4319/lo.1977.22.2.0290
Carbo, P., Krom, M. D., Homoky, W. B., Benning, L. G., and Herut, B. (2005). Impact of atmospheric deposition on N and P geochemistry in the southeastern Levantine basin. Deep Sea Res. II Top. Stud. Oceanogr. 52, 3041–3053. doi: 10.1016/j.dsr2.2005.08.014
Eijsink, L. M., Krom, M. D., and Herut, B. (2000). Speciation and burial flux of phosphorus in surface sediments of the Eastern Mediterranean. Am. J. Sci. 300, 483–503. doi: 10.2475/ajs.300.6.483
Gensemer, R. W., and Playle, R. C. (1999). The bioavailability and toxicity of aluminum in aquatic environments. Crit. Rev. Environ. Sci. Technol. 29, 315–450. doi: 10.1080/10643389991259245
Guerzoni, S., Chester, R., Dulac, F., Herut, B., Loýe-Pilot, M.-D., Measures, C., et al. (1999). The role of atmospheric deposition in the biogeochemistry of the Mediterranean Sea. Prog. Oceanogr. 44, 147–190. doi: 10.1016/S0079-6611(99)00024-5
Guieu, C., Aumont, O., Paytan, A., Bopp, L., Law, C. S., Mahowald, N., et al. (2014). The significance of the episodic nature of atmospheric deposition to low nutrient low chlorophyll regions. Glob. Biogeochem. Cycles 28, 1179–1198. doi: 10.1002/2014GB004852
Guieu, C., Dulac, F., Desboeufs, K., Wagener, T., Pulido-Villena, E., Grisoni, J. M., et al. (2010). Large clean mesocosms and simulated dust deposition: a new methodology to investigate responses of marine oligotrophic ecosystems to atmospheric inputs. Biogeosciences 7, 2765–2784. doi: 10.5194/bg-7-2765-2010
Herut, B., Almogi-Labin, A., Jannink, N., and Gertman, I. (2000). The seasonal dynamics of nutrient and chlorophyll a concentrations on the SE Mediterranean shelf-slope. Oceanol. Acta 23, 771–782. doi: 10.1016/S0399-1784(00)01118-X
Herut, B., Kress, N., and Tibor, G. (2002). The use of hyper-spectral remote sensing in compliance monitoring of water quality (phytoplankton and suspended particles) at “hot spot” areas (Mediterranean coast of Israel). Fresenius Environ. Bull. 11, 782–787.
Herut, B., Krom, M. D., Pan, G., and Mortimer, R. (1999). Atmospheric input of nitrogen and phosphorus to the Southeast Mediterranean: sources, fluxes, and possible impact. Limnol. Oceanogr. 44, 1683–1692. doi: 10.4319/lo.1999.44.7.1683
Herut, B., Nimmo, M., Medway, A., Chester, R., and Krom, M. D. (2001). Dry atmospheric inputs of trace metals at the Mediterranean coast of Israel (SE Mediterranean): sources and fluxes. Atmos. Environ. 35, 803–813. doi: 10.1016/S1352-2310(00)00216-8
Herut, B., Zohary, T., Krom, M. D., Mantoura, R. F. C., Pitta, P., Psarra, S., et al. (2005). Response of East Mediterranean surface water to Saharan dust: on-board microcosm experiment and field observations. Deep Sea Res. II Top. Stud. Oceanogr. 52, 3024–3040. doi: 10.1016/j.dsr2.2005.09.003
Hydes, D. (1983). Distribution of aluminium in waters of the North East Atlantic 25 N to 35 N. Geochim. Cosmochim. Acta 47, 967–973. doi: 10.1016/0016-7037(83)90164-3
Ignatiades, L., Gotsis-Skretas, O., Pagou, K., and Krasakopoulou, E. (2009). Diversification of phytoplankton community structure and related parameters along a large-scale longitudinal east-west transect of the Mediterranean Sea. J. Plankton Res. 31, 411–428. doi: 10.1093/plankt/fbn124
Jordi, A., Basterretxea, G., Tovar-Sαnchez, A., Alastuey, A., and Querol, X. (2012). Copper aerosols inhibit phytoplankton growth in the Mediterranean Sea. Proc. Natl. Acad. Sci. U.S.A. 109, 21246–21249. doi: 10.1073/pnas.1207567110
Kana, T., and Glibert, P. M. (1987). Effect of irradiances up to 2000 μE m-2 s-1 on marine Synechococcus WH 7803-I. Growth pigmentation and cell composition. Deep Sea Res. I 34, 479–516. doi: 10.1016/0198-0149(87)90001-X
Kingston, H. M., Barnes, I. L., Brady, T. J., Rains, T. C., and Champ, M. A. (1978). Separation of eight transition elements from alkali and alkaline earth elements in estuarine and seawater with chelating resin and their determination by graphite furnace atomic absorption spectrometry. Anal. Chem. 50, 2064–2070. doi: 10.1021/ac50036a031
Kirchman, D. L. (1993). “Leucine incorporation as a measure of biomass production by heterotrophic bacteria,” in Handbook of Methods in Aquatic Microbial Ecology, eds P. F. Kemp, B. F. Sherr, E. B. Sherr, and J. J. Cole (Boca Raton, FL: Lewis Publishers), 509–512.
Kress, N., Thingstad, F., Pitta, P., Psarra, S., Tanaka, T., Zohary, T., et al. (2005). Effect of P and N addition to oligotrophic Eastern Mediterranean waters influenced by near-shore waters: a microcosm experiment. Deep Sea Res. II Top. Stud. Oceanogr. 52, 3054–3073. doi: 10.1016/j.dsr2.2005.08.013
Krom, M. D., Herut, B., and Mantoura, R. F. C. (2004). Nutrient budget for the Eastern Mediterranean: implications for phosphorus limitation. Limnol. Oceanogr. 49, 1582–1592. doi: 10.4319/lo.2004.49.5.1582
Krom, M. D., Kress, N., Brenner, S., and Gordon, L. I. (1991). Phosphorus limitation of primary productivity in the eastern Mediterranean Sea. Limnol. Oceanogr. 36, 424–432. doi: 10.4319/lo.1991.36.3.0424
Krom, M. D., Thingstad, T. F., Brenner, S., Carbo, P., Drakopoulos, P., Fileman, T. W., et al. (2005). Summary and overview of the CYCLOPS P addition Lagrangian experiment in the Eastern Mediterranean. Deep Sea Res. II Top. Stud. Oceanogr. 52, 3090–3108. doi: 10.1016/j.dsr2.2005.08.018
Lafon, S., Sokolik, I. N., Rajot, J. L., Caquincau, S., and Gaudichet, A. (2006). Characterization of iron oxides in mineral dust aerosols: implications for light absorption. J. Geophys. Res. Atmos. 111, 1–19. doi: 10.1029/2005jd007016
Lee, S., and Fuhrman, J. A. (1987). Relationships between biovolume and biomass of naturally derived marine bacterioplankton. Appl. Environ. Microbiol. 53, 1298–1303.
Luna, G. M., Bianchelli, S., Decembrini, F., De Domenico, E., Danovaro, R., and Dell'Anno A. (2012). The dark portion of the Mediterranean Sea is a bioreactor of organic matter cycling. Glob. Biogeochem. Cycles 26:GB2017. doi: 10.1029/2011GB004168
Mackey, K. R. M., Roberts, K., Lomas, M. W., Saito, M. A., Post, A. F., and Paytan, A. (2012). Enhanced solubility and ecological impact of atmospheric phosphorus deposition upon extended seawater exposure. Environ. Sci. Technol. 46, 10438–10446. doi: 10.1021/es3007996
Mahowald, N., Jickells, T. D., Baker, A. R., Artaxo, P., Benitez-Nelson, C. R., Bertgametti, G., et al. (2008). Global distribution of atmospheric phosphorus sources, concentrations and deposition rates, and anthropogenic impacts. Glob. Biogeochem. Cycles 22, GB24026. doi: 10.1029/2008GB003240
Mahowald, N. M., Baker, A. R., Bergametti, G., Brooks, N., Duce, R. A., Jickells, T. D., et al. (2005). Atmospheric global dust cycle and iron inputs to the ocean. Glob. Biogeochem. Cycles 19, GB4025. doi: 10.1029/2004GB002402
Marie, D., Brussaard, C. P. D., Thyrhaug, R., Bratbak, G., and Vaulot, D. (1999). Enumerating of marine viruses in culture and natural samples by flow cytometry. Appl. Environ. Microbiol. 65, 45–52.
Markaki, Z., Oikonomou, K., Kocak, M., Kouvarakis, G., Chaniotaki, A., Kubilay, N., et al. (2003). Atmospheric deposition of inorganic phosphorus in the Levatine Basin, eastern Mediterranean: spatial and temporal variability and its role in seawater productivity. Limnol. Oceanogr. 48, 1557–1568. doi: 10.4319/lo.2003.48.4.1557
Meskhidze, N., Chameides, W. L., Nenes, A., and Chen, G. (2003). Iron mobilization in mineral dust: can anthropogenic SO2 emissions affect ocean productivity? Geophys. Res. Lett. 30:2085. doi: 10.1029/2003GL018035
Migon, C., Sandroni, V., and Béthoux, J. P. (2001). Atmospheric input of anthropogenic phosphorus to the northwest Mediterranean under oligotrophic conditions. Mar. Environ. Res. 52, 413–426. doi: 10.1016/S0141-1136(01)00095-2
Nenes, A., Krom, M. D., Mihalopoulos, N., Van Cappellen, P., Shi, Z., Bougiatioti, A., et al. (2011). Atmospheric acidification of mineral aerosols: a source of bioavailable phosphorus for the oceans. Atmos. Chem. Phys. 11, 6265–6272. doi: 10.5194/acp-11-6265-2011
Paytan, A., Mackey, K. R. M., Chen, Y., Lima, I. D., Doney, S. C., Mahowald, N., et al. (2009). Toxicity of atmospheric aerosols on marine phytoplankton. Proc. Natl. Acad. Sci. U.S.A. 106, 4601–4605. doi: 10.1073/pnas.0811486106
Pitta, P., Nejstgaard, J. C., Tsagaraki, T. M., Zervoudaki, S., Egge, J. K., Frangoulis, C., et al. (2016). Confirming the “Rapid phosphorus transfer from microorganisms to mesozooplankton in the Eastern Mediterranean Sea” scenario through a mesocosm experiment. J. Plankton Res. 38, 502–521. doi: 10.1093/plankt/fbw010
Pitta, P., Stambler, N., and Tanaka, T. (2005). Biological response to P addition in the Eastern Mediterranean Sea. The microbial race against time. Deep Sea Res. II Top. Stud. Oceanogr. 52, 2961–2974. doi: 10.1016/j.dsr2.2005.08.012
Psarra, P., Tselepides, A., and Ignatiades, L. (2000). Primary productivity in the oligotrophic Cretan Sea (NE Mediterranean) seasonal and interannual variability. Prog. Oceanogr. 46, 187–204. doi: 10.1016/S0079-6611(00)00018-5
Psarra, S., Zohary, T., Krom, M. D., Mantoura, R. F. C., Polychronaki, T., Stambler, N., et al. (2005). Phytoplankton response to a Lagrangian phosphate addition in the Levantine Sea (Eastern Mediterranean). Deep Sea Res. II 52, 2944–2960. doi: 10.1016/j.dsr2.2005.08.015
Rahav, E., Giannetto, M. J., and Bar-Zeev, E. (2016). Contribution of mono and polysaccharides to heterotrophic N2 fixation at the eastern Mediterranean coastline. Sci. Rep. 6:27858. doi: 10.1038/srep27858
Rahav, E., Herut, B., Stambler, N., Bar-Zeev, E., Mulholland, M. R., and Berman-Frank, I. (2013). Uncoupling between dinitrogen fixation and primary productivity in the eastern Mediterranean Sea. J. Geophys. Res. Biogeosci. 118, 195–202. doi: 10.1002/jgrg.20023
Raveh, O., David, N., Rilov, G., and Rahav, E. (2015). The temporal dynamics of coastal phytoplankton and bacterioplankton in the Eastern Mediterranean Sea. PLoS ONE 10:e0140690. doi: 10.1371/journal.pone.0140690
Ridame, C., and Guieu, C. (2002). Saharan input of phosphate to the oligotrophic water of the open western Mediterranean Sea. Limnol. Oceanogr. 47, 856–869. doi: 10.4319/lo.2002.47.3.0856
Riley, J. P., and Taylor, D. (1968). Chelating resins for the concentration of trace elements from sea water and their analytical use in conjunction with atomic absorption spectrophotometry. Anal. Chim. Acta 40, 479–485. doi: 10.1016/S0003-2670(00)86764-1
Romero, E., Peters, F., Marrasé, C., Guadayol, S., Gasol, J. M., and Weinbauer, M. G. (2011). Coastal Mediterranean plankton stimulation dynamics through a dust storm event: an experimental simulation. Estuar. Coast. Shelf Sci. 93, 27–39. doi: 10.1016/j.ecss.2011.03.019
Sadiq, I. M., Pakrashi, S., Chandrasekaran, N., and Mukherjee, A. (2011). Studies on toxicity of aluminum oxide (Al2O3) nanoparticles to microalgae species: Scenedesmus sp. and Chlorella sp. J. Nanopart. Res. 13, 3287–3299. doi: 10.1007/s11051-011-0243-0
Scoullos, M. J., Sakellari, A., Giannopoulou, K., Paraskevopoulou, V., and Dassenakis, M. (2007). Dissolved and particulate trace metal levels in the Saronikos Gulf, Greece, in 2004. The impact of the primary Wastewater Treatment Plant of Psittalia. Desalination 210, 98–109. doi: 10.1016/j.desal.2006.05.036
Seinfeld, J. H., and Pandis, S. N. (2006). Atmospheric Chemistry and Physics from Air Pollution to Climate Change, 2nd Edn. New York, NY: John Wiley & sons Inc.
Shi, Z., Krom, M. D., Bonneville, S., Baker, A. R., Bristow, C., Drake, N., et al. (2011). Influence of chemical weathering and aging of iron oxides on the potential iron solubility of Saharan dust during simulated atmospheric processing. Glob. Biogeochem. Cycles 25:GB2010. doi: 10.1029/2010GB003837
Shi, Z., Krom, M. D., Bonneville, S., and Benning, L. G. (2015). Atmospheric processing outside clouds increases soluble iron in mineral dust. Environ. Sci. Technol. 49, 1472–1477. doi: 10.1021/es504623x
Singer, A., Dultz, S., and Argaman, E. (2004). Properties of the non-soluble fractions of suspended dust over the Dead Sea. Atmos. Environ. 38, 1745–1753. doi: 10.1016/j.atmosenv.2003.12.026
Siokou-Frangou, I., Christaki, U., Mazzocchi, M. G., Montresor, M., Ribera d'Alcalα, M., Vaqué, D., et al. (2010). Plankton in the open Mediterranean Sea: a review. Biogeosciences 7, 1543–1586. doi: 10.5194/bg-7-1543-2010
Smith, D. C., and Azam, F. (1992). A simple, economical method for measuring bacterial protein synthesis rates in seawater using 3H-leucine. Mar. Microb. Food Webs 6, 107–114.
Spokes, L. J., and Jickells, T. D. (1995). Factors controlling the solubility of aerosol trace metals in the atmosphere and on mixing into seawater. Aquat. Geochem. 1, 355–374. doi: 10.1007/BF00702739
Statham, P. J., and Hart, V. (2005). Dissolved iron in the Cretan Sea (eastern Mediterranean). Limnol. Oceanogr. 50, 1142–1148. doi: 10.4319/lo.2005.50.4.1142
Steeman-Nielsen, E. (1952). The use of radioactive carbon (C14) for measuring organic production in the sea. J. Cons. 18, 117–140. doi: 10.1093/icesjms/18.2.117
Stockdale, A., Krom, M. D., Mortimer, R. J. M., Benning, L. G., Carslaw, K., and Shi, Z. (2015). “Controls of acid dissolution of P in Mineral Dust during Atmospheric Processing,” in Abstract Presented at Goldschmidt Conference of the European Association of Geochemists, August 16th-21st 2015 (Prague).
Tanaka, T., Thingstad, T. F., Christaki, U., Colombet, J., Cornet-Barthaux, V., Courties, C., et al. (2011). Lack of P-limitation of phytoplankton and heterotrophic prokaryotes in surface waters of three anticyclonic eddies in the stratified Mediterranean Sea. Biogeosciences 8, 525–538. doi: 10.5194/bg-8-525-2011
Ternon, E., Guieu, C., Ridame, C., L'Helguen, S., and Catala, P. (2011). Longitudinal variability of the biogeochemical role of Mediterranean aerosols in the Mediterranean Sea. Biogeosciences 8, 1067–1080. doi: 10.5194/bg-8-1067-2011
Thingstad, T. F., Krom, M. D., Mantoura, R. F. C., Flaten, G. A. F., Groom, S., Herut, B., et al. (2005). Nature of phosphorus limitation in the ultraoligotrophic eastern Mediterranean. Science 309, 1068–1071. doi: 10.1126/science.1112632
Thingstad, T., and Mantoura, R. (2005). Titrating excess nitrogen content of phosphorous-deficient eastern Mediterranean surface water using alkaline phosphatase activity as a bio-indicator. Limnol. Oceanogr. Methods 3, 94–100. doi: 10.4319/lom.2005.3.94
Tsiola, A., Pitta, P., Fodelianakis, S., Pete, R., Magiopoulos, I., Mara, P., et al. (2016). Nutrient limitation in surface waters of the oligotrophic Eastern Mediterranean Sea: an Enrichment Microcosm Experiment. Microb. Ecol. 71, 575–588. doi: 10.1007/s00248-015-0713-5
Van Wambeke, F., Christaki, U., Giannakourou, A., Moutin, T., and Souvermezoglou, E. (2002). Longitudinal and vertical trends of bacterial limitation by phosphorus and carbon in the Mediterranean Sea. Microb. Ecol. 43, 119–133. doi: 10.1007/s00248-001-0038-4
Wuttig, K., Wagener, T., Bressac, M., Dammshäuser, A., Streu, P., Guieu, C., et al. (2013). Impacts of dust deposition on dissolved trace metal concentrations (Mn, Al and Fe) during a mesocosm experiment. Biogeosciences 10, 2583–2600. doi: 10.5194/bg-10-2583-2013
Yentsch, C. S., and Menzel, D. W. (1963). A method for the determination of phytoplankton chlorophyll and phaeophytin by fluorescence. Deep Sea Res. Oceanogr. Abstr. 10, 221–231. doi: 10.1016/0011-7471(63)90358-9
Keywords: microcosm experiment, Eastern Mediterranean, dust, atmospheric acid processes, phosphorus, nitrogen, trace metals aluminum
Citation: Krom MD, Shi Z, Stockdale A, Berman-Frank I, Giannakourou A, Herut B, Lagaria A, Papageorgiou N, Pitta P, Psarra S, Rahav E, Scoullos M, Stathopoulou E, Tsiola A and Tsagaraki TM (2016) Response of the Eastern Mediterranean Microbial Ecosystem to Dust and Dust Affected by Acid Processing in the Atmosphere. Front. Mar. Sci. 3:133. doi: 10.3389/fmars.2016.00133
Received: 07 June 2016; Accepted: 19 July 2016;
Published: 17 August 2016.
Edited by:
Javier Arístegui, University of Las Palmas de Gran Canaria, SpainReviewed by:
Elvira Pulido-Villena, Mediterranean Institute of Oceanography, FranceNazli Olgun, Istanbul Technical University, Turkey
Copyright © 2016 Krom, Shi, Stockdale, Berman-Frank, Giannakourou, Herut, Lagaria, Papageorgiou, Pitta, Psarra, Rahav, Scoullos, Stathopoulou, Tsiola and Tsagaraki. This is an open-access article distributed under the terms of the Creative Commons Attribution License (CC BY). The use, distribution or reproduction in other forums is permitted, provided the original author(s) or licensor are credited and that the original publication in this journal is cited, in accordance with accepted academic practice. No use, distribution or reproduction is permitted which does not comply with these terms.
*Correspondence: Michael D. Krom, m.d.krom@leeds.ac.uk