Zooplankton Are Not Fish: Improving Zooplankton Realism in Size-Spectrum Models Mediates Energy Transfer in Food Webs
 Ryan F. Heneghan
 Jason D. Everett
 Julia L. Blanchard4
  Anthony J. Richardson
- 1Centre for Applications in Natural Resource Mathematics, School of Mathematics and Physics, University of Queensland, Brisbane, QLD, Australia
- 2School of Biological, Earth and Environmental Sciences, University of New South Wales, Sydney, NSW, Australia
- 3Sydney Institute of Marine Science, Sydney, NSW, Australia
- 4Institute of Marine and Antarctic Studies, University of Tasmania, Hobart, TAS, Australia
- 5Ecosciences Precinct CSIRO Ocean and Atmosphere, Brisbane, QLD, Australia
The evidence for an equal distribution of biomass from bacteria to whales has led to development of size-spectrum models that represent the dynamics of the marine ecosystem using size rather than species identity. Recent advances have improved the realism of the fish component of the size-spectrum, but these often assume that small fish feed on an aggregated plankton size-spectrum, without any explicit representation of zooplankton dynamics. In these models, small zooplankton are grouped with phytoplankton as a resource for larval fish, and large zooplankton are parameterized as small fish. Here, we investigate the impact of resolving zooplankton and their feeding traits in a dynamic size-spectrum model. First, we compare a base model, where zooplankton are parameterized as smaller fish, to a model that includes zooplankton-specific feeding parameters. Second, we evaluate how the parameterization of zooplankton feeding characteristics, specifically the predator–prey mass ratio (PPMR), assimilation efficiency and feeding kernel width, affects the productivity and stability of the fish community. Finally, we compare how feeding characteristics of different zooplankton functional groups mediate increases in primary production and fishing pressure. Incorporating zooplankton-specific feeding parameters increased productivity of the fish community, but also changed the dynamics of the entire system from a stable to an oscillating steady-state. The inclusion of zooplankton feeding characteristics mediated a trade-off between the productivity and resilience of the fish community, and its stability. Fish communities with increased productivity and lower stability were supported by zooplankton with a larger PPMR and a narrower feeding kernel–specialized herbivores. In contrast, fish communities that were stable had lower productivity, and were supported by zooplankton with a lower PPMR and a wider feeding kernel—generalist carnivores. Herbivorous zooplankton communities were more efficient at mediating increases in primary production, and supported fish communities more resilient to fishing. Our results illustrate that zooplankton are not just a static food source for larger organisms, nor can they be resolved as very small fish. The unique feeding characteristics of zooplankton have enormous implications for the dynamics of marine ecosystems, and their representation is of critical importance in size-spectrum models, and end-to-end ecosystem models more broadly.
Introduction
In the 50 years since Sheldon et al. (1967) first hypothesized an equal concentration of biomass from bacteria to whales, a range of size-spectrum models have been developed to explain this remarkable consistency (Andersen et al., 2015; Guiet et al., 2016b). Size-spectrum models represent the entire marine community as a size distribution, and traditionally do not resolve species identity. Their simplicity and parsimonious parameterization makes it possible for them to be used to investigate human impacts at the community level, including fishing (e.g., Andersen and Pedersen, 2010; Jacobsen et al., 2014; Law et al., 2016), climate change (e.g., Blanchard et al., 2012; Woodworth-Jefcoats et al., 2013; Barange et al., 2014; Dueri et al., 2014), and habitat loss (Rogers et al., 2014).
The focus of these models has been on higher trophic levels—primarily fish and fishing—and in recent years there has been considerable effort in improving their parameterization (Andersen et al., 2015; Guiet et al., 2016b). For example, recent theoretical developments now allow size-spectrum models to resolve different functional groups and even species by their traits, and this has been implemented for various fish (e.g., Blanchard et al., 2014; Dueri et al., 2014; Zhang et al., 2015). The focus on fish has meant that the dynamics of the plankton-dominated lower trophic levels has been neglected in model formulations. Zooplankton, as the main consumers of phytoplankton and prey of small fish are the chief intermediaries between primary production and higher trophic levels, and thus play a critical role in marine food web dynamics (Carlotti and Poggiale, 2010; Mitra and Davis, 2010).
In current dynamic size-spectrum models, the minimum size of the dynamic consumer spectrum extends to mesozooplankton. For smaller zooplankton, there are three common representations. First, phytoplankton and small zooplankton are represented as a fixed resource spectrum (with a varying intercept and a slope held at −1), and are considered only as a food source for the smallest fish size classes (Maury et al., 2007; Blanchard et al., 2009, 2011, 2012; Law et al., 2009; Datta et al., 2010; Guiet et al., 2016a). Second, the phytoplankton and small zooplankton spectrum is determined by an external nutrient–phytoplankton–zooplankton (NPZ) model, with no predation feedback from the larger dynamic size classes (Woodworth-Jefcoats et al., 2013; Lefort et al., 2015; Le Mézo et al., 2016). Third, phytoplankton and small zooplankton are modeled as a semi-chemostat system, with a fixed carrying capacity and predation feedback from higher trophic levels (Hartvig et al., 2011; Blanchard et al., 2014; Scott et al., 2014; Zhang et al., 2015, 2016). The latter approach is the only one in which the size-spectrum of fish dynamically interacts with phytoplankton and small zooplankton. These current representations essentially group smaller zooplankton and phytoplankton together as food for the smallest dynamic size classes, and resolve larger zooplankton as small fish.
Assuming zooplankton have the same dynamics as phytoplankton or small fish is not only incorrect, but could have considerable effects on energy transfer in food webs. Zooplankton have feeding characteristics distinctly different from fish. For instance, the average predator–prey mass ratio (PPMR; in grams of wet weight) for fish is typically around 100 (Jennings et al., 2001) but for zooplankton it is >1000 (Kiørboe, 2008; Wirtz, 2012). Additionally, zooplankton exhibit vast phylogenetic biodiversity, with at least eight phyla commonly present (crustaceans, chordates, chaetognaths, molluscs, cnidarians, echinoderms, ctenophores, and annelids), each with considerable differences in their feeding ecology, from passive suspension grazing of the water column to active ambushing and carnivory (Kiørboe, 2011). Further complicating their feeding, various species of jellyfish, copepods, and microzooplankton can switch between suspension and ambush feeding modes, and this is reflected in different optimal prey sizes realized by the same species (Landry, 1981; Goldman and Dennett, 1990; Saiz and Kiørboe, 1995).
Size-based predation is the key driver of dynamics in size-based ecosystems (Jennings et al., 2001; Woodward et al., 2005; Andersen et al., 2016) and is broadly defined by five key parameters: (1) PPMR; (2) search rate coefficient; (3) body-size exponent, which determines how the search rate scales with body-size; (4) assimilation efficiency; and (5) the width of the feeding kernel (the diet breadth around the preferred PPMR), and modeling studies of the size-spectra of fish have shown that these parameters have a large effect on food web dynamics (Law et al., 2009; Datta et al., 2011; Zhang et al., 2013). For instance, a wider feeding kernel and lower PPMR dampens traveling waves through the fish community size-spectrum (Blanchard, 2008; Law et al., 2009; Zhang et al., 2013). Further, there is evidence that higher assimilation efficiency has a similar effect on the steady state of the size-spectrum (Datta et al., 2011). The sensitivity of ecosystem dynamics to parameterization of fish feeding characteristics strongly suggests that zooplankton feeding characteristics could be important to energy transfer through the food web. Therefore, the first step toward including zooplankton in end-to-end size-spectrum models is to include an accurate representation of their feeding characteristics.
The extensive experimental work elucidating zooplankton feeding characteristics has formed the basis of several recent syntheses of size-based feeding (Fuchs and Franks, 2010; Kiørboe, 2011; Wirtz, 2012, 2014) and provides an opportunity for improving zooplankton parameterization in size-spectrum models. Wirtz (2012) used the data collected by Hansen et al. (1994) and Fuchs and Franks (2010) to develop a mechanistic model that links zooplankton PPMR with their feeding characteristics. In another paper, Wirtz (2014) derived an ideal feeding kernel width for zooplankton from simple biomechanical laws, which agrees well with empirical data. Fuchs and Franks (2010) synthesized data from previous studies to investigate the relationship between zooplankton PPMR and the width of the feeding kernel. They found that the feeding kernel width decreased with decreasing PPMR, suggesting increasing selectivity amongst individuals who prey on individuals closer to their own size. Kiørboe (2011) found that the size-specific zooplankton search rate is independent of body size across seven different functional groups.
Here, we evaluate how the size-dependent feeding characteristics of zooplankton affect the dynamics of higher trophic levels in size-structured pelagic ecosystems. We extract feeding characteristics from a range of syntheses of size-based feeding (Fuchs and Franks, 2010; Kiørboe, 2011, 2013; Wirtz, 2012, 2014) and implement them in a dynamic size-spectrum model framework (Datta et al., 2010; Andersen et al., 2015; Guiet et al., 2016b). To our knowledge this is the first dynamic size-spectra model to resolve predation-based growth and mortality of zooplankton. The model has three components—a static phytoplankton resource spectrum and two dynamic spectra representing a general zooplankton and fish community, respectively. In our model, biomass flows from smaller to larger size classes as a consequence of larger organisms consuming smaller organisms, and growth at one size is balanced by mortality in smaller size classes. We separate our findings in three parts. In Zooplankton Are Not Fish, we provide a size-spectrum model using the best parameter estimates from the literature, and establish the individual effect each of the five key zooplankton feeding parameters has on the community size-spectrum, by comparing against a base model where zooplankton are parameterized as just another fish community. In Sensitivity Analysis, we assess how varying the feeding characteristics of the zooplankton community impact the stability and productivity of the fish community size-spectrum. Finally in Mediating Primary Production and Fishing, we evaluate how the feeding characteristics of different zooplankton functional groups—salps, chaetognaths, herbivorous copepods, flagellates, and carnivorous copepods—mediate changes in phytoplankton abundance and increased fishing mortality on the fish community size spectrum. The purpose of this study is not to give a quantitative evaluation of zooplankton or fish abundance, rather we wish to illustrate how incorporating zooplankton-specific feeding characteristics could affect the dynamics of size-structured ecosystems. Our ultimate aim is to investigate how zooplankton feeding characteristics influence energy transfer from phytoplankton and fish, and thus move toward a more realistic and consistent parameterization for the zooplankton component of size-spectrum models.
Methods
The Model
We developed a size-spectrum model that consists of a size-spectrum comprised of three communities: phytoplankton, zooplankton, and fish (Figure 1; Tables 1,2). The phytoplankton component covers the smallest size classes [wp, wz] and is held constant as a background resource spectrum for zooplankton. Size-dependent processes of growth and mortality drive the zooplankton and fish components. These two components are delineated by different size ranges and feeding characteristics. The zooplankton community covers the size range between phytoplankton and fish [], and the fish community covers the largest size classes [], although some of the smallest fish size classes extend into the zooplankton range (from wf = 0.1 g to = 1 g). Fish community size classes that extend into the zooplankton range represent larvae and very small fish that are smaller than the largest zooplankton. Predation is size-dependent, with big things eating smaller ones, so depending on their size, zooplankton can feed on phytoplankton, smaller zooplankton, and the smallest fish size classes. Similarly, fish feed on zooplankton and smaller fish. The temporal dynamics of the zooplankton and fish communities are governed by separate McKendrick–von Foerster equations with second-order diffusion terms (Datta et al., 2010),
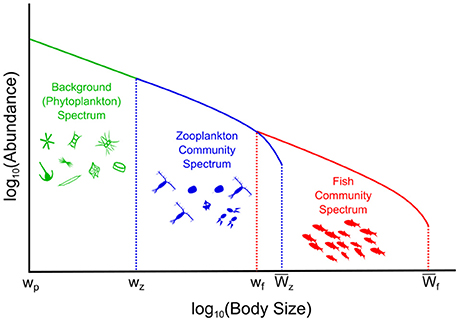
Figure 1. Conceptual illustration of the phytoplankton–zooplankton–fish system. The background (phytoplankton) spectrum is held constant, the dynamic zooplankton, and fish community spectrums are governed by Equation (1) and the Equations in Table 2.
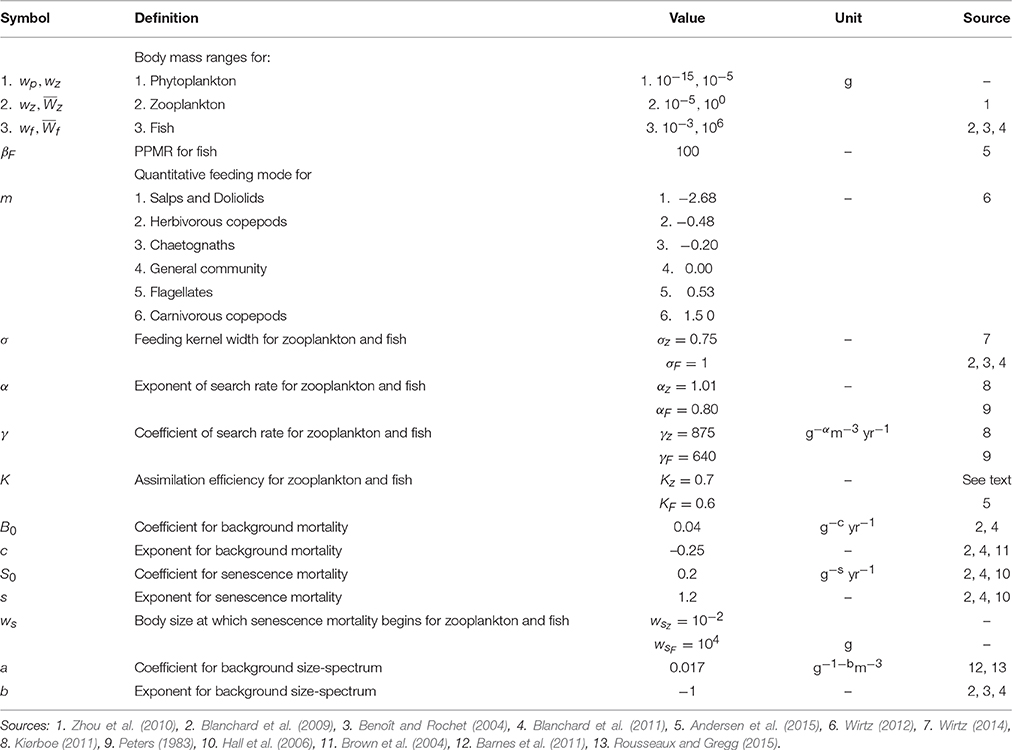
Table 1. Table of parameter values for the phytoplankton–zooplankton–fish dynamic size spectrum model.
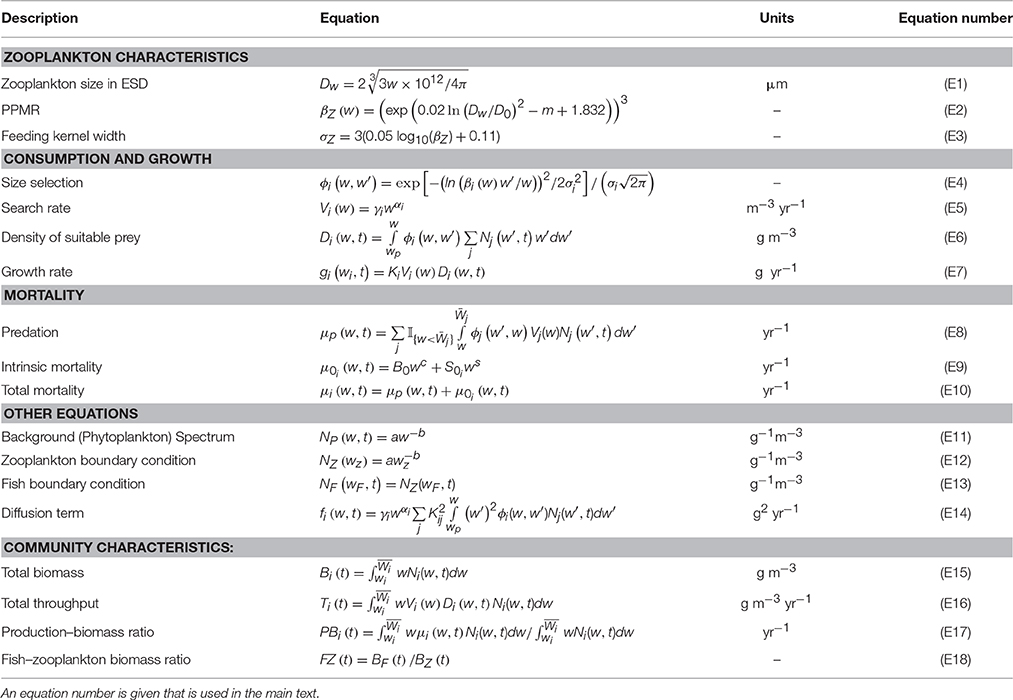
Table 2. Model equations with their units.
The density of individuals in community i (where i is either zooplankton or fish) per unit mass per unit volume (g−1m−3) is denoted by Ni(w, t). Growth, mortality, and diffusion rates of individuals of group i at size w and time t, are denoted by gi(w, t), μi(w, t), and fi(w, t), respectively. In this context, the diffusion term allows the model to incorporate demographic variation in the growth rates of each community. That is, within each community two individuals of the same weight eating the same food will not grow by the same amount (Datta et al., 2010). This not only increases model realism, but the stability of the system steady state, over the traditional first-order McKendrick–von Foerster equation (Datta et al., 2011).
Phytoplankton dynamics in the background resource spectrum are not explicitly modeled, with the density of individuals held constant through time:
Equations are also found in Table 2. We use an exponent of −1 for the background spectrum, implying equal biomass over logarithmically equal body–mass intervals in keeping with past dynamic size-spectrum models Benoît and Rochet, 2004; Law et al., 2009, 2016; Blanchard et al., 2012). The coefficient a for the background spectrum (Equation 11) was calculated using the empirical equation from Barnes et al. (2011) and annual median chlorophyll-a concentrations for different ocean basins between 2005 and 2010 (Rousseaux and Gregg, 2015). Unless specified otherwise, we use the global median chlorophyll-a value (0.16 mg m−3) to give a value of 0.017 for a.
From the predator's perspective, total consumption depends on the total biomass of suitable prey. For an individual of size w at time t from community i, this is determined by the predator's search rate:
and the density of suitable prey:
The growth rate of an individual of size w at time t is fuelled by consumption of prey from smaller size classes:
where Ki is the assimilation efficiency of community i.
Kiørboe (2011) found that the search rate (Equation 5) for zooplankton, across a wide range of taxa is largely independent of organism size (αZ = 1.01). This stands in contrast to the scaling for fish (αF = 0.8; Peters, 1983) that implies the specific search-rate per unit mass declines with increasing body size. Further, the search rate coefficient is higher for zooplankton (Kiørboe, 2011), compared to fish (Peters, 1983). The probability that a predator of size w will consume an individual of size w′ is given by the log-normal function (Equation 4), where βi and σi are community i 's PPMR and feeding kernel width.
In previous size-spectrum models the PPMR is held constant across the entire size range of the community (Andersen et al., 2015). For zooplankton, the wide variation in observed PPMR across phyla suggests a constant value across all zooplankton size classes is inappropriate (Wirtz, 2012). We have thus used the mechanistic formulation from Wirtz (2012) who argues that for zooplankton, PPMR will increase non-linearly as predator size increases, due to the non-isometric scaling of feeding-related apparatus with body size (Figure 2):
where Dw is the predator equivalent spherical diameter (ESD) in μm:
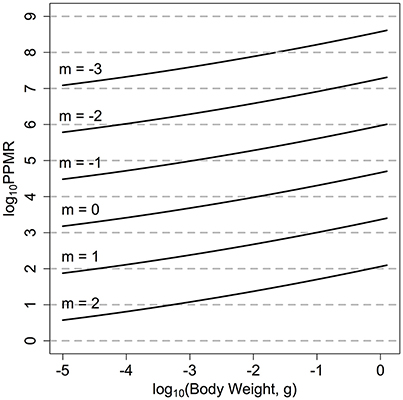
Figure 2. log10PPMR for the range of quantitative feeding modes from carnivores to herbivores. Wirtz (2012), across the zooplankton size classes. The solid lines indicate the realized log10PPMR for different feeding modes, across the size range of the zooplankton community.
The mechanistic model from Wirtz (2012) also allows the range of feeding modes across different zooplankton functional groups to be quantitatively incorporated. The feeding mode of the zooplankton community is denoted by m, and ranges from −3 to 2. A larger, positive m-value (say m = 2) suggests a more raptorial, carnivorous feeding strategy with a lower PPMR (Figure 1). Alternatively, a negative m-value (say m = −3) implies a more passive, herbivorous feeding strategy. For the fish community, we set βF = 100 (Andersen et al., 2015).
A wider feeding kernel means an individual feeds over a wider range of size classes, implying a more generalist feeding strategy. Wirtz (2014) obtained a general feeding kernel width for zooplankton of 0.75 log10 grams body-size from simple biomechanical laws, and found this value agreed well with measured values from different species. Fuchs and Franks derived an empirical equation that links zooplankton PPMR βZ with the feeding kernel width:
This equation suggests a positive relationship between the width of the feeding kernel and the PPMR. In other words, more active, carnivorous groups (m > 0), have a narrower, more selective prey size range compared to passive, filter feeding groups (m < 0) that have a wider, more generalist prey size range. For the fish community, we set σF = 1 (Andersen et al., 2015).
For individuals in community i, a fraction Ki of consumed biomass, the assimilation efficiency, is assimilated into new biomass. Observational and experimental work across different zooplankton functional groups show that assimilation efficiency of ingested food into new biomass ranges from 0.3 to 0.9 (Landry et al., 1984; Kiørboe, 2008; Montagnes and Fenton, 2012; Abe et al., 2013). Assimilation efficiency of copepods (Landry et al., 1984), dinoflagellates and larval fish (Kiørboe, 2008) depends on whether they were acclimated to low or high food environments; those from low food environments have a higher assimilation efficiency compared to those from high food environments. Similarly, the density and type or prey available had a significant effect on zooplankton assimilation efficiency—higher density and higher carbon content of prey gave lower assimilation efficiencies (Montagnes and Fenton, 2012; Abe et al., 2013). In previous models, assimilation efficiency for zooplankton is usually held constant at 0.70 (e.g., Zhou, 2006; Fuchs and Franks, 2010; Ward et al., 2012, 2014). Unless specified otherwise, we keep KZ = 0.7 to follow previous size-based plankton-focused models (Baird and Suthers, 2006; Zhou, 2006; Stock et al., 2008; Fuchs and Franks, 2010; Banas, 2011). For the fish community, we set KF = 0.6, as this is a common values given in previous dynamic size-spectrum models (Andersen et al., 2015).
From the prey's perspective, the total predation pressure from all larger size classes gives the predation mortality rate:
To account for other sources of mortality (e.g., disease), we include a U-shaped intrinsic mortality term:
that covers non-predation sources of mortality such as disease and senescence (Brown et al., 2004; Hall et al., 2006; Blanchard et al., 2009, 2011). Since individuals grow through time, the background mortality term describes rapidly decreasing background mortality in the early stages of life, a constant mortality for middle-age individuals, and an increasing mortality with senescence. The increase in senescence mortality with body size acts as a closure term for the largest size classes, by preventing a buildup of very large individuals (Andersen et al., 2015).
Community Characteristics
To evaluate effects of feeding characteristics of the zooplankton community on the fish community, we calculated several community-level measures. The total biomass of community i was obtained by integrating the abundance in all size classes:
Similar to Blanchard et al. (2011), we defined the total throughput of community i as the total consumption rate:
The production to biomass ratio of a community i —where production was defined as the total flux out of the community from all sources of mortality (Brown et al., 2004)—was used to evaluate the total energy flux through a community:
Total throughput is a measure of how energy moves internally through the system from predation processes, whereas the production to biomass ratio is an indicator of how much new biomass is produced to replace biomass lost to mortality, per unit of existing biomass. To evaluate the transfer efficiency from zooplankton to the fish community, we calculate the ratio of total fish biomass to total zooplankton biomass:
This is similar to the approach taken in previous studies evaluating the transfer efficiency of phytoplankton to zooplankton (Friedland et al., 2012; Havens and Beaver, 2013).
We use two measures to evaluate the stability and total variability of the system. First, the nature of the system steady state was determined using the Newton–Raphson multidimensional root-finding method (Press et al., 2007). For each configuration of zooplankton feeding characteristics in this study, the abundance of the zooplankton and fish communities was taken after 20 years. The stability of this abundance was determined by the maximum real part (λmax) of the eigenvalues of the Jacobian matrix calculated with the Newton–Raphson method. If λmax < 0, the entire system will settle into a stable equilibrium over time where the abundance in each size-class does not fluctuate. The more negative λmax is, the faster the system will recover from local perturbations to the steady state. Alternatively, if λmax > 0, over time the system will settle into a repeating, periodic traveling wave of abundance from smaller to larger size-classes. In this case, the more positive λmax is, the faster the traveling wave moves through the size classes. Second, we measured the total variability of the system by calculating the coefficient of variation (CV) of the time-series of biomass over the last 10 years of the simulation. The Newton–Raphson stability analysis and the CV work together; the first will identify if the steady state is stable or oscillating, and the CV gives a measure of the magnitude of these oscillations through time.
Numerical Implementation
Dynamics of the zooplankton and fish communities are modeled with Equation (1), which we solve numerically using a second-order semi-implicit upwind finite difference scheme (Press et al., 2007). We present the results in log10 space for ease of interpretation, mathematical convenience and comparison with previous work. For the numerical implementation we discretize the dynamic size range [10−5, 106] into equal 0.1 log10 size intervals (on a log10 gram scale), and use a daily-time step for the time interval. We chose these values to discretize the time and weight ranges to ensure convergence in our numerical implementation without requiring unnecessary computational effort, in keeping with past studies (Press et al., 2007; Plank and Law, 2012; Zhang et al., 2013; Law et al., 2016). For simplicity we are not explicitly modeling reproduction, thus the abundances of the smallest size classes in the zooplankton and fish communities are held constant. This implies that we are assuming constant recruitment for zooplankton and fish (Law et al., 2009; Blanchard et al., 2012). The assumption of constant recruitment permits a clearer evaluation of how the feeding characteristics of the zooplankton affect the dynamics of a fish community, in keeping with previous community size-spectrum models (e.g., Benoît and Rochet, 2004; Maury et al., 2007; Law et al., 2009; Zhang et al., 2013). For the zooplankton community, the density of individuals in the smallest size class is determined from the continuation of the phytoplankton size-spectrum:
and the density of the smallest size class in the fish community is held equal to the equivalent zooplankton size class:
We ran each simulation for a 20-year period. In each simulation, our initial condition starts the zooplankton and fish community spectra as a continuation of the resource spectrum (Equation 11). If the solution was stable (λmax < 0), there would initially be some oscillations around the steady state that would diminish over time. For a stable solution, the closer λmax was to zero the greater the initial variance and the longer it took for the system to stabilize. When the solution was a traveling wave (λmax>0), the variance of the system and magnitude of the oscillations would increase over time until the steady state was achieved. In this situation, the closer λmax was to zero, the longer the system took to find the unstable steady state. In all simulations the system achieved steady state within the first 5 years, therefore we discarded the first 10 years as a burn-in period.
Zooplankton Are Not Fish
To establish the individual effect each of the five zooplankton feeding parameters has on the fish community, we begin with a base model where zooplankton are parameterized as another general fish community. From the base model, we build up to a model where the zooplankton community feeding characteristics are parameterized to represent a general, mixed zooplankton community. To do this, we use m = 0 to represent the average PPMR of a zooplankton community characterized equally by herbivorous and carnivorous feeding behavior, and set σZ = 0.75, KZ = 0.7, , and αZ = 1.01 to reflect the average feeding characteristics of zooplankton across multiple functional groups.
We change each zooplankton feeding parameter one at a time, then all together, and evaluate their individual relative impact on fish community measures against the base model, by calculating the change in the measure against the base model. For example, the relative fish biomass (rFB) for a new parameterization of the zooplankton community is obtained by dividing the fish biomass from the new model by the fish biomass from the base model.
Sensitivity Analysis
In this section, we assess how variation in the feeding characteristics of the zooplankton community affects the productivity and stability of the fish community. We focus on zooplankton feeding mode (m), feeding kernel width (σz), and assimilation efficiency (Kz), since these parameters vary across different zooplankton functional groups and environmental conditions. We vary m between −3 and 2, σZ between 0.4 and 2.2, and KZ between 0.3 and 0.9.
Mediating Primary Production and Fishing
In our final section, we assess how the feeding characteristics of different zooplankton functional groups affect the productivity and stability of the fish community, and mediate increased primary production and fishing pressure, by evaluating the effect of these changes on the average total biomass of the fish community. We use the m-values from Wirtz (2012) for five different zooplankton functional groups (salps, chaetognaths, herbivorous copepods, flagellates, and carnivorous copepods) and a general zooplankton community (Table 1). The width of the feeding kernel for each of the six groups was determined with Fuchs and Franks' (2010) empirical Equation (Equation 3), which links the average zooplankton community PPMR with the feeding kernel width. For all groups, we hold the search rate and assimilation efficiency constant (see Table 1).
We used chlorophyll-a concentrations from two ocean basins—the North Central Pacific (0.06 mg m−3) and the North Atlantic (high concentration, 0.28 mg m−3)—to give a range of coefficient values (intercept of the spectrum; a) between 0.010 and 0.024, which corresponds to a total phytoplankton abundance in the background resource spectrum of between 0.23 and 0.55 g−1m−3. To include fishing pressure, we incorporate an additive fishing mortality term with a value between 0 and 2 year−1, for all individuals in the fish community > 200 g.
Results
Zooplankton Are Not Fish
The base model (denoted as the dashed line in each of the sub-plots in Figure 3) was a stable spectrum (λmax of −0.58), with the dynamic zooplankton and fish communities essentially a continuation of the static background spectrum in the base model.
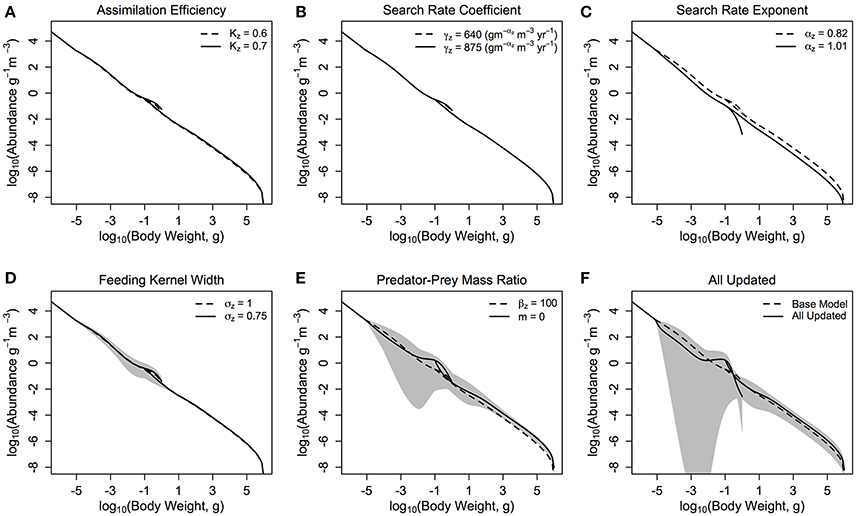
Figure 3. The zooplankton and fish community size-spectra when various parameters are updated (A–E) one at a time and (F) all together. The dashed lines in each plot represent the zooplankton and fish communities in the base model parameterization, and the solid lines denotes the average abundance of the fish and zooplankton communities over 10 years in the modified model. The shaded areas show the regions of the traveling wave solutions over 10 years if the steady state is unstable.
Individually changing the zooplankton assimilation efficiency KZ from 0.6 and 0.7 (Figure 3A) increased the total throughput and production to biomass ratio of the fish community, in comparison to the base model (Table 3), and increased resilience of the entire system to local perturbations, with λmax = −0.71. Increasing the zooplankton community search rate coefficient (γZ) from 640 to 875 () (Figure 3B), had a negligible effect on the total biomass or productivity of the fish community, compared to the based model (Table 3), however it did increase the stability of the system, with λmax = −0.76. Changing the search rate exponent for the zooplankton community (αZ; Figure 3C) from 0.82 to 1.01 reduced the total fish biomass by almost 70%, and reduced the relative production to biomass ratio (45% decrease) and relative total throughput (87% decrease), against the base model. Updating γZ decreased the resilience of the system, with λmax = −0.04, however the steady state remained a stable spectrum.
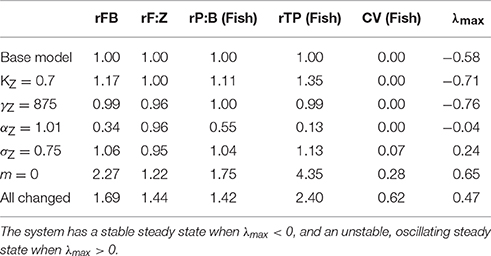
Table 3. Fish community biomass (FB), fish to zooplankton biomass ratio (F:Z), fish community production to biomass ratio (P:B), and throughput (TP) relative to the base model (r), the variation in fish community biomass (coefficient of variation; CV) and the maxmium real part of the Jacobian (λmax) when the zooplankton community feeding parameters are updated one at a time, and all-together.
Individually reducing the zooplankton feeding kernel (σZ; Figure 3D) from 1 to 0.75, and changing the PPMR (Figure 3E) of the zooplankton component increased the total biomass, throughput and production to biomass ratio of the fish community, in comparison to the base model (Table 3). Changing the PPMR of the zooplankton gave the most significant increase in relative production to biomass (75% increase) and relative total throughput (335% increase) of the fish community. Only changing the zooplankton PPMR affected the relative fish to zooplankton biomass significantly, with a 22% increase against the base model. Changing the feeding kernel width and the PPMR for the zooplankton community changed the steady state from a stable spectrum to an oscillating system. Between the two parameters, changing PPMR gave the fastest oscillations, with λmax = 0.65 compared to λmax = 0.24 for σZ. Further, the magnitude of the oscillations was larger when the zooplankton community PPMR was updated (CV = 0.28), compared to σZ (CV = 0.07, Table 3, Figures 3D,E).
When all parameters were changed for the zooplankton community (Figure 3F) there were significant increases against the base model in total fish biomass (69%), the fish to zooplankton biomass ratio (44%), and the fish community production to biomass ratio and total throughput (44 and 140%, respectively). Except for the relative fish to zooplankton biomass ratio, the increase in the total fish biomass and productivity measures were lower when all the parameters were updated, compared to just updating the zooplankton PPMR. (Table 3) The overall system was not stable (λmax = 0.47), and the magnitude of the oscillations through the system were higher than any seen in a system with a single parameter updated, with CV = 0.62. However, oscillations were slower compared to the system where only zooplankton PPMR was updated.
Sensitivity Analysis
The total biomass of the fish community increases exponentially as m decreases (Figure 4A). From m = 2 to −3 (corresponding to an average zooplankton community PPMR range of 1—7.5), total fish biomass increases over 3 orders of magnitude (0.3 g m−3 for m = 2 to 620 g m−3 for m = −3). The exponential increase in fish biomass and productivity measures with respect to zooplankton PPMR starts at around m = −0.5, which corresponds to an average zooplankton community PPMR of 4.5. Similarly, a smaller feeding kernel width (σZ)—indicating a predator that feeds on a narrower size range of prey—results in an almost exponential increase in total fish community biomass (Figure 4B). From σZ = 0.4 to 1.1, total fish biomass increases from 0.25 g m−3 to 2.9 g m−3. There is a roughly linear, positive relationship between total fish biomass and the assimilation efficiency KZ of the zooplankton community (Figure 4C). As KZ increases from 0.3 to 0.9, total fish biomass increases from 0.20 to 0.65 g m−3. Similar patterns can be seen in the relationship between zooplankton PPMR, feeding kernel width and assimilation efficiency and the fish community productivity measures (Supplementary Figure 1).
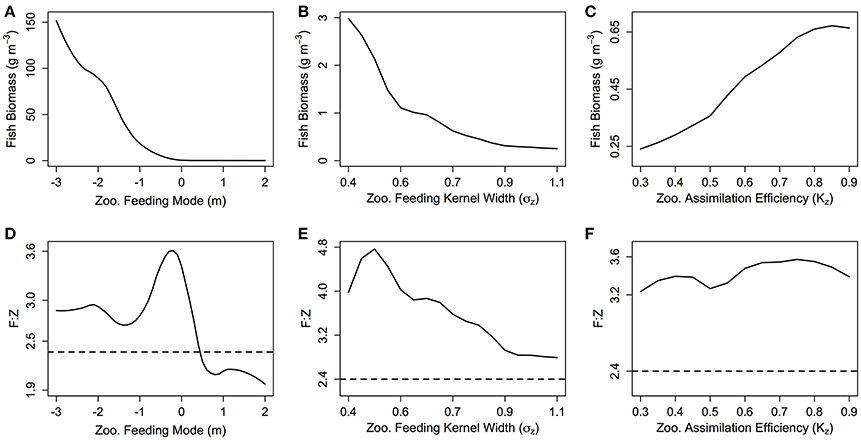
Figure 4. (A–C) The total fish community biomass (g m−3) and (D–F) the fish to zooplankton biomass ratio (F:Z) for different values of zooplankton feeding mode (m), feeding kernel width (σZ) and assimilation efficiency (Kz). In each plot, the other feeding parameters not specified are held constant at m = 0, σz = 0.75 and Kz = 0.7. The dashed line in (D–F) indicates the F:Z in the base model, where the zooplankton community are parameterized as fish.
The fish to zooplankton biomass ratio peaks at around m = 0 (3.60), and stays around 2.9 for m < −1, and decreases for m > 0.5 to settle around 2.1 (Figure 4D). For σZ, the fish to zooplankton biomass ratio peaks at σZ = 0.5 around 4.8, before uniformly declining as σZ increases (Figure 4E). There is minimal change in fish to zooplankton biomass ratio with increasing KZ, which suggests zooplankton biomass and fish biomass increase at the same rate (Figure 4F). Except for m > 0.5, the fish to zooplankton biomass ratio was higher than the base model (dashed line in Figures 4 D–F) across the ranges of m, σZ and KZ.
With σZ = 0.75, the CV is zero for m-values above 1 (Figure 5A) which corresponds to a stable steady state region (Figure 5D). The CV increases as m decreases from 0.5 to −0.5, which implies increasing variability in total fish biomass as the zooplankton community shifts from carnivorous to herbivorous feeding behavior. The CV stabilizes between 1 and 1.5 for m < 0. This suggests that even though the total fish community biomass is still exponentially increasing as m becomes more negative, the relative variation in fish biomass through time does not increase. There is a negative relationship between increasing σZ and CV, indicating increasing stability with a wider feeding kernel (Figure 5B). A similar pattern is observed in Figure 5D; the range of m-values that enable a stable system is larger, as σZ increases. The CV of the fish community varies across the range of KZ-values but within a much smaller range than the other two parameters (Figure 5C). Increasing KZ slightly increases the minimum σZ, and decreases the minimum m required for a stable steady state (Figures 5E,F).
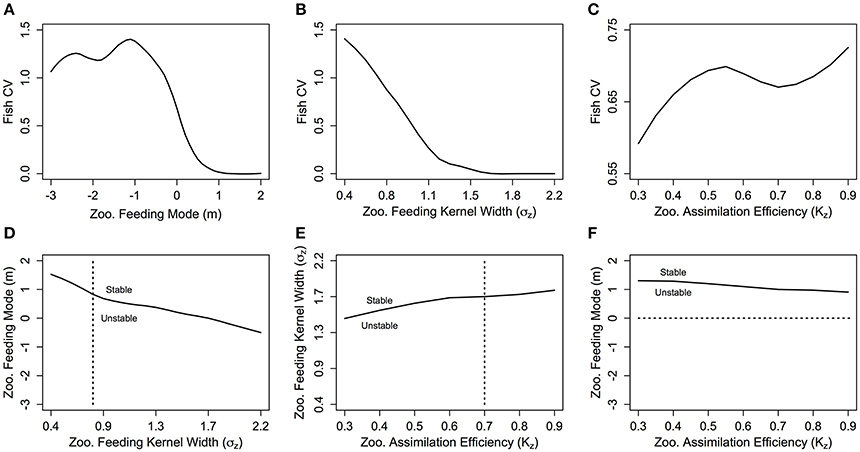
Figure 5. The fish community biomass coefficient of variation (CV) against zooplankton (A) feeding mode (m), (B) feeding kernel width (σz) and (C) assimilation efficiency (Kz), and the stability regions of (D) m against σz, (E) σz against Kz and (F) m against Kz. In (D–F) the dashed lines indicate the transect over which the CV in the plot above is taken. In each plot, the other feeding parameters not specified are held constant at m = 0, σz = 0.75 and Kz = 0.7.
Mediating Primary Production and Fishing
Our results suggest a trade-off between the stability of the overall system and the total average fish productivity and biomass for most zooplankton groups (Figure 6 and Table 4). The herbivorous salp community (m = −2.68, PPMR ≈ 7) is an exception (Figure 6A). It supports the most abundant and productive fish community, yet it is a more stable system overall than the one dominated by herbivorous copepods and chaetognaths (Figures 6B,C; Table 4). The salp community has the widest feeding kernel (σZ = 0.70), which suggests a wider feeding kernel gives a more stable system without sacrificing the productivity of the fish community.
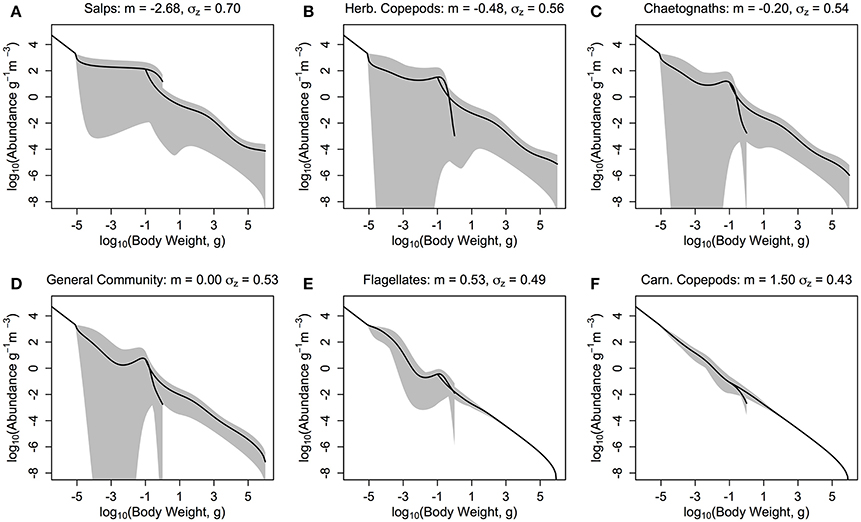
Figure 6. The zooplankton and fish community size-spectra when the zooplankton community is defined by the feeding characteristics (here, quantitative feeding mode m; Wirtz, 2012, and feeding kernel width σz; Fuchs and Franks, 2010) of a single functional group. (A) Salps (m = −2.68, σz = 0.70), (B) Herbivorous Copepods (m = −0.48, σz = 0.56), (C) Chaetognaths (m = −0.20, σz = 0.54), (D) General Community (m = 0.00, σz = 0.53), (E) Flagellates (m = 0.53, σz = 0.49), and (F) Carnivorous Copepods (m = 1.50, σz = 0.43). The solid lines denotes the average abundance slope of the zooplankton and fish communities over 10 years. The shaded areas show the regions of the travelling wave solutions over 10 years if the steady state is unstable.
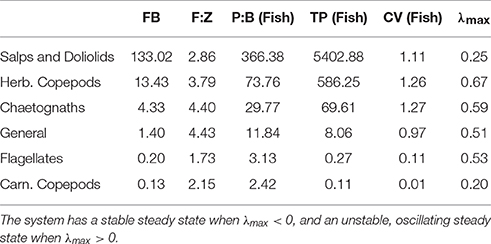
Table 4. Fish community biomass (FB), fish to zooplankton biomass ratio (F:Z), fish community production to biomass ratio (P:B) and throughput (TP), the variation in fish community biomass (coefficient of variation; CV) and the maxmium real part of the Jacobian (λmax) when the zooplankton community is defined by the feeding characteristics of different functional groups.
A lower, increasingly negative m-value results in a zooplankton community with a flatter abundance spectrum. In other words, increasing herbivory results in a higher abundance in the larger zooplankton size classes. For the fish community, a shallower zooplankton spectrum leads to a higher abundance in the smallest fish size classes. The overall average slope of the fish community spectrum is similar across the 6 plots (Figure 6). This suggests the average slope of the fish community spectrum depends more on the feeding characteristics of the fish, over the dynamics of the zooplankton community. The total average fish biomass increases with increasing phytoplankton abundance, across all six systems (Figure 7A). The magnitude of the increase in fish biomass correlated with the F:Z and CV of the system (Table 4). More fish were associated with a higher F:Z, and lower CV. The general zooplankton community system had the highest fish to zooplankton biomass ratio (4.43) and had the largest increase in total fish abundance: an 800% increase in fish. In contrast, the herbivorous copepod and chaetognath systems had similar fish to zooplankton biomass ratios to the general community (4.40 and 3.78), but higher CV's (1.26 and 1.27). These systems' fish biomass increased by 340 and 410%, respectively. The flagellate system had the lowest fish to zooplankton biomass ratio (1.73), the second lowest CV (0.11) and the lowest increase in total fish biomass (170%).
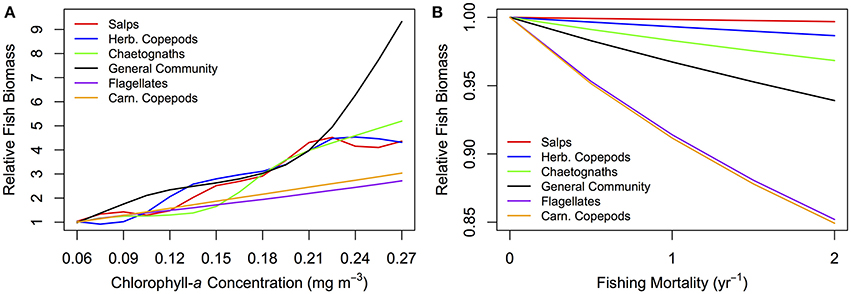
Figure 7. Relative fish biomass against (A) total phytoplankton abundance (chlorophyll-a concentration mg m−3) and (B) fishing mortality (yr−1) for fish communities supported by a zooplankton community with the feeding characteristics of different functional groups. The relative fish biomass is calculated from the total fish biomass divided by the total fish biomass at (A) the lowest phytoplankton abundance (0.06 mg m−3 chlorophyll-a) and (B) no fishing mortality (0 yr−1).
Fish communities supported by herbivorous zooplankton communities were more resilient to fishing pressure, compared to fish supported by more carnivorous zooplankton (Figure 7B). The salp system had a negligible decline in average fish biomass, and chaetognath, herbivorous copepod and general community systems declined by up to 1, 2, 5%, respectively, with increasing fishing pressure. The two systems with carnivorous zooplankton communities (flagellates and carnivorous copepods) had an almost identical relationship between total rFB and fishing pressure, with both losing up to 15% of their average unfished biomass.
Discussion
This study is the first qualitative assessment of how zooplankton feeding characteristics mediate the transfer of energy from phytoplankton to higher trophic levels with a dynamic size-spectrum model. Improving the realism of the zooplankton community with zooplankton-specific feeding parameters increased the transfer efficiency of the system and the total mean biomass of the fish community, but changed the steady state of the system from a stable linear spectrum, to a series of traveling waves of abundance from smaller to larger size classes (Table 3; Figure 3). The change in steady state came from updating the zooplankton community PPMR and feeding kernel width (σZ). The general zooplankton community had a m-value of 0, which corresponds to a log10 PPMR of between 3 and 5 across the size range of the zooplankton community, and σZ of 0.75. This is in contrast to the fish community log10 PPMR of 2, and feeding kernel width of 1. This observed change in the steady state agrees with the observed effects of increasing PPMR and decreasing σZ for fish communities (Blanchard, 2008; Law et al., 2009; Datta et al., 2011; Zhang et al., 2013).
Our results suggest a trade-off mediated by the zooplankton community, between the stability of the overall system and the total biomass and productivity of the fish community. A zooplankton community with a more generalist, carnivorous feeding strategy—defined by a lower PPMR (larger, positive m) and a wider feeding kernel—stabilized the steady state of the system (Figure 5), but the fish community was less abundant and productive (Figure 4). In contrast, a zooplankton community characterized by specialized, herbivorous behavior—defined by a higher PPMR (larger, negative m) and a narrower feeding kernel—increased the total average biomass and productivity of the fish community (Figure 4), but destabilized the system steady state (Figure 5). Herbivorous and mixed communities (m ≤ 0) with a narrower σZ had a higher ratio of fish to zooplankton biomass (Figures 4D,E), indicating a more efficient transfer of biomass from zooplankton to fish. This positive relationship between the zooplankton community PPMR and transfer efficiency corroborates with previous theoretical (Andersen et al., 2009) and empirical work (Jennings et al., 2002; Barnes et al., 2010); a higher PPMR yields a higher transfer efficiency between trophic levels, and fewer trophic levels separating phytoplankton from fish.
Zooplankton communities with a higher PPMR and narrower σZ had more variance in their abundance (Figure 5). These results suggest the abundance of zooplankton communities characterized by specialized herbivorous feeding behavior could exhibit more variation in their abundance than carnivorous communities. A similar relationship for fish species was found by Blanchard (2008), who established a link between the variation in fisheries catch of certain species of fish with their PPMR and σ; species with a higher PPMR and narrower feeding kernel had greater variability in their fishing catch through time. Further, Jennings and Warr (2003) identified a link between environmental stability and a smaller ecosystem average PPMR, which in this context means increasing herbivory amongst zooplankton in unstable environments. Such a relationship has been observed in marine ecosystems; herbivorous zooplankton dominate in unstable coastal and upwelling regions, whereas more carnivorous zooplankton are abundant in the open ocean (Raymont, 1980).
The resilience of the fish community to fishing pressure increased, and ecosystems became more efficient in mediating energy from phytoplankton to fish, when zooplankton communities had a larger σZ and higher PPMR characteristic of more herbivorous functional groups (Figure 7). The relationship between zooplankton community feeding characteristics, and the resilience of the fish community and ecosystem transfer efficiency, has potential implications for the marine environment under climate change. The world ocean's oligotrophic regions are expected to expand as a result of climate change (Doney et al., 2012; Sarmiento et al., 2004; Polovina et al., 2008). Food chains in warmer, oligotrophic oceans are traditionally believed to be longer than other regions, as a result of the dominance of smaller phytoplankton (Sprules and Munawar, 1986; Irwin et al., 2006; Morán et al., 2010), which would result in lower rates of energy transfer from primary producers to higher trophic levels. Further, recent studies suggest possible climate-driven shifts in the dominance of certain zooplankton functional groups, such as salps or jellyfish (Atkinson et al., 2004; Richardson et al., 2009; Schofield et al., 2010). Our results indicate that, everything else being equal, an increase in the dominance of carnivorous zooplankton groups could further decrease the transfer efficiency of expanding oligotrophic regions. Conversely, an increase in the abundance of herbivorous groups with a large PPMR, such as salps or herbivorous copepods, could decrease the number of trophic levels between phytoplankton and fish and thereby increase the transfer efficiency of these future oligotrophic regions.
Overall, increasing the zooplankton community PPMR had the greatest effect on increasing the total abundance, productivity and resilience of the fish community (Figures 4, 7), and increasing σZ had the greatest stabilizing effect on the steady state of the system (Figure 5). Zooplankton have a higher average PPMR and smaller σZ in comparison to average observed values for fish and this difference has enormous implications for ecosystem transfer efficiency and stability (Barnes et al., 2010). This means that zooplankton feeding characteristics—in particular PPMR and feeding kernel width—are a critical component to consider moving forward in how the transfer of energy from primary production to higher trophic levels is resolved in marine ecosystem models. This agrees with Jennings and Collingridge (2015), who suggest that a poor understanding of energy transfer in lower trophic levels is a potential cause for the order of magnitude discrepancy between model predictions and observed mesopelagic fish biomass over large spatial scales (Davison et al., 2013; Irigoien et al., 2014).
The large changes in fish biomass and productivity as a result of changes in the zooplankton community lead us to assess the implications of assuming a constant phytoplankton abundance spectrum within the model. In this study, we assume no feedbacks on the phytoplankton community from zooplankton (i.e., predation), however we know from empirical studies that the slope of the phytoplankton spectrum does change. The phytoplankton spectrum is shallower in eutrophic, upwelling systems—indicating a higher abundance of larger individuals such as diatoms—and steeper in oligotrophic systems where small-celled phytoplankton dominate (Sprules and Munawar, 1986; Irwin et al., 2006). The effects of eutrophy or oligotrophy on higher trophic levels could be investigated by varying not only the intercept, but also the slope of the phytoplankton community and incorporating feedback from zooplankton predation.
Our model did not investigate how changes in the body composition of different zooplankton functional groups affects energy transfer from phytoplankton to fish. Gelatinous zooplankton have around one-tenth of the carbon content per unit of live mass compared to non-gelatinous plankton (Kiørboe, 2013) and carbon content as a proportion of weight scales isometrically with increasing body size for carnivorous zooplankton (e.g., ctenophores and cnidarians), but decreases for filter feeders such as salps (Molina-Ramírez et al., 2015). This would have implications for the nutritional value of different zooplankton groups for the fish community, and the fish community's resultant growth rates. Future work could investigate the effect zooplankton body composition might have on energy transfer, by varying the assimilation efficiency of the fish community for different zooplankton functional groups.
Looking forward, theoretical studies have shown that including more traits than just individual body size increases the stability of the size-spectrum (Datta et al., 2011; Zhang et al., 2013) and improves the realism of modeled predator-prey dynamics (Boukal, 2014). Recent developments in dynamic size-spectrum theory now allow multiple functional groups and even species to be resolved within the community spectrum (Maury, 2010; Hartvig et al., 2011; Scott et al., 2014) and have been used to represent actual fish communities with increasing realism (e.g., Blanchard et al., 2014; Dueri et al., 2014; Spence et al., 2016; Zhang et al., 2016). The instabilities in our single-spectrum zooplankton community indicate that more complexity is needed if we are to represent realistic zooplankton communities within a dynamic size-spectrum framework. We envision the next steps toward this goal would involve a functional group approach, where the unique size-based characteristics of multiple size-based zooplankton communities are represented, and the model is calibrated and compared with real-world data. The growing literature on the size-based behavior of zooplankton functional groups—coupled with the recent theoretical developments in dynamic size-spectrum modeling—means size-spectrum models that realistically resolve both zooplankton and fish may now be within reach.
Concluding Remarks
In present size-spectrum model formulations focused on fish, small zooplankton are lumped together with phytoplankton in a background resource spectrum, and large zooplankton are represented as fish. The results of this study clearly demonstrate what we already know to be true: zooplankton are not fish, and nor are they phytoplankton. Current formulations that do not resolve the unique feeding characteristics of zooplankton are neglecting a significant factor in how energy is transferred from phytoplankton to fish. The results of this study motivate further work toward increasing the realism of zooplankton processes in size-spectrum models, and end-to-end marine ecosystem models more broadly.
Author Contributions
All authors were involved in conceiving the original idea for this study. JB provided code from past size-spectrum modeling studies. RH undertook the literature review to obtain zooplankton-specific feeding parameters, constructed the model, conducted the analysis, and wrote the manuscript, with input from AR, JB, and JE.
Conflict of Interest Statement
The authors declare that the research was conducted in the absence of any commercial or financial relationships that could be construed as a potential conflict of interest.
Acknowledgments
We thank Kai Wirtz for being available to answer questions about his mechanistic zooplankton feeding equations. We also thank Iain Suthers for helpful comments about the assumptions underlying our model, from a biological perspective. This study was supported by an Australian Research Council Discovery Grant (DP150102656).
Supplementary Material
The Supplementary Material for this article can be found online at: https://www.frontiersin.org/article/10.3389/fmars.2016.00201
References
Abe, Y., Natsuike, M., Matsuno, K., Terui, T., Yamaguchi, A., and Imai, I. (2013). Variation in assimilation efficiencies of dominant Neocalanus and Eucalanus copepods in the subarctic Pacific: consequences for population structure models. J. Exp. Mar. Biol. Ecol. 449, 321–329. doi: 10.1016/j.jembe.2013.10.023
Andersen, K. H., Berge, T., Gonçalves, R. J., Hartvig, M., Heuschele, J., Hylander, S., et al. (2016). Characteristic sizes of life in the oceans, from bacteria to whales. Ann. Rev. Mar. Sci. 8, 1–25. doi: 10.1146/annurev-marine-122414-034144
Andersen, K. H., Beyer, J. E., and Lundberg, P. (2009). Trophic and individual efficiencies of size-structured communities. Proc. Biol. Sci. 276, 109–114. doi: 10.1098/rspb.2008.0951
Andersen, K. H., Jacobsen, N. S., Life, O., Resources, A., Castle, C., Security, G. F., et al. (2015). The theoretical foundations for size-spectrum models of fish communities. Can. J. Fish. Aquat. Sci. 588, 1–47. doi: 10.1139/cjfas-2015-0230
Andersen, K. H., and Pedersen, M. (2010). Damped trophic cascades driven by fishing in model marine ecosystems. Proc. R. Soc. B Biol. Sci. 277, 795–802. doi: 10.1098/rspb.2009.1512
Atkinson, A., Siegel, V., Pakhomov, E., and Rothery, P. (2004). Long-term decline in krill stock and increase in salps within the Southern Ocean. Nature 432, 100–103. doi: 10.1038/nature02950.1
Baird, M. E., and Suthers, I. M. (2006). A size-resolved pelagic ecosystem model. Ecol. Model. 3, 185–203. doi: 10.1016/j.ecolmodel.2006.11.025
Banas, N. S. (2011). Adding complex trophic interactions to a size-spectral plankton model: emergent diversity patterns and limits on predictability. Ecol. Model. 222, 2663–2675. doi: 10.1016/j.ecolmodel.2011.05.018
Barange, M., Merino, G., Blanchard, J. L., Scholtens, J., Harle, J., Allison, E. H., et al. (2014). Impacts of climate change on marine ecosystem production in societies dependent on fisheries. Nat. Clim. Change 4, 211–216. doi: 10.1038/nclimate2119
Barnes, C., Irigoien, X., De Oliveira, J. A. A., Maxwell, D., and Jennings, S. (2011). Predicting marine phytoplankton community size structure from empirical relationships with remotely sensed variables. J. Plankton Res. 33, 13–24. doi: 10.1093/plankt/fbq088
Barnes, C., Maxwell, D., Reuman, D. C., and Jennings, S. (2010). Global patterns in predator-prey size relationships reveal size dependency of trophic transfer efficiency. Ecology 91, 222–232. doi: 10.1890/08-2061.1
Benoît, E., and Rochet, M.-J. (2004). A continuous model of biomass size-spectra governed by predation and the effects of fishing on them. J. Theor. Biol. 226, 9–21. doi: 10.1016/S0022-5193(03)00290-X
Blanchard, J. L. (2008). The Dynamics of Size-Structured Ecosystems. Ph.D. dissertation, University of York.
Blanchard, J. L., Andersen, K. H., Scott, F., Hintzen, N. T., Piet, G., and Jennings, S. (2014). Evaluating targets and trade-offs among fisheries and conservation objectives using a multispecies size-spectrum model. J. Appl. Ecol. 51, 612–622. doi: 10.1111/1365-2664.12238
Blanchard, J. L., Jennings, S., Holmes, R., Harle, J., Merino, G., Allen, J. I., et al. (2012). Potential consequences of climate change for primary production and fish production in large marine ecosystems. Philos. Trans. R. Soc. B Biol. Sci. 367, 2979–2989. doi: 10.1098/rstb.2012.0231
Blanchard, J. L., Jennings, S., Law, R., Castle, M. D., McCloghrie, P., Rochet, M. J., et al. (2009). How does abundance scale with body size in coupled size-structured food webs? J. Anim. Ecol. 78, 270–280. doi: 10.1111/j.1365-2656.2008.01466.x
Blanchard, J. L., Law, R., Castle, M. D., and Jennings, S. (2011). Coupled energy pathways and the resilience of size-structured food webs. Theor. Ecol. 4, 289–300. doi: 10.1007/s12080-010-0078-9
Boukal, D. S. (2014). Trait- and size-based descriptions of trophic links in freshwater food webs: current status and perspectives. J. Limnol. 73, 171–185. doi: 10.4081/jlimnol.2014.826
Brown, J. H., Gillooly, J. F., Allen, A. P., Savage, V. M., and West, G. B. (2004). Toward a metabolic theory of ecology. Ecology 85, 1771–1789. doi: 10.1890/03-9000
Carlotti, F., and Poggiale, J. C. (2010). Towards methodological approaches to implement the zooplankton component in “end to end” food-web models. Prog. Oceanogr. 84, 20–38. doi: 10.1016/j.pocean.2009.09.003
Datta, S., Delius, G. W., and Law, R. (2010). A jump-growth model for predator-prey dynamics: derivation and application to marine ecosystems. Bull. Math. Biol. 72, 1361–1382. doi: 10.1007/s11538-009-9496-5
Datta, S., Delius, G. W., Law, R., and Plank, M. J. (2011). A stability analysis of the power-law steady state of marine size-spectra. J. Math. Biol. 63, 779–799. doi: 10.1007/s00285-010-0387-z
Davison, P. C., Checkley, D. M., Koslow, J. A., and Barlow, J. (2013). Carbon export mediated by mesopelagic fishes in the northeast Pacific Ocean. Prog. Oceanogr. 116, 14–30. doi: 10.1016/j.pocean.2013.05.013
Doney, S. C., Ruckelshaus, M., Duffy, E. J, Barry, J. P., Chan, F., English, C. A., et al. (2012). Climate change impacts on marine ecosystems. Estuaries 25, 149–164. doi: 10.1146/annurev-marine-041911-111611
Dueri, S., Bopp, L., and Maury, O. (2014). Projecting the impacts of climate change on skipjack tuna abundance and spatial distribution. Glob. Chang. Biol. 20, 742–753. doi: 10.1111/gcb.12460
Friedland, K. D., Stock, C., Drinkwater, K. F., Link, J. S., Leaf, R. T., Shank, B. V., et al. (2012). Pathways between primary production and fisheries yields of large marine ecosystems. PLoS ONE 7:e28945. doi: 10.1371/journal.pone.0028945
Fuchs, H. L., and Franks, P. J. S. (2010). Plankton community properties determined by nutrients and size-selective feeding. Mar. Ecol. Prog. Ser. 413, 1–15. doi: 10.3354/meps08716
Goldman, J. C., and Dennett, M. R. (1990). Dynamics of prey selection by an omnivorous flagellate. Mar. Ecol. Prog. Ser. 59, 183–194. doi: 10.3354/meps059183
Guiet, J., Aumont, O., Poggiale, J.-C., and Maury, O. (2016a). Effects of lower trophic level biomass and water temperature on fish communities: a modeling study. Prog. Oceanogr. 146, 22–37. doi: 10.1016/j.pocean.2016.04.003
Guiet, J., Poggiale, J.-C., and Maury, O. (2016b). Modelling the community size-spectrum: recent developments and new directions. Ecol. Model. 337, 4–14. doi: 10.1016/j.ecolmodel.2016.05.015
Hall, S. J., Collie, J. S., Duplisea, D. E., Jennings, S., Bravington, M., and Link, J. (2006). A length-based multispecies model for evaluating community responses to fishing. Can. J. Fish. Aquat. Sci. 63, 1344–1359. doi: 10.1139/f06-039
Hansen, B., Bjørnsen, P. K., and Hansen, P. J. (1994). The size ratio between planktonic predators and their prey. Limnol. Oceanogr. 39, 395–403. doi: 10.4319/lo.1994.39.2.0395
Hartvig, M., Andersen, K. H., and Beyer, J. E. (2011). Food web framework for size-structured populations. J. Theor. Biol. 272, 113–122. doi: 10.1016/j.jtbi.2010.12.006
Havens, K. E., and Beaver, J. R. (2013). Zooplankton to phytoplankton biomass ratios in shallow Florida lakes: an evaluation of seasonality and hypotheses about factors controlling variability. Hydrobiologia 703, 177–187. doi: 10.1007/s10750-012-1357-9
Irigoien, X., Klevjer, T. A., Røstad, A., Martinez, U., Boyra, G., Acuña, J. L., et al. (2014). Large mesopelagic fishes biomass and trophic efficiency in the open ocean. Nat. Commun. 5, 3271. doi: 10.1038/ncomms4271
Irwin, A. J., Finkel, Z. V., Schofield, O. M. E., and Falkowski, P. G. (2006). Scaling-up from nutrient physiology to the size-structure of phytoplankton communities. J. Plankton Res. 28, 459–471. doi: 10.1093/plankt/fbi148
Jacobsen, N. S., Gislason, H., and Andersen, K. H. (2014). The consequences of balanced harvesting of fish communities. Proc. Biol. Sci. 281:20132701. doi: 10.1098/rspb.2013.2701
Jennings, S., and Collingridge, K. (2015). Predicting consumer biomass, size-structure, production, catch potential, responses to fishing and associated uncertainties in the world's marine ecosystems. PLoS ONE 10:e0133794. doi: 10.1371/journal.pone.0133794
Jennings, S., Pinnegar, J. K., Polunin, N. V. C., and Boon, T. W. (2001). Weak cross-species relationships between body size and trophic level belie powerful size-based trophic structuring in fish communities. J. Anim. Ecol. 70, 934–944. doi: 10.1046/j.0021-8790.2001.00552.x
Jennings, S., and Warr, K. J. (2003). Smaller predator-prey body size ratios in longer food chains. Proc. Biol. Sci. 270, 1413–1417. doi: 10.1098/rspb.2003.2392
Jennings, S., Warr, K. J., and Mackinson, S. (2002). Use of size-based production and stable isotope analyses to predict trophic transfer efficiencies and predator-prey body mass ratios in food webs. Mar. Ecol. Prog. Ser. 240, 11–20. doi: 10.3354/meps240011
Kiørboe, T. (2008). A Mechanistic Approach to Plankton Ecology. Princeton, NJ: Princeton University Press.
Kiørboe, T. (2011). How zooplankton feed: mechanisms, traits and trade-offs. Biol. Rev. 86, 311–339. doi: 10.1111/j.1469-185X.2010.00148.x
Kiørboe, T. (2013). Zooplankton body composition. Limnol. Oceanogr. 58, 1843–1850. doi: 10.4319/lo.2013.58.5.1843
Landry, M. R. (1981). Switching between herbivory and carnivory by the planktonic marine copepod Calanus pacificus. Mar. Biol. 65, 77–82. doi: 10.1007/BF00397070
Landry, M. R., Hassett, R. P., Fagerness, V., Downs, J., and Lorenzen, C. J. (1984). Effect of food acclimation on assimilation efficiency of Calanus pacificus. Limnol. Oceanogr. 29, 361–364. doi: 10.4319/lo.1984.29.2.0361
Law, R., Plank, M. J., James, A., and Blanchard, J. L. (2009). Size-spectra dynamics from stochastic predation and growth of individuals. Ecology 90, 802–811. doi: 10.1890/07-1900.1
Law, R., Plank, M. J., and Kolding, J. (2016). Balanced exploitation and coexistence of interacting, size-structured, fish species. Fish Fish. 17, 281–302. doi: 10.1111/faf.12098
Lefort, S., Aumont, O., Bopp, L., Arsouze, T., Gehlen, M., and Maury, O. (2015). Spatial and body-size dependent response of marine pelagic communities to projected global climate change. Glob. Chang. Biol. 21, 154–164. doi: 10.1111/gcb.12679
Le Mézo, P., Lefort, S., Séférian, R., Aumont, O., Maury, O., Murtugudde, R., et al. (2016). Natural variability of marine ecosystems inferred from a coupled climate to ecosystem simulation. J. Mar. Syst. 153, 55–66. doi: 10.1016/j.jmarsys.2015.09.004
Maury, O. (2010). An overview of APECOSM, a spatialized mass balanced “Apex Predators ECOSystem Model” to study physiologically structured tuna population dynamics in their ecosystem. Prog. Oceanogr. 84, 113–117. doi: 10.1016/j.pocean.2009.09.013
Maury, O., Faugeras, B., Shin, Y.-J., Poggiale, J.-C., Ari, T. B., and Marsac, F. (2007). Modeling environmental effects on the size-structured energy flow through marine ecosystems. Part 1: the model. Prog. Oceanogr. 74, 479–499. doi: 10.1016/j.pocean.2007.05.002
Mitra, A., and Davis, C. (2010). Defining the ‘to’ in end-to-end models. Prog. Oceanog. 84, 39–42. doi: 10.1016/j.pocean.2009.09.004
Montagnes, D. J. S., and Fenton, A. (2012). Prey-abundance affects zooplankton assimilation efficiency and the outcome of biogeochemical models. Ecol. Model. 243, 1–7. doi: 10.1016/j.ecolmodel.2012.05.006
Molina-Ramírez, A., Cáceres, C., Romero-Romero, S., Bueno, J., González-Gordillo, J. I., Irigoien, X., et al. (2015). Functional differences in the allometry of the water, carbon and nitrogen content of gelatinous organisms. J. Plankton Res. 37, 989–1000. doi: 10.1093/plankt/fbv037
Morán, X. A. G., López-Urrutia, Á., Calvo-Díaz, A., and Li, W. K. W. (2010). Increasing importance of small phytoplankton in a warmer ocean. Glob. Change Biol. 16, 1137–1144. doi: 10.1111/j.1365-2486.2009.01960.x
Peters, R. H. (1983). The Ecological Implications of Body Size. Cambridge: Cambridge University Press.
Plank, M. J., and Law, R. (2012). Ecological drivers of stability and instability in marine ecosystems. Theor. Ecol. 5, 465–480. doi: 10.1007/s12080-011-0137-x
Polovina, J. J., Howell, E. A., and Abecassis, M. (2008). Ocean's least productive waters are expanding. Geophys. Res. Lett. 35, 2–6. doi: 10.1029/2007GL031745
Press, W. H., Teukolsky, S. A., Vetterling, W. T., and Flannery, B. P. (2007). Numerical Recipes: The Art of Scientific Computing, 3rd Edn. New York, NY: Cambridge University Press.
Raymont, J. E. G. (1980). Plankton and Productivity in the Oceans: Vol. 1, Phytoplankton, 2nd End. Oxford, UK: Pergamon Press Ltd.
Richardson, A. J., Bakun, A., Hays, G. C., and Gibbons, M. J. (2009). The jellyfish joyride: causes, consequences and management responses to a more gelatinous future. Trends Ecol. Evol. 24, 312–322. doi: 10.1016/j.tree.2009.01.010
Rogers, A., Blanchard, J. L., and Mumby, P. J. (2014). Vulnerability of coral reef fisheries to a loss of structural complexity. Curr. Biol. 24, 1000–1005. doi: 10.1016/j.cub.2014.03.026
Rousseaux, C. S., and Gregg, W. W. (2015). Recent decadal trends in global phytoplankton composition. Glob. Biogeochem. Cycles 29, 1674–1688. doi: 10.1002/2015GB005139
Saiz, E., and Kiørboe, T. (1995). Predatory and suspension feeding of the copepod Acartia tonsa in turbulent environments. Mar. Ecol. Prog. Ser. 122, 147–158. doi: 10.3354/meps122147
Sarmiento, J. L., Slater, R., Barber, R., Bopp, L., Doney, S. C., Hirst, A. C., et al. (2004). Response of ocean ecosystems to climate warming. Glob. Biogeochem. Cycles 18:GB3003. doi: 10.1029/2003GB002134
Schofield, O., Ducklow, H. W., Martinson, D. G., Meredith, M. P., Moline, M. A., and Fraser, W. R. (2010). How do polar marine ecosystems respond to rapid climate change? Science 328, 1520–1523. doi: 10.1126/science.1185779
Scott, F., Blanchard, J. L., and Andersen, K. H. (2014). mizer: an R package for multispecies, trait-based and community size-spectrum ecological modelling. Methods Ecol. Evol. 5, 1121–1125. doi: 10.1111/2041-210X.12256
Sheldon, R. W., Evelen, T. P. T., and Parsons, T. R. (1967). On the occurrence and formation of small particles in seawater. Limnol. Oceanogr. 7, 367–375.
Spence, M. A., Blackwell, P. G., and Blanchard, J. L. (2016). Parameter uncertainty of a dynamic multi-species size-spectrum model. Can. J. Fish. Aquat. Sci. 9, 1–9. doi: 10.1139/cjfas-2015-0022
Sprules, W. G., and Munawar, M. (1986). Plankton size-spectra in relation to ecosystem productivity, size, and perturbation. Can. J. Fish. Aquat. Sci. 43, 1789–1794. doi: 10.1139/f86-222
Stock, C. A., Powell, T. M., and Levin, S. A. (2008). Bottom-up and top-down forcing in a simple size-structured plankton dynamics model. J. Mar. Syst. 74, 134–152. doi: 10.1016/j.jmarsys.2007.12.004
Ward, B. A., Dutkiewicz, S., and Follows, M. J. (2014). Modelling spatial and temporal patterns in size-structured marine plankton communities: top-down and bottom-up controls. J. Plankton Res. 36, 31–47. doi: 10.1093/plankt/fbt097
Ward, B. A., Dutkiewicz, S., Jahn, O., and Follows, M. J. (2012). A size-structured food-web model for the global ocean. Limnol. Oceanogr. 57, 1877–1891. doi: 10.4319/lo.2012.57.6.1877
Wirtz, K. W. (2012). Who is eating whom? Morphology and feeding type determine the size relation between planktonic predators and their ideal prey. Mar. Ecol. Prog. Ser. 445, 1–12. doi: 10.3354/meps09502
Wirtz, K. W. (2014). A biomechanical and optimality-based derivation of prey-size dependencies in planktonic prey selection and ingestion rates. Mar. Ecol. Prog. Ser. 507, 81–94. doi: 10.3354/meps10894
Woodward, G., Ebenman, B., Emmerson, M., Montoya, J. M., Olesen, J. M., Valido, A., et al. (2005). Body size in ecological networks. Trends Ecol. Evol. 20, 402–409. doi: 10.1016/j.tree.2005.04.005
Woodworth-Jefcoats, P. A., Polovina, J. J., Dunne, J. P., and Blanchard, J. L. (2013). Ecosystem size structure response to 21st century climate projection: large fish abundance decreases in the central North Pacific and increases in the California Current. Glob. Chang. Biol. 19, 724–733. doi: 10.1111/gcb.12076
Zhang, C., Chen, Y., and Ren, Y. (2015). Assessing uncertainty of a multispecies size-spectrum model resulting from process and observation errors. ICES J. Mar. Sci. 72, 2223–2233. doi: 10.1093/icesjms/fsv086
Zhang, C., Chen, Y., and Ren, Y. (2016). An evaluation of implementing long-term MSY in ecosystem-based fisheries management: incorporating trophic interaction, bycatch and uncertainty. Fish. Res. 174, 179–189. doi: 10.1016/j.fishres.2015.10.007
Zhang, L., Thygesen, U. H., Knudsen, K., and Andersen, K. H. (2013). Trait diversity promotes stability of community dynamics. Theor. Ecol. 6, 57–69. doi: 10.1007/s12080-012-0160-6
Zhou, M. (2006). What determines the slope of a plankton biomass spectrum? J. Plankton Res. 28, 437–448. doi: 10.1093/plankt/fbi119
Keywords: zooplankton dynamics, marine size-spectrum, end-to-end modeling, fish productivity, ecosystem stability
Citation: Heneghan RF, Everett JD, Blanchard JL and Richardson AJ (2016) Zooplankton Are Not Fish: Improving Zooplankton Realism in Size-Spectrum Models Mediates Energy Transfer in Food Webs. Front. Mar. Sci. 3:201. doi: 10.3389/fmars.2016.00201
Received: 03 August 2016; Accepted: 29 September 2016;
Published: 19 October 2016.
Edited by:
Christian Lindemann, University of Bergen, NorwayReviewed by:
Jan Marcin Weslawski, Institute of Oceanology (PAN), PolandFrancis Poulin, University of Waterloo, Canada
Copyright © 2016 Heneghan, Everett, Blanchard and Richardson. This is an open-access article distributed under the terms of the Creative Commons Attribution License (CC BY). The use, distribution or reproduction in other forums is permitted, provided the original author(s) or licensor are credited and that the original publication in this journal is cited, in accordance with accepted academic practice. No use, distribution or reproduction is permitted which does not comply with these terms.
*Correspondence: Ryan F. Heneghan, ryan.heneghan@uqconnect.edu.au