Methanotrophic Community Dynamics in a Seasonally Anoxic Fjord: Saanich Inlet, British Columbia
 Mónica Torres-Beltrán1
  Alyse K. Hawley1
  David W. Capelle2
  Maya P. Bhatia1,3 W. Evan Durno4 Philippe D. Tortell5,6,7
  Steven J. Hallam1,4,7,8*
- 1Department of Microbiology and Immunology, University of British Columbia, Vancouver, BC, Canada
- 2Centre for Earth Observation Science, University of Manitoba, Winnipeg, MB, Canada
- 3Canadian Institute for Advanced Research (CIFAR), Toronto, ON, Canada
- 4Graduate Program in Bioinformatics, University of British Columbia, Vancouver, BC, Canada
- 5Department of Earth, Ocean and Atmospheric Sciences, University of British Columbia, Vancouver, BC, Canada
- 6Department of Botany, University of British Columbia, Vancouver, BC, Canada
- 7Peter Wall Institute for Advanced Studies, University of British Columbia, Vancouver, BC, Canada
- 8ECOSCOPE Training Program, University of British Columbia, Vancouver, BC, Canada
Marine oxygen minimum zones (OMZs) play disproportionate roles in nutrient and climate active trace gas cycling including nitrous oxide and methane, in the ocean. OMZs are currently expanding due to climate change making it increasingly important to identify microbial controls on trace gas cycling at the individual, population and community levels. Here we present a 2-year survey of the microbial community along seasonal redox gradients in Saanich Inlet focused on identifying microbial agents driving methane oxidation. Although methanotrophs were rare, we identified three uncultivated groups affiliated with particulate methane monooxygenase (pMMO) encoding phylogenetic groups (OPU), and methanotrophic symbionts as primary drivers of methane oxidation in Saanich Inlet. Distribution and activity patterns for these three groups were consistent with niche partitioning that became increasingly resolved during water column stratification. Moreover, co-occurrence analysis combined with multi-level indicator species analysis revealed significant correlations between operational taxonomic units affiliated with Methylophaga, Methylophilales, SAR324, Verrucomicrobia, and Planctomycetes with OPUs and methanotrophic symbiont groups. Taken together these observations shed new light on the composition, dynamics, and potential interspecific interactions of microbes associated with CH4 cycling in the Saanich Inlet water column, provide a baseline for comparison between coastal and open ocean OMZs and support the potential role of OPUs, and methanotrophic symbiont groups as a widely distributed pelagic sink for CH4 along continental margins.
Introduction
Marine oxygen minimum zones (OMZs) are widespread and naturally occurring water column features that currently constitute ~7% of the global ocean volume (Paulmier and Ruiz-Pino, 2009; Wright et al., 2012). OMZs arise when the respiratory O2 demand during the decomposition of organic matter exceeds O2 availability in poorly ventilated regions of the ocean (Paulmier and Ruiz-Pino, 2009). Reduced levels of dissolved O2 (<20 μM kg−1) enhances the use of alternative inorganic compounds as electron acceptors for anaerobic respiration by microorganisms resulting in the production of climate active trace gas such as carbon dioxide (CO2), nitrous oxide (N2O), and methane (CH4) (Lam et al., 2009; Ward et al., 2009). Global warming effects, including decreased O2 solubility and upper ocean stratification, are leading to OMZ expansion and intensification (Keeling et al., 2009). Looking forward, OMZ expansion will cause changes in ocean productivity and biogeochemical cycling of nutrients and climate active trace gasses (Diaz and Rosenberg, 2008; Keeling et al., 2009; Ward et al., 2009).
OMZs are the largest marine source of CH4 flux to the atmosphere (~ 1 Tg CH4 year−1) (Naqvi et al., 2010). Previous surveys have quantified CH4 oxidation rates in oxic (>90 μmol O2 kg−1) and dysoxic- suboxic (<20 μmol O2 kg−1) OMZ waters as well as anoxic sediments. Although the process of anaerobic oxidation of CH4 (AOM) can consume ~75% of CH4 in the sediment (Strous and Jetten, 2004; Knittel and Boetius, 2009), results indicated that AOM occurs at a much slower rate than aerobic CH4oxidation in the water column (0.72 nmol L−1h−1 and 2 nmol L−1h−1 respectively, Ward et al., 1989; Ward and Kilpatrick, 1990, 1993). Aerobic CH4 oxidation has been estimated to consume >50% of CH4 in the water column (Fung et al., 1991; Reeburgh et al., 1991) likely having the largest influence on the CH4 budget before emission to the atmosphere (Reeburgh, 2007). Thus, aerobic CH4 oxidation provides a second biological filter following sediment AOM that reduces CH4 flux (Ward et al., 1989; Ward and Kilpatrick, 1990, 1993).
Efforts to understand microbial agents driving methane oxidation based on small subunit ribosomal RNA (SSU rRNA) gene surveys from diverse OMZs such as the Eastern Tropical South Pacific, the Namibian Upwelling, and the Black Sea (Stevens and Ulloa, 2008; Glaubitz et al., 2010), indicate that canonical methanotrophs within the alpha and gammaproteobacteria, are rare microbial community members (i.e., <0.01% of the total microbial community). Parallel efforts to describe the distribution, abundance, and potential metabolic activity of the functional gene particulate methane monooxygenase (pMMO) subunit β (pmoA), identified pMMO- encoding phylogenetic groups (OPUs), OPU1 to OPU4, affiliated with canonical methanotrophic groups in OMZs waters (Hayashi et al., 2007; Tavormina et al., 2013). Phylogenetically affiliated with Methylococcales OPU1 and OPU3 groups were initially observed in the Eastern Pacific Ocean OMZ (Hayashi et al., 2007), and exhibit differential abundance and distribution patterns. OPU3 was more abundant under low O2 concentrations in the Costa Rica OMZ water column (Tavormina et al., 2013), and expression of pmoCAB for group OPU3 has recently been demonstrated in a metatranscriptome from the Guaymas Basin (Lesniewski et al., 2012). In addition to canonical methanotrophs, more recent studies have identified a number of non-canonical microbial groups [e.g., bacteria affiliated with the Verrucomicrobia (Dunfield et al., 2007), SAR324 within the deltaproteobacteria (Swan et al., 2011) and the NC10 candidate division (Ettwig et al., 2010)] with the potential to mediate CH4 cycling in OMZs. In both known and novel cases there is limited information on the dynamics and interspecific interactions of CH4 cycling microbes needed to constrain their biological filtering capacity.
Saanich Inlet is a seasonally anoxic fjord on the east coast of Vancouver Island British Columbia. During spring and summer months, restricted circulation, and high levels of primary production lead to progressive deoxygenation and the accumulation of CH4, ammonium (NH4) and hydrogen sulfide (H2S) in the deep waters of the Saanich Inlet basin. In late summer and fall, upwelling oxygenated nutrient rich ocean waters cascade into the inlet shoaling anoxic bottom waters upward and transforming the redox chemistry of the water column. The recurring seasonal development of water column anoxia followed by deep water renewal makes Saanich Inlet a model ecosystem for evaluating microbial community structure, function and dynamics in relation to changing levels of water column O2 deficiency extensible to coastal and open ocean OMZs (Walsh et al., 2009; Zaikova et al., 2010; Walsh and Hallam, 2011; Wright et al., 2012). Indeed, for over four decades Saanich Inlet has been the site of a number of important studies on biogeochemical and oceanographic processes including CH4 oxidation (Ward et al., 1989; Ward and Kilpatrick, 1993) and ongoing molecular and environmental monitoring surveys (Walsh et al., 2009; Zaikova et al., 2010; Hawley et al., 2014; Capelle et al., 2015; Louca et al., 2016; Figure 1).
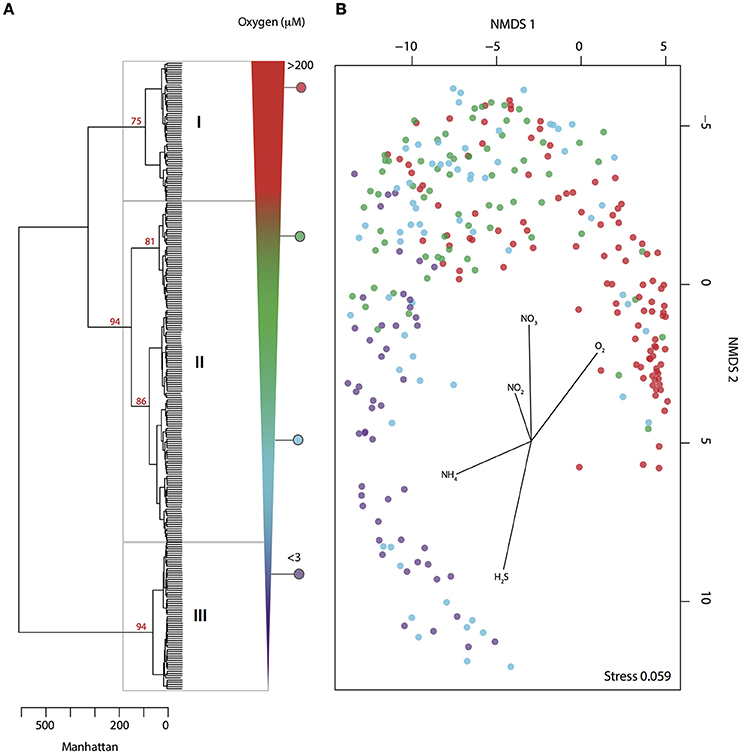
Figure 1. Microbial community partitioning under changing levels of water column O2 deficiency. (A) Hierarchical clustering of pyrotag data (May 2008–July 2010) based on Manhattan distance. Clusters are delimited by O2 concentration range represented by number from I to III: oxic = I, dysoxic − suboxic = II and anoxic = III. Bootstrap values (1000 iterations) are shown in red. (B) NMDS depicts microbial community partitioning along redox gradient showing correlation with environmental parameters. Samples are depicted in color dots according to O2 concentration.
Process rates and molecular surveys focused on CH4 oxidation have been previously conducted in Saanich Inlet during peak summer stratification. Process measurements indicated that CH4 oxidation rates were highest near the oxic-anoxic interface (~2 nmol L−1 d−1) (Ward et al., 1989). Subsequently, sequences affiliated with canonical methanotrophs such as Methylococcales within the gammaproteobacteria were recovered as rare biosphere components based on full-length SSU rRNA gene sequences (Zaikova et al., 2010) and particulate methane monoxygenase subunit β (pmoA) libraries were dominated by a non-canonical phylotype (Stilwell, 2007). In the same study, anaerobic methane oxidizing archaea (ANME) were undetectable in the water column. The low abundance of canonical methanotrophs combined with measured CH4 oxidation rates in both oxycline and deep basin waters presents a “CH4 oxidation conundrum” (Ward et al., 1989; Ward and Kilpatrick, 1993; Zaikova et al., 2010). Here we attempt to constrain this conundrum using taxonomic survey information over 2 years of seasonal stratification and renewal supplemented with functional gene information for pmoA.
Methods
Environmental Sampling
Environmental monitoring and sample collection were carried out monthly aboard the MSV John Strickland at station SI03 (48° 35.500 N, 123° 30.300 W) in Saanich Inlet, B.C. From February 2008 to July 2010 a total of 288 water samples were collected at 16 high-resolution depths (10, 20, 40, 60, 75, 85, 90, 97, 100, 110, 120, 135, 150, 165, 185, and 200 meters) spanning oxic (>90 μmol O2 kg−1), dysoxic (90-20 μmol O2 kg−1), suboxic (20-1 μmol O2 kg−1) anoxic (<1 μmol O2 kg1) and sulfidic water column compartments (Wright et al., 2012). Samples were processed and analyzed as previously reported for the Saanich Inlet time-series (Zaikova et al., 2010; Capelle et al., 2015; Torres-Beltrán et al., Unpublished data). Briefly, water samples were collected from Niskin or Go-Flow bottles for dissolved O2 and CH4, nutrients [Nitrate (NO3), Nitrite (NO2), Ammonium (NH4), Silicon dioxide (SiO2), Phosphate (PO4), Hydrogen sulfide (H2S)], DNA, and RNA. In addition, conductivity, temperature, and depth were measured using a Seabird SBE19 CTD-device (Sea-Bird Electronics Inc., Bellevue USA), with a PAR and O2 sensor attached. CTD was also used to measure dissolved O2 throughout the water column. Dissolved gases and nutrient measurement protocols have been previously reported for the Saanich Inlet time-series (Zaikova et al., 2010; Capelle et al., 2015; Torres-Beltrán et al., Unpublished data), and data is available through Dryad Digital Repository (www.dryad.org).
Nucleic Acid Sampling and Extraction
Biomass to generate full-length small subunit (SSU) rRNA gene clone library sequences and pmoA gene library sequences (Stilwell, 2007), and metagenomic datasets was collected on February 2006 and February 2010 respectively, at six depths (10, 100, 120, 135, 150, and 200 meters) and filtered with an in-line 2.7 μm GDF glass fiber pre-filter onto a 0.22 μm Sterivex polycarbonate cartridge filter. Biomass to generate SSU rRNA pyrotag datsets for microbial community composition profiling (2L) and filtered directly onto a 0.22 μm Sterivex polycarbonate cartridge filter from high-resolution depths collected between May 2008 and July 2010. Biomass for RNA analysis (2L) was collected on February 2010 at six depths (10, 100, 120, 135, 150, and 200 m), and filtered with an in-line 2.7 μm GDF glass fiber pre-filter onto a 0.22 μm Sterivex filter within 20 min of shipboard sample collection.
Environmental DNA was extracted from Sterivex filters as previously described (Wright et al., 2009; Zaikova et al., 2010). Briefly, after defrosting Sterivex on ice, 100 μl lysozyme (0.125 mg ml−1; Sigma) and 20 μl of RNAse (1 μl ml−1; ThermoFisher) were added and incubated at 37°C for 1 h with rotation followed by addition of 50 μl Proteinase K (Sigma) and 100 μl 20% SDS and incubated at 55°C for 2 h with rotation. Lysate was removed by pushing through with a syringe into 15 mL falcon tube (Corning) and with an additional rinse of 1 mL of lysis buffer. Filtrate was subject to chloroform extraction (Sigma) and the aqueous layer was collected and loaded onto a 10K 15 ml Amicon filter cartridge (Millipore), washed three times with TE buffer (pH 8.0) and concentrated to a final volume of between 150–400 μl. Total DNA concentration was determined by PicoGreen assay (Life Technologies) and genomic DNA quality determined by visualization on 0.8% agarose gel (overnight at 16 V).
Total RNA was extracted from Sterivex filters using the mirVana Isolation kit (Ambion) (Shi et al., 2009; Stewart et al., 2010) protocol modified for sterivex filters (Hawley et al., Unpublished data). Briefly, after thawing the filter cartridge on ice RNA later was removed by pushing through with a 3 ml syringe followed by rinsing with an additional 1.8 mL of Ringer's solution and incubated at room temperature for 20 min with rotation. Ringer's solution was evacuated with a 3 ml syringe followed by addition of 100 μl of 0.125 mg ml−1 lysozyme and incubated at 37°C for 30 min with rotation. Lysate was removed from the filter cartridge and subjected to organic extraction following the mirVana kit protocol. DNA removal and clean up and purification of total RNA were conducted following the TURBO DNA-free kit (ThermoFisher) and the RNeasy MinElute Cleanup kit (Qiagen) protocols respectively.
Small Subunit Ribosomal RNA Gene Sequencing and Analysis
To initially assess microbial community diversity in the Saanich Inlet water column full-length bacterial small subunit ribosomal (SSU) rRNA gene sequences datasets were generated from the February 2006 LV samples as previously described (Zaikova et al., 2010). Briefly, DNA extracts from 10, 100, 120, and 200 m samples were amplified using SSU rRNA primers targeting the bacterial domain: B27F (5′- AGAGTTTGATCCTGGCTCAG) and U1492R (5′-GGTTAC CTTAGTTACGACTT) under the following PCR conditions: 3 min at 94°C followed by 35 cycles of 94°C for 40 s, 55°C for 1.5 min, 72°C for 2 min and a final extension of 10 min at 72°C. Each 50 ml reaction contained 1 μl of template DNA, 1 μl each 10 mM forward and reverse primer, 2.5 U Taq (Qiagen), 5 ml 10 mM deoxynucleotides, and 41.5 μl 1X Qiagen PCR Buffer. Clone library construction and screening. The SSU rRNA gene amplicons were visualized on 1% agarose gels in 1X TAE and purified using the MinElute PCR Purification Kit (Qiagen) according to the manufacturer's instructions. Approximately 4 μl of each purified SSU rRNA gene product was cloned into a pCR4-TOPO vector using a TOPO TA cloning kit for sequencing (Invitrogen) and transformed by chemical transformation into Mach- 1-T1R cells according to the manufacturer's instructions. Transformants were transferred to 96-well plates containing 180 mlLBkan50 and 10% glycerol and grown overnight at 37°C prior to storage at −80°C. Cloned inserts were amplified directly from glycerol stocks with M13F (5′-GTAAAACGACGGCCAG) and M13R (5′- CAGGAAACAGCTATGAC) primers using the SSU rRNA gene PCR protocol. Bidirectional end sequencing was performed on a Sanger platform at the Department of Energy Joint Genome Institute (DOE-JGI; Walnut Creek, CA).
To survey microbial community structure and dynamics throughout the complete water column profile over time, DNA extracts from the samples from May 2008 to July 2010 were used to generate SSU rRNA gene pyrotag datasets. Pyrotag libraries were generated by PCR amplification using multi-domain primers targeting the V6-V8 region of the SSU rRNA gene (Allers et al., 2013): 926F (5′-cct atc ccc tgt gtg cct tgg cag tct cag AAA CTY AAA KGA ATT GRC GG-3′) and 1392R (5′-cca tct cat ccc tgc gtg tct ccg act cag- <XXXXX>-ACG GGC GGT GTG TRC-3′). Primer sequences were modified by the addition of 454 A or B adapter sequences (lower case). In addition, the reverse primer included a 5 bp barcode designated <XXXXX> for multiplexing of samples during sequencing. Twenty-five microliter PCR reactions were performed in triplicate and pooled to minimize PCR bias. Each reaction contained between 1 and 10 ng of target DNA, 0.5 μl Taq DNA polymerase (Bioshop inc. Canada), 2.5 μL Bioshop 10 x buffer, 1.5 uL 25 mM Bioshop MgCl2, 2.5 μL 10 mM dNTPs (Agilent Technologies) and 0.5 μL 10 mM of each primer. The thermal cycler protocol started with an initial denaturation at 95°C for 3 min and then 25 cycles of 30 s at 95°C, 45 s at 55°C, 90 s at 72°C and 45 s at 55°C. Final extension at 72°C for 10 min. PCR products were purified using the QiaQuick PCR purification kit (Qiagen), eluted elution buffer (25 μL), and quantified using PicoGreen assay (Life Technologies). SSU rRNA amplicons were pooled at 100 ng DNA for each sample. Emulsion PCR and sequencing of the PCR amplicons were sequenced on Roche 454 GS FLX Titanium at the DOE-JGI, or the McGill University and Génome Québec Innovation Center.
Pyrotag sequences were processed using the Quantitative Insights Into Microbial Ecology (QIIME) software package (Caporaso et al., 2010). To minimize the removal of false positive reads all 3,985,489 pyrotag sequences generated from the 288 samples were clustered together. Reads with a length shorter than 200 bases, ambiguous bases, and homopolymer sequences were removed prior to chimera detection. Chimeras were detected and removed using chimera slayer provided in the QIIME software package. Sequences were then clustered into operational taxonomic units (OTUs) at 97% identity using uclust with average linkage algorithm. Prior to taxonomic assignment singleton OTUs (OTUs represented by one read) were omitted, leaving 69,051 OTUs. Representative sequences from each non-singleton OTU were queried against the SILVA database (Pruesse et al., 2007) and the Greengenes database (Desantis et al., 2006) using BLAST (Altschul et al., 1990).
pmoA Gene Libraries, Metagenomic and Metatranscriptomic Sequencing and Analysis
Extracted total DNA from the February 2006 samples were used to identify bacterial particulate methane monooxygenase (pMMO) subunit β (pmoA) presence in the Saanich Inlet water column. Briefly, pmoA sequences were PCR amplified (Stilwell, 2007) using gene-specific forward and reverse primers A189F (5′-GGNGACTGGGACTTCTGG) (Holmes et al., 1995) and mb661R (5′- CCGGMGCAACGTCYTTACC) (Costello and Lidstrom, 1999) and the following PCR profile: 30 cycles of 96°C for 25 s, 54°C for 45 s, and 72°C for 50 s. Each 50 ul reaction contained l μl of template DNA, 2 μl each 10 uM forward and reverse primer, 2.5U Taq (Qiagen), 4 μl 10 mM deoxynucleotides, and 40.5 μl lx Buffer (QiagenTaqPolymeraseKit). pmoA amplicons were purified using the MinElute PCRPurificationKit (Qiagen, CA), cloned into a pCR4-TOPO vector using a TOPO T A cloning kit for sequencing (Invitrogen, Carlsbad C A), and transformed by chemical transformation into Mach-1-T1R cells according to the manufacturer's instructions. Cloned inserts were amplified directly from glycerol stocks for fingerprint screening using the common 4-base cutter Rsa I (Invitrogen, CA). Restriction patterns were visually inspected and unique patterns selected for Sanger sequencing through the McGill University and Genome Quebec Innovation Centre (Montreal, Quebec, Canada) (Stilwell, 2007). Four libraries were constructed from 10, 100, 120, and 200 m, from which a total of 33 representative sequences were identified.
Extracted total DNA (6 samples) and RNA (6 samples) from February 2010, corresponding to the 10, 100, 120, 135, 150, and 200 m depth intervals, were used to generate metagenomic and metatranscriptomic datasets at the DOE-JGI following the protocols for library production and sequencing and assembly previously described for the Saanich Inlet time-series (Hawley et al., Unpublished data).
A total of 6 assembled metagenomes and 6 assembled metatranscriptomes were analyzed using MetaPathways V2.5.1, an open source pipeline for predicting reactions and pathways using default settings (Konwar et al., 2013) (https://github.com/hallamlab/metapathways2/wiki). For each gene, reads per kilobase per million mapped (RPKM) was calculated as a proportion of the number of reads mapped to a sequence section, normalized for sequencing depth and ORF length (Konwar et al., 2015). RPKM values and relative abundance to the total number of reads were used to describe the abundance of pmoA genes and transcripts.
Phylogenetic Inference
To generate a reference phylogenetic tree for methanotrophic bacteria, full-length SSU rRNA gene sequences from Saanich Inlet, and diverse environmental reference sequences affiliated with methanotrophic bacteria were first aligned and compared. Full-length SSU rRNA gene sequences from Saanich Inlet were edited manually using Sequencher software V4.1.2 (Gene Codes Corporation) and imported into the full-length SSU SILVA database (www.arb-silva.de) and aligned to the closest relative. Sequences affiliated with known methanotrophs were extracted from the dataset. Methanotroph reference sequences from Saanich Inlet in addition to 53 reference sequences for methanotrophic bacteria including cultured type I and II methanotrophs, OMZ representatives, mussel symbionts and envioronmental clones were clustered at 97% identity using mothur v.1.19.0 (Schloss et al., 2009). A total of 88 sequences affiliated with Methylococcales were recovered representing 1.3% from the total Saanich Inlet full-length SSU rRNA sequences generated. Sequences clustered at 97% identity resolved into 11 distinct clusters, 5 of which contained most of the identified sequences (93%). Representative sequences for the most abundant clusters revealed 4 subgroups with phylogenetic similarity to environmental representatives of type I methanotrophs: Methylococcaceae (Mou et al., 2008), putative methanotrophic group OPU3 (Hayashi et al., 2007; Tavormina et al., 2010, 2013), environmental seafloor clones (Santelli et al., 2008), and methanotrophic symbionts (Streams et al., 1997; Dubilier et al., 2008; Petersen and Dubilier, 2009). Representative sequences for the most abundant (represented by more than one sequence) clusters were identified using the get.oturep command in mothur and were included in the phylogenetic tree. Representative sequences were aligned using the SSU SILVA database and imported into the ARB software (Ludwig et al., 2004) for tree distance matrix and alignment generation using the ARB parsimony tool. ARB sequences were exported to Mesquite (V.2.0) and edited manually. A maximum likelihood phylogenetic tree was inferred by PHYML (Guindon et al., 2005) using an GTR model of nucleotide evolution where the parameter of the gamma distribution, the proportion of invariable sites and the transition/transversion ratio were estimated for each data set. The confidence of each node was determined by assembling a consensus tree of 1000 bootstrap replicates.
To further resolve diversity of methanotrophic bacterial OTUs, we recruited pyrotag OTU sequences to full-length SSU rRNA gene sequences described above. Pyrotag sequences affiliated with methanotrophs based on BLAST-comparison in QIIME were re-clustered with SSU rRNA gene tree reference sequences using a 97% identity cut-off in mothur (Schloss et al., 2009). In addition, blastn was used to query representative pyrotag sequences from clusters against full-length SSU rRNA reference tree sequences. Only hits with a perfect match across the full length of a query sequence were retrieved, and the number of pyrotags mapping to all sequences in each cluster was summed. Clusters represented by one pyrotag sequence were not used in downstream analyses. Representative pyrotag sequences were aligned in ARB to reference tree sequences, imported to Mesquite for manual edition, and finally, included in the phylogenetic tree inferred by PHYML using the parameters detailed above.
To generate a reference phylogenetic tree for PmoA, conceptually translated and annotated ORFs from the metagenomic and metatranscriptomic datasets were manually extracted from the functional annotation table <ORF_annotation_table.txt> in the <results/annotation table> output directory. Sequences were aligned and compared to diverse environmental and reference PmoA sequences. A total of 60 PmoA sequences, retrieved from metagenomic (34 sequences) and metatranscriptomic (26 sequences) datasets, were clustered over a range of identity thresholds using the UClust algorithm (USEARCH V6.0) with 52 reference sequences including Saanich Inlet pmoA gene libraries, cultured and environmental sequences affiliated with Type I and II methanotrophs, and novel pmoA phylotypes found within the SAR324 clade, Verrucomicrobia and Candidate Methylomirabilis oxyfera NC10. Reference sequences also included ammonium monooxygenase subunit α (AmoA). The 97% identity threshold was selected based on resolution of the OPUs and symbiont groups. Cluster representative sequences were aligned using the Multiple Sequence Comparison by Log- Expectation (MUSCLE) method (EMBL-EBI), and was manually curated in Mesquite. A maximum likelihood phylogenetic tree was inferred by PHYML (Guindon et al., 2005) using an WAG model of amino acid evolution where the parameter of the gamma distribution, the proportion of invariable sites and the transition/transversion ratio were estimated. The confidence of each node was determined by assembling a consensus tree of 1000 bootstrap replicates.
Statistical Analyses
Pyrotag datasets were normalized to the total number of reads per sample, and environmental parameter data were transformed to the same order of magnitude so that each variable had equal weight. Hierarchical cluster analysis (HCA) was conducted to identify groups associated with discrete water column compartments. In addition, OTUs were correlated using nonmetric multidimensional scaling (NMDS) with environmental parameters. Hierarchical cluster and NMDS analyses of microbial community compositional profiles were done using the pvclust (Suzuki and Shimodaira, 2015) and MASS (Venables and Ripley, 2002) packages in the R software (Rcoreteam, 2013) with Manhattan Distance measures, and statistical significance to the resulting clusters was computed as bootstrap score distributions with 1000 iterations and NMDS stress value ≤0.05.
Multi-level indicator species analysis (ISA) using the indicspecies package (De Cáceres and Legendre, 2009) in the R software (Rcoreteam, 2013) was performed to identify OTUs specifically associated with different water column compartments defined by HCA. The ISA/multi-level pattern analysis calculates p values with Monte Carlo simulations and returns indicator values (IV) and p-values with α ≤ 0.05. The IVs range between 0 and 1, where indicator OTUs considered in the present study for further community analysis shown an IV ≥ 0.7 and p-value ≤ 0.001.
A multivariate regression analysis (Fox and Weisberg, 2011) was conducted on time-series pyrotag data to infer significant correlations between OTUs affiliated with methanotrophic bacteria while controlling for the effect of depth. Analysis was conducted in the R environment (Rcoreteam, 2013). Parameter estimates were calculated with least squares fit between relative abundances and depth measurements. Only representative OTUs affiliated with methanotrophic bacteria were regressed. Statistical significance of correlations was determined with bootstrapping (1000 iterations), and using a Type-I error rate of 5%.
Univariate regression analyses were conducted on time-series pyrotag data to infer correlations between OTUs affiliated with methanotrophic bacteria counts and environmental variables (O2, CH4, , , and H2S). Choice of model per OTU was determined by AIC testing (Akaike, 1998), using a combination of negative binomial regression (Venables and Ripley, 2002), and zero-inflated negative binomial regression (Zeileis et al., 2008) employed due to many zeroed observations (average: 54%). Parameter estimates and statistical significance were calculated in the R environment (Rcoreteam, 2013), using a Type-I error rate of 5%.
Co-occurrence Networks
To generate a robust network emphasizing co-occurrences between prevalent OTUs in water column compartments defined by HCA rather than individual depth intervals, the Bray-Curtis and Spearman's rank correlations were used. Correlation coefficients were calculated using CoNet (Faust et al., 2012) with OTU abundance as count data. First, an OTU matrix derived from the pyrotag taxonomic analysis was transformed into presence-absence data to remove OTUs with less than 1/3 zero counts, leaving a matrix of 780 OTUs for all samples. Next, to construct ensemble networks, measure-specific thresholds set to 0.6 were used as a pre-filter and edge scores were computed only between clade pairs. To assign statistical significance to the resulting scores, edge and measure-specific permutation and bootstrap score distributions with 1000 iterations each were computed. p-values were tail-adjusted so that low p-values correspond to co-presence and high p-values to exclusion. After merging, p-values on each final edge were corrected to q-values (cut-off of 0.05). The positivity or negativity of each relationship was determined by consensus voting over all integrated data sources. Finally, only edges with at least two supporting pieces of evidence were retained.
The final edges matrix was visualized as a force directed network using Cytoscape 2.8.3 (Shannon et al., 2003). Network properties were calculated with the “Network Analysis” plug-in. Nodes in the co-occurrence network corresponded to individual OTUs and edges were defined by computed correlations between corresponding OTU pairs. The layout revealed distinct modules, which persisted after lowering the correlation coefficient cut-off for edge creation to 0.90 reinforcing the robustness of the network. Edges from modules were selected and visualized as sub-networks using the tool Hive Panel Explorer (https://github.com/hallamlab/HivePanelExplorer/wiki) (Perez, 2015). HivePlotter allows for edge selection based on interactions within specific OTUs such as those affiliated with methanotrophic bacteria.
Data Deposition
The SSU rRNA gene sequences reported in this study have been deposited in the NCBI under the accesion numbers: GQ346856, GQ349233, GQ347199, HQ163221, GQ350623, GQ349295. The SSU rRNA pyrotag sequences reported in this study have been deposited in the NCBI under the accession numbers: SAMN03387532–SAMN03387915. Metagenomes reported in this study have been deposited in the NCBI under the accession numbers: SAMN05224436, SAMN05224437, SAMN05224442, SAMN05224443, SAMN05224447, SAMN05224451. Metatranscriptomes reported in this study have been deposited in the NCBI under the accession numbers: SAMN05238739, SAMN05238741, SAMN05238743, SAMN05238745, SAMN05238748, SAMN05238751.
Results
Water Column Conditions
We monitored changes in water column conditions corresponding to the progression of stratification (from winter through mid-summer) and deep water renewal (late summer into fall) events over a 2-year period (May 2008–July 2010). As previously described for OMZs (Wright et al., 2012), in this study we define water column compartments on the basis of O2 concentration ranges: oxic (>90 μM O2), dysoxic (90-20 μM O2), suboxic (20-1 μM O2) and anoxic (<1 μM O2). Between May and August 2008, as water column stratification peaked, suboxic conditions intensified. This intensification corresponded with increasing levels of CH4 and hydrogen sulfide (H2S) below 150 m consistent with the development of deep-water anoxia. Two CH4 concentration peaks were observed, at the subsurface (20–100 m) ranging between the 20–120 nM, and at in the deep basin increasing steadily below 150 m to a maximum of 800 nM at 200 m in late July. Over the same time interval, the concentration of H2S ranged between 2 to 8 μM in the anoxic bottom waters (150–200 m). The concentration of between the surface and 100 m ranged between 5 to 20 μM, decreasing rapidly between 100 and 135 m before reaching a minimum of ≤1 μM in anoxic bottom waters. The concentration of between surface and 135 m ranged between <0.1 and 0.25 μM reaching a maximum 0.3 μM in anoxic bottom waters (150–200 m) (Supplementary Figure 1).
The beginning of 2008 deep-water renewal occurred between the end of July and early September, continuing through November. During this time interval, oxygenated nutrient-rich waters flowed over the sill, displacing anoxic bottom waters upwards and disrupting the redox gradient established during spring and summer months. Between September and October, dissolved O2 was observed throughout the water column, although upwards shoaling O2 and depleted bottom waters produced an intermediate suboxic layer between 100 and 135 m. Concomitantly, CH4 concentrations increased transiently in the suboxic transition zone (120–135 m) ranging between 180 and 700 nM while decreasing below 135 m to 0 nM in bottom waters. In November, O2 and and concentrations continued to increase above 100 and below 135 m with intensification of water column O2 deficiency within intervening depth intervals (Supplementary Figure 1).
Beginning in December 2008 water column O2 deficiency intensified below 100 m consistent with stratification. However, in contrast to previous studies at Saanich Inlet, our observations indicate a significantly weak renewal occurred in fall 2009 as indicated by no measurable increase in O2 or in deep basin waters. This phenomenon extended O2 deficiency below 100 m resulting in CH4 accumulation through the summer of 2010, and corresponded with anoxic conditions below 135 m (O2 and concentrations equal to 0 μM combined with high levels of H2S). Over this period, the concentration of CH4 between surface and 100 m ranged between 20 and 500 nM increasing with depth to reach a maximum 1250 nM in anoxic bottom waters in July 2010. The concentration of H2S ranged between 2–20 μM in the anoxic waters. Over this period, the highest concentration (1.8 μM) was observed at 120 m in July 2010 (Supplementary Figure 1).
Microbial Community Structure
To identify microbial agents driving methane oxidation in the Saanich Inlet water column we analyzed SSU rRNA gene pyrotag sequences from 288 samples collected at 16 depths (10–200 m) over a 2 year time period between May 2008 and July 2010. Results revealed consistent microbial community partitioning as commonly observed in stratified ecosystems where O2 deficiency is associated with redox-driven niche partitioning (Alldredge and Cohen, 1987; Shanks and Reeder, 1993; Wright et al., 2012). For instance, hierarchical cluster analysis (HCA) resolved three major groups or clusters (AU ≥ 70, 1000 iterations) associated with oxic (group I), dysoxic-suboxic (group II), and anoxic (group III) water column conditions (Figure 1A). Consistent with oxycline formation, O2 (R2 = 0.80) and (R2 = 0.63) were negatively correlated with groups II and III (Figure 1B), while positively correlated with NH4 (R2 = 0.26) and H2S (R2 = 0.52) (Figure 1B).
Overall, microbial community composition was dominated (relative abundance >1%) (Rappé and Giovannoni, 2003) by OTUs affiliated with ubiquitous and abundant taxonomic groups previously identified in marine O2 deficient environments (Field et al., 1997; Fuhrman and Davis, 1997; Brown and Donachie, 2007; Tripp et al., 2008; Lavik et al., 2009; Walsh et al., 2009; Zaikova et al., 2010; Walsh and Hallam, 2011; Wright et al., 2012) including SAR11, SAR324, Nitrospina, SUP05, Marine Group A and Methylophilales within the bacterial domain, and Thaumarchaeota within the archaeal domain (Figure 2). Consistent with previous observations in OMZs (Stevens and Ulloa, 2008; Glaubitz et al., 2010), OTUs affiliated with Methylococcaceae and Methylomonas, both canonical type I methanotrophs, were identified among the rare biosphere (relative abundance <1%) (Sogin et al., 2006). Additionally, OTUs affiliated with methylotrophic bacteria such as Methylobacteriaceae and Methylophaga, were also identified among the rare biosphere (Figure 3A).
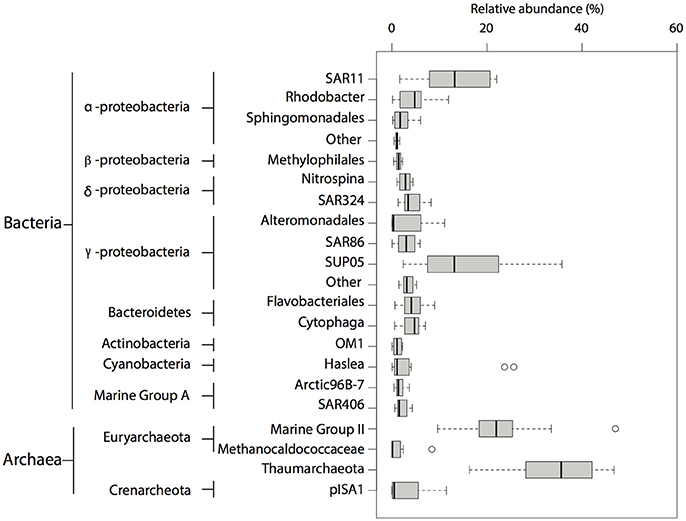
Figure 2. Taxonomic composition of OTUs identified in SSU rRNA gene pyrotags between 2008 and 2010. Abundant (>1% relative abundance) taxa found in pyrotag dataset. The size of each box represents the average of relative abundance (>0.01%) calculated from the total number of prokaryotic reads throughout the water column over this period. Extended dashed lines (whiskers) represent at the base the lower and upper quartiles (25 and 75%) and at the end the minimum and maximum values encountered. The middle line represents the median.
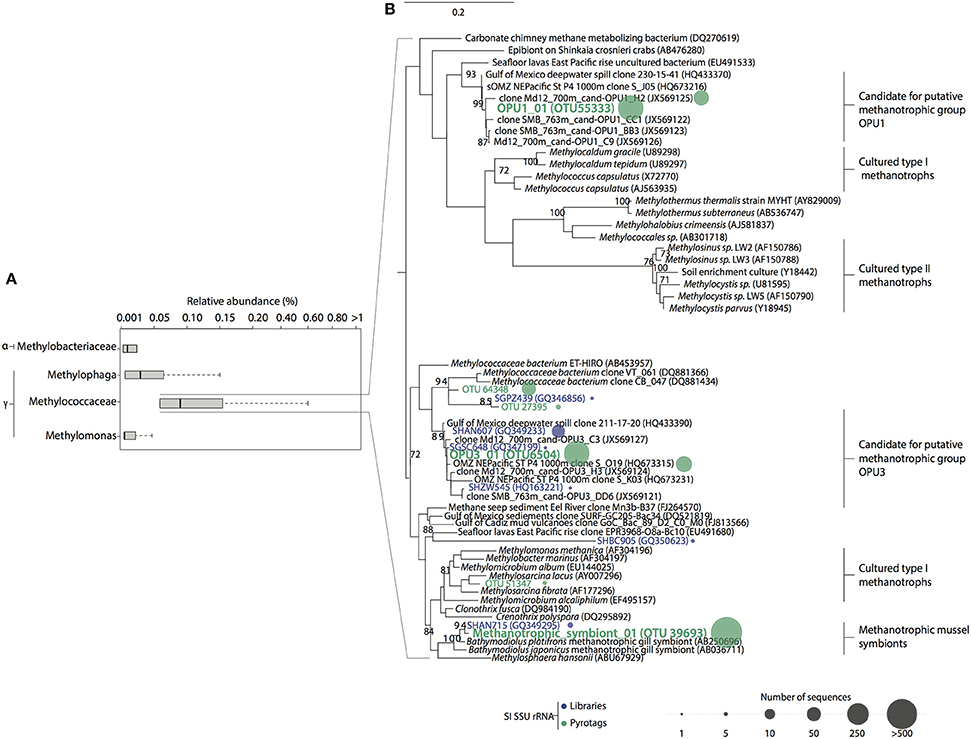
Figure 3. Relative abundance and phylogenetic relationships between Type I and Type II methanotroph OTUs in Saanich Inlet. (A) Rare (<1% relative abundance) methanotrophic and methylotrophic taxa found in SSU rRNA gene pyrotag dataset. The size of each box represents the average of relative abundance (>0.01%) calculated from the total number of prokaryotic reads throughout the water column over this period. Extended dashed lines (whiskers) represent at the base the lower and upper quartiles (25 and 75%) and at the end the minimum and maximum values encountered. The middle line represents the median. (B) Tree inferred using maximum likelihood implemented in PHYML. The percentage (≥70%) of replicates in which the associated taxa clustered together in the bootstrap test (1000 replicates) is shown next to the branches. Reference sequences for lineages are shown in black. Representative sequences obtained from Saanich Inlet SSU rRNA gene libraries clustered at 97% similarity are shown in blue. OTUs representative sequences (97% similarity) from pyrotag datasets taxonomically identified as methanotrophs are shown in green. Sequences abundance is depicted by colored circles whose circumference indicated the total number of sequences (reads) within the cluster.
Methanotroph Diversity and Dynamics
Methanotroph diversity in Saanich Inlet was determined based on recruitment of representative OTU sequences to full-length SSU rRNA gene reference sequences (full description of reference sequences used in Methods). Initially, we identified all OTUs with a taxonomic assignment affiliated with methanotrophic bacteria using BLAST-based comparisons conducted in QIIME queried against the Silva and Greengenes reference databases. Sequences affiliated with these OTUs shared 90% identity with Methylococcales reference sequences in Silva, and 90% identity with Methylococcaceae and Methylomonas reference sequences in Greengenes. Subsequently, further analysis on representative methanotrophic OTUs was conducted using full-length SSU rRNA gene sequences as fragment recruitment platforms. A total of 3804 sequences affiliated with type I methanotrophs were recovered, representing 0.095% of the total pyrotag sequences generated. Sequences clustered at 97% identity resolved into 66 distinct OTUs, 6 of which contained 75% of total methanotroph sequences. Similar to full-length SSU sequences, pyrotag OTUs revealed 4 subgroups with phylogenetic similarity to cultured and environmental representatives of type I methanotrophs: Methylococcaceae (4%) (Mou et al., 2008), putative methanotrophic groups OPU1 (22.55%) and OPU3 (26.23%) (Hayashi et al., 2007; Tavormina et al., 2010, 2013), and methanotrophic symbionts (46.89%) (Streams et al., 1997; Dubilier et al., 2008; Petersen and Dubilier, 2009; Figure 3). The most abundant OTUs were related to putative methanotrophic OPU1 (OPU_01 = OTU55333; 16.9%), OPU3 (OPU3_01 = OTU6504; 8.4%), and methanotrophic symbionts (Symbiont_01 = OTU39693; 45.5%) (Figure 3B), comprising ~70% of total methanotroph sequences found in the pyrotag datasets. Based on this information we focused our analysis on these three groups.
Population dynamics of OPU1_01, OPU3_01 and Symbiont_01 were determined throughout the water column between May 2008 and July 2010. OPU1_01 and OPU3_01 were more abundant under dysoxic (<90 μM O2) and suboxic (≤20 μM O2) conditions while Symbiont_01 was more abundant under suboxic and anoxic (≤3 μM O2) conditions (Figure 4A). Specifically, OPU1_01 showed two abundance peaks: (1) after the 2008 renewal (September–November) reaching up to 0.24% relative abundance under suboxic conditions (150 and 165 m), and (2) during water column stratification (March and April 2009) reaching up to 0.15% relative abundance under oxic conditions (10–85 m). OPU3_01 peaked during stratification periods (July–August 2008 and March–April 2009) reaching up to 0.15% relative abundance under oxic and dysoxic conditions (10–97 m), and during the extended stratification in July 2010 reaching up to 0.2% relative abundance under suboxic conditions (120–135 m, Figure 4B). Symbiont_01 also showed two abundance peaks: (1) during the 2008 stratification (May–July) reaching up to 0.23% relative abundance, and (2) after the 2008 renewal (November–January 2009) reaching up to 0.6% relative abundance under oxic conditions (40–97 m), and 0.55% under suboxic—anoxic (165–200 m) conditions (Supplementary Figure 2). Cumulative abundance for methanotroph OTUs throughout the water column indicated co-occurrence and peak abundance under dysoxic-suboxic water column conditions over time, suggesting that the highest CH4 oxidation activity is carried out between these depth intervals in Saanich Inlet (Supplementary Figure 2 and Figure 3).
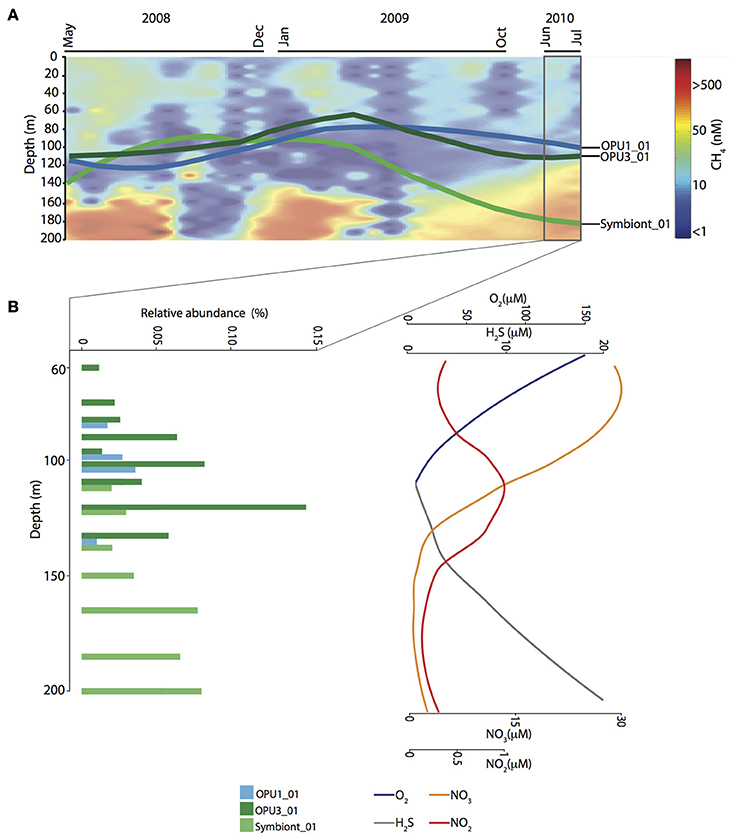
Figure 4. Time-series observations for methanotrophic OTUs affiliated with OPU1, OPU3, and methanotrophic symbiont groups. (A) Methane contour plot for gas concentration (nM) data throughout water column from May 2008 to July 2010. Overlapped is shown the OTUs distribution mean trend throughout water column over time. (B) Vertical distribution and relative abundance of methanotrophic OTUs over extended stratification period (June–July 2010). On the right, sparklines depict concentration trend for Oxygen (O2), Sulfide (H2S), Nitrate (), and Nitrite ().
Observed OTU distribution patterns for OPU1_01, OPU3_01 and Symbiont_01 became increasingly compartmentalized during the extended stratification period. For instance, OPU1_01 was observed under dysoxic conditions (90–110 m) and OPU3_01 under dysoxic-suboxic conditions (100–135 m), while Symbiont_01 under suboxic-anoxic conditions (135–200 m) (Figure 4). These observations point to redox-driven niche partitioning among methanotrophic bacteria with the potential to mediate CH4 oxidation in different water column compartments. Given these distribution patterns in relation to measured geochemical profiles i.e., OPU3 and (Figure 4B), we hypothesized the use of alternative terminal electron acceptors in the CH4 oxidation process.
PmoA Diversity and Expression
Given the distribution of OPU1_01, OPU3_01 and Symbiont_01 OTUs in the Saanich Inlet water column we were interested in determining functional potential and activity of these groups. This was determined based on the number of conceptually translated pmoA genes and transcripts found throughout the water column in February 2010 and the recruitment of water column PmoA sequences to selected reference sequences (see Methods). Initially, we identified all sequences with a functional assignment affiliated with PmoA using the MetaPathways functional annotation table output. Similar to observations made for methanotroph OTU abundance, PmoA sequences recovered in the metagenomic and metatranscriptomic datasets were rare, representing ≤0.001% (34 sequences) and ≤0.018% (26 sequences) from the total number of predicted proteins in the metagenomic and metatranscriptomic datasets, respectively. Representative sequences in pmoA clone libraries were mostly related to OPU3 (Hayashi et al., 2007), and methanotrophic symbionts within the type I methanotroph clade. However, all February 2010 metagenomic, and metatrasncriptomic PmoA representative sequences clustered at 97% similarity were related to OPU3 (Hayashi et al., 2007) (Figure 5). Corresponding metatransciptome RPKM values for pmoA in February 2010 showed differential expression across the redox transition zone under dysoxic-suboxic conditions. Transcript expression, depicted as dots sized based on RPKM values (Figure 5), was higher at 100 m (mean RPKM = 124, SD = 12.10) than at 120 (mean RPKM = 15.25, SD = 7.33) and 135 m (mean RPKM = 17.05, SD = 0.58) potentially indicating the boundaries for OPU-mediated CH4 oxidation in the Saanich Inlet under water column stratification conditions (Figure 5).
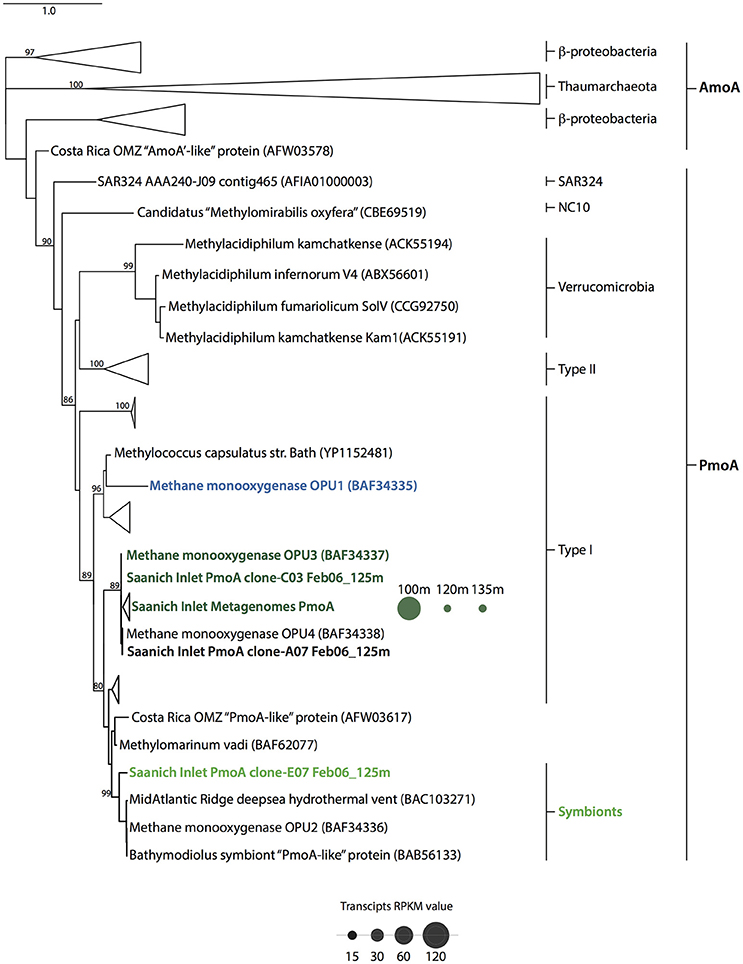
Figure 5. Particulate methane monooxygenase subunit β (pmoA) phylogenetic tree. Topography was inferred using maximum likelihood on PmoA and AmoA amino acid sequences from reference sequences including pMMO-encoding groups OPU1 and OPU3, and symbionts. Bootstrap values (%) are based on 100 replicates and are shown for branches with greater than 70% support. The scale bar represents 0.5 substitutions per site. PmoA distribution throughout water column (100–135 m) is depicted as dots whose size represents the average RPKM value for February 2010 metatranscriptomic datasets.
Methanotroph Niche Partitioning and Co-occurrence Patterns
To better constrain niche partitioning among methanotrophic bacteria and the potential use of alternative terminal electron acceptors, i.e., and , we conducted multivariate linear and beta regression analyses on the time-series data. Multivariate regression allowed us to minimize the possible linear effect of depth on OTU distribution while beta regression allowed us to use environmental and relative abundance data to model variable correlations (Kieschnick and Mccullough, 2003; Ferrari and Cribari-Neto, 2004). Multivariate analysis showed significant positive correlation (p < 0.001) between OPU1_01 and OPU3_03 over stratification periods. However, negative correlation (p < 0.01) between OPU1_01 and symbiont_01 was also observed during these time periods. In addition, significant positive correlation (p < 0.0001) between OPU3_01 and Symbiont_01 was also observed during transitioning to stratification periods (Supplementary Figure 2) (Table 1). Negative binomial regression results on the time-series data indicated OPU1_01 distribution was significantly and negatively correlated with O2 (p < 0.05) and CH4 (p < 0.001) and weakly correlated with , and H2S. OPU3_01 distribution was significantly and negatively correlated with CH4 (p < 0.001) and (p < 0.05), and weakly correlated with and H2S (Table 2, Figure 4). Symboint_01 distribution was weakly significantly and negatively correlated with CH4, H2S, , and (p < 0.001), and weakly correlated with O2 (Table 2).
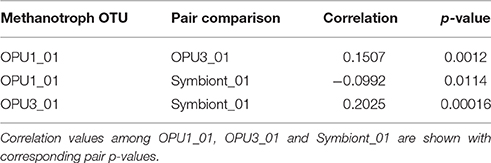
Table 1. Multivariate regression statistics for methanotroph OTUs.
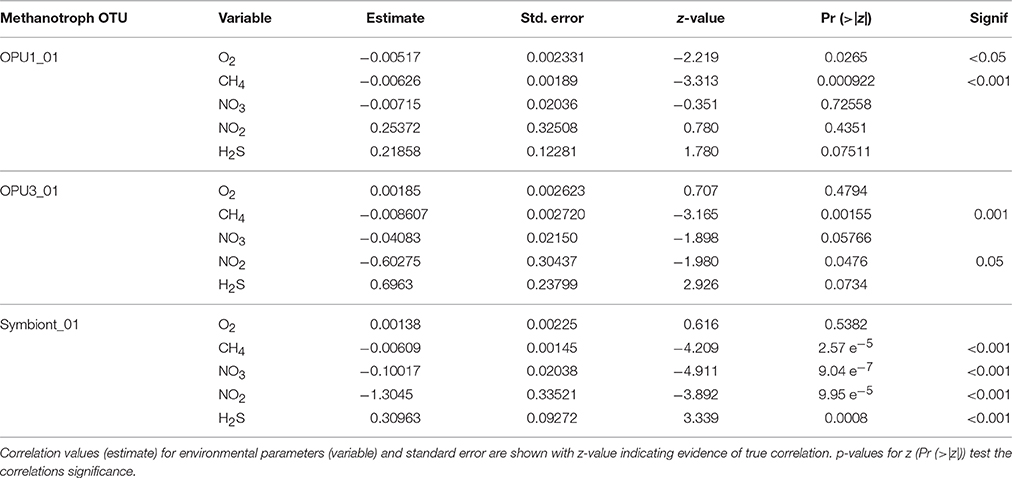
Table 2. Negative binomial regression statistics for methanotroph OTUs.
To identify characteristic OTUs occurring under specific water column oxygen conditions, multi-level indicator species analysis (ISA) was conducted based on groups resolved in HCA. A co-occurrence network was then constructed to identify potential interactions with methanotrophic OTUs. Multi-level ISA identified OTUs affiliated with one carbon (C1) utilizing microorganisms including Methylophilales, Methylophaga, SAR324, Verrucomicrobia and Planctomycetes. SAR324 and Verrucomicrobia were indicators for oxic and anoxic water column conditions while Methylophilales and Methylophaga were indicators for suboxic and anoxic water column conditions. The indicator OTUs affiliated with Planctomycetes were evenly distributed throughout the water column (Supplementary Tables 1–3). OPU1_01 was identified as an indicator species for dysoxic-suboxic water column conditions, while no OTUs affiliated with OPU3_01, or Symbiont_01 were identified as indicator species for a particular water column condition. However, OPU3_01 and Symbiont_01, as well as OTU20751, affiliated with the OPU3 group, were identified as indicators for combined oxic and dysoxic-suboxic conditions (Supplementary Table 2).
Co-occurrence analysis based on Bray-Curtis and Spearman correlation values among OTUs, resulted in a microbial network (Figure 6A) partitioned in modules similar to hierarchical clustered groups associated with oxic (I), dysoxic-suboxic (II and III), and anoxic (IV) water column compartments (Supplementary Figure 1). Interestingly, significant positive correlations (CV > 0.6, p < 0.001), shown as sub-networks (Supplementary Figure 1, Table 5), were observed among OPU1_01, OPU3_01 and Symbiont_01 with indicator OTUs affiliated with potential C1 utilizing microorganisms such as Methylophaga, Methylophilales, SAR324, Verrucomicrobia and Planctomycetes, and other ubiquitous OMZ microbes including representative taxa such as Marine Group A, Nitrospina, and SUP05 (Figure 6B, Supplementary Table 4). To provide further evidence for potential methanotroph interactions observed in sub-networks we compared microbial OTUs to SSU rRNA gene sequences recovered from previous CH4 microcosm experiments using Saanich Inlet suboxic waters (Sauter et al., 2012) (Supplementary Figure 2). Most bacterial OTUs (83% of OTUs in sub-networks) were found affiliated (≥80% identity) to microcosm SSU rRNA sequences that were enriched and active after CH4 addition, and related to Bacteroidetes, Marine Group A, Planctomycetes, Sphingomonadales, Nitrospina, Methylophilales, Methylophaga, SUP05 and Verrucomicrobia (Supplementary Table 5) reinforcing co-occurrence network observations.
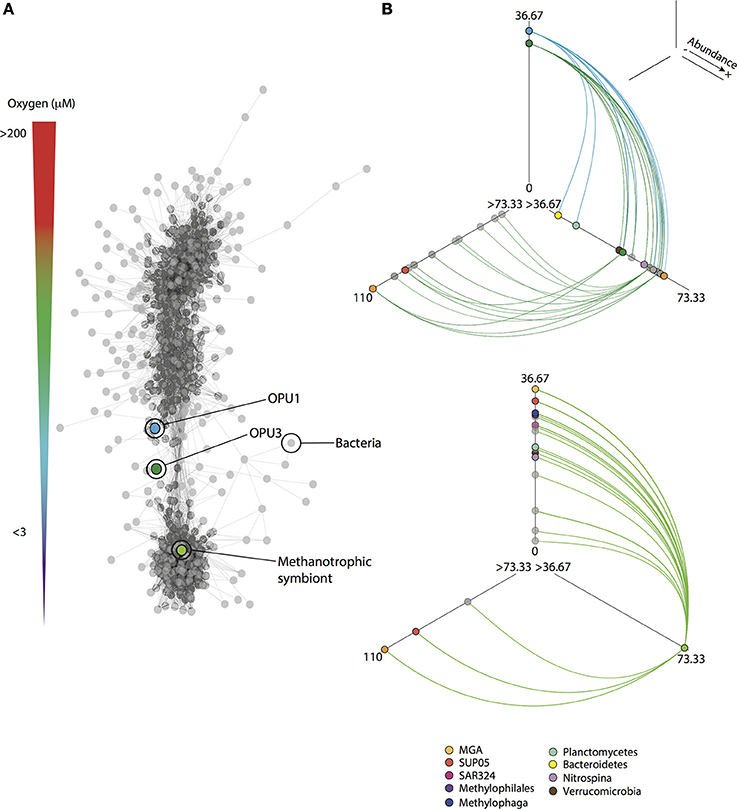
Figure 6. Co-occurrence patterns for methanotrophic and indicator OTUs from SSU rRNA gene pyrotag datasets. (A) Network based on significant (p < 0.001) Bray-Curtis and Spearman correlation values (>0.6) among OTUs that were present in at least 25% (n = 72) of the total number of pyrotag samples (n = 288). On top the oxygen gradient from oxic (>90 μM O2) to anoxic (<1 μM O2) is shown. (B) Hive panels for methanotrophic OPU1 and OPU3, and symbiont OTUs showing interactions with indicator OTUs (taxa colored as shown in key). OTUs are distributed based on abundance (log transformed) on the three axes from less abundant located closer to the center, to more abundant located toward the end of each line. Nodes are depicted according to taxonomy as indicated in network. All interactions (edges) are shown as solid lines. Direct interactions for methanotrophic OTUs to indicators are shown as solid colored lines in hive panels.
Discussion
This study charts methanotroph diversity, abundance, and dynamics in Saanich Inlet, a seasonally anoxic fjord that serves as a model ecosystem for understanding microbial community responses to changing levels of water column O2 deficiency. Our observations encompass an atypical extended water column stratification period in 2010 related to a relatively strong El Niño event (Blunden et al., 2011). This extended stratification period provided an opportunity to observe patterns of redox-driven niche partitioning among methanotrophic community members (Figure 4B), hypothesize the use of alternative electron acceptors i.e., NO3 and NO2 for CH4 oxidation, and determine co-occurrence patterns between community members consistent with differential modes of metabolic coupling driving C1 metabolism along the redoxcline.
Methanotrophic community composition was primarily comprised of rare OTUs affiliated with the OPU1, OPU3, and mussel symbionts. Interestingly, no OTUs affiliated with the NC10 phylum were recovered contrasting recent observations by Padilla and colleagues in the Eastern Tropical North Pacific OMZ off the coasts of northern Mexico and the Costa Rica OMZ (Padilla et al., 2016). The lack of detection of NC10 could reflect differences in water column transport processes or geochemical conditions including O2, NO2 or H2S concentrations. For instance, Padilla and colleagues suggested that NC10 distribution and abundance depended on persistent anoxic conditions and high CH4 concentrations (>1M) (Padilla et al., 2016). With the exception of NC10, methanotophic OTUs inhabiting Saanich Inlet were consistent with previous observations in coastal OMZs (Hayashi et al., 2007; Tavormina et al., 2013), open ocean OMZs (Stevens and Ulloa, 2008; Glaubitz et al., 2010) and other O2 deficient marine environments (Elsaied et al., 2004; Dick and Tebo, 2010; Fuchsman et al., 2011; Kessler et al., 2011; Dick et al., 2013; Lüke et al., 2016) (Supplementary Figure 5) reinforcing the extensibility of Saanich Inlet time series as a model for understanding microbial community dynamics under water column O2 deficiency.
The time-series observations allowed us to observe dynamic abundance and distribution patterns that changed as a function of water column redox conditions as supported by multivariate regression analysis. For instance, OPU1, OPU3, and methanotrophic symbiont OTUs tended to co-occur during periods of deep water renewal (Supplementary Figures 2, 3). However, as the water column became increasingly stratified we observed separation of these OTUs into distinct water column compartments consistent with redox-driven niche partitioning. Our results expand on previous observations of OPU1 and OPU3 distributions in the Costa Rican OMZ water column where under suboxic conditions (O2 > 7 μM) OPU1 was more abundant than OPU3. In comparison, OTUs related to methanotrophic symbionts were more abundant under suboxic conditions where O2 concentrations were under the detection limit (4 μM), and under anoxic sulphidic conditions, similar to observations made in other O2 deficient waters including deep-sea hydrothermal vents (Elsaied et al., 2004; Dick and Tebo, 2010).
Regression analysis between OPU1, OPU3, methanotrophic symbiont OTUs, and geochemical data suggested the potential use of alternative electron acceptors including and . This statistical observation is consistent with previous enrichment and isolation studies focused on different methanotrophic groups. For example, Nitrite driven anaerobic methane oxidation has been previously reported for members of the NC10 candidate division. Although primarily identified in fresh water environments, a recent study off the coasts of northern Mexico and Costa Rica reported presence and activity of NC10 in pelagic OMZ waters (Padilla et al., 2016). Although no conclusive rate measurements were provided for methane oxidation by NC10, transcripts encoding nitric oxide (NO) reductase involved in NO dismutation to O2 were detected in association with peak and CH4 concentrations. The potential for OPU or methanotrophic symbionts to use or to drive CH4 oxidation under suboxic or anoxic conditions (e.g., O2 limited methane oxidation by facultative denitrifying aerobic methanotrophs) presents important stoichiometric considerations. In order for the reaction to occur at a CH4 concentration equal to 341 nM below 120 m, a minimum of 0.015 nmol and 0.042 nmol are required based on the CH4: and CH4: consumption ratio reported by Cuba and colleagues for batch reactors amended with CH4, , and (Cuba et al., 2011). Given the average and concentrations of 6.5 and 0.2 μM respectively in Saanich Inlet, this coupled mechanism for CH4 oxidation and / reduction is permissive.
The use of nitrogen species and to drive CH4 oxidation in type I methanotrophs has also been indicated under bioreactor, microcosms and isolated culture conditions (Cuba et al., 2011; Hernandez et al., 2015; Kits et al., 2015). Cuba and colleagues observed increased CH4 loss in the batch reactors amended with (0.52 mol CH4 g−1 ) or (0.17 mol CH4 g−1 ) followed by community DGGE profile indicating an enrichment in Methylomonas sp. SSU rRNA sequences in amended bioreactors (Cuba et al., 2011). Consistent with this observation, Kits and colleagues recently reported that Methylomonas denitrificans strain FJG1T couples CH4 oxidation to reduction under O2 limiting anoxic conditions (<50 nM) resulting in N2O production (Kits et al., 2015). In addition, Hernandez and colleagues reported Methylobacter sp. as a dominant methanotroph encoding respiratory nitrate and nitrite reductase genes under dysoxic or suboxic O2 conditions (15–75 μM) in Lake Washington microcosm experiment, indicating potential use of and as alternative electron acceptors under low O2 conditions (Hernandez et al., 2015). Given the absence of NC10 OTUs in our time series observations it will be of interest to determine if convergent mechanisms of NO dismutation or reduction are used by OPU or methanotrophic symbionts.
Using time-series measurements, Capelle and colleagues have recently identified a persistent CH4 minimum at 110 m near the oxic-anoxic interface (Capelle et al., in review) correlating with the highest CH4 oxidation rates (2 nmol L−1 d−1) observed in Saanich Inlet (Ward et al., 1989). These studies suggested methanotrophs were more abundant and/or metabolically active in the oxycline than in the upper water column. Based on cumulative methanotroph abundance (2.1–2.8% relative abundance) under suboxic conditions (100–150 m) it is possible to identify OPU1, OPU3 and methanotrophic symbionts as the primary drivers of CH4 oxidation in the Saanich Inlet water column (Supplementary Figure 4). Interestingly, CH4 oxidation rates measured in Saanich Inlet are very similar to those reported in the Costa Rica OMZ (2.6 nmol d−1; 4-fold nitrite driven anaerobic methane oxidation rate) (Padilla et al., 2016) where OPU1 and OPU3 were the most abundant methanotrophic groups identified. In support of this observation, we recovered pmoA ORFs corresponding to OPU3 during an extended stratification period in February 2010. Interestingly, only OPU3 PmoA related sequences were found for this period, probably due to the higher abundance of this group. This was reflected in the relative abundance of OPU3 16S rRNA sequences (up to 0.15%) when compared with those from OPU1 and methanotrophic symbiont groups (~0.02% relative abundance) suggesting the potential capability for OPU3 to thrive under extended O2 deficiency by using alternative electron acceptors. Activity of this group was inferred based on recovery of pmoA transcripts affiliated with OPU3 under dysoxic-suboxic water column conditions throughout 100–135 m depth intervals (Figure 5). Similar observations in the Guaymas Basin indicated that pmoA transcripts were more abundant (~0.32–1% from total KEGG annotations in metatranscriptome dataset) in dysoxic deep-sea hydrothermal plume samples (~27 μM O2) and related to sequences retrieved from the Santa Monica Basin and North Fiji hydrothermal vent field, and hydrocarbon plumes from the Deepwater Horizon oil spill in the Gulf of Mexico (Lesniewski et al., 2012). These sequences form the widely distributed OPU3 group of monooxygenases from uncultivated organisms, which are thought to have important roles in the oxidation of methane in O2 deficient waters (Tavormina et al., 2010; Lesniewski et al., 2012). Based on this information we consider the potential activity of OPU3 under dysoxic-suboxic water column conditions in Saanich Inlet. Based on the published CH4 oxidation rate (2 nmol L−1 d−1) and the total volume of the dysoxic-suboxic waters between 100 and 135 m (~3.250 × 10⁹ L) over 1 year in Saanich Inlet, OPU3 have the potential to consume ~37.96 kg CH4 year−1. One kilogram of CH4 has a radiative forcing equal to 0.48 W m−2 with an atmospheric lifetime of 12 years, and a global warming potential (GWP) of 23 (eight-fold CO2 GWP for 100 years) (IPCC, 2013). Thus, methanotrophs in Saanich Inlet filter 18.2 W m−2 equivalent to 450 years of radiative forcing that could be released to the atmosphere each year. Although there is more to explore regarding the activity for OPU1 and methanotrophic symbionts under different water column O2 conditions, these results highlight the potential role of OPU3 as an important sink for CH4 along continental margins, and reinforce the extensibility of our time-series observations with implications for modeling CH4 cycling in expanding OMZs.
In addition to methanotroph redox-driven niche partitioning, co-occurrence patterns between C1 utilizing microorganisms were observed in the Saanich Inlet water column consistent with overlapping habitat, shared niche space or preference indicating potential metabolic interactions. In particular, we observed methanotroph OTUs correlating with Bacteroidetes, Planctomycetes, and Methylophilales. These results were consistent with a previous microcosm study using Saanich Inlet waters amended with CH4 revealing marked enrichment of SSU rRNA gene sequences affiliated with methanotrophs, Bacteroidetes, Planctomycetes, and Methylophilales (Sauter et al., 2012). Interestingly, cooperative metabolism between methanotrophic bacteria and potential C1 utilizing microorganisms affiliated with different Bacteroidetes and Methylophilales has been recently observed in incubation studies using sediment samples from Lake Washington (Beck et al., 2013; Hernandez et al., 2015). Results indicated a simultaneous response between Bacteroidetes, Methylophilales and canonical methanotrophs to CH4 addition over a range of O2 concentrations (15–75 μM) (Beck et al., 2013; Hernandez et al., 2015). Although phylogenetic-based observations alone cannot explain underlying mechanisms of metabolite exchange, our co-occurrence observations indicate that CH4 oxidation in Saanich Inlet likely depend on community-level interactions that support the metabolic requirements of methanotrophic agents.
Conclusion
In the present study we used molecular time series observations in combination with geochemical information to determine the methanotrophic community composition and dynamics in Saanich Inlet revealing three rare OTUs affiliated with OPU1, OPU3, and methanotrophic symbiont groups that exhibited redox-driven niche partitioning along changing water column redox gradients. Moreover, we resolved potential novel metabolic strategies including the use of alternative terminal electron acceptors, and metabolic interactions between C1 utilizing microorganisms supporting CH4 oxidation. Combined, our observations provide important baseline information on microbial agents that reduce the flux of climate active trace gases from ocean to atmosphere and support the potential role of OPU1, OPU3, and methanotrophic symbiont groups as a widely distributed pelagic sink for CH4 along continental margins. Looking forward, we recommend expanded use of multi-omic sequencing in combination with process rate measurements to determine coverage of CH4 oxidation pathways including all reactions implicated in biological CH4 transformation and C1 transfer. In addition, isotopic labeling and incubation coupled with gene expression studies should be conducted to link CH4 oxidation pathways and process rates to specific microbial agents along defined water column redoxgradients on regional and global scales to better constrain the CH4 filtering capacity of coastal and open ocean OMZs.
Author Contributions
SJH and PDT design the research for the time-series; AKH collected samples; AKH and MT-B performed laboratory work; AKH, MT-B, and SJH interpreted the data; DWC performed gas analyses and contributed to data interpretation; MPB and WED contributed to statistical analyses; MT-B and SJH wrote the paper; SJH supervised the group.
Conflict of Interest Statement
The authors declare that the research was conducted in the absence of any commercial or financial relationships that could be construed as a potential conflict of interest.
The reviewer MD and handling Editor declared their shared affiliation, and the handling Editor states that the process nevertheless met the standards of a fair and objective review.
Acknowledgments
We thank the Joint Genome Institute (JGI), including Susannah Tringe, Stephanie Malfatti, and Tijana Glavina del Rio, for technical and project management assistance. We thank Captain Ken Brown and his crew for all their support aboard The RSV Strickland, as well as our sea-going technicians at UBC, Chris Payne and Laura Pakhomova. We thank Rich Pawlowicz and the UBC Department of Earth, Ocean & Atmospheric Sciences (EOAS) for the generous use of the EOAS CTD. We also thank past and present members of the Hallam lab, specially including Melanie Scofield and Andreas Mueller, and the many undergraduate trainees for their contributions to cruise preparation and clean up, water filtration, analytic chemistry and genomic information sequencing. We thank Aria Hahn for her valuable insight into network analysis. This work was performed under the auspices of the US Department of Energy (DOE) JGI supported by the Office of Science of US DOE Contract DE-AC02- 05CH11231, the G. Unger Vetlesen and Ambrose Monell Foundations, the Tula Foundation-funded Centre for Microbial Diversity and Evolution, the Natural Sciences and Engineering Research Council of Canada (NSERC), the Canada Foundation for Innovation, the Canadian Institute for Advanced Research through grants awarded to SJH. MT-B was funded by Consejo Nacional de Ciencia y Tecnología (CONACyT) and the Tula Foundation.
Supplementary Material
The Supplementary Material for this article can be found online at: https://www.frontiersin.org/article/10.3389/fmars.2016.00268/full#supplementary-material
References
Akaike, H. (1998). “A new look at the statistical model identification,” in Selected Papers of Hirotugu Akaike, eds E. Parzen, K. Tanabe, and G. Kitagawa (New York, NY: Springer New York), 215–222.
Alldredge, A. L., and Cohen, Y. (1987). Can microscale chemical patches persist in the sea? Microelectrode study of marine snow, fecal pellets. Science 235, 689–691. doi: 10.1126/science.235.4789.689
Allers, E., Wright, J. J., Konwar, K. M., Howes, C. G., Beneze, E., Hallam, S. J., et al. (2013). Diversity and population structure of marine group A bacteria in the Northeast subarctic Pacific Ocean. ISME J. 7, 256–268. doi: 10.1038/ismej.2012.108
Altschul, S. F., Gish, W., Miller, W., Myers, E. W., and Lipman, D. J. (1990). Basic local alignment search tool. J. Mol. Biol. 215, 403–410. doi: 10.1016/S0022-2836(05)80360-2
Beck, D. A. C., Kalyuzhnaya, M. G., Malfatti, S., Tringe, S. G., Glavina Del Rio, T., Ivanova, N., et al. (2013). A metagenomic insight into freshwater methane-utilizing communities and evidence for cooperation between the Methylococcaceae and the Methylophilaceae. PeerJ 1:e23. doi: 10.7717/peerj.23
Blunden, J., Arndt, D. S., and Baringer, M. O. (2011). State of the Climate in 2010. Bull. Am. Meteorol. Soc. 92, S1–S236. doi: 10.1175/1520-0477-92.6.S1
Brown, M. V., and Donachie, S. P. (2007). Evidence for tropical endemicity in the deltaproteobacteria marine group B/SAR324 bacterioplankton clade. Aquat. Microb. Ecol. 46, 107–115. doi: 10.3354/ame046107
Capelle, D., Dacey, J., and Tortell, P. D. (2015). An automated, high-throughput method for accurate and precise measurements of dissolved nitrous-oxide and methane concentrations in natural seawaters. Limnol. Oceanogr. Methods. 13, 345–355. doi: 10.1002/lom3.10029
Caporaso, J. G., Kuczynski, J., Stombaugh, J., Bittinger, K., Bushman, F. D., Costello, E. K., et al. (2010). QIIME allows analysis of high-throughput community sequencing data. Nat. Methods 7, 335–336. doi: 10.1038/nmeth.f.303
Costello, A. M., and Lidstrom, M. E. (1999). Molecular characterization of functional and phylogenetic genes from natural populations of methanotrophs in lake sediments. Appl. Environ. Microbiol. 65, 5066–5074.
Cuba, R. M. F., Duarte, I. C., Saavedra, N. K., Varesche, M. B. A., and Foresti, E. (2011). Denitrification coupled with methane anoxic oxidation and microbial community involved identification. Braz. Arch. Biol. Technol. 54, 173–182. doi: 10.1590/S1516-89132011000100022
De Cáceres, M., and Legendre, P. (2009). Associations between species and groups of sites: indices and statistical inference. Ecology. 9, 3566–3574. doi: 10.1890/08-1823.1
Desantis, T. Z., Hugenholtz, P., Larsen, N., Rojas, M., Brodie, E. L., Keller, K., et al. (2006). Greengenes, a chimera-checked 16S rRNA gene database and workbench compatible with ARB. Appl. Environ. Microbiol. 72, 5069–5072. doi: 10.1128/AEM.03006-05
Diaz, R. J., and Rosenberg, R. (2008). Spreading dead zones and consequences for marine ecosystems. Science 321, 926–929. doi: 10.1126/science.1156401
Dick, G. J., Anantharaman, K., Baker, B. J., Li, M., Reed, D. C., and Sheik, C. S. (2013). The microbiology of deep-sea hydrothermal vent plumes: ecological and biogeographic linkages to seafloor and water column habitats. Front. Microbiol. 4:124. doi: 10.3389/fmicb.2013.00124
Dick, G. J., and Tebo, B. M. (2010). Microbial diversity and biogeochemistry of the Guaymas Basin deep-sea hydrothermal plume. Environ. Microbiol. 12, 1334–1347. doi: 10.1111/j.1462-2920.2010.02177.x
Dubilier, N., Bergin, C., and Lott, C. (2008). Symbiotic diversity in marine animals: the art of harnessing chemosynthesis. Nat. Rev. Microbiol. 6, 725–740. doi: 10.1038/nrmicro1992
Dunfield, P. F., Yuryev, A., Senin, P., Smirnova, A. V., Stott, M. B., Hou, S., et al. (2007). Methane oxidation by an extremely acidophilic bacterium of the phylum Verrucomicrobia. Nature 450, 879–882. doi: 10.1038/nature06411
Elsaied, H. E., Hayashi, T., and Naganuma, T. (2004). Molecular analysis of deep-sea hydrothermal vent aerobic methanotrophs by targeting genes of 16S rRNA and particulate methane monooxygenase. Mar. Biotechnol. 6, 503–509. doi: 10.1007/s10126-004-3042-0
Ettwig, K. F., Butler, M. K., Le Paslier, D., Pelletier, E., Mangenot, S., Kuypers, M. M. M., et al. (2010). Nitrite-driven anaerobic methane oxidation by oxygenic bacteria. Nature 464, 543–548. doi: 10.1038/nature08883
Faust, K., Sathirapongsasuti, J. F., Izard, J., Segata, N., Gevers, D., Raes, J., et al. (2012). Microbial co-occurrence relationships in the human microbiome. PLoS Comput. Biol. 8:e1002606. doi: 10.1371/journal.pcbi.1002606
Ferrari, S., and Cribari-Neto, F. (2004). Beta regression for modelling rates and proportions. J. Appl. Stat. 31, 799–815. doi: 10.1080/0266476042000214501
Field, K. G., Gordon, D., Wright, T., Rappé, M., Urback, E., Vergin, K., et al. (1997). Diversity and depth-specific distribution of SAR11 cluster rRNA genes from marine planktonic bacteria. Appl. Environ. Microbiol. 63, 63–70.
Fox, J., and Weisberg, S. (2011). Multivariate Linear Models in R. An R Companion to Applied Regression 2nd Edn. California: Sage Publications.
Fuchsman, C. A., Kirkpatrick, J. B., Brazelton, W. J., Murray, J. W., and Staley, J. T. (2011). Metabolic strategies of free-living and aggregate-associated bacterial communities inferred from biologic and chemical profiles in the Black Sea suboxic zone. FEMS Microbiol. Ecol. 78, 586–603. doi: 10.1111/j.1574-6941.2011.01189.x
Fuhrman, J. A., and Davis, A. A. (1997). Widespread archaea and novel bacteria from the deep sea as shown by 16S rRNA gene sequences. Oceanogr. Lit. Rev. 150, 275-285. doi: 10.3354/meps150275
Fung, I., John, J., Lerner, J., Matthews, E., Prather, M., Steele, L. P., et al. (1991). Three-dimensional model synthesis of the global methane cycle. J. Geophys. Res. 96, 13033–13065. doi: 10.1029/91jd01247
Glaubitz, S., Labrenz, M., Jost, G., and Jürgens, K. (2010). Diversity of active chemolithoautotrophic prokaryotes in the sulfidic zone of a Black Sea pelagic redoxcline as determined by rRNA-based stable isotope probing. FEMS Microbiol. Ecol. 74, 32–41. doi: 10.1111/j.1574-6941.2010.00944.x
Guindon, S., Lethiec, F., Duroux, P., and Gascuel, O. (2005). PHYML Online—a web server for fast maximum likelihood-based phylogenetic inference. Nucleic Acids Res. 33, W557–W559. doi: 10.1093/nar/gki352
Hawley, A. K., Brewer, H. M., Norbeck, A. D., Paša-Tolić, L., and Hallam, S. J. (2014). Metaproteomics reveals differential modes of metabolic coupling among ubiquitous oxygen minimum zone microbes. Proc. Natl. Acad. Sci. U.S.A. 111, 11395–11400. doi: 10.1073/pnas.1322132111
Hayashi, T., Obata, H., Gamo, T., Sano, Y., and Naganuma, T. (2007). Distribution and phylogenetic characteristics of the genes encoding enzymes relevant to methane oxidation in oxygen minimum zones of the Eastern Pacific Ocean. Res. J. Environ. Sci. 1, 275–284. doi: 10.3923/rjes.2007.275.284
Hernandez, M. E., Beck, D. A. C., Lidstrom, M. E., and Chistoserdova, L. (2015). Oxygen availability is a major factor in determining the composition of microbial communities involved in methane oxidation. PeerJ 3:e801. doi: 10.7717/peerj.801
Holmes, A. J., Costello, A., Lidstrom, M. E., and Murrell, J. C. (1995). Evidence that participate methane monooxygenase and ammonia monooxygenase may be evolutionarily related. FEMS Microbiol. Lett. 132, 203–208. doi: 10.1111/j.1574-6968.1995.tb07834.x
IPCC (2013). Climate Change 2013: The Physical Science Basis. Contribution of Working Group I to the Fifth Assessment Report of the Intergovernmental Panel on Climate Change. Cambridge; New York, NY: Cambridge University Press.
Keeling, R. F., Körtzinger, A., and Gruber, N. (2009). Ocean deoxygenation in a warming world. Ann. Rev. Mar. Sci. 2, 199–229. doi: 10.1146/annurev.marine.010908.163855
Kessler, J. D., Valentine, D. L., Redmond, M. C., Du, M., Chan, E. W., Mendes, S. D., et al. (2011). A persistent oxygen anomaly reveals the fate of spilled methane in the deep gulf of Mexico. Science 331, 312–315. doi: 10.1126/science.1199697
Kieschnick, R., and Mccullough, B. D. (2003). Regression analysis of variates observed on (0, 1): percentages, proportions and fractions. Stat. Model. 3, 193–213. doi: 10.1191/1471082X03st053oa
Kits, K. D., Klotz, M. G., and Stein, L. Y. (2015). Methane oxidation coupled to nitrate reduction under hypoxia by the gammaproteobacterium methylomonas denitrificans, sp. nov. type strain FJG1. Environ. Microbiol. 17, 3219–3232. doi: 10.1111/1462-2920.12772
Knittel, K., and Boetius, A. (2009). Anaerobic oxidation of methane: progress with an unknown process. Annu. Rev. Microbiol. 63, 311–334. doi: 10.1146/annurev.micro.61.080706.093130
Konwar, K. M., Hanson, N. W., Bhatia, M. P., Kim, D., Wu, S.-J., Hahn, A. S., et al. (2015). MetaPathways v2.5: quantitative functional, taxonomic and usability improvements. Bioinformatics 31, 3345–3347. doi: 10.1093/bioinformatics/btv361
Konwar, K. M., Hanson, N. W., Pagé, A. P., and Hallam, S. J. (2013). MetaPathways: a modular pipeline for constructing pathway/genome databases from environmental sequence information. BMC Bioinformatics 14:202. doi: 10.1186/1471-2105-14-202
Lam, P., Lavik, G., Jensen, M. M., van de Vossenberg, J., Schmid, M., Woebken, D., et al. (2009). Revising the nitrogen cycle in the Peruvian oxygen minimum zone. Proc. Natl. Acad. Sci. U.S.A. 106, 4752–4757. doi: 10.1073/pnas.0812444106
Lavik, G., Stührmann, T., Brüchert, V., van der Plas, A., Mohrholz, V., Lam, P., et al. (2009). Detoxification of sulphidic African shelf waters by blooming chemolithotrophs. Nature 457, 581–584. doi: 10.1038/nature07588
Lesniewski, R. A., Jain, S., Anantharaman, K., Schloss, P. D., and Dick, G. J. (2012). The metatranscriptome of a deep-sea hydrothermal plume is dominated by water column methanotrophs and lithotrophs. ISME J. 6, 2257–2268. doi: 10.1038/ismej.2012.63
Louca, S., Hawley, A. K., Katsev, S., Torres-Beltran, M., Bhatia, M. P., Kheirandish, S., et al. (2016). Integrating biogeochemistry with multiomic sequence information in a model oxygen minimum zone. Proc. Natl. Acad. Sci. U.S.A. 113, E5925–E5933. doi: 10.1073/pnas.1602897113
Ludwig, W., Strunk, O., Westram, R., Richter, L., Meier, H., Yadhukumar, et al. (2004). ARB: a software environment for sequence data. Nucleic Acids Res. 32, 1363–1371. doi: 10.1093/nar/gkh293
Lüke, C., Speth, D. R., Kox, M. A. R., Villanueva, L., and Jetten, M. S. M. (2016). Metagenomic analysis of nitrogen and methane cycling in the Arabian Sea oxygen minimum zone. PeerJ 4:e1924. doi: 10.7717/peerj.1924
Mou, X., Sun, S., Edwards, R. A., Hodson, R. E., and Moran, M. A. (2008). Bacterial carbon processing by generalist species in the coastal ocean. Nature 451, 708–711. doi: 10.1038/nature06513
Naqvi, S. W. A., Bange, H. W., Farías, L., Monteiro, P. M. S., Scranton, M. I., and Zhang, J. (2010). Marine hypoxia/anoxia as a source of CH4 and N2O. Biogeosciences 7, 2159–2190. doi: 10.5194/bg-7-2159-2010
Padilla, C. C., Bristow, L. A., Sarode, N., Garcia-Robledo, E., Gómez Ramírez, E., Benson, C. R., et al. (2016). NC10 bacteria in marine oxygen minimum zones. ISME J. 10, 2067–2071. doi: 10.1038/ismej.2015.262
Paulmier, A., and Ruiz-Pino, D. (2009). Oxygen minimum zones (OMZs) in the modern ocean. Prog. Oceanogr. 80, 113–128. doi: 10.1016/j.pocean.2008.08.001
Perez, S. (2015). Exploring Microbial Community Structure and Resilience Through Visualization and Analysis of Microbial Co-Occurence Networks. The University of British Columbia.
Petersen, J. M., and Dubilier, N. (2009). Methanotrophic symbioses in marine invertebrates. Environ. Microbiol. Rep. 1, 319–335. doi: 10.1111/j.1758-2229.2009.00081.x
Pruesse, E., Quast, C., Knittel, K., Fuchs, B. M., Ludwig, W., Peplies, J., et al. (2007). SILVA: a comprehensive online resource for quality checked and aligned ribosomal RNA sequence data compatible with ARB. Nucleic Acids Res. 35, 7188–7196. doi: 10.1093/nar/gkm864
Rappé, M. S., and Giovannoni, S. J. (2003). The uncultured microbial majority. Annu. Rev. Microbiol. 57, 369–394. doi: 10.1146/annurev.micro.57.030502.090759
Rcoreteam (2013). R: A Language and Environment for Statistical Computing. Vienna: R Foundation for Statistical Computing. Available online at: URL http://www.R-project.org/
Reeburgh, W. S. (2007). Oceanic Methane Biogeochemistry. Chem. Rev. 107, 486–513. doi: 10.1021/cr050362v
Reeburgh, W. S., Ward, B. B., Whalen, S. C., Sandbeck, K. A., Kilpatrick, K. A., and Kerkhof, L. J. (1991). Black Sea methane geochemistry. Deep Sea Res A Oceanogr. Res. Pap. 38(Suppl. 2), S1189–S1210. doi: 10.1016/S0198-0149(10)80030-5
Santelli, C. M., Orcutt, B. N., Banning, E., Bach, W., Moyer, C. L., Sogin, M. L., et al. (2008). Abundance and diversity of microbial life in ocean crust. Nature 453, 653–656. doi: 10.1038/nature06899
Sauter, L. M., Latypova, E., Smalley, N. E., Lidstrom, M. E., Hallam, S., and Kalyuzhnaya, M. G. (2012). Methanotrophic communities of Saanich Inlet: a microcosm perspective. Syst. Appl. Microbiol. 35, 198–203. doi: 10.1016/j.syapm.2011.10.006
Schloss, P. D., Westcott, S. L., Ryabin, T., Hall, J. R., Hartmann, M., Hollister, E. B., et al. (2009). Introducing mothur: open-source, platform-independent, community-supported software for describing and comparing microbial communities. Appl. Environ. Microbiol. 75, 7537–7541. doi: 10.1128/AEM.01541-09
Shanks, A. L., and Reeder, M. L. (1993). Reducing microzones and sulfide production in marine snow. Mar. Ecol. Prog. Ser. 96, 43–47. doi: 10.3354/meps096043
Shannon, P., Markiel, A., Ozier, O., Baliga, N. S., Wang, J. T., Ramage, D., et al. (2003). Cytoscape: a software environment for integrated models of biomolecular interaction networks. Genome Res. 13, 2498–2504. doi: 10.1101/gr.1239303
Shi, Y., Tyson, G. W., and Delong, E. F. (2009). Metatranscriptomics reveals unique microbial small RNAs in the ocean's water column. Nature 459, 266–269. doi: 10.1038/nature08055
Sogin, M. L., Morrison, H. G., Huber, J. A., Welch, D. M., Huse, S. M., Neal, P. R., et al. (2006). Microbial diversity in the deep sea and the underexplored “rare biosphere.” Proc. Natl. Acad. Sci. 103, 12115–12120. doi: 10.1073/pnas.0605127103
Stevens, H., and Ulloa, O. (2008). Bacterial diversity in the oxygen minimum zone of the eastern tropical South Pacific. Environ. Microbiol. 10, 1244–1259. doi: 10.1111/j.1462-2920.2007.01539.x
Stewart, F. J., Ottesen, E. A., and Delong, E. F. (2010). Development and quantitative analyses of a universal rRNA-subtraction protocol for microbial metatranscriptomics. ISME J. 4, 896–907. doi: 10.1038/ismej.2010.18
Stilwell, C. P. (2007). Microbial Community Dynamics in Saanich Inlet: Insights into Population Structure and Methane Cycling in a Seasonally Anoxic Fjord. Master's Thesis. The University of British Columbia.
Streams, E. M., Fisher, R. C., and Fiala-Médioni, A. (1997). Methanotrophic symbiont location and fate of carbon incorporated from methane in a hydrocarbon seep mussel. Mar. Biol. 129, 465–476. doi: 10.1007/s002270050187
Strous, M., and Jetten, M. S. M. (2004). Anaerobic oxidation of methane and ammonium. Annu. Rev. Microbiol. 58, 99–117. doi: 10.1146/annurev.micro.58.030603.123605
Suzuki, R., and Shimodaira, H. (2015). pvclust: Hierarchical Clustering with P-Values via Multiscale Bootstrap Resampling. R package version 2.0-0. Available online at: http://CRAN.R-project.org/package=pvclust
Swan, B. K., Martinez-Garcia, M., Preston, C. M., Sczyrba, A., Woyke, T., Lamy, D., et al. (2011). Potential for chemolithoautotrophy among ubiquitous bacteria lineages in the dark ocean. Science 333, 1296–1300. doi: 10.1126/science.1203690
Tavormina, P. L., Ussler, W. III., Joye, S. B., Harrison, B. K., and Orphan, V. J. (2010). Distributions of putative aerobic methanotrophs in diverse pelagic marine environments. ISME J. 4, 700–710. doi: 10.1038/ismej.2009.155
Tavormina, P. L., Ussler, W. III., Steele, J. A., Connon, S. A., Klotz, M. G., and Orphan, V. J. (2013). Abundance and distribution of diverse membrane-bound monooxygenase (Cu-MMO) genes within the Costa Rica oxygen minimum zone. Environ. Microbiol. Rep. 5, 414–423. doi: 10.1111/1758-2229.12025
Tripp, H. J., Kitner, J. B., Schwalbach, M. S., Dacey, J. W. H., Wilhelm, L. J., and Giovannoni, S. J. (2008). SAR11 marine bacteria require exogenous reduced sulphur for growth. Nature 452, 741–744. doi: 10.1038/nature06776
Venables, W. N., and Ripley, B. D. (2002). Modern Applied Statistics with S, 4th Edn. New York, NY: Springer.
Walsh, D. A., and Hallam, S. J. (2011). “Bacterial Community Strucuture and Dynamics ina a Seasonally Anoxic Fjord: Saanich Inlet, British Columbia,” in Handbook of Molecular Microbial Ecology II: Metagenomics in Different Habitats, ed F. J. De Brujin (New Jersey: Wiley-Blackwell), 253–267.
Walsh, D. A., Zaikova, E., Howes, C. G., Song, Y. C., Wright, J. J., Tringe, S. G., et al. (2009). Metagenome of a versatile chemolithoautotroph from expanding oceanic dead zones. Science 326, 578–582. doi: 10.1126/science.1175309
Ward, B. B., Devol, A. H., Rich, J. J., Chang, B. X., Bulow, S. E., Naik, H., et al. (2009). Denitrification as the dominant nitrogen loss process in the Arabian Sea. Nature 461, 78–81. doi: 10.1038/nature08276
Ward, B. B., and Kilpatrick, K. A. (1990). Relationship between substrate concentration and oxidation of ammonium and methane in a stratified water column. Cont. Shelf Res. 10, 1193–1208. doi: 10.1016/0278-4343(90)90016-F
Ward, B. B., and Kilpatrick, K. A. (1993). Methane oxidation associated with mid-depth methane maxima in the Southern California Bight. Cont. Shelf Res. 13, 1111–1122. doi: 10.1016/0278-4343(93)90044-X
Ward, B. B., Kilpatrick, K. A., Wopat, A. E., Minnich, E. C., and Lidstrom, M. E. (1989). Methane oxidation in Saanich inlet during summer stratification. Cont. Shelf Res. 9, 65–75. doi: 10.1016/0278-4343(89)90083-6
Wright, J. J., Konwar, K. M., and Hallam, S. J. (2012). Microbial ecology of expanding oxygen minimum zones. Nat. Rev. Microbiol. 10, 381–394. doi: 10.1038/nrmicro2778
Wright, J. J., Lee, S., Zaikova, E., Walsh, D. A., and Hallam, S. J. (2009). DNA extraction from 0.22 μM sterivex filters and cesium chloride density gradient centrifugation. J. Vis. Exp. e1352. doi: 10.3791/1352
Zaikova, E., Walsh, D. A., Stilwell, C. P., Mohn, W. W., Tortell, P. D., and Hallam, S. J. (2010). Microbial community dynamics in a seasonally anoxic fjord: saanich inlet, British Columbia. Environ. Microbiol. 12, 172–191. doi: 10.1111/j.1462-2920.2009.02058.x
Keywords: methane oxidation, oxygen minimum zones, methanotrophs, time series, pyrosequencing
Citation: Torres-Beltrán M, Hawley AK, Capelle DW, Bhatia MP, Evan Durno W, Tortell PD and Hallam SJ (2016) Methanotrophic Community Dynamics in a Seasonally Anoxic Fjord: Saanich Inlet, British Columbia. Front. Mar. Sci. 3:268. doi: 10.3389/fmars.2016.00268
Received: 01 August 2016; Accepted: 05 December 2016;
Published: 20 December 2016.
Edited by:
Phyllis Lam, University of Southampton, UKReviewed by:
Marc Strous, University of Calgary, CanadaMarc Gregory Dumont, University of Southampton, UK
Emma Rocke, University of Cape Town, South Africa
Copyright © 2016 Torres-Beltrán, Hawley, Capelle, Bhatia, Evan Durno, Tortell and Hallam. This is an open-access article distributed under the terms of the Creative Commons Attribution License (CC BY). The use, distribution or reproduction in other forums is permitted, provided the original author(s) or licensor are credited and that the original publication in this journal is cited, in accordance with accepted academic practice. No use, distribution or reproduction is permitted which does not comply with these terms.
*Correspondence: Steven J. Hallam, shallam@mail.ubc.ca