A New Analytical Method for Direct Measurement of Particulate and Dissolved B-vitamins and Their Congeners in Seawater
 Christopher Suffridge
 Lynda Cutter
 Sergio A. Sañudo-Wilhelmy
- 1Marine Environmental Biology Section, Department of Biological Sciences, University of Southern California, Los Angeles, CA, USA
- 2Department of Earth Sciences, University of Southern California, Los Angeles, CA, USA
We have developed a new method to directly measure the concentration of the particulate and dissolved pools of B-vitamins in seawater. B-vitamins are coenzymes required for life, yet many organisms cannot synthesize these compounds de novo and must scavenge them from the environment. It has been shown that B-vitamins can control the marine microbial community's structure and activity; however, the actual B-vitamin requirements/quotas for marine microbes are not well studied due to the lack of analytical protocols. This method will enable the study of B-vitamin cellular quotas as well as their environmental cycling. With this method, we can also simultaneously determine the biochemical congeners of vitamins B1 and B12, as well as vitamins B2, B6, B7, and the amino acid methionine in both the particulate and dissolved pool, using liquid chromatography-mass spectrometry after a chemical extraction (particulate) or resin preconcentration (dissolved). Particulate and dissolved B-vitamin concentrations were simultaneously determined from a microbial community in the Atlantic Ocean. Particulate B-vitamin concentrations in the Atlantic ranged from 0.01 pM (cyano-B12) to 46.4 pM (thiamin monophosphate, a B1 congener) while dissolved B-vitamin concentrations ranged from 0.07 pM (adenosyl-B12) to 679.4 pM (B7). The application of this technique in different marine systems has the potential to shed new light on previously unknown biochemical processes occurring within the oceanic microbial community, and the resulting roles B-vitamins play in regulating global biogeochemical cycles.
Introduction
B-vitamins are chemically diverse, water soluble coenzymes that are essential for all forms of life (Berg et al., 2007). In the ocean there is a complex relationship between organisms that are capable of de novo B-vitamin synthesis and those that require these compounds, or their precursors, but are unable to synthesize them (Sañudo-Wilhelmy et al., 2014; Paerl et al., 2015). Despite the known B-vitamin requirements of many climate-relevant eukaryotic phytoplankton, including species of diatoms, dinoflagellates, and coccolithophores (Croft et al., 2006; Tang et al., 2010; Sañudo-Wilhelmy et al., 2014), dissolved concentrations of these compounds are remarkably low, ranging from undetectable to hundreds of picomoles per liter of water (Suárez-Suárez et al., 2011; Sañudo-Wilhelmy et al., 2012; Heal et al., 2014). It has been shown that these concentrations are in some cases too low to support maximal microbial production in many regions of the world ocean, and that addition of B-vitamins can cause dramatic shifts in the microbial community structure and production (Panzeca et al., 2006; Sañudo-Wilhelmy et al., 2006; Gobler et al., 2007; Koch et al., 2011; Bertrand and Allen, 2012; Bertrand et al., 2012, 2013). While the importance of B-vitamins to phytoplankton has been well known for decades (Droop, 1962; Carlucci and Silberna, 1969; Provasoli and Carlucci, 1974; Pinto et al., 2002), never before have the particulate B-vitamins from the marine microbial community and dissolved B-vitamins from the surrounding water been simultaneously and directly measured. The lack of a technique to directly measure the particulate pool of B-vitamins, coupled with insufficient existing methods to measure multiple biochemical forms of some B-vitamins (congeners) in the dissolved pool, has hindered our understanding of their role in shaping marine microbial community composition as well as the processes controlling B-vitamin cycling between the dissolved and particulate pools in the ocean.
We have developed a method to directly determine the concentrations of particulate B-vitamins in marine systems. In addition, we describe the modification of an existing dissolved B-vitamin method to include important biochemical congeners of the B-vitamins (Suárez-Suárez et al., 2011; Sañudo-Wilhelmy et al., 2012; Heal et al., 2014). The utilization of our new analytical protocol will allow for a better understanding of B-vitamin distributions in the ocean, and the roles they play in mediating global primary productivity and microbial species succession. The main focus of our method is to measure multiple biochemically relevant congeners of vitamins B1 and B12 which exhibit significant levels of auxotrophy (obligate requirement) among eukaryotic phytoplankton (Croft et al., 2006; Tang et al., 2010; Sañudo-Wilhelmy et al., 2014). This method quantifies three forms of thiamin: unphosphorylated thiamin (B1 hereafter), thiamin monophosphate (TMP), thiamin pyrophosphate (TPP); a thiamin precursor, the pyrimidine moiety (4-amino-2-methyl-5-pyrimidinyl methanol, HMP); biotin (B7); and four forms of cobalamin (B12), adenosylcobalamin (AB12), cyanocobalamin (CB12), hydroxycobalamin (HB12), and methylcobalamin (MB12). In addition to the primary target analytes listed above, this method can be used to quantify riboflavin (B2), pyridoxal (B6), and the amino acid methionine (Met). Taken together, these analytes represent different active forms and precursors of an important subset of B-vitamins, which have essential biochemical roles in central and secondary metabolic pathways across all domains of life (Begley et al., 1999; Brown, 2005; Waldrop et al., 2012). This method simultaneously measures the particulate and dissolved pools of chemically and functionally diverse B-vitamins that are commonly required by marine microbes, thus enabling novel insights into the ways that B-vitamins impact marine microbial community structure and production.
Methods
Culture Sample Collection, Processing, and Preservation
Cultures of Synechococcus strain CC9311 and Vibrio strain AND4 were used to optimize the particulate extraction protocol. CC9311 was grown in vitamin free SN media under 24 h illumination (100 μE) at 20°C (Waterbury et al., 1986). AND4 was grown in Zobell media at room temperature (Gómez-Consarnau et al., 2010). Cultures were grown under axenic conditions however we did not formally test for axenicity at the end of the experiment since these cultures were only used for a method development and not for a physiological study. Cells were collected in late exponential/early stationary growth phase via gentle vacuum filtration onto 25 mm diameter, 0.2 μm pore size Supor filters (Pall Biosciences). Ten milliliters of cell culture was filtered. Cellular density was assessed using direct enumeration with epifluorescence microscopy (Hobbie et al., 1977; Waterbury et al., 1986). Filters were placed in 2 ml cryovials (Nalgene) and immediately frozen and stored at −80°C until particulate vitamin quantification.
Environmental Sample Collection, Processing, and Preservation
Environmental samples used for verification of both the particulate and dissolved methods were collected from two locations: the San Pedro Ocean Time series (SPOT) station (33°33′N, 118°24′W, Figure S1A) off the coast of Southern California in March 2015, and a station in the Eastern Atlantic Ocean (33°1′16″N, 12°14′28″W, Figure S1B) in May of 2014. Samples were collected from 3 m at SPOT and from four depths in the Atlantic: 3 m, 50 m, 85m (deep chlorophyll maximum), and 200 m. All samples were filtered using a peristaltic filtration system. The peristaltic filtration rig was cleaned between samples with methanol to remove any residual B-vitamins. Prior to use, the rig was rinsed thoroughly with Milli-Q water followed by sample seawater (Sañudo-Wilhelmy et al., 2012). Particulate samples were screened through a 10 μm mesh and filtered onto 0.2 μm Supor filters. After filtration was completed, the filters were frozen and stored as described for the cultured samples. Particulate organic carbon (POC) samples were collected in parallel with environmental particulate B-vitamin samples in order to allow normalization of the particulate B-vitamin concentrations. They were filtered on precombusted GF/F filters under low vacuum pressure, desiccated at 60°C, and analyzed using a CHN elemental analyzer (Knap et al., 1996). The filtrate resulting from the particulate fraction filtration was collected for the dissolved B-vitamin analysis in 1L amber HDPE bottles and stored at −20°C until analysis (Okbamichael and Sañudo-Wilhelmy, 2004, 2005; Sañudo-Wilhelmy et al., 2012).
Particulate B-Vitamin Extraction
Frozen filters with samples collected from both cultures and the environmental samples were aseptically transferred from the cryovials into acid-washed, methanol-rinsed, 15 ml heavy-walled polypropylene conical centrifuge tubes, containing 4 ml of cold lysis solution with 2 ml of 0.5 mm zirconia/silica beads (Biospec). The lysis solution consisted of 5% methanol, 95% LC/MS-grade water solution adjusted to pH 3.5 using hydrochloric acid. The ratio of extraction solution to beads was 2:1 v/v solution:beads. The exact volume of the lysis solution was determined using an analytical balance. Cells were lysed via bead beating by vortexing on high for 5 min followed by 1 min in an ice bath to ensure that the temperature of the solution did not exceed 30°C. This process was repeated 6 times, for a total of 30 min of bead beating to achieve complete cellular lysis, which was determined by epifluorescence microscopy. Following cell lysis, the solution was incubated for 30 min in the dark at 30°C to extract the target analytes from the cellular matrix. Organic-aqueous liquid phase extractions (LPE) were used to remove hydrophobic cellular components from the cellular lysate, while simultaneously purifying the hydrophilic target analytes. Chloroform (1:1 v/v) was added to each tube, and the tubes were vigorously shaken for 3 min causing the hydrophobic cellular components to partition into the chloroform. The tubes were then centrifuged at 5000 rpm for 10 min to achieve complete phase separation, and to pelletize large cellular debris (Mashego et al., 2007; Roberts et al., 2012). The upper aqueous phase containing the B-vitamins was transferred to a new tube, and the chloroform extraction process was repeated twice. Following the liquid phase extraction, samples were adjusted to pH 6.5 by adding dilute NaOH. Sample volume was assessed before and after addition of NaOH using an analytical balance in order to correct concentrations for the added volume. Samples were centrifuged for 10 min at 5000 rpm and then syringe push filtered through methanol-rinsed 0.2 μm Minisart RC4 matrix filters (Sartorius Stedim Biotech).
Dissolved Sample Preconcentration
Samples for dissolved vitamin analysis were preconcentrated as it has been previously described (Okbamichael and Sañudo-Wilhelmy, 2004, 2005; Sañudo-Wilhelmy et al., 2012). Briefly, preconcentration columns were prepared by pouring 1:1 MeOH: C18 resin [HF Bondesil (Agilent Technologies)] slurry into Poly-Prep Columns (Biorad). The resin was allowed to settle, and the excess MeOH was drained leaving 7 ml of resin. Thawed samples were adjusted to pH 6.5 using dilute HCl and passed over the preconcentration column at 1 ml per min. Samples were then adjusted to pH 2.0 using dilute HCl and were passed over the preconcentration column a second time. The residual salt was rinsed off the resin using 30 ml of LC/MS grade water. The target analytes were then eluted from the resin using 12 ml of LC/MS grade methanol into methanol-rinsed 15 ml conical centrifuge tubes. Eluted samples were then further concentrated via evaporation in a nitrogen dryer using compressed N2 gas, in the dark, at room temperature. Gas pressure was initially set at 5PSI and was slowly increased to 20PSI until 300 μl of sample remained. The samples were then stored at −20°C until LC/MS analysis which occurred within 24 h. Prior to LC/MS analysis samples were adjusted to pH 6.5 using 10 μl of dilute NaOH. Care was taken to measure the mass of the sample before and after addition of the base and used to correct the final concentrations. Two different pH papers were used to assess pH after the final mass had been recorded. This is possible because the initial pH of each sample is known (e.g., pH 2.0 after preconcentration, pH 3.5 for the particulate samples) so the amount of base to be added can be calculated. Samples were centrifuged and push filtered as described above. Previous tests confirm that no vitamins adsorb onto the Minisart filters used for push filtering.
LC/MS Analysis
Quantification of B1, TMP, TPP, HMP, B2, B6, B7, AB12, CB12, HB12, MB12, and Met was carried out with a Thermo TSQ Quantum Access electrospray ionization triple quadrupole mass spectrometer, coupled to a Thermo Accela High Speed Liquid Chromatography (LC/MS) system. The LC system used a stable-bond C18 reversed-phase column (Discovery HS C18 10 cm × 2.1 mm, 5 μm column, Supelco Analytical) with a 100 μL sample loop. In order to increase the sensitivity and precision of our analysis, the LC/MS was run in full-loop mode (100 μl/injection). The computer software Xcalibur and LCQuan™ (Thermo Scientific) were used for data acquisition and analysis. A 12-min gradient flow was used with mobile phases of methanol (MeOH) and LC/MS grade water, both buffered to pH 4 with 0.5% acetic acid. The flow rate was set at 230 μl/min throughout the run, with a gradient starting at 93% LC/MS water: 7% MeOH for 2 min, changing to 100% MeOH by 7 min, and continuing at 100% MeOH until 9 min and returning to initial conditions until the gradient completes at 12 min. All peaks were identified using standards dissolved in LC/MS grade water; retention times are listed in Table 1 and depicted in Figure S2. The mass spectrometer was run in Selected Reaction Monitoring (SRM) mode with positive polarity with a well time of 100 ms per transition. The resolution of the mass filters used for quadrupoles 1 and 2 were 0.7 and 0.1 m/z, respectively. The ESI spray voltage was 4000V, sheath gas (N2) pressure was 30PSI, auxiliary gas (Ar) pressure was 3PSI, capillary temperature was 269°C, and the collision pressure was 2.1torr. The m/z of the analytes and their respective product ions, as well as the analyte specific collision energy and T-lens settings are listed in Table 1. The instrumental limits of detection (LOD; Table 2) were calculated as three times the standard deviation of the procedural blank (if no signal was detectable in the analytical blank, then they were calculated as three times the standard deviation of the lowest detectable standard). The resulting data was analyzed using the software environment R, and all figures were created using the Ggplot2 software package for R (Wickham, 2009; R Core Team, 2015).
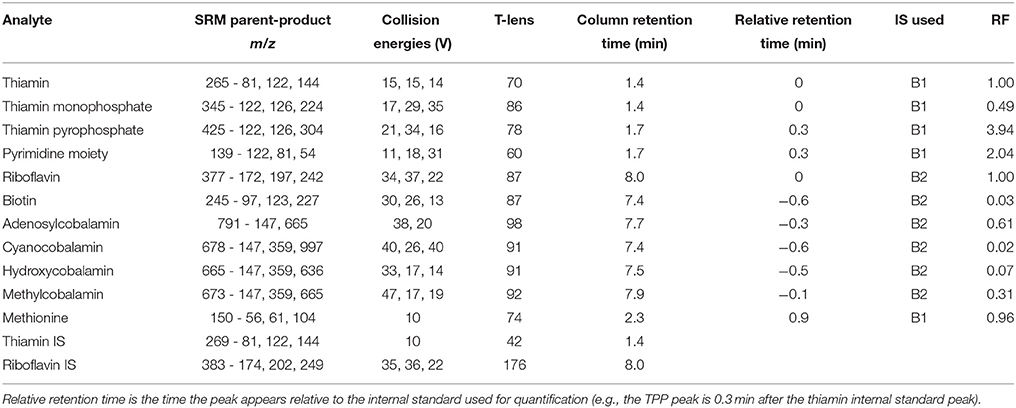
Table 1. Analytical LC/MS parameters for all measured analytes.
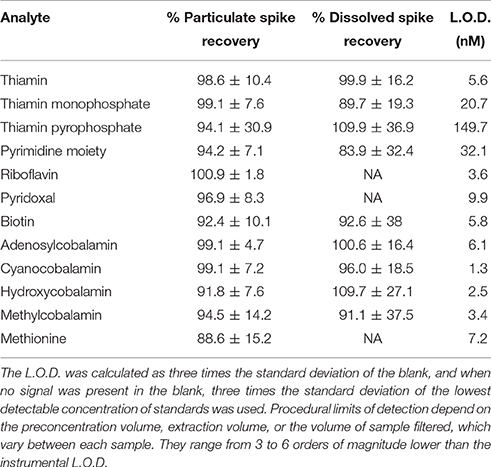
Table 2. Analyte spike recoveries and instrumental limits of detection (L.O.D).
Results
Particulate Method Validation
The particulate B-vitamin extraction method was initially optimized using cultures of Synechococcus str. CC9311 and exclusively focusing on vitamins B1, B7, and CB12. These analytes were chosen due to the widespread auxotrophy for these compounds in marine microbial systems (Sañudo-Wilhelmy et al., 2014). As a starting point we used the vitamin extraction protocol described by Carlucci and Bowes (1972) (100°C incubation for 1 h in seawater adjusted to pH 3.5), however this protocol resulted in vitamin degradation as our spike recoveries were below 10%. In order to increase those recoveries, extractions were conducted with iteratively milder (both temperature and pH) conditions until it was found that bead beating in a lysis solution composed of 5% LC/MS grade methanol and 95% LC/MS grade water adjusted to pH 3.5 did not degrade any of our analytes, while also still achieving complete cellular lysis (determined by epiflourescence microscopy). This resulted in greater than 90% spike recoveries for our three targeted analytes (Table 2). Initially, a second extraction of the filter was conducted to ensure complete extraction, and no signal was observed on this subsequent extraction. Based on the high spike recoveries obtained for the targeted analytes, our analytical scope was then successfully expanded to include all analytes listed in Table 2. In addition to those analytes, we attempted to analyze a chemical form of thiazole (C3H3NS), a B1 precursor, however our spike recoveries were only 60%, and a signal was only occasionally observed within the particulate pool. It is unclear if our method could be used to measure pseudocobalamins (Tanioka et al., 2009; Helliwell et al., 2016) and other vitamin precursors such as the B1 precursor 4-methyl-5-thiazoleethanol (Paerl et al., 2015). We focused on analytes that had standards readily commercially available at the time of method development, and limited our analytical scope to preserve analytical sensitivity and precision. Future studies, potentially focusing solely on one class of analytes (e.g., cobalamins and pseudocobalamins) will be needed to evaluate these, and other, B-vitamin congeners and precursors with sufficient sensitivity and precision. However, the high recoveries of the added analytes shown in Table 2 indicate that this extraction method can likely be expanded to a wide range of chemically diverse metabolites.
When Synechococcus biomass was initially extracted and analyzed, it became apparent that sample matrix suppression was occurring as evidenced by low recoveries, poor peak shape, and a substantial increase in LC/MS background noise. Both liquid phase extractions (LPE) and solid phase extractions (SPE) were tested to reduce the analytical signal to noise ratio by purifying our analytes of interest from the total cellular extract. The SPE used C18 resin, and resulted in full recoveries of our analytes, but did not satisfactorily reduce the background noise. The LPE using chloroform (1:1 v/v) did not degrade our analytes, and no vitamins were observed to partition into the chloroform. The liquid phase extraction effectively reduced the matrix suppression problem, allowing for clear quantification of our target analytes.
To our knowledge, there is no standard reference material for particulate B-vitamins in bacterioplankton and/or phytoplankton. Therefore, full particulate B-vitamin extraction must be inferred from determining that filters and media used do not have a B-vitamin blank, observing complete cellular lysis, determining the effectiveness of our lysis solution in separating B-vitamins from the cellular matrix, and testing that our extraction procedure does not degrade B-vitamins. No B-vitamin blank was observed on the Supor filters, and no B-vitamins from the media used were observed to adsorb onto the filters. Complete cellular lysis was observed via epiflourescence microscopy. Our lysis solution is similar to previously published particulate extraction solutions that have been determined to result in full extraction of metabolites from the cellular matrix (Roberts et al., 2012). We tested the relative accuracy and precision of our extraction procedure by adding known concentrations of each vitamin congener to samples containing filters with a known amount of Synechococcus CC9311 cells, and by extracting as described above. A parallel sample with only CC9311 filtered cells was also analyzed. Standard recoveries were calculated by subtracting the observed CC9311 vitamin concentration from the vitamins observed in the standards + CC9311 sample. These values were compared to extractions of known concentrations of vitamin standards without CC9311 cells, and no significant differences in recovery efficiency were observed, indicating that the addition of cellular organic compounds does not interfere with our analysis. Spike recoveries (listed in Table 2) were >88% for all analytes.
Dissolved Method Validation
In order to fully complement the newly developed particulate B-vitamin method described above, we expanded the previously established dissolved B-vitamin method to include TMP, TPP, HMP, AB12, HB12, and MB12. In order to test the recoveries of these additional analytes, known concentrations of standards were added to vitamin free seawater and were preconcentrated using C18 resin at two pHs (6.5 and 2.0) as it has been described previously (Okbamichael and Sañudo-Wilhelmy, 2004, 2005; Sañudo-Wilhelmy et al., 2012). After LC/MS analysis, recoveries were determined to be >83% for all newly added analytes (Table 2). We attempted to include the B1 precursor thiazole in the dissolved method, however we observed that it did not successfully bind to our preconcentration resin.
Internal Standard
Two internal standards (IS) were used for sample quantification. Stable isotopically labeled B1 (13C, 15N, mass shift +4, Sigma-Aldrich) was used to quantify aqueous phase eluting analytes (B1, TMP, TPP, HMP, MET), and stable isotopically labeled B2 (13C, 15N, mass shift +6, Sigma-Aldrich) was used to quantify organic phase eluting analytes (B2, B6, B7, AB12, CB12, HB12, MB12). The relationship between each analyte and the IS used for quantification was empirically determined by calculating a response factor (RF) for each of these molecules (Table 1, Equations 1, 2 in Supplementary Material) (Bohn and Walczyk, 2004). Quantification using the IS and RF values was validated by analyzing known concentrations of standards dissolved in LC/MS-grade water, and comparing concentrations calculated using the IS/RF versus external calibration curves. During sample analysis external calibration curves containing both target analytes and internal standards were run daily and used to verify the RF and to correct for inter-day instrument variability/drift. IS intraday variability ranged between 6–25% and 4–14% for B1-IS and B2-IS respectively; interday variability was 15 and 9% for B1-IS and B2-IS respectively. The IS increased our analytical precision, and allowed for the correction of matrix suppression effects which are known to be common (Heal et al., 2014).
Discussion
Particulate B-vitamins were extracted from cultures of two species of marine bacteria of differing metabolic lifestyles: Synechococcus strain CC9311 (photoautotroph), Vibrio strain AND4 (heterotroph). The normalized concentration (mole analyte mole POC−1) observed in CC9311 for B1, B7, and CB12 were 3.9 × 10⁻⁵ ± 7.8 × 10⁻⁶, 9.9 × 10⁻⁶ ± 8.1 × 10⁻⁶ and 4.2 × 10⁻⁷ ± 2.9 × 10⁻⁷, respectively (Table 3, Figure 1). The concentrations of these compounds in AND4 were lower than those measured in CC9311, with the differences of the means of B1, B7, and CB12 concentrations equaling 3.5 × 10⁻⁵, 7.4 × 10⁻⁶, and 3.6 × 10⁻⁷, respectively (Table 3, Figure 1). Recent research has suggested that cyanobacteria, including CC9311, solely have the ability to synthesize and utilize pseudocobalamins, which potentially makes our observed presence of CB12 within CC9311 anomalous (Tanioka et al., 2009; Helliwell et al., 2016). However, we do not believe that these findings run contrary to our observations as our cultures were not tested for axenicity at the endpoint of our experiment, and contamination with heterotrophic bacteria could have occurred. In addition, the ability of CC9311 to remodel pseudocobalamin is not well understood. We hypothesize that the observed differences in the particulate concentration of each vitamin among species, which can span several orders of magnitude, could potentially be associated with differing metabolic rates or B-vitamin requirements between the species. B-vitamins are intrinsically linked with metabolic processes, so a more metabolically active organism may require higher concentrations of particulate B-vitamins (Banerjee, 1997; Begley et al., 1999; Waldrop et al., 2012; Sañudo-Wilhelmy et al., 2014). However, we did not assess growth rate or end-point axenicity in our cultures, so we cannot definitively test this hypothesis using our data. Further studies using cultures and tightly constrained growth rates are necessary to elucidate particulate B-vitamin requirements.
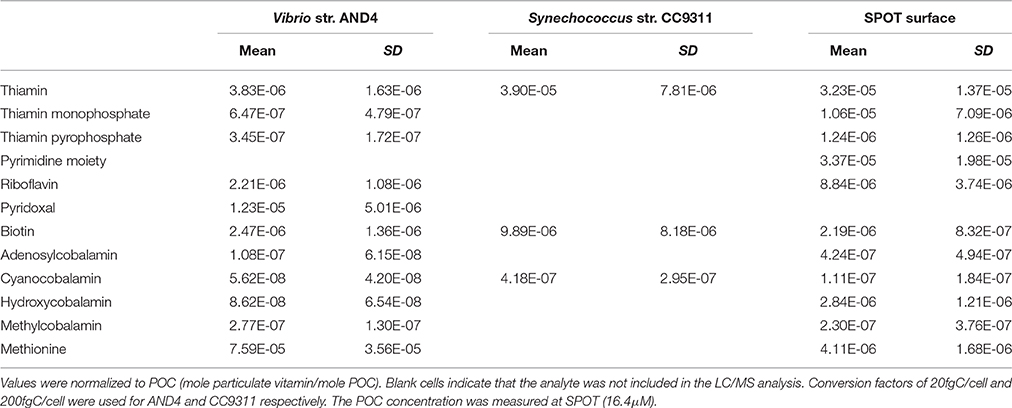
Table 3. Particulate B-vitamin concentrations obtained from cultures and environmental samples collected at SPOT.
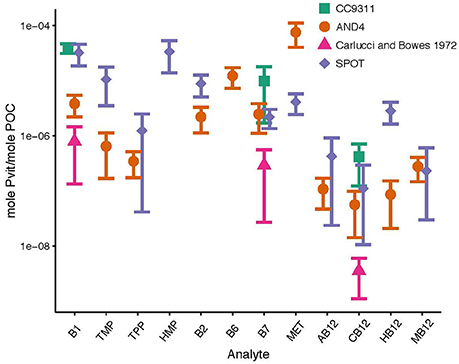
Figure 1. Particulate B-vitamin concentrations from cultures and the environment. Samples were analyzed from cultures of Synechococcus str. CC9311 (green squares), cultures of Vibrio str. AND4 (orange circles), cultures of marine eukaryotic phytoplankton from Carlucci and Bowes (1972) (pink triangles), and samples from the surface ocean at the San Pedro Ocean Timeseries (purple diamonds). All concentrations were normalized to cellular carbon. Conversion factors of 20fgC/cell and 200fgC/cell were used for AND4 and CC9311, respectively. POC was measured at SPOT (16.4 μM).
In order to evaluate the particulate pool of B-vitamins in environmental samples, we collected seawater from two contrasting ocean systems. Sampling occurred at SPOT and at an oceanic station in the subtropical Eastern Atlantic Ocean (see Experimental Sample Collection section). The observed particulate concentrations (pico mole vitamin per liter of seawater, pM) at 3 m at SPOT were 481 ± 204 B1, 156 ± 103 TMP, 17.6 ± 16.8 TPP, 40.8 ± 14.8 HMP, 129 ± 45.7 B2, 31.9 ± 9.87 B7, 5.82 ± 6.53 AB12, 1.54 ± 2.46 CB12, 40.8 ± 14.8 HB12, 3.14 ± 5.02 MB12, and 62.1 ± 30.1 Met. At the Atlantic Station, particulate concentrations (pM) in the mixed layer ranged from 3.53–44.4 B1, 5.64–46.5 TMP, 1.13–7.85 TPP, 5.91–45.56 HMP, 1.68–8.55 B7, 0.52–4.53 AB12, undetectable-1.21 CB12, 1.21–9.11 HB12, 0.19–2.46 MB12, and 1.97–16.11 Met (Figure 2, Table 4). SPOT was more eutrophic during our sampling with a mean observed POC concentration of 16.4 μM, whereas POC was observed to range between 1 and 4.5 μM throughout the mixed layer at the Atlantic station (data not shown). Normalization using the POC data allowed us to take into account the density of biomass at each location. The normalized particulate B-vitamin stoichiometric molar ratios (mole particulate vitamin: mole particulate organic carbon) observed at SPOT (3 m) in March 2015 were: 3.2 × 10⁻⁵ ± 1.4 × 10⁻⁵ B1: 1.1 × 10⁻⁵ ± 7.1 × 10⁻⁶ TMP: 1.2 × 10⁻⁶ ± 1.3 × 10⁻⁶ TPP: 3.4 × 10⁻⁵ ± 1.9 × 10⁻⁵ HMP: 8.8 × 10⁻⁶ ± 3.7 × 10⁻⁶ B2: 2.2 × 10⁻⁶ ± 8.3 × 10⁻⁷ B7: 4.2 × 10⁻⁷ ± 4.9 × 10⁻⁷ AB12: 1.1 × 10⁻⁷ ± 1.8 × 10⁻⁷ CB12: 2.8 × 10⁻⁶ ± 1.2 × 10⁻⁶ HB12: 2.3 × 10⁻⁷ ± 3.7 × 10−7 MB12: 4.1 × 10⁻⁶ ± 1.7 × 10⁻⁶ Met: 1POC (Table 3, Figure 1). The observed particulate B-vitamin to POC molar ratios observed at 3 m in the Atlantic were 8.1 × 10⁻⁶ ± 1.6 × 10⁻⁶ B1: 6.2 × 10⁻⁶ ± 5.9 × 10⁻⁷ TMP: 1.8 × 10⁻⁶ ± 2.3 × 10⁻⁷ TPP: 1.3 × 10⁻⁶ ± 4.2 × 10⁻⁷ HMP: 4.2 × 10⁻⁶ ± 3.3 × 10⁻⁷ B2: 1.8 × 10⁻⁶ ± 6.7 × 10⁻⁷ B7: 1.8 × 10⁻⁷ ± 1.4 × 10⁻⁷ AB12: 1.4 × 10⁻⁶ ± 2.0 × 10⁻⁷ HB12: 5.2 × 10⁻⁸ ± 3.8 × 10−8 MB12: 6.8 × 10⁻⁷ ± 1.6 × 10⁻⁷ Met: 1POC. The observed particulate vitamin concentrations (pM), and the POC normalized values (mole particulate vitamin: mole POC) at 3 m in the Atlantic were lower by as much as two orders of magnitude than those observed at 3 m at SPOT for each analyte, likely because the Atlantic station was much more oligotrophic than SPOT. It is important to note that since a prefilter was used for sample collection, the particulate B-vitamin concentrations measured at our study sites only represent the bulk community ranging from 0.2 to10 μm, which likely excludes large eukaryotic phytoplankton. The observed concentrations of particulate B-vitamins in a bulk community measurement are a function of both the size of the community (biomass standing stock), and potentially the growth rate of the individual organisms in the community. We hypothesize that the relatively oligotrophic conditions in the Atlantic (compared to the upwelling dominated community at SPOT) should result in lower microbial growth rates, and therefore likely lower particulate B-vitamin requirements.

Table 4. Dissolved (A) and particulate (B) B-vitamin concentrations (pM) determined at a station in the Eastern Atlantic Ocean (33°1′16″N, 12°14′28″W) in May of 2014.
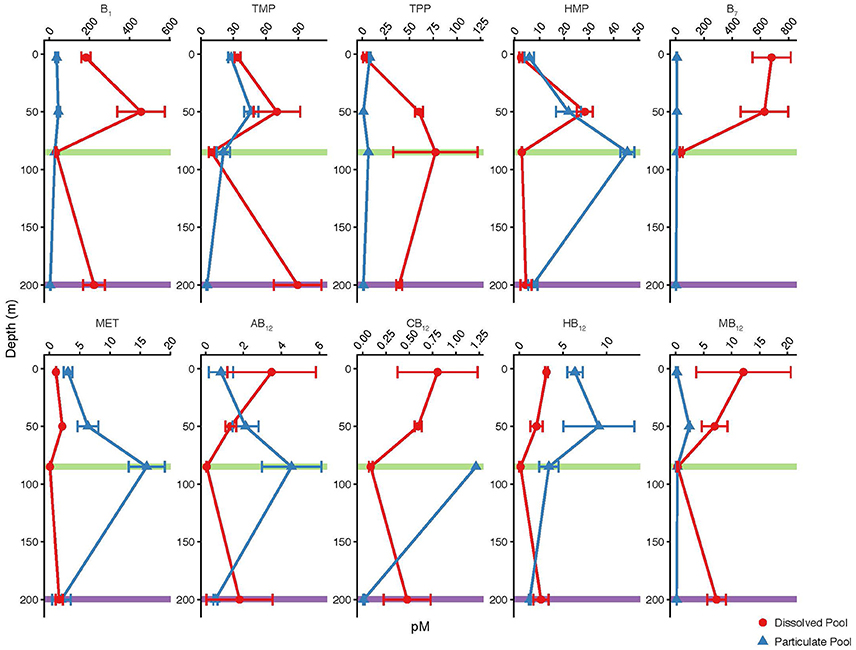
Figure 2. Particulate (blue triangles) and dissolved (red circles) B-vitamin concentrations (pM) measured at four depths in the mixed layer of the Eastern Atlantic Ocean. The DCM (0.06 μg ChlA/L) depth is indicated in green. The nutricline, as defined by concentration, is indicated in purple.
Stoichiometric estimations showed that the B-vitamin concentrations measured in both cultures and field-collected samples were, on average, between 1 and 2 orders of magnitude higher than the values reported from the phytoplankton cultures analyzed by Carlucci and Bowes (1972) (Figure 1). We believe that this difference could either be a result of the lack of sensitivity of the bioassay used to determine vitamin concentration in their study and/or the substantial B-vitamin degradation that we observed under their original high temperature and acidity particulate extraction conditions (see Results section).
Similarly, our measured particulate B-vitamin concentrations (normalized to POC) are, on average, an order of magnitude higher than published vitamin B1 and B12 calculated cellular quotas based on uptake rates (Droop, 2007; Tang et al., 2010; Paerl et al., 2015). Cellular quotas of B-vitamins (pmole B-vitamin cell−1) for individual strains of eukaryotic phytoplankton have been previously estimated using differential growth rates in varying concentrations of B-vitamins (Croft et al., 2005; Droop, 2007; Tang et al., 2010; Paerl et al., 2015). These published per cell values were normalized to C values using published conversion factors: 20fgC/cell bacteria, 200fgC/cell cyanobacteria, and 138pgC/cell microplankton (Waterbury et al., 1986; Caron et al., 1999). The vitamin per carbon values from the published uptake studies (obtained using the above conversion factors) were compared to the mean vitamin per carbon values from 3 m at SPOT and all depths at the Atlantic Station. The mean total thiamin (B1, TMP, TPP combined) and total cobalamin (all congeners combined) concentrations (mole B-vitamin mole POC−1) measured at SPOT and at the Atlantic station are 2.3 × 10⁻⁵ ± 6.8 × 10⁻⁶ and 2.2 × 10⁻⁶ ± 7.7 × 10⁻⁷, respectively (Tables 3, 4). In comparison, the mean estimated cellular quotas for thiamin and cobalamin obtained from Tang et al. (2010) and Paerl et al. (2015) are 6.3 × 10⁻⁷ ± 8.7 × 10⁻⁷ and 2.4 × 10⁻⁸ ± 5.9 × 10⁻⁸ (mole B-vitamin mole POC−1), respectively. The 1–3 orders of magnitude difference between the calculated cellular quotas (based on vitamin uptake rates), and our observed particulate concentrations seems to point to the possibility that complex environmental samples consisting of mixed communities may contain individual members with higher B-vitamin quotas than those previously studied in monocultures. Furthermore, these data also suggest that B-vitamin uptake could be a poor indicator for particulate B-vitamin concentrations in environmental samples as the cellular quotas of organisms that have B-vitamin synthesis capacity are not constrained by B-vitamin uptake rates. Future studies coupling B-vitamin uptake rates and direct particulate measurements will be necessary to fully understand these relationships.
The dissolved pool of B-vitamins was measured at the Atlantic Station in conjunction with the particulate pool. The observed concentration range (all in pM) of B-vitamins in the dissolved pool are: 33.4–457.1 B1, 9.8–89.2 TMP, 2.5–77.3 TPP, 2.5–28.3 HMP, 40.1–679.4 B7, 0.07–3.5 AB12, 0.09–0.8 CB12, 0.2–3.1 HB12, 0.4–12.1 MB12, and 0.1–2.1 Met (Table 4, Figure 2). These concentrations were decoupled from inorganic nutrient concentrations (e.g., ). Vitamins in the dissolved pool are sourced from biogenic processes, therefore areas that contain the most biochemically active organisms, and likely the highest particulate B-vitamin concentrations, have the potential to produce the highest dissolved vitamin concentrations. The relationship between the dissolved and particulate pools varies between analyte and sample depth, which likely indicates rapid scavenging and release of these valuable compounds.
In order to evaluate the relative enrichment of either the particulate or the dissolved pool of B-vitamins in the environment, ratios of particulate to dissolved concentration were calculated (Figure 3, Table 5). Values greater than one indicate relative particulate pool enrichment, while values less than one indicate a relative enrichment in the dissolved pool. Vitamins B1, B7, and MB12 were found to be enriched exclusively in the dissolved pool with ratios ranging from 0.02 to 0.83, 0.01–0.21, and 0.02–0.89 respectively (Figure 3, Table 5). Only the amino acid methionine was found to be always relatively enriched in the particulate pool with ratio values ranging from 1.23 to 239 (Figure 3, Table 5). Ratio values for all analytes peaked at the DCM and decreased at the nutricline (Figure 3, Table 5). The maximum concentration of biomass at the DCM is likely the cause of the relative enrichment of particulate B-vitamins at this depth (Figure 3, Table 5). Increased biological activity at the DCM likely creates this relative particulate vitamin enrichment through the increase of the rates of two processes: de novo B-vitamin synthesis and B-vitamin uptake from the dissolved pool. The relative enrichment in the dissolved vitamins pool at the nutricline (200 m) is likely a result of remineralization of sinking particles, coupled with B-vitamin degradation within dead or dying cells. Future research will be required to robustly define the relationship between these two pools.
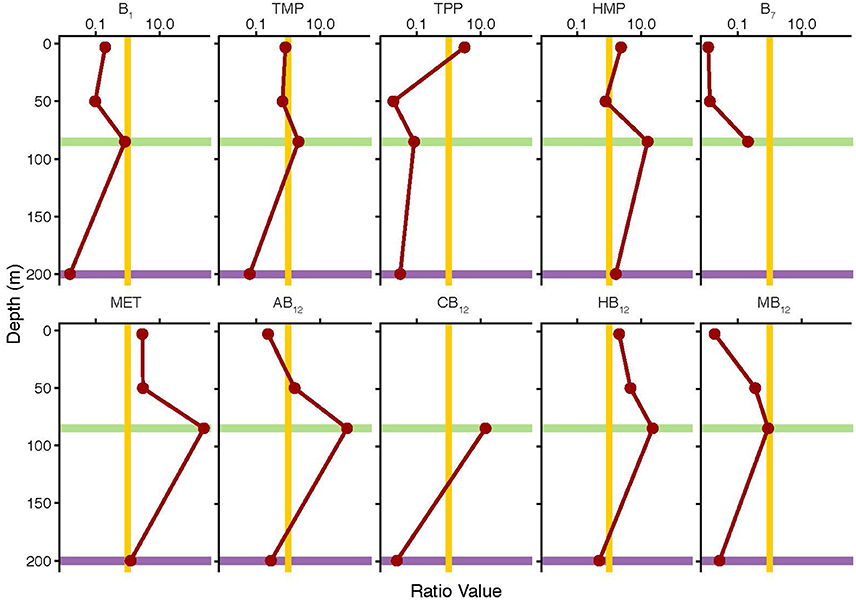
Figure 3. Particulate to dissolved B-vitamin pool ratios (red line) plotted as a function of depth from the Eastern Atlantic Ocean. Values greater than 1 (right of gold line) indicate relative particulate enrichment. Values less than 1 (left of gold line) indicate relative dissolved enrichment. The DCM (0.06 μg ChlA/L) depth is indicated in green. The nutricline, as defined by concentration, is indicated in purple.
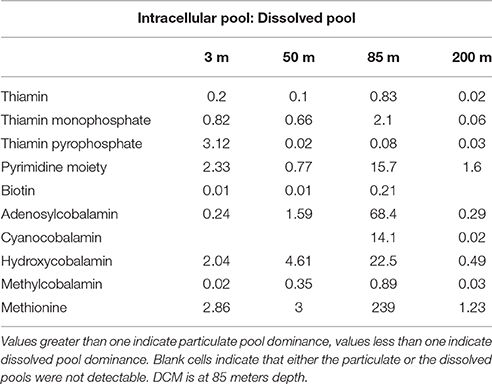
Table 5. Ratios between particulate and dissolved pools of B-vitamins in the Eastern Atlantic Ocean.
In summary, we have developed a direct method for the determination of particulate and dissolved B-vitamins in the ocean. The particulate protocol involves a cellular extraction from filtered cells, followed by a liquid phase extraction to remove organic molecules that could interfere with the analyses. The dissolved method uses a C18 resin to preconcentrate B-vitamins from seawater. Analysis for both methods is carried out using a gradient elution using a C18 column, followed by direct detection using a LC/MS. This new analytical protocol is used to quantify vitamins B1, B2, B6, B7, B12, and the amino acid methionine as well as their chemical congeners. This method is sensitive and accurate, and enables simultaneous direct quantification of particulate and dissolved B-vitamins in the ocean. These techniques were successfully applied to cultured marine bacteria and environmental samples from an upwelling-dominated eutrophic coastal region off the coast of California, and an oligotrophic oceanic region in the Atlantic Ocean. These techniques represent a much needed methodological expansion which will enable important future studies to determine the roles that B-vitamins play in determining the structure and productivity of marine microbial communities.
Author Contributions
The methods described in this paper were developed by CS with support and guidance from LC and SS in laboratory space provided by SS. All experiments were conducted by CS. The paper was written by CS. The paper was reviewed by LC and SS. Funding for this work was provided by grants from NSF (#1435666) to SS.
Funding
Financial support for this research has been provided by the National Science Foundation (Biological Oceanography grant #1435666).
Conflict of Interest Statement
The authors declare that the research was conducted in the absence of any commercial or financial relationships that could be construed as a potential conflict of interest.
Acknowledgments
We thank Laura Gomez-Consarnau, Danielle Monteverde, Eric Webb, Dave Hutchins, Feixue Fu, Pingping Qu, Naomi Levine, Madelyn Smith, Erin McParland, Javier Aristegui, X.A. Alvarez Salgado, and V. Vieitez for their help with environmental sample collection, meta-data analysis, bacterial culturing, and much needed advice and support during the method development and manuscript writing process. We thank the captain, crew, and scientific parties of the R/V Yellowfin and R/V Sarmiento de Gamboa for their assistance in sample collection.
Supplementary Material
The Supplementary Material for this article can be found online at: https://www.frontiersin.org/article/10.3389/fmars.2017.00011/full#supplementary-material
Figure S1. Map of environmental sampling locations. (A) The San Pedro Ocean Timeseries (SPOT) is located within the Southern California Bight (33°33′N, 118°24′W). (B) The Atlantic Station was located north of the Canary Islands and west of Morocco (33°1′16″N, 12°14′28″W).
Figure S2. Example LC/MS Chromatographs for each analyte. Retention time ranges from 0 to 12 min. Peak height is reported as percent relative intensity for each analyte (e.g., the highest peak within the specific m/z filter is set to 100%).
Equation 1. Response Factor (RF) is used to determine the relationship between known concentrations of the Internal Standard (CIS) and known concentrations of target analyte standards (Cvitstd), with the observed instrumental response (curve area) of the Internal Standard (AIS) and the target analyte standard (Avitstd).
Equation 2. The concentration of the target analyte in a sample (Cvitsam) is determined by adding a known concentration of the internal standard to the sample (CIS), and then using the RF (determined in Equation 1) to correct for the differing instrumental response between the internal standard (AIS) and the target analyte within the sample (Avitsam).
References
Banerjee, R. (1997). The Yin-Yang of cobalamin biochemistry. Chem. Biol. 4, 175–186. doi: 10.1016/S1074-5521(97)90286-6
Begley, T. P., Downs, D. M., Ealick, S. E., McLafferty, F. W., Van Loon, A., Taylor, S., et al. (1999). Thiamin biosynthesis in prokaryotes. Arch. Microbiol. 171, 293–300. doi: 10.1007/s002030050713
Berg, J. M., Tymoczko, J. L., and Stryer, L. (2007). Biochemistry. New York, NY: W. H. Freeman and Company.
Bertrand, E. M., and Allen, A. E. (2012). Influence of vitamin B auxotrophy on nitrogen metabolism in eukaryotic phytoplankton. Front. Microbiol. 3:375. doi: 10.3389/fmicb.2012.00375
Bertrand, E. M., Allen, A. E., Dupont, C. L., Norden-Krichmar, T. M., Bai, J., Valas, R. E., et al. (2012). Influence of cobalamin scarcity on diatom molecular physiology and identification of a cobalamin acquisition protein. Proc. Natl. Acad. Sci. U.S.A. 109, E1762–E1771. doi: 10.1073/pnas.1201731109
Bertrand, E. M., Moran, D. M., McIlvin, M. R., Hoffman, J. M., Allen, A. E., and Saito, M. A. (2013). Methionine synthase interreplacement in diatom cultures and communities: implications for the persistence of B-12 use by eukaryotic phytoplankton. Limnol. Oceanogr. 58, 1431–1450. doi: 10.4319/lo.2013.58.4.1431
Bohn, T., and Walczyk, T. (2004). Determination of chlorophyll in plant samples by liquid chromatography using zinc–phthalocyanine as an internal standard. J. Chromatogr. A 1024, 123–128. doi: 10.1016/j.chroma.2003.10.067
Brown, K. L. (2005). Chemistry and enzymology of vitamin B-12. Chem. Rev. 105, 2075–2149. doi: 10.1021/cr030720z
Carlucci, A. F., and Bowes, P. M. (1972). Vitamin B-12 thiamin and biotin contents of Marine Phytoplankton. J. Phycol. 8, 133–137. doi: 10.1111/j.0022-3646.1972.00133.x
Carlucci, A. F., and Silberna, S. B. (1969). Effect of vitamin concentrations on growth and development of vitamin-requiring algae. J. Phycol. 5, 64–67. doi: 10.1111/j.1529-8817.1969.tb02578.x
Caron, D. A., Peele, E. R., Lim, E. L., and Dennett, M. R. (1999). Picoplankton and nanoplankton and their trophic coupling in surface waters of the Sargasso Sea south of Bermuda. Limnol. Oceanogr. 44, 259–272. doi: 10.4319/lo.1999.44.2.0259
Croft, M., Lawrence, A., Raux-Deery, E., Warren, M. J., and Smith, A. G. (2005). Algae acquire vitamin B12 through a symbiotic relationship with bacteria. Nature 438, 90–93. doi: 10.1038/nature04056
Croft, M., Warren, M. J., and Smith, A. G. (2006). Algae need their vitamins. Eukaryot. Cell 5, 1175–1183. doi: 10.1128/EC.00097-06
Droop, M. R. (1962). “Organic micronutrients,” in Physiology and Biochemistry of Algae, ed R. Lewin (New York, NY: Academic Press), 141–159.
Droop, M. R. (2007). Vitamins, phytoplankton and bacteria: symbiosis or scavenging? J. Plankton Res. 29, 107–113. doi: 10.1093/plankt/fbm009
Gobler, C. J., Norman, C., Panzeca, C., Taylor, G. T., and Sañudo-Wilhelmy, S. A. (2007). Effect of B-vitamins (B-1, B-12) and inorganic nutrients on algal bloom dynamics in a coastal ecosystem. Aquat. Microb. Ecol. 49, 181–194. doi: 10.3354/ame01132
Gómez-Consarnau, L., Akram, N., Lindell, K., Pedersen, A., Neutze, R., Milton, D. L., et al. (2010). Proteorhodopsin phototrophy promotes survival of marine bacteria during starvation. PLoS Biol. 8:e1000358. doi: 10.1371/journal.pbio.1000358
Heal, K. R., Carlson, L. T., Devol, A. H., Armbrust, E., Moffett, J. W., Stahl, D. A., et al. (2014). Determination of four forms of vitamin B12 and other B vitamins in seawater by liquid chromatography/tandem mass spectrometry. Rapid Commun. Mass Spectrom. 28, 2398–2404. doi: 10.1002/rcm.7040
Helliwell, K. E., Lawrence, A. D., Holzer, A., Kudahl, U. J., Sasso, S., Kräutler, B., et al. (2016). Cyanobacteria and eukaryotic algae use different chemical variants of vitamin b. Curr. Biol. 26, 999–1008. doi: 10.1016/j.cub.2016.02.041
Hobbie, J. E., Daley, R. J., and Jasper, S. (1977). Use of nuclepore filters for counting bacteria by fluorescence microscopy. Appl. Environ. Microbiol. 33, 1225–1228.
Knap, A., Michaels, A., Close, A., Ducklow, H., and Dickson, A. (1996). Protocols for the joint global ocean flux study (JGOFS) core measurements. JGOFS, Reprint of the IOC Manuals and Guides No. 29, UNESCO 1994 119.
Koch, F., Marcoval, M. A., Panzeca, C., Bruland, K. W., Sañudo-Wilhelmy, S. A., and Gobler, C. J. (2011). The effect of vitamin B(12) on phytoplankton growth and community structure in the Gulf of Alaska. Limnol. Oceanogr. 56, 1023–1034. doi: 10.4319/lo.2011.56.3.1023
Mashego, M. R., Rumbold, K., De Mey, M., Vandamme, E., Soetaert, W., and Heijnen, J. J. (2007). Microbial metabolomics: past, present and future methodologies. Biotechnol. Lett. 29, 1–16. doi: 10.1007/s10529-006-9218-0
Okbamichael, M., and Sañudo-Wilhelmy, S. (2004). A new method for the determination of Vitamin B12 in seawater. Anal. Chim. Acta 517, 33–38. doi: 10.1016/j.aca.2004.05.020
Okbamichael, M., and Sañudo-Wilhelmy, S. A. (2005). Direct determination of vitamin B-1 in seawater by solid-phase extraction and high-performance liquid chromatography quantification. Limnol. Oceanogr. Methods 3, 241–246. doi: 10.4319/lom.2005.3.241
Paerl, R. W., Bertrand, E. M., Allen, A. E., Palenik, B., and Azam, F. (2015). Vitamin B1 ecophysiology of marine picoeukaryotic algae: strain-specific differences and a new role for bacteria in vitamin cycling. Limnol. Oceanogr. 60, 215–228. doi: 10.1002/lno.10009
Panzeca, C., Tovar-Sanchez, A., Agustí, S., Reche, I., Duarte, C. M., Taylor, G. T., et al. (2006). B vitamins as regulators of phytoplankton dynamics. Eos Trans. Am. Geophys. Union 87, 593–596. doi: 10.1029/2006EO520001
Pinto, E., Pedersén, M., Snoeijs, P., Van Nieuwerburgh, L., and Colepicolo, P. (2002). Simultaneous detection of thiamine and its phosphate esters from microalgae by HPLC. Biochem. Biophys. Res. Commun. 291, 344–348. doi: 10.1006/bbrc.2002.6438
R Core Team (2015). R: A Language and Environment for Statistical Computing. Vienna: R Foundation for Statistical Computing.
Roberts, L. D., Souza, A. L., Gerszten, R. E., and Clish, C. B. (2012). Targeted Metabolomics. Curr. Protoc. Mol. Biol. 98, 30.2:30.2.1–30.2.24. doi: 10.1002/0471142727.mb3002s98
Sañudo-Wilhelmy, S. A., Cutter, L. S., Durazo, R., Smail, E. A., Gómez-Consarnau, L., Webb, E. A., et al. (2012). Multiple B-vitamin depletion in large areas of the Coastal Ocean. Proc. Natl. Acad. Sci. U.S.A. 109, 14041–14045. doi: 10.1073/pnas.1208755109
Sañudo-Wilhelmy, S. A., Gobler, C. J., Okbamichael, M., and Taylor, G. T. (2006). Regulation of phytoplankton dynamics by vitamin B-12. Geophys. Res. Lett. 33:L04604. doi: 10.1029/2005GL025046
Sañudo-Wilhelmy, S. A., Gómez-Consarnau, L., Suffridge, C., and Webb, E. A. (2014). The role of B vitamins in Marine biogeochemistry. Ann. Rev. Mar. Sci. 6, 339–367. doi: 10.1146/annurev-marine-120710-100912
Suárez-Suárez, A., Tovar-Sánchez, A., and Rosselló-Mora, R. (2011). Determination of cobalamins (hydroxo-, cyano-, adenosyl-and methyl-cobalamins) in seawater using reversed-phase liquid chromatography with diode-array detection. Anal. Chim. Acta 701, 81–85. doi: 10.1016/j.aca.2011.04.040
Tang, Y. Z., Koch, F., and Gobler, C. J. (2010). Most Harmful algal bloom species are vitamin B1 and B12 auxotrophs. Proc. Natl. Acad. Sci. U.S.A. 107, 20756–20761. doi: 10.1073/pnas.1009566107
Tanioka, Y., Yabuta, Y., Yamaji, R., Shigeoka, S., Nakano, Y., Watanabe, F., et al. (2009). Occurrence of pseudovitamin B12 and its possible function as the cofactor of cobalamin-dependent methionine synthase in a cyanobacterium Synechocystis sp. PCC6803. J. Nutr. Sci. Vitaminol. 55, 518–521. doi: 10.3177/jnsv.55.518
Waldrop, G. L., Holden, H. M., and St Maurice, M. (2012). The enzymes of biotin dependent CO? Metabolism: what structures reveal about their reaction mechanisms. Protein Sci. 21, 1597–1619. doi: 10.1002/pro.2156
Waterbury, J., Watson, S., Valois, F., and Franks, D. (1986). Biological and ecological characterization of the Marine Unicellular Cyanobacterium Synechococcus. Can. Bull. Fish. Aquat. Sci. 214, 71–120.
Keywords: B-vitamins, LC/MS, Biological Oceanography, Phytoplankton, Bacterioplankton
Citation: Suffridge C, Cutter L and Sañudo-Wilhelmy SA (2017) A New Analytical Method for Direct Measurement of Particulate and Dissolved B-vitamins and Their Congeners in Seawater. Front. Mar. Sci. 4:11. doi: 10.3389/fmars.2017.00011
Received: 21 September 2016; Accepted: 09 January 2017;
Published: 03 February 2017.
Edited by:
Toshi Nagata, University of Tokyo, JapanReviewed by:
Marta Plavsic, Rudjer Boskovic Institute, CroatiaNaohiko Ohkouchi, Japan Agency for Marine-Earth Science and Technology, Japan
Copyright © 2017 Suffridge, Cutter and Sañudo-Wilhelmy. This is an open-access article distributed under the terms of the Creative Commons Attribution License (CC BY). The use, distribution or reproduction in other forums is permitted, provided the original author(s) or licensor are credited and that the original publication in this journal is cited, in accordance with accepted academic practice. No use, distribution or reproduction is permitted which does not comply with these terms.
*Correspondence: Christopher Suffridge, suffridg@usc.edu