BIIGLE 2.0 - Browsing and Annotating Large Marine Image Collections
 Daniel Langenkämper
 Martin Zurowietz
 Timm Schoening
 Tim W. Nattkemper
- 1Biodata Mining Group, Faculty of Technology, Bielefeld University, Bielefeld, Germany
- 2Deep Sea Monitoring Group, Marine Geosystems, GEOMAR Helmholtz Centre for Ocean Research, Kiel, Germany
Combining state-of-the art digital imaging technology with different kinds of marine exploration techniques such as modern autonomous underwater vehicle (AUV), remote operating vehicle (ROV) or other monitoring platforms enables marine imaging on new spatial and/or temporal scales. A comprehensive interpretation of such image collections requires the detection, classification and quantification of objects of interest (OOI) in the images usually performed by domain experts. However, the data volume and the rich content of the images makes the support by software tools inevitable. We define some requirements for marine image annotation and present our new online tool BIIGLE 2.0. It is developed with a special focus on annotating benthic fauna in marine image collections with tools customized to increase efficiency and effectiveness in the manual annotation process. The software architecture of the system is described and the special features of BIIGLE 2.0 are illustrated with different use-cases and future developments are discussed.
1. Introduction
Digital photography or videography and modern storage capacities have transformed the way how imaging is applied in marine sciences. Before charge coupled device (CCD) chips with sufficient spatial resolution, signal to noise ratio and connected storage capacity were available for moderate prices, the limited capacity of photography has restricted their application to single carefully selected shots of objects of interest (OOI) (i.e., biota, man-made infrastructures or geological formations). Video tapes allowed the visual inspection of larger areas, but the posterior processing and extraction of qualitative or quantitative information was cumbersome. This has all changed with the introduction of digitization and modern camera designs (a recent review on camera systems is given by Bicknell et al., 2016). It allows the imaging of larger areas in the benthic zone using mobile platforms such as autonomous underwater vehicle (AUV), remote operating vehicle (ROV) or ocean floor observation system (OFOS). In other contexts digital marine imaging is applied to monitor single areas over time with fixed underwater observatories (FUO) or to study long tracks in the water column (Barker et al., 1999; Barnes and NEPTUNE Canada Team, 2007; Purser et al., 2013; Vardaro et al., 2013; Godø et al., 2014). Recording and storing huge digital image collections from one area at a time point (or one location across a time interval) now enables image-based quantitative assessment of OOI for instance in the context of biodiversity assessment, habitat monitoring or geological resource assessment. In digital image collections the information content in the images shows no degradation over time and the image quality can be enhanced using image preprocessing algorithms, which provides in principle a good basis for an evaluation by visual inspection. Such image preprocessing methods proposed for underwater images target different problems such as de-noising, compensating color attenuation, de-hazing, contrast enhancement or spatial alignment and are defined using either a model of the imaging process or heuristics, or a combination of both. Reviews on preprocessing have been published by Schettini and Corchs (2010) and Wang et al. (2015).
However, on the one hand the introduction of new technologies has transformed image-based marine biology research and increased the scientific potential of marine imaging to generate new qualitative or quantitative information. On the other hand the rapidly accumulating image collections are challenging the researchers' ability to analyze and interpret this data. The challenge is getting even more serious due to the continuously increasing image resolution in space, time and even frequency (considering for instance the progress in hyperspectral imaging applications in marine sciences). Ten years ago, benthic images of the sea floor showed a visual footprint of approx. 3 m2 and nowadays visual footprints of more than 400 m2 can be recorded (Schoening et al., 2012; Kwasnitschka et al., 2016). As a consequence, experts need more time to screen the images and detect all relevant OOI. The community faces the fact that the traditional approach with one observer, manually viewing and annotating all the image data collected in one session using standard desktop software is not applicable any more in a growing number of projects. New methodological approaches are required that focus on collaboration, interdisciplinary research and computational support, as has been pointed out as well in Durden et al. (2016b).
To solve the bottleneck problem in the interpretation and analysis of marine image collections, effective computational support for the process of expert-based marine image data interpretation is required. Such a software tool must enable users to select and display images on a screen, mark a region of interest (ROI) in the image that shows the OOI and assign a label to the ROI. The label is usually a semantic category (like a habitat classification or a morphotype or taxon for an organism), which is often taken from an established catalog or taxonomy (e.g., WoRMS: Vandepitte et al., 2013; Horton et al., 2016). We will refer to this process of assigning labels to images or ROIs as semantic annotation. In media informatics, semantic annotation usually relates to the assignment of semantics to the media (e.g., an image from a sports event), which is usually a summary of its content [like “soccer,” “final,” “goal,” “(name-of-a-soccer-player)”]. However, in many marine imaging contexts the interpretation objective is the detection and classification of species rather than classifying the entire image. Obviously marine image analysis tools should support both kinds of annotations.
Very early actions have been taken for long-term data safety and storage. But system for creating and managing semantic annotations handling the huge amounts of data since the beginning of digitization have not been considered at that time. This has changed in the last 5–7 years and a few academic groups have identified marine image analysis as a new and challenging field of research for computer science. This new field could be referred to as marine (image) informatics, and includes concepts of database engineering, data mining, signal/image processing, pattern recognition and machine learning. Marine informatics would thus share some computational research areas with bioinformatics/computational biology.
To support experts in the visual inspection and interpretation of digital marine image collections a variety of software solutions have been developed as reviewed by Gomes-Pereira et al. (2016). These software solutions range from single purpose scripts to sophisticated information systems with a data base system as a basis to host the raw data, the users' annotations and the image information. In the review by Gomes-Pereira et al. (2016), the authors list 23 annotation tools, referred to as underwater image annotation software (UIAS), review the different features and discuss the potential future trends driven by the demands of the user communities. In summary, the next generation of UIAS shall target improving (I) Annotation quality, (II) Scientific collaboration, and (III) Data fusion and integration. To improve the annotation quality (objective I), the software shall provide tools to evaluate the accuracy and the reproducibility of annotations as discussed in Schoening et al. (2016). The term annotation accuracy describes how well an annotation corresponds to the state-of-the-art scientific knowledge. It is important to note that one annotation is usually a composition of two cognitive tasks: (1) the detection of an OOI in the image and (2) the assignment to semantics i.e., a label (like a habitat category, morphotype, taxon, sediment type). In past studies it was observed that users seem to have individual strengths and weaknesses in these two sub-tasks (Culverhouse et al., 2003; Durden et al., 2016a). This motivates a UIAS design, that offers two different kinds of tools for these two tasks. In order to support marking (and classifying) OOI in images a whole image screening (WIS) tool is needed that shows the entire image, allows convenient continuous zoom in/out and switch back and forth between consecutive images. The second kind is a single patch classification (SPC) tool to support the review of all marked positions that have been assigned to one category. Reviewing the positions, the labels can either be confirmed or corrected.
The annotation reproducibility term expresses the inter-/intra-observer agreement, i.e., if a user (or a community of users) is able to provide the same annotation for one image in two different sessions (ignoring the question if an annotation can be considered correct or not). To achieve high reproducibility, not only WIS and SPC tools are needed, but also tools to support the analysis of the annotations collected from different users and/or in different sessions regarding the inter-/intra-observer agreement.
Although annotation accuracy and reproducibility are related to each other it is important to discriminate these two terms, especially in domains where a classification of an OOI to a taxonomic/morphotype category may be non-trivial due to limitations in the signal contrast and in the background knowledge. As a consequence it may be difficult to determine the correctness of an annotation, however, the reproducibility can still be determined and provides an important quality index of an annotation result. To support accuracy and reproducibility assessment it is necessary that a tool supports the organization of inter-/intra-observer agreement studies and the review of past annotations. The latter must be offered in different ways, i.e., in combination with different filter steps. A posterior review of annotations might for instance be focused on one particular species since it was reported that the users' annotation performance show considerable variation for different species (Schoening et al., 2012; Durden et al., 2016a). In this case the display of all image patches showing the single species in a regular grid (as illustrated in Schoening et al., 2016) may be appropriate for a posterior SPC for this label. Another review mode could be the iterative display of all OOI marked by one particular user in one particular image collection (with or without the assigned labels). Position markers in the images enable a viewer to see if some OOI have been missed, which was one primary source of error reported by Durden et al. (2016a).
In many projects the full interpretation of an image collection may demand a collaborative approach (see improvement objective II above) so that the input of different experts with specialized domain knowledge, sometimes from different scientific disciplines is required. To enable a collaborative analysis of the marine image data, the annotation tool shall run in a web browser (to be independent from the operating system) and offer all functions necessary for users to select image collections, associate those to a project that can be shared with other users by inviting them to this project using the system online. The feature of making images accessible via the web and offering different options to assign semantics to the images or image regions is offered already by a small number of new tools such as Collaborative and Automated Tools for Analysis of Marine Imagery (CATAMI: http://catami.org) Althaus et al. (2015), SQUIDLE (http://squidle.acfr.usyd.edu.au/), CoralNet (Beijbom et al., 2015, http://coralnet.ucsd.edu/) or BIIGLE (BioImage Indexing, Graphical Labeling and Exploration, https://ani.cebitec.uni-bielefeld.de/biigle/, Ontrup et al., 2009), the predecessor of the proposed system. In addition to the image data, the users should also share and edit the same nomenclature or naming conventions for the semantic annotation, i.e., use the same taxonomic categories. Those could be downloaded from external sources [like the World Register of Marine Species (WoRMS, Horton et al., 2016) or other catalogs] or manually designed by the users using a simple editor.
To address objective III, the integrative analysis of the resulting annotation data, the tool shall support the fusion with data from other sources and sensors such as time, geo-coordinates, current, chemical measurements, etc. The tool needs to offer customizable export functions so that the users can export the annotations for the images for chosen collections on different degrees of granularity. A low level of detail export would be one accumulative table of abundances for an entire volume (e.g., one image transect from an OFOS dive or an observation period from a FUO). A high level of detail export would be a list of detailed descriptions of all annotations per image for all images in a volume. In addition information from the images should be in the export such as metadata or pixel scale information from the images to enable size measurements for individual marked species (biomass assessment) or for the whole image footprint (to determine relative abundances per m2). While metadata can be either extracted from the image file headers or read from additional log files, the scale information sometimes must be computed based on laser point marker positions. These are marked by a human user or an image processing algorithm in each image (Schoening et al., 2015).
In this paper we present a new version of our early proposed system BIIGLE (Ontrup et al., 2009), which was introduced 8 years ago with a primary focus on collecting annotations to train machine learning algorithms. However, BIIGLE's mission transformed more and more to be used as a tool for collaborative web-based manual marine image annotation. The next generation in BIIGLE's history was the (BIIGLE-) DIAS tool, which was a rapid prototype to be used offshore during two cruises as part of the JPIO Ecomining project. The new version presented in this paper is referred to as BIIGLE 2.0 and in the next section the software architecture is motivated and described. Afterwards we will show, how the three aspects I–III are addressed with the functions of BIIGLE 2.0 using different data sets provided by the collaborators and users. The paper concludes with a discussion and outlook. The web application can be found at https://biigle.de/ using biiglepaper@example.com as username and frontiersinm as password.
2. Materials and Methods
BIIGLE 2.0 is a web-based application written in the PHP language. The server-side architecture is based on the Laravel 5 model-view-controller framework (https://laravel.com/). The dynamic client-side components utilize the AngularJS 1 JavaScript framework (https://angularjs.org/). A combination of a PostgreSQL relational database (https://postgresql.org/) and the local file system is used for persistent data storage. From a software engineering perspective there were three main goals in the design of BIIGLE 2.0:
(a) An application architecture ready for large scale distributed and cloud-based operation to improve scientific collaboration (II),
(b) a modular architecture allowing for different instances of the application serving different purposes to improve the quality/usability/flexibility of annotating (I) as well as utilization of modules for data fusion and integration (III) and
(c) a flexible Hypertext Transfer Protocol (HTTP) application programming interface (API) that supports communication with different kinds of custom applications or automated scripts to integrate external data sources (III) and to allow access by arbitrary external applications.
The first design goal (a) is met by the Laravel framework, which is inherently designed for cloud-based operation and, among other things, supports cloud storage or running multiple instances of an application on multiple hosts out of the box.
The modular architecture (b) uses PHP packages that can extend modern object-oriented PHP applications. The Laravel framework in particular supports extensions in the form of these packages. JavaScript applications based on the AngularJS 1 framework are organized in modules, which in turn consist of individual components. A single module can be extended by new components as well as depend on entire other modules. The combination of PHP packages and AngularJS modules allows for a modular application architecture. The BIIGLE 2.0 application core only includes the definition of the basic data structures, user management and most of the API. Any additional functionality like the annotation tool, the Largo tool for re-evaluation of annotations or the label trees—all of which are described in the following section – are individual modules. For a detailed overview of BIIGLE 2.0 modules and their connections please see the Supplementary Material. The BIIGLE 2.0 API (c) is designed following the representational state transfer (RESTful) principles introduced by Fielding (2000) as a common interface for multiple different purposes. First, the API is used for communication between the static HTML and dynamic JavaScript components of the client-side front end and the server-side PHP back end to process the manual interaction of users with the application. In addition to that, the API allows the same functionality for communication with custom user-created scripts (e.g., written in Python or R) to interact with the application in an automated fashion. These can be used to automate tasks like creating a lot of volumes (i.e., image collections, see Data models below) at once. Finally, the API can be used to connect BIIGLE 2.0 with other web applications or web services for data integration (e.g., WoRMS) or to offer additional features (see Figure 1).
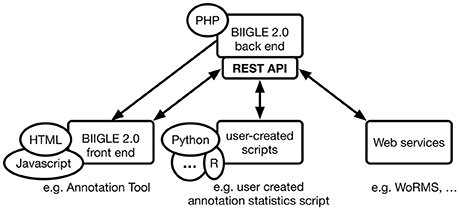
Figure 1. Communication flow between the BIIGLE 2.0 back end, front end, user-created scripts and web services through HTTP. The back end only directly serves the HTML views of the front end. All other communication targets the API, either via asynchronous JavaScript or regular HTTP requests. User-created scripts or web services can use the API to automate interactions or use more advanced features that are not directly available through the front end.
2.1. Data Models
The basic elements of the BIIGLE 2.0 data architecture are users, volumes, projects, annotations, and labels. A label ω is any kind of semantic category assigned to a ROI in an image or to an image as a whole. Labels may be morphotypes, taxa or they may describe a holistic property of an image like a habitat category or an event, e.g., algae bloom. Labels are organized in label trees, which reflect the hierarchical structure of a set of related labels (like a taxonomy). A label tree may also have a depth of 1 if the label set used in a study is not organized in a hierarchy.
Image collections in BIIGLE 2.0 are referred to as volumes. All images of a volume usually share common properties like the location and/or space of time where the images were taken. Volumes, in turn, are aggregated into projects. A project P is defined as a tuple where is a set of volumes that belong to the project, is a set of label trees that may be used to create annotations in all volumes of the project and a set of users who may access the project. One example for different label trees used in a project could be = {“habitat types”, “benthic megafauna”, “sediment plume patterns”}.
An annotation Ai is defined as a tuple Ai = (ri, ci) where ri is the ROI spatial description and ci a set of classifications, i.e., labels assigned by different observers for this ROI. The ROI description is a tuple ri = ({(x, y)}, s, It) containing a set of positions {(x, y)}, a shape parameter s (e.g., Point, Rectangle) of the ROI and the ROI's host image It (note that the ROI may cover the whole image as well). ci = (ci,1, …ci,J) is a list of all J classifications for Ai. Each is a tuple of a label ω, a user ID k and a confidence . The confidence represents the confidence of user k that their label ω is the correct one. The selection of a confidence for the annotation is an optional feature in BIIGLE 2.0 and can be disabled (i.e., ).
2.2. User Rights and Permission Management
All users can create new label trees, projects or volumes. To manage collaboration and access authorization, BIIGLE 2.0 provides an extensive permission system based on user roles and membership. A project and the associated volumes can only be accessed if a user is a member of the project. There are three user roles for project members: guest, editor, and admin. A user with guest status has read-only access to the project, which means that they are not authorized to add annotations in any of the volumes attached to the project. Such a status may be important if the system is used to make data (images and annotations) publicly available in the context of scientific reports or scientific publications. In contrast to that, users with editor status have the permission to add annotations but can only modify annotations or attached labels created by themselves. Users with the admin status have the same permissions than editors and additionally can edit any annotation entered by an editor in this particular project as well as manage the project members, volumes or label trees.
Label trees are created independently from projects and can be defined as either private or public. Similar to projects, private label trees can only be accessed by users who are members of the label tree. Also, private label trees may only be used by certain authorized projects. In contrast to that, public label trees can be accessed by any user and used by any project. Only members invited to a label tree can create or modify labels of the label tree. Admins of a Label tree can manage the members of the tree, authorize projects and the public/private visibility of the Label tree.
3. Results
Biigle 2.0 was implemented keeping in mind the requirements, concepts and models explained in the above section. While the system is designed for the continuous development and integration of new tools, a basic set of tools has already been implemented and tested and can be used to enhance the marine image annotation process following the recently proposed RecoMIA guidelines (Schoening et al., 2016). The basic functions are displayed in Figure 2. After logging into the system the users get an overview of their projects, can select a project or create a new one (see Figure 2a). In a selected project the information about associated volumes, label trees and members is shown and users can associate new label trees, new volumes or invite other users to the project (see Figure 2b). If a volume is selected, the volume overview is displayed, showing thumbnails of the volume's images (see Figure 2c). Users can sort the images according to color or brightness or filter out images based on their annotation status. A selected image can be investigated in the annotation screen (see Figure 2d). Users can move the field of view around and adjust the zoom level while the overview is displayed in the upper right. It is important to note that the zoom is continuous to avoid spatial confusion, which is a common problem in switching between discrete zoom levels. Using the different tools in the menu at the bottom, OOI can be marked with a point or line, or outlined with circles, rectangles or polygons and a label can be assigned using the associated label trees. Using the arrow symbols the user can switch to the next image of the sequence.
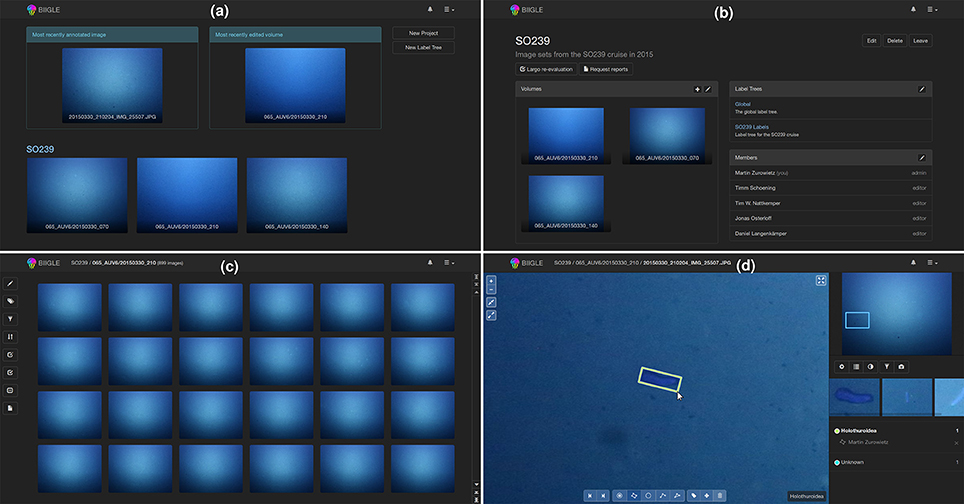
Figure 2. The main function of BIIGLE 2.0 is to make marine image data visually accessible and to provide users options for annotating the data via the web. After logging into the system users first get an overview of their most relevant image, volume and projects (see a) where each project is displayed with the newest volumes and the project name. When a project is selected, the details of the project are displayed showing members, label trees and volumes of the project (see b). After selecting a volume, the images of the volume are displayed with thumbnails (see c) and can be browsed, filtered and ordered with different criteria (like annotations or brightness). If the user selects one image from the thumbnail overview, the image can be inspected and objects of interest can be marked and labeled (see d).
In some cases, a display of the volume content in its geospatial context, i.e., on a map, may be desirable. BIIGLE 2.0 offers two options to include geospatial information for each image in a volume. The first option is to include the information in the EXIF header of the images if they are stored as JPEG files. In this case the coordinates are automatically imported by the system whenever a new volume is created and the image locations can be directly displayed on a map (see Figure 3a) as an alternative to the regular volume overview with image thumbnails. If no geospatial information can be found in the EXIF data or the images are not stored as JPEG files, BIIGLE 2.0 offers a way to upload the image coordinates separately as a CSV file.
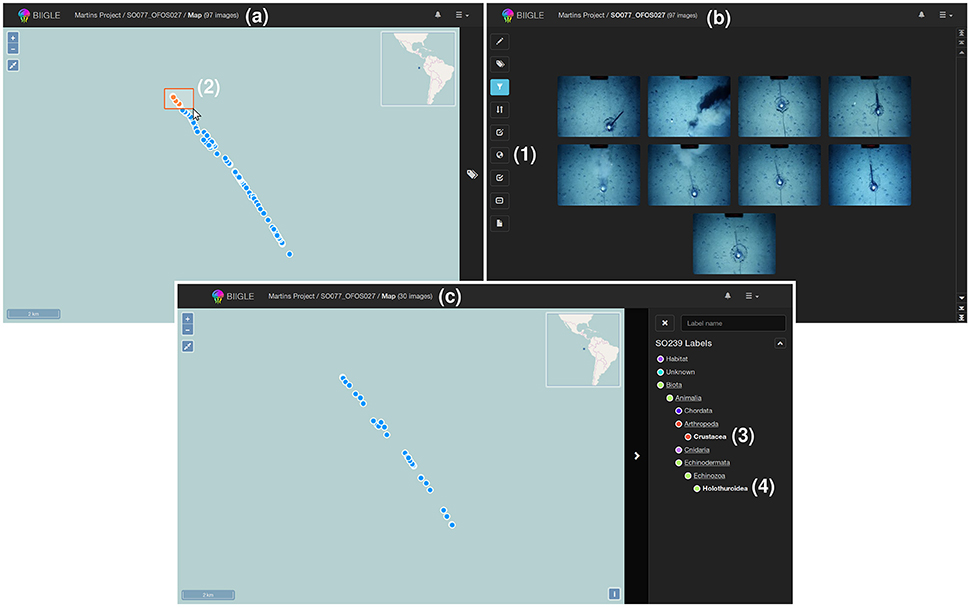
Figure 3. A geospatial display supports users to visualize image volumes in the geospatial context. If geocoordinates are available in the system (e.g., included in the EXIF header of JPEG files) a globe symbol is displayed in the left menu of the volume overview (1). After selecting this button the images of the volume are displayed as dots on a map (see a). Users can select subgroups of these dots (2) to filter the image thumbnails that are displayed in the volume overview, for instance to start an annotation process or to investigate the annotations in these images (see b). By selection of annotation labels (like “Crustacea” and “Holothuroidea” in this example (3, 4) as a filter the geospatial display is updated to show only those images of the volume that include such an annotation (see c).
The geospatial display shows a world map based on OpenStreetMap (https://www.openstreetmap.org/) and displays the image locations of the volume as dots. To achieve spatial filtering, the mouse cursor can be applied to select groups of images (i.e., dots) by drawing a frame on the map. Whenever the selection of images on the map changes, the volume overview is updated to show only thumbnails of images that were selected (see Figure 3b). As shown in Figure 3c, the tool can also be used to show the locations of only those images with an annotation of a particular label ω. Either way, by browsing the thumbnail overview of a volume or selecting images in the geospatial display, a user finally chooses one image to start the annotation process. The tools assisting in the annotation process are explained in the following.
3.1. Image Enhancement
Image acquisition in an underwater setting is challenging due to the general circumstances in marine photography and the location-specific conditions at the site of interest. As a consequence it is impossible to set up an imaging framework in advance that will guarantee images with perfect contrast or signal-to-noise ratio. A visual inspection of the images by the users can always benefit from basic tools for the manual adjustment of image features such as brightness, contrast, hue, saturation, or vibrance, prior to the final visual inspection and annotation. These adjustments are offered using sliders as shown in Figure 4 and can be used in an interactive way where the image display is updated in real time (see Supplementary Materials for more information).
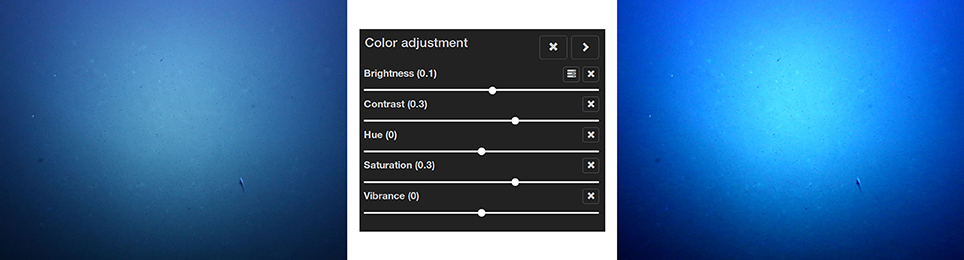
Figure 4. Color adjustment that can be applied to an image in BIIGLE 2.0. On the left there is the original image and on the right the image with color adjustment.
3.2. Whole Image Screening
To support the task of whole image screening (WIS) the users can choose two different modes to browse an image volume for OOI to mark and annotate them. In the Free Mode (FM), the users can browse the volume, select single images and search for OOI in the image by freely zooming in and out at different locations. This is the “classic” way of image annotation and works well if only a small number of OOI are visible in each image and have an adequate figure-ground contrast. If the number of OOI exceeds a certain value and some of the objects are not easy to see (since they have a color or texture similar to the ground/are covered with sediment) this mode has the potential to create a large number of false negatives, i.e., many OOI are missed by the users.
Thus, a second mode has been implemented referred to as Lawnmower Mode (LMM) (see Figure 5). Before going into the LMM, the user first selects a desired zoom level. The area of the image, which is now visible will be referred as a virtual tile of that image. The image is now divided into regular virtual tiles [e.g., (1)–(9), Figure 5]. After activating the LMM, the system will start meandering (like a lawnmower) through the image tile by tile [e.g., starting at tile (1) and moving to tile (2),(3)…until (9), see Figure 5], controlled by the user who is clicking an arrow symbol or using the keyboard if they want to move to the next tile. The system starts in the lower left corner of the image and ends at the upper right. The tiles are chosen to have minimal overlap to avoid screening the same image regions multiple times.
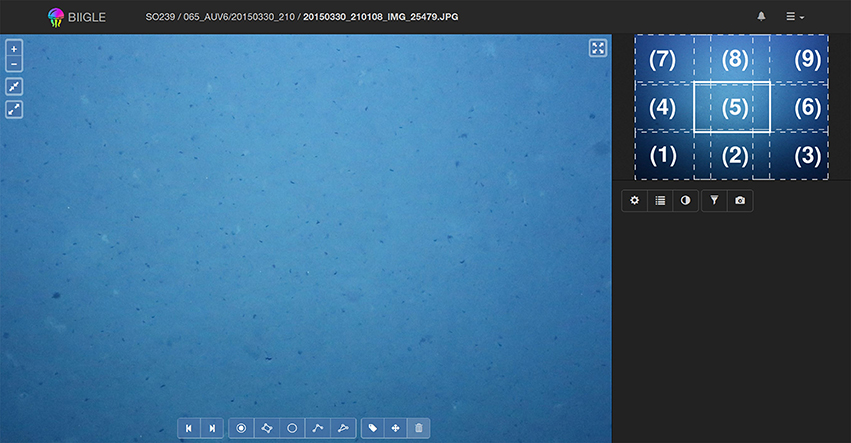
Figure 5. Whole image screening in Lawnmower Mode (LMM): The LMM can be used to annotate a whole image while focusing on small tiles at a time. The user selects the desired zoom level on which they want to annotate and activates the LMM. The view will move to the lower left corner of the image as can be seen in the mini-map (1). By pressing the right arrow key the view will advance to (2), (3), until (9). After the final tile of an image has been displayed the view will proceed to tile (1) of the next image in the volume. Analogously this works with the left arrow key to move backwards.
3.3. Annotation Review and Quality Assessment
To assess and improve the accuracy and reproducibility of the annotations Ai, a review of these annotations Ai by either the annotator itself or the group of all involved annotators is often necessary. In order to enable users to focus on the classification task, the users shall be presented just the small patch showing the OOI (which was marked in a WIS step) and not the entire image to avoid distractions. Two single patch classification tools are offered by the system. The first tool Volare (Volume label review) offers a review of all annotation results ωi in one volume including spatial context information. This is sometimes necessary for a more liberal annotation process, as this information might help in verifying/falsifying annotations. In Volare the view initially zooms in on the first annotation ωi and using the keyboard (or the forward/backward button in the web interface) the user can pan the view to show the next/previous annotation (see Figure 6). If all annotations of an image have been shown, the view switches to the next image. Since the Volare tool is embedded in the annotation viewer users can always zoom in or out, pan the view, manipulate the image and edit or add annotations.
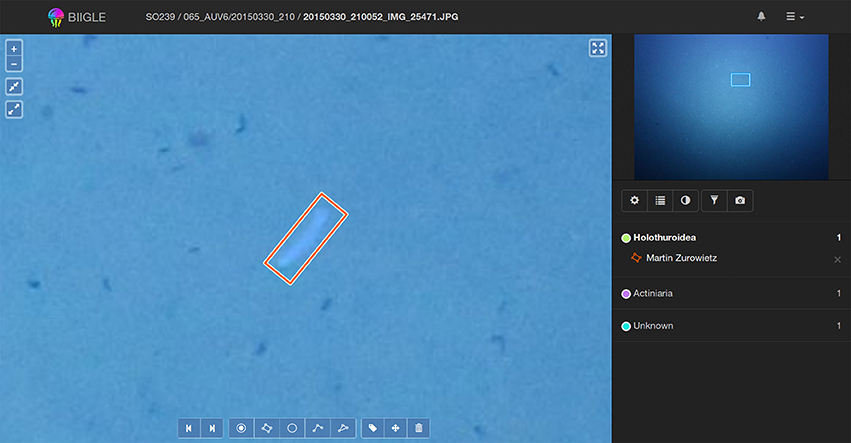
Figure 6. Using the Volare tool a user can screen all annotations in a volume. Control keys can be used to switch back and forth between single annotations. In each step the current annotation is shown enlarged at the center of the main window (left) and framed in the overview window (top right).
The second tool Largo (Label Review Grid Overview) displays all annotations Ai of a volume with one specific label ω as image excerpts in a grid (see Figure 7). Since objects with the same label ω should be morphologically consistent in a volume, finding outliers in a grid of all annotations is easier than reviewing every annotation independently. This can improve the speed and quality of the annotation review process significantly. Furthermore, reviewing an annotation Ai without further context information (e.g., surrounding environment or geo-location) helps users to focus on morphological details and small differences. This way, the perceived morphological contrast can be enhanced improving both accuracy and reproducibility.
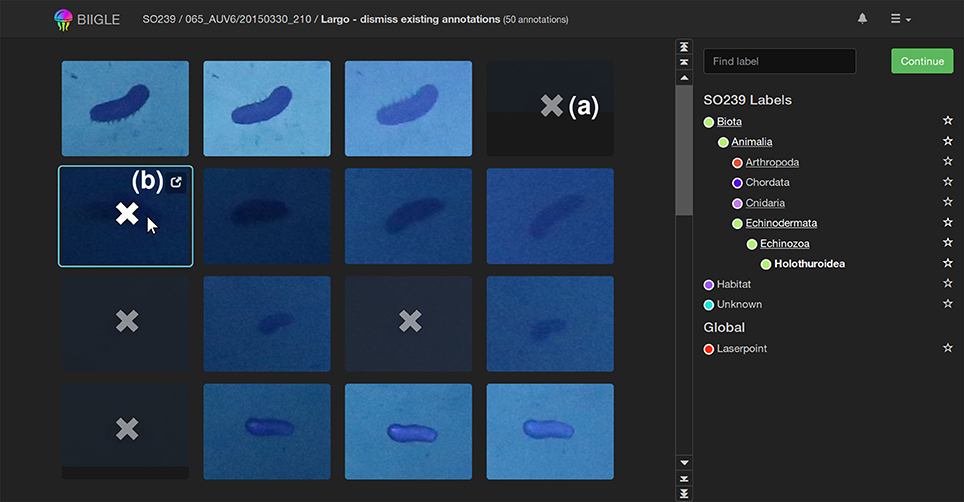
Figure 7. The Largo tool: All annotations of a label ω in a volume are shown in an image grid to quickly find erroneous annotations. In this example holothurians (Holothuroidea) are displayed. Erroneous annotations can be corrected by first selecting them [as indicated by the “x”-symbol, (a)] and then re-labeling or erasing them in the second step. A click on the popup symbol (b) opens the Volare tool for closer inspection of single annotations.
3.4. Inter-/Intra-Observer Agreement and Reproducibility
Reviewing annotations is a good way to improve the annotation quality, but sometimes it is inevitable to assess the quality of annotations/annotators to avoid systematic errors. As proposed in RecoMIA (Schoening et al., 2016) the inter-/intra-observer agreement should be measured and discussed during annotator meetings. BIIGLE 2.0 aids in providing annotation sessions, which can hide annotations of the own user and/or other users in a certain time span, so that annotators can re-annotate a set of images to estimate the inter-/intra-observer agreement. BIIGLE 2.0 provides reports to export the annotation data of these sessions to compute the agreement values of a group of users. The result of an annotator meeting could be that certain users are annotating some objects with label ω with a systematic error, i.e., the annotators have a false mind representation of it due to e.g., lack of experience or lack of reference. Furthermore, if most annotators are under-performing this could be an indication that the object with label ω is too hard to detect and should be detected on a less detailed level or dropped entirely from the experiment due to lack of reproducibility.
3.5. Flexibility
Most UIAS, including the first version of BIIGLE (Ontrup et al., 2009) on which BIIGLE 2.0 is conceptually based, only allow for a single fixed label tree, i.e., the user cannot change it. To allow changes due to new information, e.g., the outcome of an annotator meeting, or the discovery of a previously unknown taxon, BIIGLE 2.0 introduces a dynamic user editable label tree (see Figure 8). Label trees can be shared between different projects, where they can be either restricted to a specific set of projects or available for all projects. Sharing of label trees helps to improve consistency between related projects and during evaluation of the image data. Furthermore, an import from the WoRMS database (Horton et al., 2016) can be used to easily add either single taxa or taxa with all their parents to a label tree.
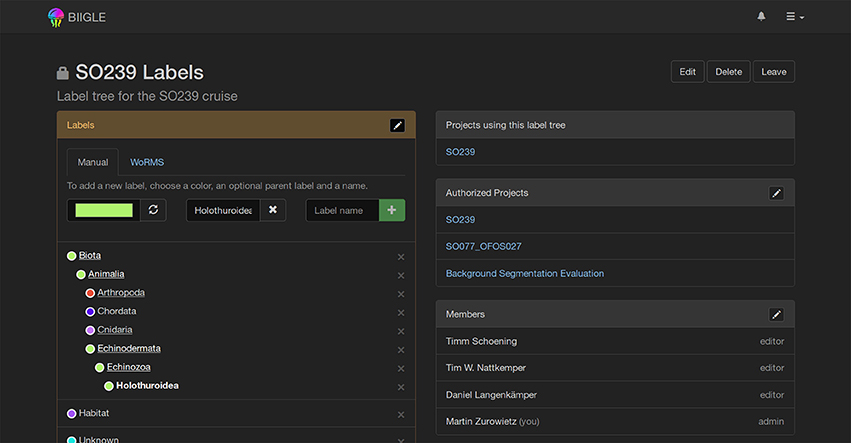
Figure 8. Label Tree: A hierarchical label tree is shown. Underlined label names can be selected to expand the view and show their child labels. New labels can be introduced anywhere in the tree and a color representing the taxon can be selected. The World Register of Marine Species (WoRMS, Horton et al., 2016) import allows users to import label tree data from an established database.
Export: Different reports for exporting the data can be generated using BIIGLE 2.0. Available reports are the basic-, extended-, full- and raw-report. The basic report provides a histogram counting the occurrence of all labels ω in a volume, displayed as bar chart. The extended report is an Excel file containing a histogram of all labels ω for each image in a volume. The full report lists each annotation Aj with the detailed information on position, shape, user, image filename, etc. The raw report is similar to the full report but in a format to be easily accessible for automated processing. All reports can be requested either for a single volume or for all volumes of a project.
4. Discussion
The new BIIGLE 2.0 system has been implemented and tested in different contexts and has shown to run efficient and reliable. Although the tools for improving accuracy and reproducibility are now in use, the next step must be made now, which is their integration in the scientific workflow of marine image analysis. The trade-off between an investment of precious time to review annotations on the one hand and the increase in annotation quality on the other hand must be discussed by the researchers depending on the context. However, the aspect of reproducibility is of fundamental importance for experiments in natural sciences. While of course the process of marine imaging in-situ is not reproducible (in the sense of recording the same images a second time), the extraction of quantitative or qualitative data from the images should be reproducible and accurate. Tools such as BIIGLE 2.0 can help to find the right trade-off in marine imaging projects.
Another important contribution will be the support for collaborative annotation and design of label trees. This way, the semantic concepts and new visual concepts of morphotypes can be aligned, which is important for linking results from different expeditions.
In some cases the accumulating annotations may provide a basis for future studies on automated annotation, like the detection of OOI, image segmentation or classification, which would be a great achievement in the overall aim to overcome the bottleneck in marine image interpretation.
Author Contributions
DL, MZ, TS, and TN all contributed to all aspects of designing the software/method, preparing the paper and reviewing it. All authors approved the final version and agree to be accountable for all aspects of the work.
Funding
The work of DL and MZ was supported by the Bundesminitserium für Bildung und Forschung (BMBF, FKZ 03F0707C). The work of TS was supported by the BMBF (FKZ 03F0707A)
Conflict of Interest Statement
The authors declare that the research was conducted in the absence of any commercial or financial relationships that could be construed as a potential conflict of interest.
Supplementary Material
The Supplementary Material for this article can be found online at: https://www.frontiersin.org/article/10.3389/fmars.2017.00083/full#supplementary-material
References
Althaus, F., Hill, N., Ferrari, R., Edwards, L., Przeslawski, R., Schönberg, C. H., et al. (2015). A standardised vocabulary for identifying benthic biota and substrata from underwater imagery: the catami classification scheme. PLoS ONE 10:e0141039. doi: 10.1371/journal.pone.0141039
Barker, B. A., Helmond, I., Bax, N. J., Williams, A., Davenport, S., and Wadley, V. A. (1999). A vessel-towed camera platform for surveying seafloor habitats of the continental shelf. Contin. Shelf Res. 19, 1161–1170. doi: 10.1016/S0278-4343(99)00017-5
Barnes, C. R., and NEPTUNE Canada Team (2007). “Building the world's first regional cabled ocean observatory (NEPTUNE): realities, challenges and opportunities,” in OCEANS 2007 (Victoria, BC: IEEE Press), 1–8. doi: 10.1109/OCEANS.2007.4449319
Beijbom, O., Edmunds, P., Roelfsema, C., Smith, J., Kline, D., Neal, B., et al. (2015). Towards automated annotation of benthic survey images : variability of human experts and operational modes of automation. PLoS ONE 10:e0130312. doi: 10.1371/journal.pone.0130312
Bicknell, A., Godley, B., Sheehan, E., Votier, S., and Witt, M. (2016). Camera technology for monitoring marine biodiversity and human impact. Front. Ecol. Environ. 14, 424–432. doi: 10.1002/fee.1322
Culverhouse, P., Williams, R., Reguera, B., Herry, V., and Gonzalez-Gil, S. (2003). Do experts make mistakes? A comparison of human and machine identification of dinoflagellates. Mar. Ecol. Prog. Ser. 247, 17–25. doi: 10.3354/meps247017
Durden, J., Bett, B., Schoening, T., Morris, K., Nattkemper, T., and Ruhl, H. (2016a). Comparison of image annotation data generated by multiple investigators for benthic ecology. Mar. Ecol. Prog. Ser. 552, 61–70. doi: 10.3354/meps11775
Durden, J. M., Schoening, T., Althaus, F., Friedman, A., Garcia, R., Glover, A. G., et al. (2016b) “Perspectives in visual imaging for marine biology ecology: from acquisition to understanding,” in Oceanography Marine Biology: An Annual Review, Vol. 54, eds R. N. Hughes, D. J. Hughes, I. P. Smith, A. C. Dale (Boca Raton, FL, CRC Press), 1–72.
Fielding, R. T. (2000). Architectural Styles and the Design of Network-Based Software Architectures. PhD thesis, University of California, Irvine.
Godø, O. R., Johnsen, S., and Torkelsen, T. (2014). The love ocean observatory is in operation. Mar. Technol. Soc. J. 48, 24–30. doi: 10.4031/MTSJ.48.2.2
Gomes-Pereira, J. N., Auger, V., Beisiegel, K., Benjamin, R., Bergmann, M., Bowden, D., et al. (2016). Current and future trends in marine image annotation software. Prog. Oceanogr. 149, 106–120. doi: 10.1016/j.pocean.2016.07.005
Horton, T., Kroh, A., Bailly, N., Boury-Esnault, N., Brandão, S. N., Costello, M. J., et al. (2016). World Register of Marine Species (Worms). Available online at: http://www.marinespecies.org
Kwasnitschka, T., Köser, K., Sticklus, J., Rothenbeck, M., Weiß, T., Wenzlaff, E., et al. (2016). Deepsurveycam-a deep ocean optical mapping system. Sensors 16:164. doi: 10.3390/s16020164
Ontrup, J., Ehnert, N., Bergmann, M., and Nattkemper, T. (2009). “BIIGLE-Web 2.0 enabled labelling and exploring of images from the Arctic deep-sea observatory HAUSGARTEN,” in BIIGLE-Web 2.0 enabled labelling and exploring of images from the Arctic deep-sea observatory HAUSGARTEN, (Bremen: IEEE), 1–7.
Purser, A., Thomsen, L., Barnes, C., Best, M., Chapman, R., Hofbauer, M., et al. (2013). Temporal and spatial benthic data collection via an internet operated deep sea crawler. Methods Oceanogr. 5, 1–18. doi: 10.1016/j.mio.2013.07.001
Schettini, R., and Corchs, S. (2010). Underwater image processing: state of the art of restoration and image enhancement methods. EURASIP J. Adv. Signal Process. 2010, 1–15. doi: 10.1155/2010/746052
Schoening, T., Bergmann, M., Ontrup, J., Taylor, J., Dannheim, J., Gutt, J., et al. (2012). Semi-automated image analysis for the assessment of megafaunal densities at the Arctic deep-sea observatory HAUSGARTEN. PLoS ONE 7:e38179. doi: 10.1371/journal.pone.0038179
Schoening, T., Kuhn, T., Bergmann, M., and Nattkemper, T. W. (2015). DELPHI - fast and adaptive computational laser point detection and visual footprint quantification for arbitrary underwater image collections. Front. Mar. Sci 2:20. doi: 10.3389/fmars.2015.00020
Schoening, T., Osterloff, J., and Nattkemper, T. W. (2016). Recomia - recommendations for marine image annotation: lessons learned and future directions. Front. Mar. Sci. 3:59. doi: 10.3389/fmars.2016.00059
Vandepitte, L., Vanhoorne, B., Decock, W., Verbeeck, A. T., Dekeyzer, S., Colpaert, S., et al. (2013). “World register of marine species,” in Book of Abstracts, 98, eds J. Mees and J. Seys (Brugge: VLIZ Special Publication). Available online at: http://www.marinespecies.org
Vardaro, M. F., Bagley, P. M., Bailey, D. M., Bett, B. J., Jones, D. O., Milligan, R. J., et al. (2013). A southeast atlantic deep-ocean observatory: first experiences and results. Limnol. Oceanogr. Methods 11, 304–315. doi: 10.4319/lom.2013.11.304
Keywords: underwater image analysis system, image annotation, marine imaging, environmental sciences, marine biology, megafauna, data bases, human computer interaction (HCI)
Citation: Langenkämper D, Zurowietz M, Schoening T and Nattkemper TW (2017) BIIGLE 2.0 - Browsing and Annotating Large Marine Image Collections. Front. Mar. Sci. 4:83. doi: 10.3389/fmars.2017.00083
Received: 13 January 2017; Accepted: 13 March 2017;
Published: 28 March 2017.
Edited by:
Cinzia Corinaldesi, Università Politecnica delle Marche, ItalyReviewed by:
Simone Marini, Consiglio Nazionale Delle Ricerche (CNR), ItalyKristian Kai Meissner, Finnish Environment Institute, Finland
Fabrizio Vecchi, Stazione Zoologica Anton Dohrn, Italy
Copyright © 2017 Langenkämper, Zurowietz, Schoening and Nattkemper. This is an open-access article distributed under the terms of the Creative Commons Attribution License (CC BY). The use, distribution or reproduction in other forums is permitted, provided the original author(s) or licensor are credited and that the original publication in this journal is cited, in accordance with accepted academic practice. No use, distribution or reproduction is permitted which does not comply with these terms.
*Correspondence: Tim W. Nattkemper, tim.nattkemper@uni-bielefeld.de