Planktonic Lipidome Responses to Aeolian Dust Input in Low-Biomass Oligotrophic Marine Mesocosms
 Travis B. Meador1*
  Nadine I. Goldenstein1
  Alexandra Gogou2
  Barak Herut3
  Stella Psarra4
  Tatiana M. Tsagaraki4
  Kai-Uwe Hinrichs1
- 1Department of Geosciences, MARUM Center for Marine Environmental Sciences, University of Bremen, Bremen, Germany
- 2Institute of Oceanography, Hellenic Centre for Marine Research, Anavyssos, Greece
- 3National Institute of Oceanography, Israel Oceanographic and Limnological Research, Haifa, Israel
- 4Institute of Oceanography, Hellenic Centre for Marine Research, Heraklion, Greece
The effect and fate of dry atmospheric deposition on nutrient-starved plankton in the Eastern Mediterranean Sea (EMS; Crete, 2012) was tested by spiking oligotrophic surface seawater mesocosms (3 m3) with Saharan dust (SD; 1.6 g L−1; 23 nmol NOx mg−1; 2.4 nmol PO4 mg−1) or mixed aerosols (A; 1.0 g L−1; 54 nmol NOx mg−1; 3.0 nmol PO4 mg−1) collected from natural and anthropogenic sources. Using high resolution liquid chromatography-mass spectrometry, the concentrations of over 350 individual lipids were measured in suspended particles to track variations in the lipidome associated with dust fertilization. Bacterial and eukaryotic intact polar lipid (IPL) biomarkers were categorized into 15 lipid classes based on headgroup identity, including four novel IPL headgroups. Bulk IPL concentrations and archaeal tetraether lipids were uncoupled with the doubling of chlorophyll concentrations that defined the stimulation response of oligotrophic plankton to SD or A amendment. However, molecular level analysis revealed the dynamics of the IPL pool, with significant additions or losses of specific IPLs following dust spikes that were consistent among treatment mesocosms. Multivariate redundancy analysis further demonstrated that the distribution of IPL headgroups and molecular modifications within their alkyl chains were strongly correlated with the temporal evolution of the plankton community and cycling of phosphate. IPLs with phosphatidylcholine, betaine, and an alkylamine-like headgroup increased in the post-stimulated period, when phosphate turnover time had decreased by an order of magnitude and phosphorus uptake was dominated by plankton >2 μm. For most IPL classes, spiking with SD or A yielded significant increases in the length and unsaturation of alkyl chains. A lack of corresponding shifts in the plankton community suggests that the biosynthesis of nitrogenous and phosphatidyl lipids may respond to physiological controls during episodic additions of dust to the EMS. Furthermore, alkyl chain distributions of IPLs containing N, P, and S invoked a bacterial source, suggesting that bacterioplankton are able to modulate these lipids in response to nutrient stress.
Introduction
In the ultra-oligotrophic Eastern Mediterranean Sea (EMS), biological production is (co)limited by both nitrogen (N) and phosphorus (P) (e.g., Krom et al., 1991; Thingstad et al., 2005a) and is primarily driven by picoplankton and recycling within the microbial loop. Atmospheric deposition of dust and aerosols has been acknowledged as a predominant source of nutrients and trace metals to the ultraoligotrophic surface waters of the EMS (e.g., Guerzoni et al., 1999; Herut et al., 1999; Guieu et al., 2002) that has basin-wide implications for the stoichiometric balance of N and P (Krom et al., 2004). The significant contribution of this nutrient source to biological production in the region has been invoked by both geochemical estimates of new production (Kouvarakis et al., 2001; Herut et al., 2002; Markaki et al., 2003) and biogeochemical responses to dust addition, including increases in primary and bacterial production and chlorophyll a (Chl-a) concentration (Herut et al., 2005; Laghdass et al., 2011; Guieu et al., 2014). The annual dust flux to Mediterranean surface waters can be controlled by just a few events that deliver up to 30% of the total flux (e.g., Guerzoni et al., 1999; Kubilay et al., 2000), and the number of these events are projected to increase with increasing temperatures and decreasing relative humidity associated with climate change (Klingmüller et al., 2016). As such, responses of the planktonic community to episodic dust pulses should play an increasing role in determining food web structure and the carbon budget of the oligotrophic ocean.
To further investigate this phenomenon, the MESOAQUA experiment (May 2012; Heraklion, Crete) simulated intense dry atmospheric deposition in the ultraoligotrophic EMS by spiking surface seawater mesocosms (Cretan Sea) with two different natural aerosols collected in the Levantine Basin: Saharan dust (SD) or mixed aerosols (A; Herut et al., 2016). Biogeochemical responses to the addition of SD or A, including plankton community composition and production, pigment concentration, and cycling of macro-nutrients and trace elements, were compared in triplicate to unamended control mesocosms over a period of 8 days (Guo et al., 2016; Herut et al., 2016; Rahav et al., 2016; Tsiola et al., 2016; Tsagaraki et al., under revision, this SI). In addition to these bulk biogeochemical measures of food web dynamics, the diversity of algal and bacterial cell membrane lipids provides a moderate level of taxonomic and physiological information (e.g., Sato, 1992; Guschina and Harwood, 2006; Sohlenkamp and Geiger, 2015) that can be applied to assess organic matter reactivity (Harvey and Macko, 1997; Wakeham et al., 1997), plankton communities in the ocean (e.g., Van Mooy and Fredricks, 2010), and carbon and nutrient fluxes in marine food webs (Dalsgaard et al., 2003; Sebastián et al., 2016). For example, phytoplankton populations are able to reduce their cellular P quota by substituting phospholipids with sulfolipids or betaine lipids when P is limiting (Van Mooy et al., 2009) and nutrient gradients across the Mediterranean appear to drive the lipid distribution of plankton communities (Popendorf et al., 2011b). Recent advances in lipid analysis via tandem ultra high pressure liquid chromatography mass spectrometry (UHPLC-MS) now allow rapid and enhanced detection of intact polar lipids (IPLs) as well as structural elucidation of their polar headgroups and alkyl chains (e.g., Wörmer et al., 2013). Sophisticated molecular networks have also been employed to facilitate the interpretation of the large data sets obtained by such analyses (Kharbush et al., 2016).
The goal of the current study was to track changes in lipid distributions associated with atmospheric deposition simulated during the MESOAQUA experiment. Parallel measurements of bulk biogeochemical parameters allowed for further assessment of lipid biomarkers as indicators of the taxonomic and physiological responses of marine plankton to dust fertilization in the oligotrophic ocean. Bacterial and eukaryotic IPLs were the most abundant and responsive biomarkers, and this study assesses the sources, cycling, and physiological adaptations of previously described and novel lipid classes.
Materials and Methods
Mesocosm Experiment and Biomarker Sampling
Surface seawater was collected from 10 m depth on the 8th and 9th May 2012 aboard the R/V Philia from a site at 5 nautical miles off the north coast of Crete (35° 24.957′ N, 25° 14.441′ E) and pumped into nine mesocosm bags (3 m3) located in the facilities of Hellenic Centre for Marine Research (HCMR, Crete, Greece). After filling, three mesocosms were inoculated with SD (1.6 g L−1) collected during dust storms in Crete (Heraklion and Sambas) and Israel (Beit Yannay) or with a mixture of desert/mineral dust and polluted aerosols (A; 1.0 g L−1) of European and desert origin; the final three mesocosms served as unamended control treatments (Herut et al., 2016). SD amendments corresponded to spikes of 37 nM NOx (nitrate + nitrite), 3.9 nM PO4 and increases in Mn and Fe by ~6 and ~4 nM, respectively (Herut et al., 2016). Amendments to A mesocosms corresponded to spikes of 54 nM NOx and 2.0 nM P and an increase in Mn by ~1 nM and no increase in Fe (Herut et al., 2016). Samples for biomarker analysis (20 L) were collected from each mesocosm before the dust addition (May 10th; day −1) and subsequently on days 3 and 6 following dust addition (May 13th and 16th; day 3 and day 6). Acid-washed silicon tubing was lowered to the middle of the mesocosm and seawater was pumped into 20 L acid-washed Nalgene carboys. Within 1 h, the samples were filtered via a vacuum manifold system onto glass fiber filters (GF/F, nominal pore size = 0.7 μm; Whatman) and stored at −20°C until extraction in the laboratory in Bremen, Germany.
Lipid Extraction and Analysis
GF/F samples were placed into 40 mL Teflon tubes containing 2–2.5 g combusted sand and a recovery standard (2 μg phosphatidylcholine C21 or C19 fatty acid; Avanti Polar Lipids Inc.). The samples were extracted twice with a solvent mixture (25 mL) containing methanol, methylene chloride, phosphate buffer (2/1/0.8 v/v) using a sonication probe (Bandelin Sonoplus Model HD2200; 5 min, 0.6 s pulses, 200 W). Following sonication, Teflon extraction tubes were centrifuged at 2,500 rpm for 10 min and the supernatant was decanted into a combusted separation funnel. The extraction was repeated twice using a solvent mixture containing methanol, methylene chloride, and a trichloroacetic acid buffer (2/1/0.8 v/v; Sturt et al., 2004), and finally twice more using a solvent mixture containing methanol/methylene chloride (1/5, v/v). The supernatants were combined and partitioned into aqueous and apolar phases following the addition of methylene chloride and water to the separation funnel (30 mL each). The apolar phase was collected into an Erlenmeyer flask and the aqueous phase was re-extracted thrice with methylene chloride (30 mL). The aqueous phase was then discarded and the combined apolar phase was returned to the separation funnel and washed thrice with water.
The final total lipid extract (TLE) was dried under N2 gas and biomarker analysis was performed using a Dionex Ultimate 3,000 ultra-high pressure liquid chromatography (UHPLC) system coupled to a Bruker maXis ultra-high resolution quadrupole time-of-flight (QTOF) mass spectrometer via electrospray ionization source. For IPL analysis, an aliquot containing 10% of the TLE was injected onto an Acquity BEH HILIC amide column (2.1 × 150 mm, 1.7 μm, Waters, Germany) following the protocol described by Wörmer et al. (2013). Lipids were identified according to their expected retention times, exact masses, and mass fragmentation patterns (Table 1; Figures S1–S6). IPL ions were quantified based on the recovery of the internal PC standard and their response relative to an injection standard (PAF, Avanti Polar Lipids Inc.). Response factors for the identified lipid classes were determined for representative diacylglycerol lipid standards (Table S1); the response factor data were acquired during the same week as IPL data. Only duplicate time point measurements are available for some experiments (i.e., day 3 for all treatments and day −1 for the A treatment) due to lack of an internal standard or available response factors.
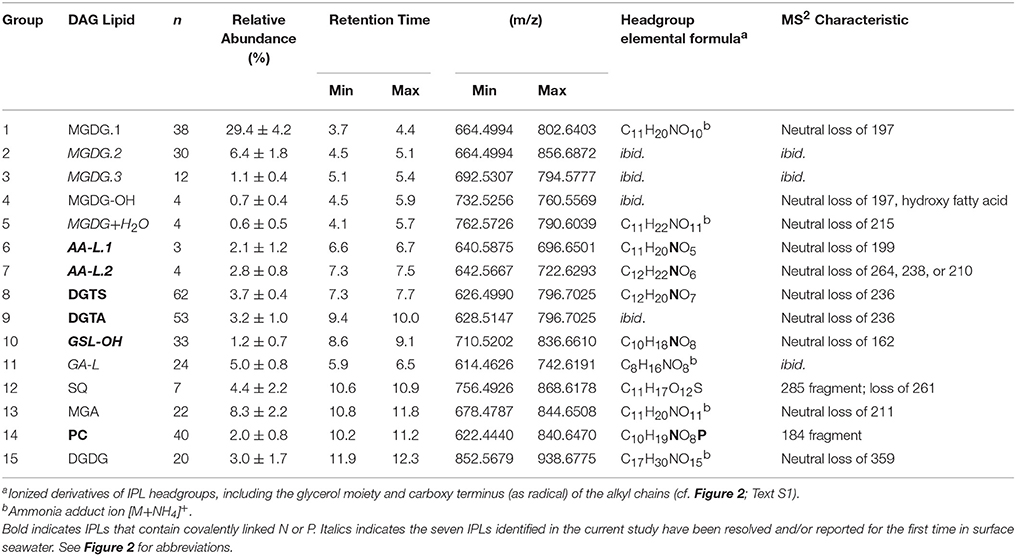
Table 1. IPLs detected in mesocosm incubations of surface seawater collected in the Eastern Mediterranean Sea.
Archaeal tetraether lipids were quantified following injection of 10% TLE onto an Agilent Eclipse XDB-C18 column (5 μm, 9.4 × 250 mm; after Zhu et al., 2013; Table S2). A C46 tetraether was used as the injection standard (Huguet et al., 2006) for quantification of archaeal tetraethers; no response factor was applied.
Ancillary Analyses of Environmental Parameters
Protocols for the determination of chlorophyll concentration, bacterio-and picoplankton cell abundances, primary and bacterial production, and phosphate concentration, uptake and turnover time in the mesocosms were reported by Herut et al. (2016) as well as Guo et al. (2016) and Tsiola et al. (2016). Tsagaraki et al. (under revision, this SI) additionally describe measurements of nutrient concentration, abundances of autotrophic picoplankton and zooplankton, and alkaline phosphatase activity.
Statistical Assessments
Hierarchical Clustering Analysis
The average relative abundance distribution of carbons and unsaturations in the alkyl chains attached to IPLs was compared via hierarchical clustering analysis. The similarity matrix was assembled using the unweighted average distance algorithm (UPGMA) and dissimilarity was measured as 1 min the Pearson correlation. The headgroups of some IPLs were attached to a limited number of diglyceride moieties (≤4; Table 1) and were not included in the hierarchical analysis, as their alkyl chain composition were relatively easily compared to that of other IPLs but skewed the dissimilarity matrix.
Redundancy Analysis (RDA)
Statistical modeling was conducted using R-3.0.2 and available package “vegan” (Oksanen et al., 2015). For the application of statistical methods, the dataset was reduced to an acceptable ratio of samples to variables of ≥1. To achieve this reduction, data were grouped based on structural similarities, such as headgroup commonalities, and investigated patterns within the chain distribution for each IPL class separately. An ordination method was used to explore the parametric relationships between abundance of lipid groups as well as distribution of core lipid composition and environmental parameters. Ordination creates linear combinations of variables represented by vectors that are called principal components, gradients, or axes. The multiplication factors are called loadings. The method applied here is based on constrained ordination, namely RDA, and it takes explanatory variables into account, which allows a direct modeling of the cause-effect relationship between species data (i.e., lipid groups) and environmental parameters (ad-hoc). RDA was performed to infer the influence of the different treatments on the distribution of IPL headgroups and on the alkyl chain distributions of the individual IPL groups (RDA1). Thereafter, RDA was used to explore the impact of treatments compared to the day of sampling on variability of IPL headgroups and their alkyl chain composition (RDA2). The significance of the individual models was evaluated by comparison of p-values (Tables S2, S3).
Because the time of sampling showed a high collinearity with several environmental parameters, the explanatory potential of these parameters was investigated in a separate analysis (Table S4). The control of environmental parameters on the IPL headgroup distribution was first tested for each parameter individually (RDA3.1–3.31). Significant parameters were then chosen based on p-values, narrowing the environmental parameters to 13, which could then be included in a combined RDA analysis. Multi-collinearity between environmental variables was avoided by using variance inflation factors as a measure for insignificant results in ordination due to co-linearity. Monte Carlo permutation tests provide information on the general model performance and the significance of individual explanatory variables within the model, and were performed to test the significance of the combined RDA-derived model. Thereafter, variables were selected based on forward selection of explanatory variables using the function ordiR2step, available within “vegan,” which uses R2 adjusted and p-value as criteria for model reduction. A parsimonious RDA was calculated with the reduced set of selected explanatory variables and Monte Carlo permutation was again applied to gain information on the significance of the full reduced model and the individual terms within the reduced model.
Significance Tests
In support of the significant alterations of IPL distributions identified by RDA, the differences among specific IPLs between mesocosm treatments or time points were assessed via a two-tailed homoschedastic Student's t-test. Significant differences were denoted by p < 0.05.
Results
Biological Responses to Dust Addition
Changes in the structure of the plankton community in response to SD or A addition were thoroughly assessed by companion studies (Guo et al., 2016; Herut et al., 2016; Tsiola et al., 2016; Tsagaraki et al., under revision, this SI) and can be summarized as follows. Chlorophyll a (Chl-a) concentrations had doubled in mesocosms on days 2 and 3 following the addition of SD or A, which were significantly higher compared to the control; this increase coincided with significant increases in Synechococcus and autotrophic picoeukaryotes (Guo et al., 2016). Concentrations of bacteria were also significantly higher in treatment mesocosms compared to the control (Guo et al., 2016). In contrast to significant increases in Chl-a on days 2 and 3, microzooplankton increased throughout the mesocosm experiment, with the major groups, including ciliates and tintinids, combining for up to ca. 2700 cells L−1 on average on the final sampling at day 8 (Tsagaraki et al., under revision, this SI). Collectively, the significant increases in both Chl-a and cell counts were indicative that dust and aerosol additions had positive effects on the plankton community, hereafter referred to as “stimulated plankton,” even though Chl-a concentrations remained relatively low in these oligotrophic mesocosms in comparison to nutrient replete oceanographic regions (e.g., upwelling regimes).
In terms of the Chl-a response, biomarker sampling coincided with the pre-addition (day-1), stimulated (day 3), and post-stimulated (day 6) periods. By converting from Chl-a, bacteria, and zooplankton concentrations, IPLs associated with the stimulated plankton were predicted to reach maximum concentrations (ca. 1.5 μg IPL L−1) within 1–3 days following amendment with SD or A (Figure 1).
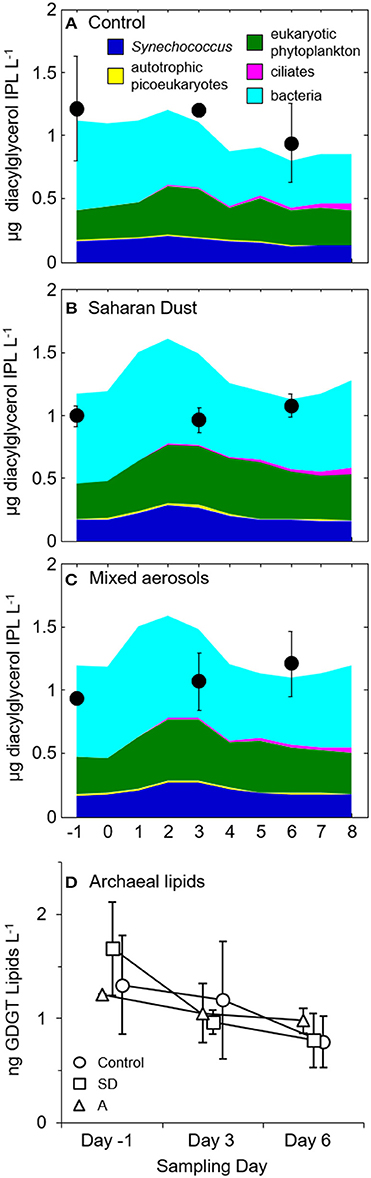
Figure 1. Predicted (colored areas) and measured (black circles) IPL concentrations in (A) control, (B) Saharan dust, and (C) mixed aerosol mesocosms. Error bars represent the standard deviation of replicate mesocosms. The predicted concentrations of lipids belonging to bacteria (Bac), Synechococcus (Syn), and autotrophic picoeukaryotes (Pico) were estimated by converting from measurements of cell density and assuming cell diameter of 0.5 μm for bacteria (Simon and Azam, 1989), 1 μm for Synechococcus (Waterbury et al., 1979) and autotrophic picoeukaryotes (Palenik et al., 2007) and thus factors of 1.7, 6.8, and 6.8 fg lipid cell−1, respectively (Lipp et al., 2008). Lipid concentrations of eukaryotic phytoplankton were converted from Chl-a concentrations of the large size class (>2 μm) via a Chl:C conversion factor of 0.03 (Geider et al., 1997) and assuming that C represents 50% of cell dry weight and lipids were 15% of the cell dry weight (e.g., Thompson, 1996). Lipids derived from ciliates were based on counts (cf. Section Biological Responses to Dust Addition) and assuming a conversion of 17.1 pg fatty acid ciliate−1 (Harvey and Macko, 1997). (D) Concentrations of archaeal tetraether lipids in control (circles), Saharan dust (SD; squares), and mixed aerosol mesocosms (A; triangles). Samples collected on the same day are offset on the x-axis to illustrate the association of each averaged value with its standard deviation, indicated by the error bars.
Concentrations of Archaeal Lipids
Concentrations of archaeal glycerol dibiphytanyl glycerol tetraether (GDGT) ranged from 0.2 to 2.0 ng L−1 (Figure 1D). GDGTs decreased in concentration over the duration of each experimental treatment with the greatest losses observed in the SD treatment, which fell to roughly half of the initial values by day 6 (Figure 1D). The distribution of cyclopentane rings in the GDGT molecule did not vary significantly between treatments or time points, with caldarchaeol and crenarchaeol consistently dominating the lipid profile (28 ± 2.6% and 47 ± 2.5%, respectively; data not shown).
Intact Polar Lipids (IPLs)
IPL Headgroup Diversity
A total of 355 individual bacterial and eukaryotic IPL biomarkers were categorized into 15 lipid classes according to their headgroup composition (Table 1; Figure 2; Text S1). The mass spectral properties of four of these IPL classes (35 compounds) only allowed for tentative identification of headgroup and backbone linkages to alkyl chains. Multiple series of isobaric ions, i.e., with identical masses (±0.001 Da) eluting at different retention times, were identified for monoglycosides (MGDG; Figure S1) and the betaine lipids diacylglyceryl N,N,N-trimethylhomoserine (DGTS) and diacylglyceryl-hydroxymethyl-N,N,N-trimethyl-β-alanine (DGTA). Other IPLs comprised only single headgroup series, including sulfoquinovosyldiacylglycerol (SQ), diglycosides (DGDG), uronic acids (MGA; Figure S2), phosphatidyl choline (PC), and hydroxylated forms of MGDG (MGDG-OH; Figure S2) and glycosphingolipids (GSL-OH; Figure S3). Four novel lipid classes are described; they exhibited polarity, elemental formulae, and/or fragment ions consistent with IPLs, but their headgroups remain uncertain, including a hydrated MGDG (MGDG+H2O; Figure S2), two alkylamine-like lipids (AA-L.1, AA-L.2; Figures S4, S5), and a glyceric acid-like lipid (GA-L; Figure S7). The most relatively abundant lipids were MGDG.1 (41 ± 6%), followed by MGA (12 ± 3%), MGDG.2 (9 ± 3%), and SQ (6 ± 3%; Figure 3). The average relative abundances of the remaining IPL classes were each <5%, but accounted for roughly 32 ± 4% of IPLs on average.
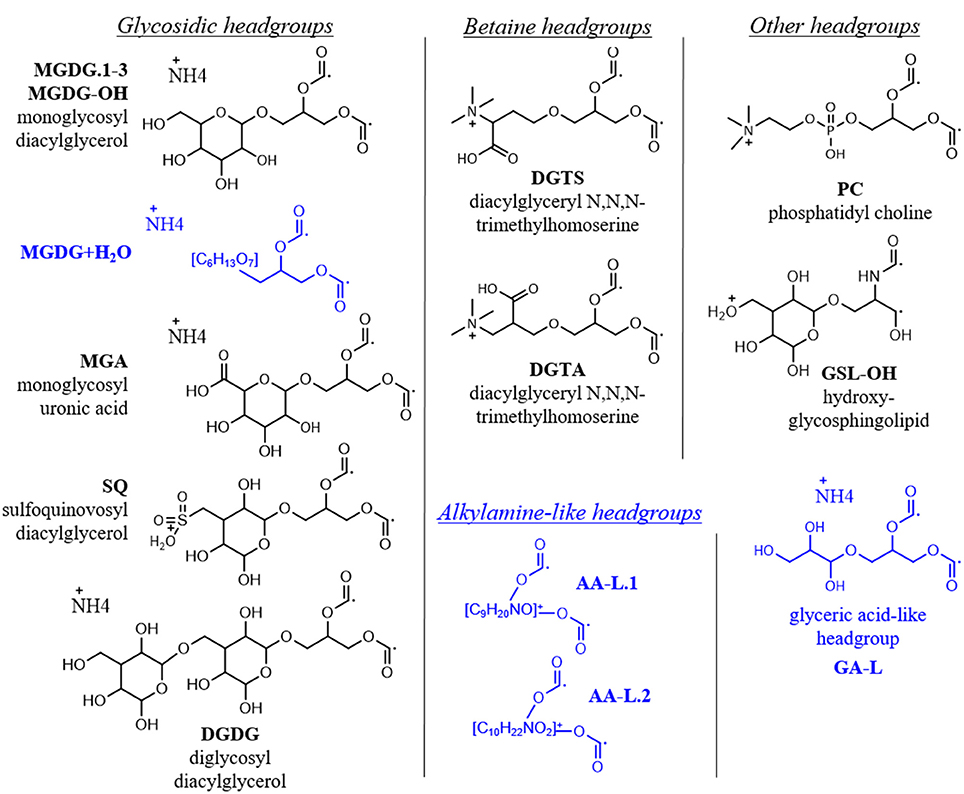
Figure 2. IPL headgroups in oligotrophic ocean mesocosms. Depicted are the adducts of the headgroup and glycerol moieties with radical ions in place of alkyl chains, corresponding to their elemental formulae used for high resolution MS identification (i.e., CxHxNxOx; cf. Table 1). Putative structures of novel headgroups identified during this study are shown in blue. MS2 spectra for novel headgroups are provided in Figures S2–S6 and described in Text S1.
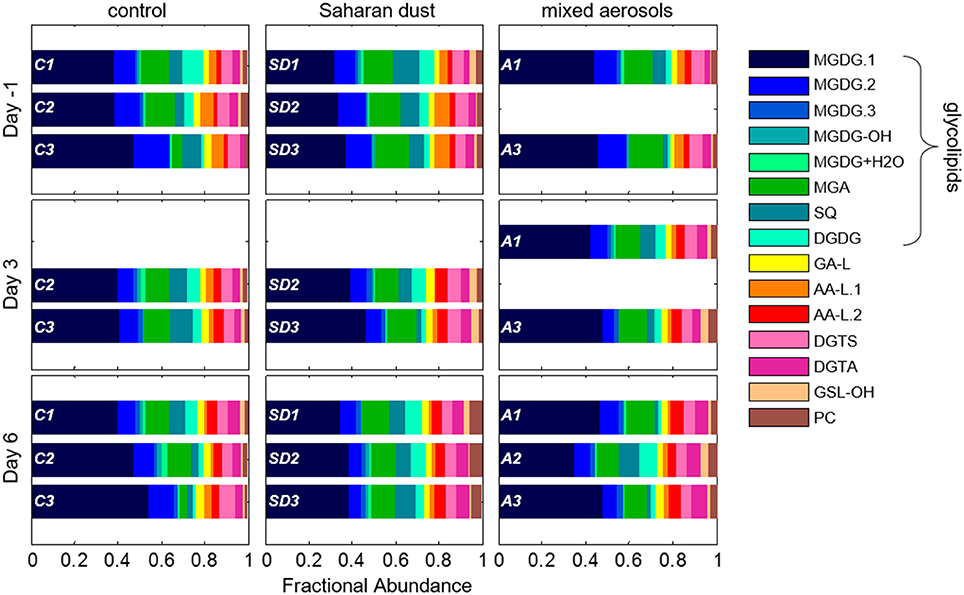
Figure 3. Relative distribution of IPLs in replicate mesocosms of the control (C), Saharan dust (SD), and mixed aerosol (A) experiments on each sampling day. Data for each replicate mesocosm are shown as one barplot in each panel in consistent order.
IPL Alkyl Chain Distributions
Lipid classes contained up to 62 individual IPLs that differed in the number of carbons and/or unsaturations in their alkyl chains (Table 1). In most cases, fatty acid chains are characterized by their summed number of carbons and unsaturations; therefore, odd vs. even-numbered fatty acids are not differentiated and odd sums refer to the attachment of both one even and one odd chain to the glycerol backbone. Based on the weighted average (wt. avg.) alkyl chain distributions, GSL-OH lipids exhibited the longest carbon chains and among the highest number of unsaturations (36.8 ± 1.0 and 2.3 ± 1.3, respectively; Table 1; Figure 4A), while the wt. avg. unsaturations of all other lipid classes were ≤1.6, with MGDG.3 and SQ classes containing the fewest unsaturations (wt. avg. unsaturations < 0.2; Table 1; Figure 4B). It is important to note that the backbone moiety of GSL-OH is a ceramide and not glycerol, and its alkyl chain length described here refers to sum of the fatty acid and sphingoid base. Thus, the length of GSL-OH chains are three C atoms longer than other IPLs, as only the carbons in the headgroup have been excluded from this measure, whereas, for all other IPLs, both headgroup and glycerol carbons have been excluded. PCs spanned the largest range in molecular weight (m/z 622–840; Table 1), representing a difference of roughly 15 methylene groups, with a distribution that was weighted toward shorter alkyl chains (wt. avg. = 30.4 ± 0.7; Figure 4A). Other lipid classes exhibiting relatively short alkyl chains include MGDG.3 and SQ (wt. avg. < 30; Table 1; Figure 4A).
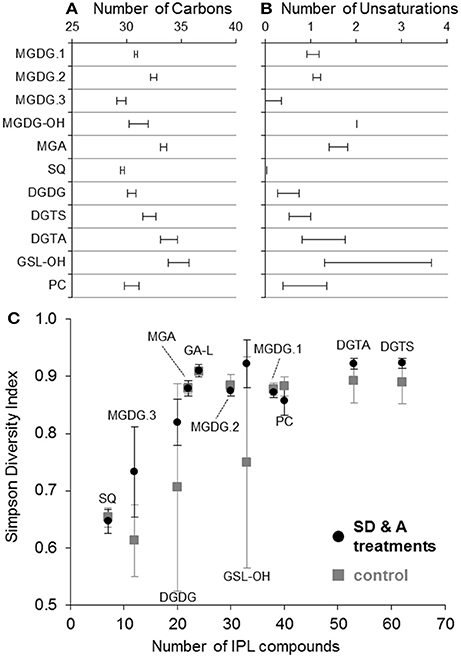
Figure 4. Weighted average (±1 standard deviation) number of carbons (A) and unsaturations (B) in the alkyl chain of IPLs. The Simpson diversity index of each IPL class (C) was determined as: , where f is the fractional abundance of lipid i, and N is the total number of lipids in each IPL class. The average Simpson index values for IPL classes in control (n = 8; gray squares) and treatment samples collected on days 3 and 6 (n = 10; black circles) are plotted against the total number of compounds identified for each IPL class. Error bars indicate one standard deviation.
DGTS and DGTA, both betaine lipids, exhibited the highest diversity (i.e., Simpson diversity index) in terms of their alkyl chain composition (Figure 4C). Although the alkyl chain distributions of GA-L were highly diverse (Figure 4C), the number of C atoms and unsaturations in the diglyceride moiety cannot be further interpreted due to uncertainty in the headgroup composition (Figure S6). The IPL classes MGDG-OH, MGDG+H2O, AA-L.1, and AA-L.2 each comprised ≤4 compounds, making them the least diverse among the IPLs detected in the mesocosms. The diversity in chain distribution for each lipid class was typically lowest in the control treatments (Figure 4C) but highly variable between replicate samples. A hierarchical clustering analysis of the diversity of IPL diglyceride moieties indicated that the alkyl chains of GSL-OH were the most unique, grouping independently of all other IPLs (Figure 5; Figure S7). This analysis further revealed two IPL subgroups according to the similarity/dissimilarity of their alkyl chain distributions (Figure 5), including a “glycosidic” group (i.e., MGDG.1, MGDG.2, MGA) and a “nutrient-availability” group (i.e., DGTA, DGTS, DGDG, PC, SQ, and MGDG.3; cf. Section Hierarchical Clustering Analysis of IPL Alkyl Chains).
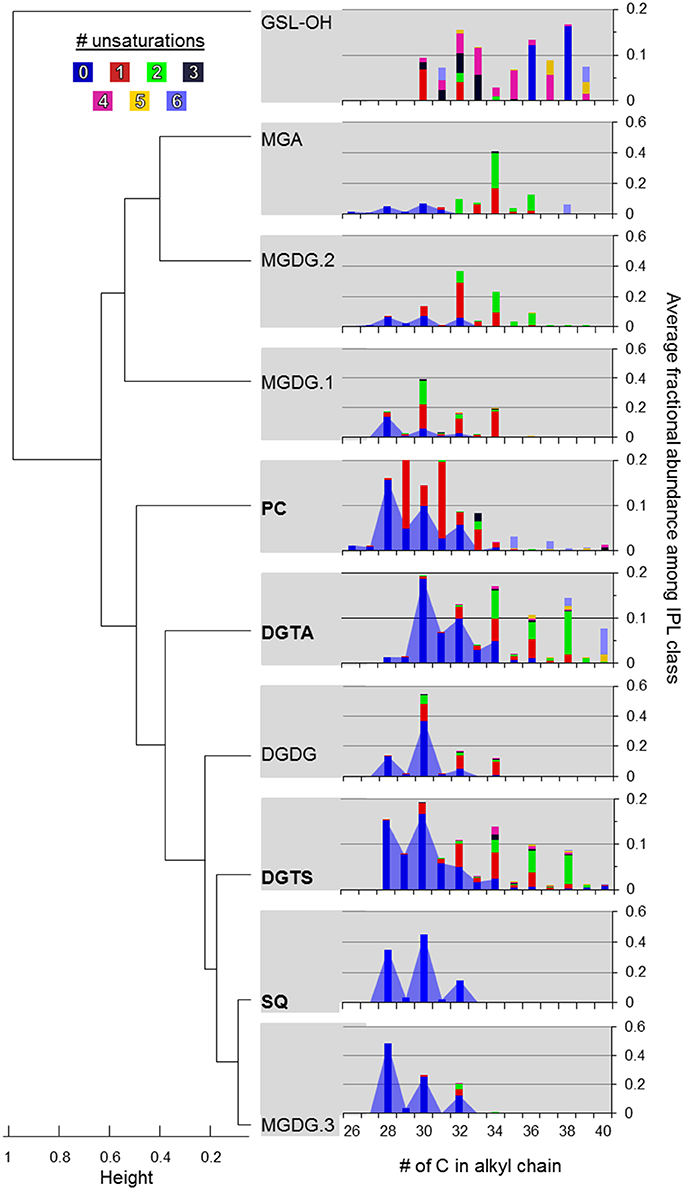
Figure 5. Hierarchical clustering of IPL classes based on alkyl chain distributions in their diacylglycerol moiety. Agglomeration was determined via the unweighted average distance algorithm (UPGMA) and dissimilarity was measured as one minus the Pearson correlation. IPLs shown in bold are thought to be modulated by plankton in response to P-limitation (cf. Van Mooy et al., 2009). The color code refers to the number of unsaturations in the alkyl chains. The blue area shows the relative abundance of saturated alkyl chains summing to ≤34 carbons.
IPL Concentrations
While chlorophyll concentrations returned to pre-addition values by day 6 (Tsagaraki et al., under revision, this SI; Tsiola et al., 2016), total IPL concentration in all treatment mesocosms exhibited a net increase of 4–24% (40–220 ng L−1). This is in contrast to control mesocosms, in which the chlorophyll response was lower than in treatment mesocosms and IPL concentrations fell by 12–35% by day 6 (140–530 ng L−1; p < 0.01; Figure 6). Changes in IPL concentration between replicate mesocosms were more variable on day 3 (Figure 6).
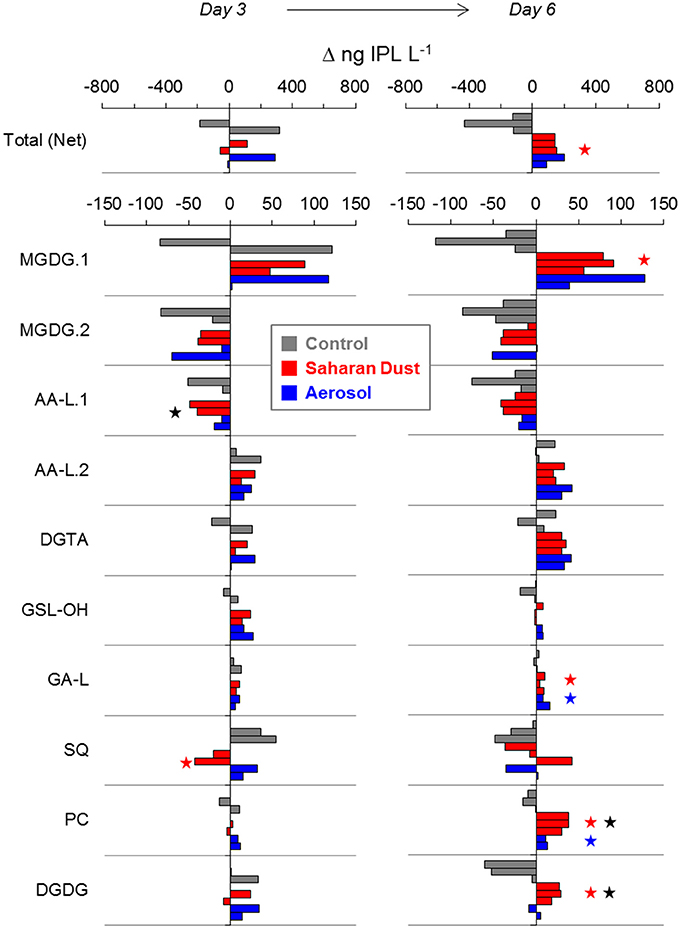
Figure 6. Changes in IPL concentration relative to day −1 in each replicate mesocosm of control (gray), Saharan dust (red), and mixed aerosol (blue) treatments. Significant differences to the control mesocosms are indicated by a red or blue star. Black stars indicate significant differences between Saharan dust and mixed aerosol mesocosms. Each bar represents one replicate mesocosm of each treatment, shown in consistent order.
IPL classes responded differently during the progression of the experiments. Increases in the concentration of the most abundant IPL (40–130 ng MGDG.1 L−1) accounted for the majority of the gross increase in total IPL concentration on day 6 in treatment mesocosms (25–51%). Replicate mesocosms also exhibited consistent additions of some minor lipids, including DGTA (30–40 ng L−1), PC (10–40 ng L−1), and AA-L.2 (20–40 ng L−1), together accounting for 38–51% of the gross increase in IPLs. In contrast, both control and treatment mesocosms exhibited consistent losses of MGDG.2 (10–90 ng L−1) and AA-L.1 (20–80 ng L−1) by day 6. The only IPL that paralleled changes in Chl-a concentration in both treatment mesocosms was GSL-OH, which increased by 10–30 ng L−1 (ca. 2–3 fold) on day 3 and returned to pre-addition values by day 6 (Figure 6). IPL classes among SD and A mesocosms exhibited the same general trends during the evolution of the plankton community, with few exceptions: (i) the increases in PC and DGDG on day 6 were significantly greater in response to SD additions (p < 0.03); (ii) day 3 losses of AA-L.1 were greater in the SD treatment (44 ± 6 vs. 15 ± 6 ng L−1; p < 0.05); and (iii) SQ concentrations decreased in SD mesocosms on day 3 (32 ± 16 ng L−1) but increased in A mesocosms (23 ± 12 ng L−1; Figure 6). In terms of nutrient allocation, the net increases of AA-L.2, DGTA, GSL-OH, and PC in the treatment mesocosms represented, on average, 0.3 and 3.5% of the N and P added via SD, and 0.2 and 1.2% of the N and P added via A.
Redundancy Analysis (RDA) of IPL Distributions
The constrained ordination model based on RDA (Tables S2, S3) identified significant changes in IPL headgroup and alkyl chain relative abundance distributions in treatment vs. control samples (RDA1). The significance of the model for explaining IPL headgroup and chain distributions increased with the addition of a temporal component that accounted for sampling day (RDA2).
IPLs in SD or A Treatments vs. Control (RDA1)
RDA revealed only slight differences in the SD or A treatments compared to the control (Table S2). For the SD treatment, the average relative abundance (± standard deviation) of DGTA (4.4 ± 0.3%) and GSL-OH (2.9 ± 0.2%) were significantly higher than the control (3.0 ± 0.2% and 1.2 ± 0.1%, respectively; p < 0.05) on day 3 (Figure 7). PC relative abundance was significantly higher in the SD treatment at day 6 (4.8 ± 0.4%), compared to both the control (1.9 ± 0.4%; p < 0.005) and A treatments (3.0 ± 0.5%; p < 0.01). The A treatment exhibited significant enrichments in DGTA relative to the control on both day 3 (4.2 ± 0.1% vs. 3.0 ± 0.2%) and day 6 (6.2 ± 0.6% vs. 4.1 ± 0.7%; p < 0.03; Figure 7).
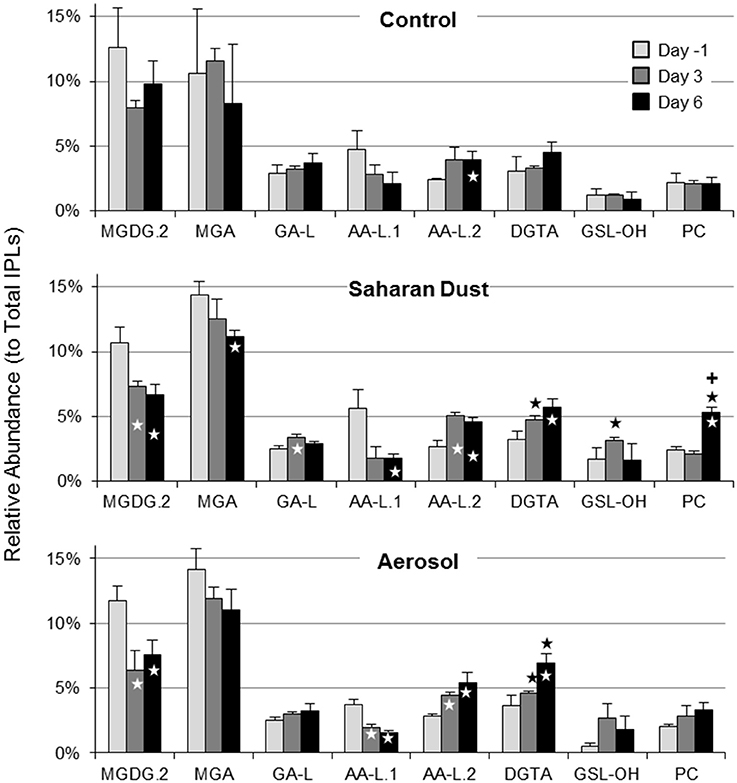
Figure 7. Average relative abundance of selected IPLs in control, Saharan dust, and mixed aerosol mesocosms. Significant differences relative to the control or between Saharan dust and mixed aerosol treatments are indicated by black stars or plus symbols, respectively. Significant changes relative to the day −1 sample for each treatment are indicated by white stars. Error bars indicate one standard deviation.
The RDA models comparing the alkyl chain distributions of individual headgroup classes between control and treatment mesocosms (RDA1.1–1.13) identified significant differences for several lipid classes, including MGDG.1, MGDG.3, DGTS, and DGTA (Table S2). The relative abundance of longer alkyl chains (>C34) and unsaturations generally increased in response to SD or A additions (Table 2). In particular, alkyl chains summing to C38 were relatively enriched for all of these IPLs, excluding MGDG.3, and consistent decreases in C30 alkyl chains were observed in A mesocosms (Table 2).
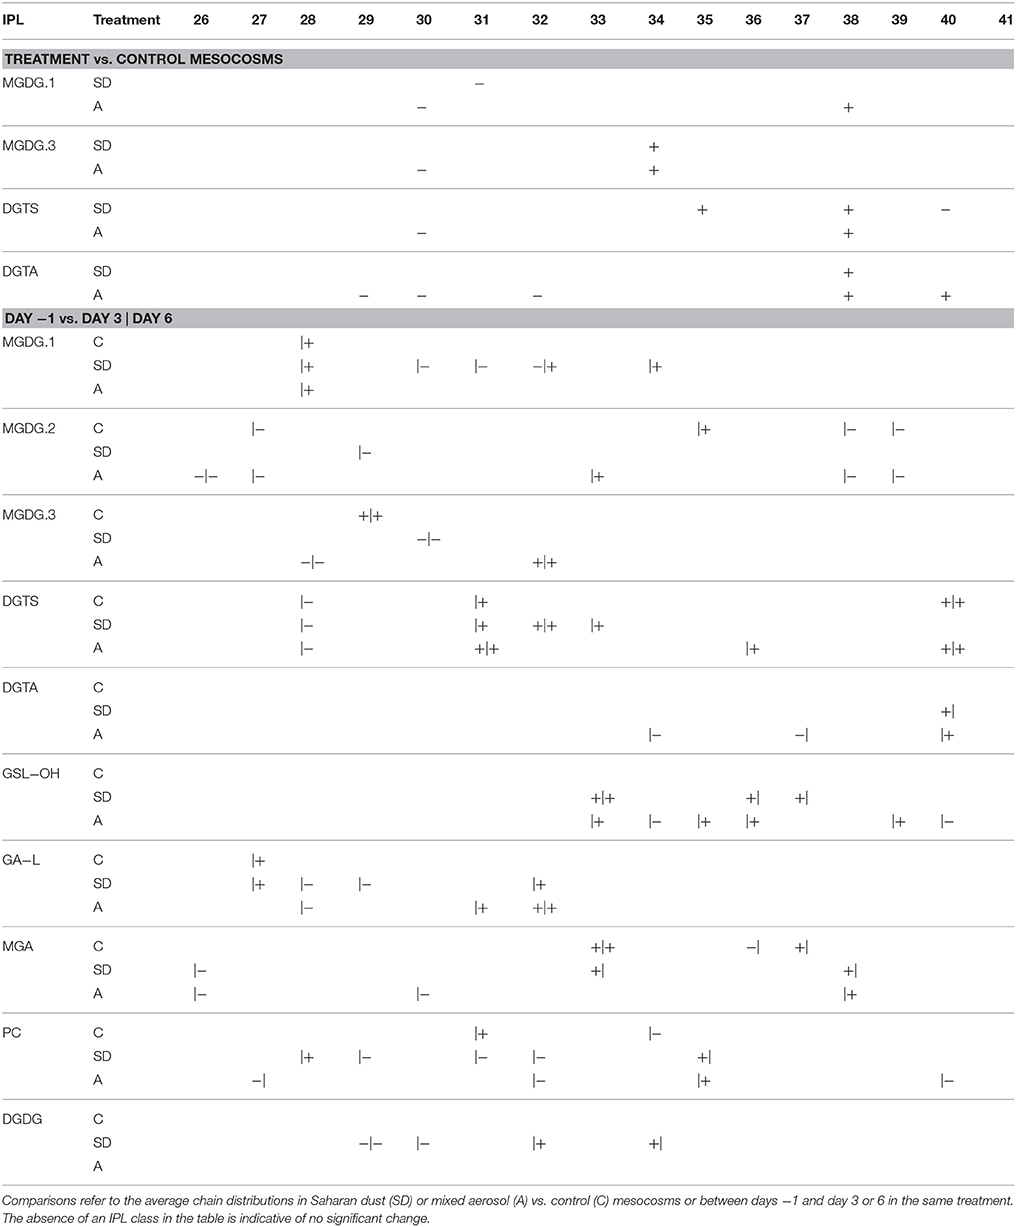
Table 2. Significant increases (+) or decreases (−) in the relative abundance distribution of C atoms in the alkyl chains of IPLs.
IPL Composition of Pre-addition, Stimulated, and Post-stimulated Samples (RDA2)
To infer the influence of the day of sampling on the abundance of lipid classes and core lipid composition, a temporal term was added to the RDA model (RDA2). By accounting for day of sampling, the model had a much higher potential for explaining the variability in IPL distributions (p = 0.003) and the core lipid composition of all but two lipid classes (RDA2.1–2.11; p < 0.05; Table S3). The increased significance of the model containing a temporal component (RDA2) is consistent with the stimulation of plankton on day 3 in all mesocosms and subsequent post-stimulated sampling on day 6. The significance of RDA2 was further confirmed via Student's t-test comparisons of individual samples. In comparison to the headgroup distributions observed in SD or A mesocosms on day-1, the relative abundances of MGDG.2 and AA-L.1 significantly decreased, whereas DGTA, AA-L.1, and PC increased during the progression from pre- to post-stimulated conditions in the SD and A treatments (Figure 7). Control mesocosms also exhibited a significant decrease in AA-L.2 on day 6 (Figure 7). Only the SD treatment induced significant enrichments of GA-L (p < 0.01; Figure 7).
Similar patterns of alkyl chain distributions were observed in both treatments as well as the control mesocosms, including significant enrichments in MGDG.1 and DGTS lipids with alkyl chains comprising 28 and 31 carbons, respectively, and significant depletions of DGTS lipids comprising 28 carbons in the alkyl chain (Table 2). The relative increase in DGTA lipids observed for both the SD and A treatments (cf. Figure 7) was accompanied by more unsaturations as well as diglyceride moieties comprising 40 carbon atoms (Tables 2, 3). In general, for IPLs that were found to be significantly explained by the RDA2 model (Table S3), the stimulation of plankton induced by either dust treatment resulted in elongation and increased unsaturation of the diglyceride moiety (Tables 2, 3).
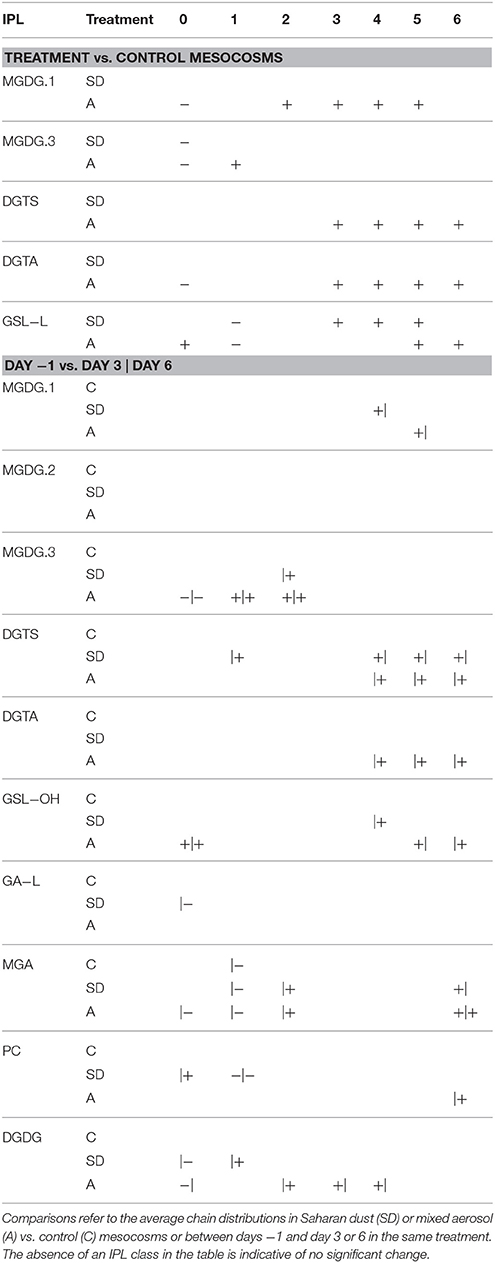
Table 3. Significant increases (+) or decreases (−) in the relative abundance distribution of unsaturations in the alkyl chains of IPLs.
Comparing IPL Distributions with Environmental Parameters (RDA3)
Based on the evidence that alterations in IPL composition were synchronized with the evolution of the plankton community (RDA2), another model was designed to further explore which environmental parameters were characteristic of the stimulation of plankton and may thus explain IPL variability (n = 31; RDA3). Significant correlations between individual environmental parameters and IPL composition were assessed by the respective RDA models (RDA3.1–31; cutoff value of p < 0.1; Table S4), thereby reducing the data set to 13 environmental parameters that potentially explained headgroup distribution. These 13 parameters were subjected to a forward selection procedure to reduce variance inflation, ultimately reducing the dataset to a single environmental parameter that best explained IPL distributions: phosphate turnover time (τPO4; p < 0.001). It is important to note that environmental variables that may have co-varied with τPO4 (e.g., nutrient concentrations; cf. Table S4) were also significant for explaining IPL distributions. However, these additional environmental parameters were excluded from the parsimonious RDA because (i) the p-values derived from the Monte-Carlo simulation were not as significant as for τPO4, and (ii) as determined by the forward selection algorithm, their inclusion did not improve the significance of the parsimonious RDA model. Therefore, only τPO4 was incorporated into a parsimonious RDA (Figure 8). Samples collected from control mesocosms and those collected prior to SD or A addition (i.e., on day −1) generally exhibited more negative values on the first RDA axis, whereas treatment samples collected on day 3 or 6 grouped with positive values. The negative loadings for τPO4 along the first RDA axis correspond to increased τPO4 in the control mesocosms and prior to day 3 sampling in the treatment mesocosms.
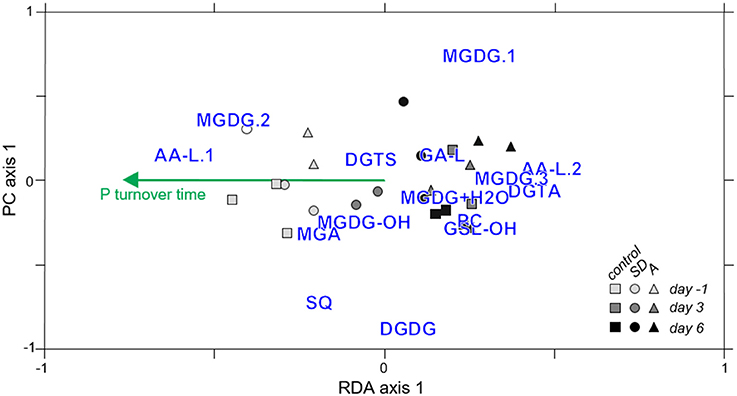
Figure 8. Parsimonious RDA (p = 0.001) showing groupings of samples collected from control (circles), Saharan dust (squares), and mixed aerosol (triangles) mesocosms on days -1 (light gray symbols), day 3 (dark gray symbols), or day 6 (black symbols) with IPL relative abundance (blue text) and the weighting of the environmental parameter that best explained lipid headgroup distributions (P turnover time, τPO4, green).
τPO4 decreased from >60 min. at day −1 to <6 min. at day 6 in the treatment mesocosms (Herut et al., 2016; Tsagaraki et al., under revision, this SI) and was positively correlated to relative abundances of MGDG.2 and AA-L.1 (p < 0.05; Figure 9). DGTA, and PC, and AA-L.2 peaked at day 6 and were negatively correlated with τPO4 (p < 0.05; Figure 9). The size-fractionated distribution of P uptake (i.e., 0.2–0.6, 0.6–2, and >2 μm) also shifted during the evolution of the plankton community (Tsagaraki et al., under revision, this SI). P uptake by plankton >2 μm increased to account for over one-third of total P uptake in the treatment mesocosms at day 6, coinciding with the significant increases in DGTA, PC, and AA-L.2 (p < 0.01). In contrast, the relative abundance of MGDG.2 and AA-L.1 were positively associated with percent uptake of P by the smallest size fraction of plankton (0.2–0.6 μm; p < 0.01), which was highest at day −1 in each mesocosm (>20%).
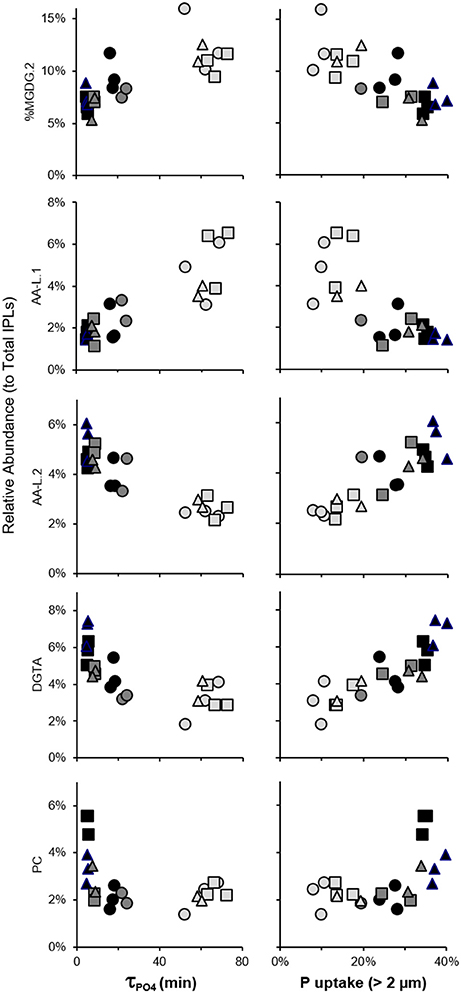
Figure 9. Correlated changes in IPL relative abundance with τPO4 and fractional phosphate uptake by plankton >2 μm in control mesocosms (circles) and those amended with Saharan dust (squares) or mixed aerosol (triangles) and collected on day −1 (light gray), day 3 (dark gray), or day 6 (black).
Discussion
The additions of SD or A to oligotrophic surface seawater mesocosms were designed to mimic natural deposition events and triggered increases in Chl-a up to 0.15 μg L−1, which is roughly 3- to 100-fold lower than the maximum concentrations encountered during previous IPL surveys (Table 4). The low range in Chl-a concentration underscores the oligotrophic setting of the EMS and thus the scope of this study, such that the stimulation of plankton and their associated lipid biomarkers recorded here were not as pronounced as in regions that span larger gradients in nutrient or Chl-a concentrations, thus complicating the assignment of IPLs to their source organisms. Archaeal GDGT lipid biomarkers were relatively low in abundance (corresponding to roughly 103 archaeal cells mL−1; assuming 1.4 fg lipid cell−1; Lipp et al., 2008) and the cycloalkyl distribution was similar between samples and consistent with previous reports in this region (Kim et al., 2015). Changes in GDGT concentration were similar in control and treatment mesocosms and are not further discussed.
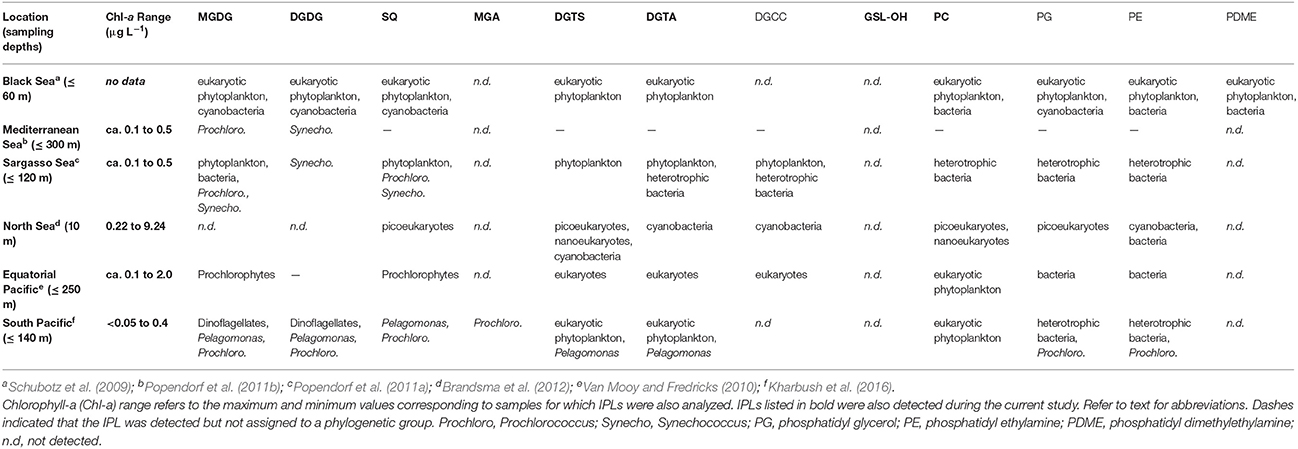
Table 4. Association of IPL headgroups with phylogenetic groups in different oceanic environments.
High resolution MS together with fragmentation patterns promoted identification and quantification of over 350 different IPLs and 15 IPL classes that were defined based on headgroup composition (Table 1; Text S1). The roster of IPLs identified in seawater was expanded to include chromatographically-resolved stereoisomers of previously known lipids (i.e., MGDG.1-3), molecular alterations of MGDG (i.e., MGDG-OH, MGDG+H2O), lipids that have not previously been detected in the surface ocean (GSL-OH, GA-L), and additional novel, nutrient-bearing lipid headgroups (AA-L.1-2; Table 1; Text S1). 15 IPL headgroups (Figure 2; Text S1). Tentative assignment of shared vs. distinct sources of some IPL classes was gleaned from the composition of their alkyl chains (Section IPL Taxonomic Source Indications). IPLs delivered by dust has been acknowledged dust as a potentially important source of IPLs to the surface ocean (e.g., up to 0.43 mg g−1; De Deckker et al., 2008) and, although the IPL concentration of SD or A material used to spike the mesocosms was not measured, this input is considered to explain differences and temporal evolution of the lipidome among SD, A, and control mesocosms. Based on the assumption that IPL concentrations scale linearly with the abundance of their source organisms, changes in lipid concentration were attributed to either allochthonous input, growth or removal processes (Section Turnover of the IPL Pool). RDA further identified the coupling of IPL relative abundance distributions with phosphate turnover time, which dropped to below 6 min in the post-stimulated period (Section Constrained Ordination Modeling of IPL Responses).
IPL Taxonomic Source Indications
Deciphering meaningful trends encoded by IPL composition is complicated by the multiple and often overlapping factors that determine the arrangement of polar headgroups and their linkage to fatty acids. Culture studies and oceanographic surveys of natural populations over broad physical and geochemical gradients have achieved some consensus on the association of lipid headgroups with plankton phylogeny (Table 4), with the caveat that several phylogenetic groups may produce the same IPL. The parallel changes in plankton abundance among treatment mesocosms (Guo et al., 2016; Tsagaraki et al., under revision, this SI; Figure 1) thus prohibit assignment of IPLs to their source organisms based solely on these data. However, from a taxonomic point of view, longer (C18–C22), even-numbered, and polyunsaturated fatty acids (PUFAs) are generally attributable to higher-level, eukaryotic plankton, whereas shorter (C10–C20), odd-numbered, and saturated or mono-unsaturated forms are characteristic features of bacterial fatty acids (e.g., Kaneda, 1991; Thompson, 1996; Bergé and Barnathan, 2005).
Most of the IPLs that have been described in other surface ocean environments (Table 4) were also detected in the mesocosms sampled during the current study, with the notable exception of phosphatidyl glycerol (PG) and phosphatidyl ethanolamine (PE). These IPLs are thought to derive from heterotrophic bacteria (Table 4), which may have passed through the GF/F filter (nominal pore size = 0.7 μm), but both PG and PE were detected by previous studies that have employed these same filters (Brandsma et al., 2012; Kharbush et al., 2016). The oligotrophic conditions and relatively lower amounts of biomass in the mesocosms investigated during the current study may thus explain why PG and PE were below the limit of detection. In contrast to PG and PE, PC lipids in the surface ocean are thought to be produced by eukaryotic phytoplankton (e.g., Kato et al., 1996) and are one of the few IPLs that cannot be attributed to a cyanobacterial source (Table 4). The alkyl chains of PC detected in the current study were relatively short (wt. avg. = 30.4 ± 0.7; Figures 4A, 5) and saturated compared to those described in the surface equatorial N. Pacific (Van Mooy and Fredricks, 2010) or produced in algal cultures (Kato et al., 1996), including picoeukaryotes (Kharbush et al., 2016). The absence of the long chain C22:6 fatty acid further discounts a eukaryotic source of PC (cf. Van Mooy and Fredricks, 2010). Dust additions could also represent a major source of PC, as observed in airborne particles in Australia, which were loaded with roughly 0.43 mg PC g−1 (De Deckker et al., 2008); however, the delayed increases in PC concentration on day 6 in treatment mesocosms (Figures 6, 7) are not consistent with this interpretation. The most abundant alkyl chains of PC in the experimental mesocosms (i.e., C28:0, C29:1, and C31:1) were composed of a mix of C14, C15, C16 fatty acids, and thus suggestive of a bacterial source, consistent with the assignment of PC to heterotrophic bacteria in the oligotrophic Sargasso Sea (Popendorf et al., 2011a; Table 4).
Hierarchical Clustering Analysis of IPL Alkyl Chains
Hierarchical clustering identified groups and outgroups of IPL classes based on their average alkyl chain distributions (Figure 5), which may be indicative of shared vs. unique source organisms, respectively. No clusters were exclusively defined according to IPL isomers (i.e., MGDG.1-3 or DGTS/DGTA; Figure 7), suggesting that the taxonomic or physiological factors that control headgroup stereochemistry may also yield larger dissimilarities in alkyl chain distributions. Therefore, chromatographic resolution may be of increasing importance for the investigation of samples with high biomass in order to distinguish the signals and thus contributions IPL stereoisomers from multiple phylogenetic groups.
GSL-OH lipids were distinguished from all other IPLs, which may be in part attributed to the nomenclature for assigning chain length (cf. Section IPL Alkyl Chain Distributions). However, the GSL-OH alkyl chain pattern also exhibited a distinctive bimodal distribution, with chains summing to C30–C33 or C36–C40 each accounting for roughly 45%, and a unique trend of increasing unsaturations in lipids with shorter alkyl chains (Table 3; Figure 5). GSLs are found in a variety of marine algae and phytoplankton (e.g., Muralidhar et al., 2003) as well as ciliates (15% of total lipids; Sul and Erwin, 1997), which were significantly enriched in the treatment mesocosms at the end of the incubation period (Tsagaraki et al., under revision, this SI). Sphingolipids could also derive from Sphingobacterium and some species of Flavobacterium (e.g., Yabuuchi and Moss, 1982; Yano et al., 1982; Yabuuchi et al., 1983; Dees et al., 1985). This notion is supported by (i) the relatively high abundance of their operational taxonomical units among 16S rRNA gene sequences identified during the Global Ocean Sampling survey of marine bacterioplankton metagenome (Yooseph et al., 2010), and (ii) 16S rDNA clone library analysis of dust rains in the Mediterranean, which can contribute roughly 20 μg DNA m−2 and may thus inoculate EMS surface waters with sphingobacteria and/or their characteristic lipids (Itani and Smith, 2016; Rahav et al., 2016).
While no GSL has been reported by previous IPL surveys of surface seawater (Van Mooy and Fredricks, 2010; Popendorf et al., 2011b; Brandsma et al., 2012; Kharbush et al., 2016), GSLs have been associated with anaerobic production in subsurface layers of the Black Sea (Schubotz et al., 2009). Also, multiple hydroxylated GSLs are known to be expressed during the infection of coccolithophores by marine viruses (Vardi et al., 2009). Constraining GSL sources based on the composition of GSL fatty acid and long-chain sphingoid base moieties is difficult because molecular modifications (e.g., unsaturations, hydroxylation, branching) are common across marine taxa (e.g., Muralidhar et al., 2003). The bimodal distribution of alkyl chains (Figure 5) may thus have resulted from the contribution of GSL-OH from multiple sources (e.g., shorter chains from heterotrophic bacteria and longer chains from eukarya); lipid assimilation and modification by secondary consumers (e.g., Ederington et al., 1995) could also explain these trends. The increases of GSL-OH following addition of SD or A (Figures 6, 7) argue for further investigation of planktonic sources of GSLs in marine settings as potential biomarkers of both dust inputs and, as an N-containing lipid, portals for nutrient “tunneling” to ciliates and other mesozooplankton (cf. Thingstad et al., 2005a).
Most of the remaining IPLs considered in the clustering analysis have been attributed to a wide range of planktonic taxa (Table 4) and were categorized into two subgroups based on similarities and dissimilarities in their alkyl chain distributions (Figure 5). One subgroup comprised only glycolipids and the other comprised PC, DGTA, DGTS, and SQ, which are modulated by eukaryotes and cyanobacteria (Van Mooy et al., 2009) as well as heterotrophic bacteria (Sebastián et al., 2016) in response to nutrient availability.
In terms of alkyl chain distributions, SQ and MGDG.3 were the most similar, each with >95% of alkyl chains summing to C28, C30, or C32 (Figure 5). While this resemblance may be biased by the relatively few compounds and thus low diversity of each class (Table 1; Figure 4C), the similar alkyl chain distributions of MGDG.3 and SQ could be a signature of a shared source organism and/or biosynthetic pathway. These IPLs were nestled among a larger subgroup that is branded by PC, DGTS, and DGTA, the ratios of which vary via the replacement of PC with betaine lipids by P-limited eukaryotes (Van Mooy et al., 2009). Similarly, cyanobacteria were also proposed to substitute phospholipids with SQ when P is scarce, whereas heterotrophic bacteria maintained similar phospholipid cell quotas under P-replete and -deplete conditions (Van Mooy et al., 2009). However, in this study, IPLs that have been associated with nutrient-availability (i.e., PC, SQ, and betaine lipids; Van Mooy et al., 2009; Table 4) were relatively enriched in short (i.e., sum ≤ C34) and saturated alkyl chains (Figure 5), which is a feature that appears to distinguish this cluster from the major glycolipids and is generally attributed to heterotrophic bacteria (e.g., Kaneda, 1991; Thompson, 1996; Bergé and Barnathan, 2005). This finding is consistent with Sebastián et al. (2016), who suggested that heterotrophic bacteria remodel their cell membrane in response to nutrient availability, increasing levels of DGTS during P-deficiency and increasing levels of PC when P becomes available.
DGDG also sorted into this “nutrient availability” cluster, indicating that its alkyl chain distribution was distinct from that of the major glycolipids (i.e., MGDG.1, MGDG.2, and MGA), again, likely owing to the relatively high abundance of saturated alkyl chains summing up to C30. This finding is in contrast to that of Van Mooy and Fredricks (2010), who noted similar diacylglyceride composition among glycolipids (i.e., MGDG, SQ, and DGDG) in the euphotic zone of the south Pacific, although the concentration profiles of DGDG were similar to phospholipids and betaine lipids. While heterotrophic bacteria are not known to produce DGDG or SQ (Table 4), the shared feature of short and saturated alkyl chains is consistent with the production of PC, DGTS, DGTA, DGDG, SQ, and MGDG.3 by heterotrophic bacteria in the oligotrophic EMS, who may thus adjust these IPLs in response to nutrient availability via mechanisms previously described for eukaryotes and cyanobacteria (Van Mooy et al., 2009) and hetertrophic bacteria (Sebastián et al., 2016).
MGDG-OH, MGDG+H2O, AA-L.1, and AA-L.2 lipids comprised ≤4 compounds and therefore were not included in the clustering analysis. Both MGDG-OH and the ambiguous MGDG-like lipid (MGDG+H2O) were characterized by a combination of even-chain fatty acids (C14, C16, C18) with zero or two unsaturations (Section IPL Taxonomic Source Indications), with the former also containing a hydroxyl group in the alkyl chain. This narrow distribution of alkyl chain length and unsaturation suggest that, rather than being products of diagenesis or non-selective transformation of a MGDG precursor, these modified MGDG lipids may be biomarkers of selective biosynthetic pathways. The MS2 fragments of AA-L.1 corresponded to odd-numbered, short-chain fatty acids (C17 and C15; Section IPL Taxonomic Source Indications; Figure S4) and therefore likely derived from a bacterial source. As the fatty acids of AA-L.2 were also short (≤C18), these putative alkylamine lipids may therefore represent a novel IPL biomarker to assess nutrient-stressed populations of heterotrophic bacteria. Although relatively high in diversity (Table 1; Figure 4C), the alkyl chain distribution of GA-L lipids (Figure S7) was not further interpreted via hierarchical cluster analysis as the headgroup and glycerol backbone linkages and thus the length of alkyl chains remains uncertain. However, based on the putative structure (Figure 2), the relatively high abundance of short and saturated alkyl chains featured by this lipid class is similar to that of IPLs in the “nutrient-availability” cluster (Figure 5).
Turnover of the IPL Pool
During the MESOAQUA experiment in 2012 (Heraklion, Greece), concentrations of bacteria, Synechococcus, and chlorophyll increased significantly in response to the addition of SD and A to oligotrophic seawater mesocosms (Herut et al., 2016; Tsiola et al., 2016; Tsagaraki et al., under revision, this SI). In parallel with the stimulation of picoplankton, Chl-a concentrations representative of larger phytoplankton (Chl>2 μ m) had increased by >50% by day 3. However, the concentration of total suspended IPLs was surprisingly stable throughout the pre-addition, stimulated, and post-stimulated periods relative to the significant increases of both phytoplankton and bacteria (e.g., Guo et al., 2016; Herut et al., 2016). That is, based on the hypothesis that IPLs track plankton growth, one would have expected their summed concentrations to increase by >20% of the pre-addition concentrations on day 3 (Figures 1B–C); this value would rise to >60% if one assumes no heterotrophic bacteria were retained by the GF/F filter. The lack of a significant increase in total IPL concentration on day 3 (Figures 1, 6) may be explained by the presence of a relatively refractory pool of IPLs that turnover more slowly (~weeks; e.g., Logemann et al., 2011) than the biogenic lipid signal associated with the growth response of plankton that occurred 3 days after dust addition. This interpretation is supported by the consistently higher measured concentrations of IPLs vs. that predicted based on increases in Chl-a (Figure 1A). Alternatively, the increases in cell abundance following dust amendments may have been accompanied by a reduction in IPL cell quota, thus resulting in a static IPL signal. This hypothesis is supported by the enhanced lipid content of chlorophytes under nutrient limited conditions (Griffiths and Harrison, 2009). For each treatment mesocosm, significant net increases in IPL concentration were not observed until day 6 (p < 0.01; Figure 6; cf. Section IPL Alkyl Chain Distributions), and could not be explained by growth of microzooplankton alone (cf. Section Biological Responses to Dust Addition). In summary, the net increases in total IPL concentration were uncoupled with pigment concentration and plankton biomass, representing a delayed response to the additions of SD and A that may be a hallmark of the episodic blooms occurring in this ultra-oligotrophic setting.
The experimental mesocosms were void of advective input or export fluxes; therefore, net changes in total suspended lipid concentration were presumably determined by the balance of plankton growth (i.e., IPL additions) vs. sinking and diagenesis (i.e., IPL removal). In terms of concentration, the only lipid class that appeared to track the stimulated plankton in SD or A mesocosms was GSL-OH, which increased from 11 ± 2 to 5 ± 2 ng L−1 on day-1, respectively, to maximum values of 30 ± 5 or 34 ± 13 ng L−1 on day 3, accounting for only a fraction of the expected IPL increase (cf. Figure 1). The consistent losses of MGDG.2 and AA-L.1 on days 3 and 6 in control and treatment mesocosms (Figure 6) suggest that these lipids, which accounted for 13–21% of IPLs at the onset of the experiment, were representative of the detrital pool that was removed from the system. In contrast, the additions of MGDG.1, AA-L.2, DGTA, GA-L, PC, and DGDG measured on day 6 among the treatment mesocosms (Figure 6) suggest that these biomarkers integrated biological production or otherwise may have accumulated during the post-stimulated phase in the mesocosm via nutrient stress responses by phytoplankton (e.g., Griffiths and Harrison, 2009) or lipid incorporation by secondary consumers (e.g., Ederington et al., 1995).
Constrained Ordination Modeling of IPL Responses
While changes in lipid concentration can be attributed to growth or removal processes in the context (i.e., time course) of this mesocosm experiment, fluxes of biomarkers in natural environments, such as lateral transport and dilution, are more difficult to constrain. Furthermore, concentrations of particles and thus biomarkers suspended in seawater often exhibit unidirectional trends over seasonal scales (e.g., increasing with production during bloom events; Christodoulou et al., 2009), spatial gradients (e.g., decreases with depth; Wakeham et al., 1997) or along estuarine transects (e.g., Canuel, 2001). These previous studies have therefore rather examined characteristic changes in biomarker relative abundance (as opposed to concentration), which, for our purposes, may better depict shifts in plankton community composition and physiological adaptations. In other words, because the variability overprinted by unilateral concentration change is removed, relative abundance comparisons may offer a more sensitive interpretation of biomarker reactivity.
The significant trends in IPL relative abundance distributions during the MESOAQUA experiment were gleaned via an RDA modeling approach that reduced the dimensionality of the data, which included measurements of 15 IPL classes and 31 environmental parameters for 23 different samples collected from control or treatment mesocosms during the progression of the plankton community (Tables S3, S4). The IPL composition that developed in SD or A mesocosms was distinct from that of the control (i.e., Figure 7; RDA1) and that these differences were amplified during the post-stimulated period, such that adding a temporal component increased the explanatory value of the RDA [i.e., RDA2, p = 0.001; Table S3; cf. Section IPLs in SD or A treatments vs. Control (RDA1) and IPL Composition of Pre-Addition, Stimulated, and Post-Stimulated Samples (RDA2)]. Although neither treatment nor day of sampling were included as discrete terms in the parsimonious RDA model, the combined effects of treatment and temporal development of the plankton community on IPL composition are evident by the grouping of control and day −1 samples (Quadrants III and IV) vs. treatment samples collected on day 3 or day 6 (Quadrants I and II; Figure 8).
Based on the sampling resolution, the largest change in environmental parameters was recorded by τPO4 [cf. Section Comparing IPL Distributions with Environmental Parameters (RDA3], which consequently best explained the changes among IPL lipids (Figure 8). Nevertheless, when considering the impact of the environmental parameters individually (RDA3.1–31), other parameters could also significantly explain IPL distribution (Table S4), including alkaline phosphatase activity, concentrations of ammonia, phosphate, Chl-a and the pigment 19- butanoyloxyfucoxanthin, as well as and the fraction of Chl-a in particles >0.6 μm and the fraction of primary productivity in particles >2 μm. The explanatory potential for these parameters is much less than for τPO4, which resulted in the elimination of these parameters in the combined parsimonious RDA. This RDA modeling approach that employs a forward selection algorithm could be useful for assessing the potential controls of larger gradients in nutrient concentration and productivity on IPL composition.
IPL Signatures of Nutrient Turnover
Leaching of N and P from the SD treatment yielded a lower N:P ratio (ca. 10.1) compared to the A treatment (ca. 19.1; Herut et al., 2016). The relatively enhanced availability of phosphorus in SD mesocosms could thus explain the significantly higher additions of PC in on day 6 (p < 0.04; Figures 6, 7). The delayed and significant increases in PC concentration in treatment mesocosms (Figure 6) is suggestive of autochthonous production rather than leaching from the amended dust (e.g., De Deckker et al., 2008). Given the capacity for SQ to substitute phospholipids (Van Mooy et al., 2009), the net removal of SQ on day 3 in the SD treatments vs. net production in the A treatments (cf. Section IPL Concentrations; Figure 6) may be similarly explained. Further indication of surplus P in the SD treatment stems from the ratio of BL to PC, for which increased values have been interpreted as a signal of P-limitation (Van Mooy et al., 2009; Popendorf et al., 2011b). Conversely, the significantly lower BL:PC value in SD mesocosms on day 6 (2.0 ± 0.3) suggest that P was in excess, relative to control (5.2 ± 1.7) and A (3.7 ± 0.7) mesocosms as well as day −1 of the SD treatment (3.8 ± 0.6; p < 0.04).
Because there were only slight differences in the structure of plankton communities that developed in the treatment mesocosms (Guo et al., 2016; Herut et al., 2016; Tsagaraki et al., under revision, this SI), the significant additions of PC in SD mesocosms may be a signal of changes in plankton physiology rather than taxonomy. This conclusion is consistent with the interpretation of increased BL:PC ratios following N addition to oligotrophic seawater microcosms (Popendorf et al., 2011b), where nutrient additions were higher than the current study by one to two orders of magnitude and yielded in only small changes in community structure. In all treatment mesocosms (n = 6), phosphate concentrations dropped to below 8 nM,τPO4 decreased to <6 min., and the balance of P uptake shifted toward larger organisms by day 6 (Figure 9); however, no significant increases in PC were observed in the A treatment. Additions of SD may have therefore initiated a mechanism by which larger plankton shuttled inorganic P into PC as a result of luxury N and P uptake (relative to A and control mesocosms), or a means of N and P storage, or both. In addition to PC, the significant correlations of DGTA and AA-L.2 relative abundances with τPO4 and P uptake by plankton >2μm (Figure 9) implicate these IPLs as biomarkers of a physiological response to the conditions induced by SD and A deposition in surface oligotrophic seawater.
Conclusions
The enhanced UHPLC-MS protocols employed during this study allowed for identification of novel IPLs in seawater (Table 1) and resolution of their alternative fatty acid distributions (Figure 5, Figure S7), thereby serving to further constrain IPL sources, organic matter reactivity, and food web dynamics in the ocean. The total abundance of IPLs was uncoupled to the induced increases in Chl-a; however, their alkyl chains were typically elongated and more unsaturated in response to SD or A additions (Tables 2, 3). Elongation of fatty acid chains could be a mechanism associated with increases in cellular C storage and size, and accompanying increases in unsaturation would maintain membrane fluidity and thus solute transport (e.g., Chapman, 1975; Williams, 1998). These combined modifications may therefore represent a phenotypic feature of microbial “Winnie-the-Pooh strategists” in the oligotrophic ocean (Thingstad et al., 2005b). Increased desaturation of the fatty acid chain may also save reducing power via use of a polyketide synthase pathway (Ratledge, 2004).
While the stimulation of plankton was relatively low in biomass in comparison to other ocean regions, redundancy analysis indicated that significant changes in IPL headgroup and chain distributions were associated with sampling day and best explained by the large decreases in τPO4 during the temporal evolution of the plankton community (Figure 8). IPLs containing N or N and P, including DGTA, PC, and AA-L.2 were (i) relatively enriched in alkyl chains thought to derive from heterotrophic bacteria, (ii) significantly enriched during the post-stimulated phase in treatment mesocosms (Figure 7), (iii) significantly correlated with decreases in τPO4, and (iv) significantly increased with fractional uptake of P by larger plankton (Figure 9). These IPLs may thus modulate with changes in plankton physiology and/or serve as a portal for nutrient shuttling in the oligotrophic food web.
Author Contributions
TM contributed to the conception and design of this study, performed sampling, performed lipid analyses, interpreted the data, and drafted and revised the manuscript. NG contributed to data interpretation, multivariate analyses, preparation of tables and figures, and drafted and revised the manuscript. AG and SP contributed to the conception and design of this study, sampling, data interpretation and revision of the manuscript. BH and TT contributed to the conception and design of this study, data interpretation, and revision of the manuscript. KH contributed to lipid analysis, data interpretation, and revision of the manuscript for important intellectual content.
Conflict of Interest Statement
The authors declare that the research was conducted in the absence of any commercial or financial relationships that could be construed as a potential conflict of interest.
Acknowledgments
This work was financed by the European Union Seventh Framework Program (FP7/2007–2013) under grant agreement no. 228224 “MESOAQUA: Network of leading MESOcosm facilities to advance the studies of future AQUAtic ecosystems from the Arctic to the Mediterranean.” TM and KH were supported by the Deutsche Forschungsgemeinschaft (DFG) through Gottfried Wilhelm Leibniz Award awarded to KH (grant #HI 616-14); TM was additionally supported by DFG grant #ME 4594/2-1. Julius Lipp assisted with mass spectrometry protocols and interpretation of MS2 fragmentation patterns. Aerjen van den Akker assisted with sample collection from the mesocosms in Heraklion. All members of the MESOAQUA team are acknowledged for their invaluable contributions in support of the mesocosm experiment. We thank two reviewers for investing their time to improve this manuscript.
Supplementary Material
The Supplementary Material for this article can be found online at: https://www.frontiersin.org/article/10.3389/fmars.2017.00113/full#supplementary-material
References
Bergé, J.-P., and Barnathan, G. (2005). Fatty acids from lipids of marine organisms: molecular biodiversity, roles as biomarkers, biologically active compounds, and economical aspects. Adv. Biochem. Eng. Biotechnol. 96, 49–125. doi: 10.1007/b135782
Brandsma, J., Hopmans, E. C., Brussaard, C. P. D., Witte, H. J., Schouten, S., and Sinninghe Damsté, J. (2012). Spatial distribution of intact polar lipids in North Sea surface waters: relationship with environmental conditions and microbial community composition. Limnol. Oceanogr. 57, 959–973. doi: 10.4319/lo.2012.57.4.0959
Canuel, E. (2001). Relations between river flow, primary production and fatty acid composition of particulate organic matter in San Francisco and Chesapeake Bays: a multivariate approach. Org. Geochem. 32, 563–583. doi: 10.1016/S0146-6380(00)00195-9
Chapman, D. (1975). Phase transition and fluidity characteristics of lipids and cell membranes. Quart. Rev. Biophys. 8, 185–235. doi: 10.1017/S0033583500001797
Christodoulou, S., Marty, J.-C., Miquel, J.-C., Volkman, J. K., and Rontani, J.-F. (2009). Use of lipids and their degradation products as biomarkers for carbon cycling in the northwestern Mediterranean Sea. Mar. Chem. 113, 25–40. doi: 10.1016/j.marchem.2008.11.003
Dalsgaard, J., St. John, M., Kattner, G., Müller-Navarra, D., and Hagen, W. (2003). Fatty acid trophic markers in the pelagic marine environment. Adv. Mar. Biol. 46, 225–340. doi: 10.1016/S0065-2881(03)46005-7
De Deckker, P., Abed, R. M. M., de Beer, D., Hinrichs, K.-U., O'Loingsigh, T., Schefuß, E., et al. (2008). Geochemical and microbiological fingerprinting of airborne dust that fell in Canberra, Australia, in Octrober 2002. Geochem. Geophys. Geosyst. 9:Q12QQ10. doi: 10.1029/2008GC002091
Dees, S. B., Carlone, G. M., Hollis, D., and Moss, C. W. (1985). Chemical and phenotypic characteristics of Flavobacterium ialipophiljium compared with those of other Flavobacterium and Sphingobacteriumn species. Int. J. Syst. Bacteriol. 35, 16–22. doi: 10.1099/00207713-35-1-16
Ederington, M. E., McManus, G. B., and Harvey, H. R. (1995). Trophic transfer of fatty acids, sterols and a triterpenoid alcohol between bacteria, a ciliate, and the copepod Acartia tonsa. Limnol. Oceanogr. 40, 860–867. doi: 10.4319/lo.1995.40.5.0860
Geider, R. J., MacIntyre, H. L., and Kana, T. M. (1997). Dynamic model of phytoplankton growth and acclimation: responses of the balanced growth rate and the chlorophyll a: carbon ratio to light, nutrient-limitation and temperature. Mar. Ecol. Prog. Ser. 148, 187–200. doi: 10.3354/meps148187
Griffiths, M. J., and Harrison, S. T. L. (2009). Lipid productivity as a key characteristic for choosing algal species for biodiesel production. J. Appl. Phycol. 21, 493–507. doi: 10.1007/s10811-008-9392-7
Guerzoni, S., Chester, R., Dulac, F., Moulin, C., Herut, B., Loye-Pilot, M. D., et al. (1999). The role of atmospheric deposition in the biogeochemistry of the Mediterranean Sea. Prog. Oceanogr. 44, 147–190. doi: 10.,1016/S0079-6611(99)00024-5
Guieu, C., Loye-Pilot, M. D., Ridame, C., and Thomas, C. (2002). Chemical characterization of the Saharan dust end-member: some biogeochemical implications for the western Mediterranean Sea. J. Geophys. Res. Atmos. 107, 4250–4258. doi: 10.1029/2001JD000582
Guieu, C., Ridame, C., Pulido-Villena, E., Bressac, M., Desboeufs, K., and Dulac, F. (2014). Impact of dust deposition on carbon budget: a tentative assessment from a mesocosm approach. Biogeosciences 11, 5621–5635. doi: 10.5194/bg-11-5621-2014
Guo, C., Xia, X., Pitta, P., Herut, B., Rahav, E., Berman-Frank, I., et al. (2016). Shifts in microbial community structure and activity in the ultra-oligotrophic eastern Mediterranean Sea driven by the deposition of Saharan dust and European aerosols. Front. Mar. Sci. 3:170. doi: 10.3389/fmars.2016.00170
Guschina, I. A., and Harwood, J. L. (2006). Lipids and lipid metabolism in eukaryotic algae. Prog. Lipid Res. 45, 160–186. doi: 10.1016/j.plipres.2006.01.001
Harvey, R. H., and Macko, S. A. (1997). Catalysts or contributors? Tracking bacterial mediation of early diagenesis in the marine water column. Org. Geochem. 26, 531–544. doi: 10.1016/S0146-6380(97)00033-8
Herut, B., Collier, R., and Krom, M. D. (2002). The role of dust in supplying nitrogen and phosphorus to the Southeast Mediterranean. Limnol. Oceanogr. 47, 870–878. doi: 10.4319/lo.2002.47.3.0870
Herut, B., Krom, M. D., Pan, M. D., and Mortimer, R. (1999). Atmospheric input of nitrogen and phosphorus to the SE Mediterranean, sources, fluxes and possible impact. Limnol. Oceanogr. 44, 1683–1692. doi: 10.4319/lo.1999.44.7.1683
Herut, B., Rahav, E., Tsagaraki, T. M., Giannakourou, A., Tsiola, A., Psarra, S., et al. (2016). The potential impact of Saharan dust and polluted aerosols on microbial populations in the East Mediterranean Sea, an overview of a mesocosm experimental approach. Front. Mar. Sci. 3:226. doi: 10.3389/fmars.2016.00226
Herut, B., Zohary, T., Krom, M. D., Mantoura, R. F. C., Pitta, P., Psarra, S., et al. (2005). Response of East Mediterranean surface water to Saharan dust: on-board microcosm experiment and field observations. Deep-Sea Res. II 52, 3024–3040. doi: 10.1016/j.dsr2.2005.09.003
Huguet, C., Hopmans, E. C., Febo-Ayala, W., Thompson, D. H., Sinninghe Damsté, J. S., and Schouten, S. (2006). An improved method to determine the absolute abundance of glycerol dibiphytanyl tetraether lipids. Org. Geochem. 37, 1036–1041. doi: 10.1016/j.orggeochem.2006.05.008
Itani, G. N., and Smith, C. A. (2016). Dust rains deliver diverse assemblages of microorganisms to the Eastern Mediterranean. Nature Sci. Rep. 6:22657. doi: 10.1038/srep22657
Kaneda, T. (1991). Iso- and anteiso-fatty acids in bacteria: biosynthesis, function, and taxonomic significance. Mirobiol. Rev. 55, 288–302.
Kato, M., Sakai, M., Adachi, K., Ikemoto, H., and Sano, H. (1996). Distribution of betaine lipids in marine algae. Phytochemistry 42, 1341–1345. doi: 10.1016/0031-9422(96)00115-X
Kharbush, J. J., Allen, A. E., Moustafa, A., Dorrestein, P. C., and Aluwihare, L. I. (2016). Intact polar diacylglycerol biomarker lipids isolated from suspended particulate organic matter accumulating in an ultraoligotrophic water column. Org. Geochem. 100, 29–41. doi: 10.1016/j.orggeochem.2016.07.008
Kim, J.-H., Schouten, S., Rodrigo-Gámiz, M., Rampen, S., Marino, G., Huguet, C., et al. (2015). Influence of deep-water derived isoprenoid tetraether lipids on the TEX86 paleothermometer in the Mediterranean Sea. Geochim. Cosmochim. Acta 150, 125–141. doi: 10.1016/j.gca.2014.11.017
Klingmüller, K., Pozzer, A., Metzger, S., Stenchikov, G. L., and Lelieveld, J. (2016). Aerosol optical depth trend over the Middle East. Atmos. Chem. Phys. 16, 5063–5073. doi: 10.5194/acp-16-5063-2016
Kouvarakis, G., Mihalopoulos, N., Tselipides, A., and Stavrakakis, S. (2001). On the importance of atmospheric inputs of inorganic nitrogen species on the productivity of the Eastern Mediterranean Sea. Glob. Biogeochem. Cycles 15, 805–817. doi: 10.1029/2001GB001399
Krom, M. D., Brenner, S., Kress, N., and Gordon, L. I. (1991). Phosphorus limitation of primary productivity in the E. Mediterranean Sea. Limnol. Oceanogr. 36, 424–432. doi: 10.4319/lo.1991.36.3.0424
Krom, M. D., Herut, B., and Mantoura, F. (2004). Nutrient budget for the Eastern Mediterranean, implications for P limitation. Limnol. Oceanogr. 49, 1582–1592. doi: 10.4319/lo.2004.49.5.1582
Kubilay, N., Nickovic, S., Moulin, C., and Dulac, F. (2000). An illustration of the transport and deposition of mineral dust onto the eastern Mediterranean. Atmos. Environ. 34, 1293–1303. doi: 10.1016/S1352-2310(99)00179-X
Laghdass, M., Blain, S., Besseling, M., Catala, P., Guiue, C., and Obernosterer, I. (2011). Effects of Saharan dust on the microbial community during a large in situ mesocosm experiment in the NW Mediterranean Sea. Aquat. Microb. Ecol. 62, 201–213. doi: 10.3354/ame01466
Lipp, J. S., Morono, Y., Inagaki, F., and Hinrichs, K.-U. (2008). Significant contribution of Archaea to extant biomass in marine subsurface sediments. Nature 454, 991–994. doi: 10.1038/nature07174
Logemann, J., Graue, J., Köster, J., Engelen, B., Rullkötter, J., and Cypionka, H. (2011). A laboratory experiment of intact polar lipid degradation in sandy sediments. Biogeosciences 8, 2547–2560. doi: 10.5194/bg-8-2547-2011
Markaki, Z., Oikonomou, K., Kocak, M., Kouvarakis, G., Chaniotaki, A., Kubilay, N., et al. (2003). Atmospheric deposition of inorganic phosphorus in the Levantine Basin, eastern Mediterranean: spatial and temporal variability and its role in seawater productivity. Limnol. Oceanogr. 48, 1557–1568. doi: 10.4319/lo.2003.48.4.1557
Muralidhar, P., Radhika, P., Krishna, N., Venkata Rao, D., and Bheemasankara, R. C. (2003). Spingolipids from marine organisms: a review. Nat. Prod. Sci. 9, 117–142.
Oksanen, J., Blanchet, F. G., Kindt, R., Legendre, P., Minchin, P. R., O'Hara, R. B., et al. (2015). Vegan: Community Ecology Package. R package version 2.2-1. Available online at: http://CRAN.R-project.org/package=vegan
Palenik, B., Grimwood, J., Aerts, A., Rouzé, P., Salamov, A., Putnam, N., et al. (2007). The tiny eukaryote Ostreococcus provides genomic insights into the paradox of plankton speciation. Proc. Nat. Acad. Sci. U.S.A. 104, 7705–7710.
Popendorf, K. J., Lomas, M. W., and Van Mooy, B. S. (2011a). Microbial sources of intact polar diacyglycerolipids in the Western North Atlantic Ocean. Org. Geochem. 42, 803–811. doi: 10.1016/j.orggeochem.2011.05.003
Popendorf, K. J., Tanaka, T., Pujo-Pay, M., Lagaria, A., Courties, C., Conan, P., et al. (2011b). Gradients in intact polar diacylglycerolipids across the Mediterranean Sea are related to phosphate availability. Biogeosciences 8, 3733–3745. doi: 10.5194/bg-8-3733-2011
Rahav, E., Paytan, A., Chien, C.-T., Ovadia, G., Katz, T., and Herut, B. (2016). The impact of atmospheric dry deposition associated microbes on the southeastern Mediterranean Sea surface water following an intense dust storm. Front. Mar. Sci. 3:127. doi: 10.3389/fmars.2016.00127
Ratledge, C. (2004). Fatty acid biosynthesis in microorganisms being used for single cell oil production. Biochimie 86, 807–815. doi: 10.1016/j.biochi.2004.09.017
Schubotz, F., Wakeham, S. G., Lipp, J. S., Fredricks, H. F., and Hinrichs, K.-U. (2009). Detection of microbial biomass by intact membrane lipid analysis in the water column and surface sediments of the Black Sea. Environ. Microbiol. 11, 2720–2734. doi: 10.1111/j.1462-2920.2009.01999.x
Sebastián, M., Smith, A. F., González, J. M., Fredricks, H., Van Mooy, B., Koblízek, M., et al. (2016). Lipid remodeling is a widespread strategy in marine heterotrophic bacteria upon phosphorus deficiency. ISME J. 10, 968–978. doi: 10.1038/ismej.2015.172
Simon, M., and Azam, F. (1989). Protein content and protein synthesis rates of planktonic marine bacteria. Mar. Ecol. Prog. Ser. 51, 201–213.
Sohlenkamp, C., and Geiger, O. (2015). Bacterial membrane lipids: diversity in structures and pathways. FEMS Microb. Rev. 40, 133–159. doi: 10.1093/femsre/fuv008
Sturt, H. F., Summons, R. E., Smith, K., Elvert, M., and Hinrichs, K.-U. (2004). Intact polar membrane lipids in prokaryotes and sediments deciphered by high-performance liquid chromatography/electrospray ionization multistage mass spectrometry–new biomarkers for biogeochemistry and microbial ecology. Rapid Commun. Mass Spectrom. 18, 617–628. doi: 10.1002/rcm.1378
Sul, D., and Erwin, J. A. (1997). The membrane lipids of the marine ciliated protozoan Parauronema acutum. Biochim. Biophys. Acta. 1345, 162–171.
Thingstad, T. F., Krom, M. D., Mantoura, R. F. C., Flaten, G. A. F., Groom, S., Herut, B., et al. (2005a). Nature of phosphorus limitation in the ultraoligotrophic Eastern Mediterranean. Science 309, 1068–1071. doi: 10.1126/science.1112632
Thingstad, T. F., Øvreås, L., Egge, J. K., and Løvdal, T., Heldal, M. (2005b). Use of non-limiting substrates to increase size; a generic strategy to simultaneously optimize uptake and minimize predation in pelagic osmotrophs? Ecol. Lett. 8, 675–682. doi: 10.1111/j.1461-0248.2005.00768.x
Thompson, G. A. Jr. (1996). Lipids and membrane function in green algae. Biochim. Biophys. Acta 1302, 17–45. doi: 10.1016/0005-2760(96)00045-8
Tsiola, A., Tsagaraki, T. M., Giannakourou, A., Nikolioudakis, N., Yücel, N., Herut, B., et al. (2016). Bacterial growth and mortality after deposition of Saharan dust and mixed aerosols in the Eastern Mediterranean Sea: a mesocosm experiment. Front. Mar. Sci. 3:281. doi: 10.3389/fmars.2016.00281
Van Mooy, B. A. S., and Fredricks, H. F. (2010). Bacterial and eukaryotic intact polar lipids in the eastern subtropical South Pacific: water-column distribution, planktonic sources, and fatty acid composition. Geochim. Cosmochim. Acta 74, 6499–6516. doi: 10.1016/j.gca.2010.08.026
Van Mooy, B. A. S., Fredricks, H. F., Pedler, B. E., Dyhrman, S. T., Karl, D. M., Koblížek, M., et al. (2009). Phytoplankton in the ocean use non-phosphorus lipids in response to phosphorus scarcity. Nature 458, 69–72. doi: 10.1038/nature07659
Vardi, A., Van Mooy, B. A. S., Fredricks, H., Popendorf, K. J., Ossolinksi, J. E., Haramaty, L., et al. (2009). Viral glycosphingolipids induce lytic infection and cell death in marine phytoplankton. Science 326, 861–865. doi: 10.1126/science.1177322
Wakeham, S. G., Lee, C., Hedges, J. I., Hernes, P. J., and Peterson, M. L. (1997). Molecular indicators of diagenetic status in marine organic matter. Geochim. Cosmochim. Acta 61, 5363–5369. doi: 10.1016/S0016-7037(97)00312-8
Waterbury, J. B., Watson, S. W., Guillard, R. R. L., and Brand, L. E. (1979). Widespread occurrence of a unicellular, marine, planktonic, cyanobacterium. Nature 277, 293–294. doi: 10.1038/277293a0
Williams, W. P. (1998). “The physical properties of thylakoid membrane lipids and their relation to photosynthesis,” in Lipids in Photosynthesis: Structure, Function, and Genetics, eds P.-A. Siegenthaler and N. Murata (Dordrecht: Kluwer Academic Publishers), 103–118.
Wörmer, L., Lipp, J. S., Schröder, J. M., and Hinrichs, K.-U. (2013). Application of two new LC-ESI-MS methods for improved detection of intact polar lipids (IPLs) in environmental samples. Org. Geochem. 59, 10–21. doi: 10.1016/j.orggeochem.2013.03.004
Yabuuchi, E., Kaneko, T., Yano, I., Wayne Moss, C., and Miyoshi, N. (1983). Sphingobacterium gen. nov. Sphingobacterium spiritivorum comb. nov. Sphingobacterium multivorum comb. nov. Sphingobacterium mizutae sp. nov., and Flavobacterium indologenes sp. nov.: glucose-nonfermenting gram-negative rods in CDC groups IIK-2 and IIb. Int. J. Syst. Bacteriol. 33, 580–598. doi: 10.1099/00207713-33-3-580
Yabuuchi, E., and Moss, C. W. (1982). Cellular fatty acid composition of strains of three species of Sphingobacterium gen. and Cytophaga johnsonae. FEMS Microbiol. Lett. 13, 87–91. doi: 10.1111/j.1574-6968.1982.tb08233.x
Yano, I., Tomiyasu, I., and Yabuuchi, E. (1982). Long chain base composition of strains of three species of Sphingobacterium gen. nov. FEMS Microbiol. Lett. 15, 303–307. doi: 10.1111/j.1574-6968.1982.tb00239.x
Yooseph, S., Nealson, K. H., Rusch, D. B., McCrow, J. P., Dupont, C. L., Kim, M., et al. (2010). Genomic and functional adaptation in surface ocean planktonic prokaryotes. Nature 468, 60–67. doi: 10.1038/nature09530
Keywords: diacylglycerol lipids, fatty acids, oligotrophic food web, dust fertilization, HPLC-MS/MS
Citation: Meador TB, Goldenstein NI, Gogou A, Herut B, Psarra S, Tsagaraki TM and Hinrichs K-U (2017) Planktonic Lipidome Responses to Aeolian Dust Input in Low-Biomass Oligotrophic Marine Mesocosms. Front. Mar. Sci. 4:113. doi: 10.3389/fmars.2017.00113
Received: 19 January 2017; Accepted: 10 April 2017;
Published: 27 April 2017.
Edited by:
Angel Borja, AZTI Pasaia, SpainReviewed by:
Jenan Kharbush, Harvard University, USAAna Marta Gonçalves, University of Coimbra, Portugal
Copyright © 2017 Meador, Goldenstein, Gogou, Herut, Psarra, Tsagaraki and Hinrichs. This is an open-access article distributed under the terms of the Creative Commons Attribution License (CC BY). The use, distribution or reproduction in other forums is permitted, provided the original author(s) or licensor are credited and that the original publication in this journal is cited, in accordance with accepted academic practice. No use, distribution or reproduction is permitted which does not comply with these terms.
*Correspondence: Travis B. Meador, travis.meador@uni-bremen.de