Cooperative Research to Evaluate an Incidental Catch Distribution Forecast
 Sara M. Turner1*
  Jonathan A. Hare2
  John P. Manderson3 John J. Hoey4 David E. Richardson4 Christopher L. Sarro4 Ryan Silva5
- 1Massachusetts Division of Marine Fisheries, New Bedford, MA, USA
- 2NOAA Northeast Fisheries Science Center, Woods Hole, MA, USA
- 3Sandy Hook Lab, NOAA Northeast Fisheries Science Center, Highlands, NJ, USA
- 4Narragansett Lab, NOAA Northeast Fisheries Science Center, Narragansett, RI, USA
- 5NOAA Greater Atlantic Region Fisheries Office, Gloucester, MA, USA
Concern over incidental catches in commercial fisheries has been increasing, and while simple mitigation strategies have been effective, few effective mitigation strategies have been established for more complex species interactions. Incidental catches of alewife (Alosa pseudoharengus) and blueback herring (A. aestivalis) in the commercial Atlantic herring (Clupea harengus) fishery have received substantial attention on the Northeast U.S. continental shelf, despite an existing bycatch avoidance program. This study evaluates the utility of existing species distribution forecasts to predict river herring catches in the southern New England small mesh bottom trawl Atlantic herring fishery, with the ultimate goal of incorporating incidental catch forecasts into the bycatch avoidance program. Commercial Atlantic herring bottom trawl vessels assisted with field-based evaluation of alewife, blueback herring, and Atlantic herring species distribution forecast models. Vessels were equipped with conductivity, temperature, and depth probes, and sampling occurred throughout the fishery season (January–March). Locations of expected low and high forecasted incidental catches were sampled, as well as locations the captain expected to find low and high incidental catches. This allowed us to sample within the spatial area the fishery occurs, and to evaluate the forecasted conditions, and predictions, at the spatial scale of the fishery. Catch differences between high and low probability stations were small and variable, as were differences in modeled probability of species presence. No differences were observed between observations at model-predicted stations and captain-selected stations. The sampling provided a better understanding of the potential effectiveness of distribution forecasts for further reducing incidental catches. Existing models have limited use at the spatial scale of this fishery, but could be improved by developing models with fishery-dependent data. Collaborations between researchers, managers, and the Atlantic herring commercial fleet have improved relationships between the groups, and continued collaboration in the development and evaluation of incidental catch reduction tools is key for further reducing incidental catches.
Introduction
Flexible management strategies and cooperative research are becoming common tools in fisheries management, and can increase compliance and improve the economic and ecological efficiency of fisheries (Cox et al., 2007; O'Keefe et al., 2013). Flexible management strategies have become more widespread, especially over the last decade, and are facilitated by technology advancements (Gilman et al., 2006; Lewison et al., 2015; Little et al., 2015). While flexible strategies, such as “move-on rules,” generally need to be combined with some broader scale management plan, these tools can allow fisheries to reduce their non-target catches, while minimizing the economic impacts on the fleet (Dunn et al., 2013; O'Keefe et al., 2013; Little et al., 2015). Many flexible strategies, especially those intended to reduce non-target catches, require regular communications between actively fishing vessels and scientists (Bethoney et al., 2013; O'Keefe et al., 2013; Lewison et al., 2015). A good relationship between managers and industry is key to a successful fleet communication program because of the need for regular communications of detailed information regarding fishing locations and catch compositions as well as high participation levels (O'Keefe et al., 2013; Lewison et al., 2015).
Cooperative research has been used in the development of a variety of tools for improving financial benefits and reducing ecological impacts, such as using industry to test new or modified fishing gear, or to develop and test tools to avoid catching non-target species (Johnson and van Densen, 2007; Lewison et al., 2015). When industry is included in the early stages of research projects, management changes, and policy development, they can contribute critical ideas and information that may have been overlooked by scientists and managers, improving the effectiveness (Hartley and Robertson, 2006; Johnson and van Densen, 2007). This collaboration can also increase industry buy-in for modifying gear or changing their fishing strategy, which drastically improves the success of new policies (Hartley and Robertson, 2006; Johnson and van Densen, 2007).
Recent advances in environmental forecast model accuracy and species distribution modeling have facilitated a shift in dynamic ocean management techniques, from “reactive” systems, where catches are regularly summarized and reported back to vessels, to “proactive” forecasting systems (Hobday and Hartmann, 2006; Manderson et al., 2011; O'Keefe et al., 2013; Eveson et al., 2015; Lewison et al., 2015). Species distribution models provide the foundation for most proactive dynamic management systems, as species distributions are directly or indirectly related to environmental conditions (Mann, 1993). Environmental forecasts can be combined with species distribution models to predict over relatively short (i.e., days to months) time scales to inform fisheries (Hartog et al., 2011; Eveson et al., 2015; Kaplan et al., 2016), or over longer (i.e., decadal) time scales to predict shifts in distributions related to climate change (Hare et al., 2010; Lynch et al., 2015).
In the Northeast U.S., the River Herring Bycatch Avoidance Program, a collaboration involving the Massachusetts Division of Marine Fisheries, the University of Massachusetts School for Marine Science and Technology, and the Atlantic herring (Clupea harengus) and Atlantic mackerel (Scomber scrombus) fisheries, has been operating since 2010 (Bethoney et al., 2013). The program began because of growing concern over incidental catches of river herring (alewife, Alosa pseudoharengus, and blueback herring, A. aestivalis) in the Atlantic herring and Atlantic mackerel fisheries (Bethoney et al., 2013). Participation in the program is voluntary, yet has grown to all of the mid-water fleet (11 vessels) and most of the bottom trawl fleet (6 of 8 vessels) since the implementation of river herring catch caps for all fishing areas (US DOC, 2015). The overall river herring catch cap is the weighted mean river herring catch estimate, with proportions specified for regions and gear types (US DOC, 2015). Many of the small mesh bottom trawl vessels are also part of the NOAA Northeast Fisheries Science Center's Cooperative Research Study Fleet (NEFSC Study Fleet), facilitating detailed data collection on catch composition and locations (Palmer et al., 2007). Preliminary analyses suggest that the Bycatch Avoidance Program has reduced river herring catches as a result of vessels avoiding areas with reported high river herring catches (NEFMC, 2014). The next step in further reducing incidental river herring catches is to develop a nowcast or forecast tool to inform industry of areas where higher river herring catches are likely, along with information on where they have been observed.
We previously developed and evaluated species' distribution models using fishery-independent data (Turner et al., 2015), which we then coupled with an ocean forecast model (FVCOM; Chen et al., 2006) and evaluated its accuracy using newly collected fishery-independent data (Turner et al., 2017). Species' distribution forecasts correctly predicted presence for 68–69% of fishery-independent observations, but given the substantially different spatial scales of the trawl survey used for model development and initial testing and the fishery, fishery-dependent evaluations were necessary. The goal of developing species' distribution forecasts is to create a product that can be incorporated into the existing River Herring Bycatch Avoidance Program to further reduce incidental catches of alewife and blueback herring. The next step in the development of a proactive tool is testing using the designed collection of fishery-dependent data. We contracted three commercial Atlantic herring bottom trawl vessels (members of the NEFSC Study Fleet) to perform directed sampling of the species' distribution forecasts. Our objectives were:
1) To evaluate the accuracy of the species' distribution forecasts over the spatial and temporal scales of the commercial Atlantic herring bottom trawl fishery; and
2) Compare the species' distribution forecasts with the captains' “mental models.”
Methods
Study Area
Species' distribution forecasts were previously developed and evaluated with fishery-independent data (Turner et al., 2015, 2017) for alewife, blueback herring, Atlantic herring, and Atlantic mackerel (not included in this study), encompassing most of the Northeast U.S. continental shelf (Figure 1). The spatial scale of this study (41.15–41.50°N, −71.86–−71.40°W; Figure 1) was substantially smaller than for initial model development and evaluation because the vessels used by the Atlantic herring small mesh bottom trawl in this study typically only take 1 day trips because of limited carrying capacity. All three study species overwinter in Southern New England continental shelf habitats (Fay et al., 1983; Stevenson and Scott, 2005) and alewife and blueback herring are regularly caught by small mesh bottom trawl vessels targeting Atlantic herring during the winter; this study encompassed the fleets' fishing grounds (Bethoney et al., 2013; Cournane et al., 2013). The FVCOM forecast model domain completely encompasses the study area (Figure 2).
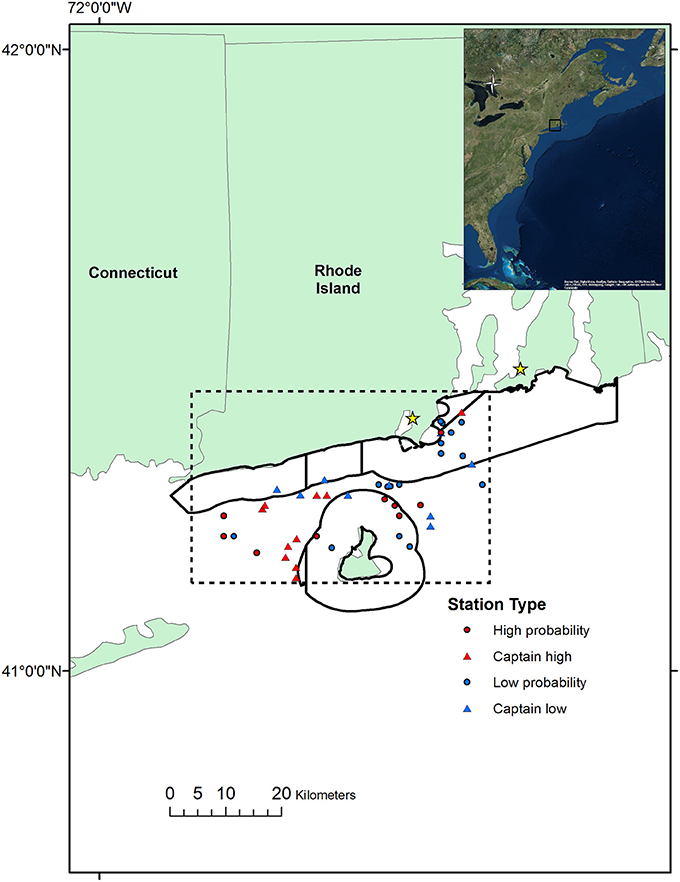
Figure 1. Map of the study area, with Rhode Island state waters indicated with the black line and the spatial limits of the study indicated by the dashed line. Circles indicate model-selected high and low probability stations, triangles indicate captain-selected high and low probability stations; stars indicate the ports.
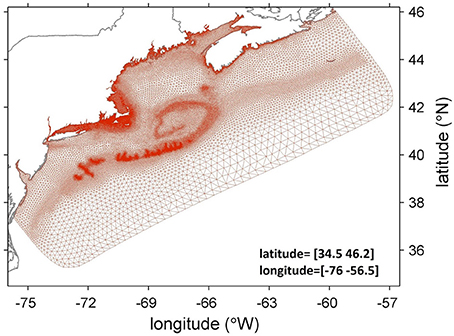
Figure 2. Map of the finite-volume community ocean model (FVCOM) forecast grid; points indicate the forecast nodes, with distances between nodes varying by physical environment complexity (distance between nodes ranges from 0.3 to 15 km).
Directed Sampling
The dates selected for directed model sampling were days the vessels were not commercially fishing with favorable weather; a total of 10 trips were taken for this study (two vessels were contracted for 3 fishing days each, and one vessel was contracted for 4 fishing days). We aimed for one sampling trip each week, to sample most of the fishery season (January–March). Two ports in southern Rhode Island were used for all trips (Figure 1). Oceanographic forecasts coupled with species distribution models were used to select stations with high and low probability of catching alewife and/or blueback herring; ranges for high and low probability stations were dependent on the available ranges of probabilities on a given day. The area was restricted based on vessel capabilities (day boats) and permit allowances, depths greater than 18 meters, and areas with substrate suitable for trawling (Figure 1). Four station types were sampled: a model-based high probability station, a model-based low probability station, a captain-predicted high probability station, and a captain-predicted low probability station. Five sampling stations were the target for each trip, one of each type and a repeat of one of the two model-predicted stations (dependent on location relative to returning to port; see Figure 1) and this was achieved on most trips. Captains could select stations anywhere within the study region they would expect to see high or low river herring incidental catches. All sampling occurred on dedicated research trips, and was covered by a Scientific Research Permit issued by the NOAA Greater Atlantic Regional Fisheries Office Sustainable Fisheries Division; catches were not subject to fishery regulations (i.e., were excluded from quotas). This work was conducted as part of commercial fishing operations and all rules and regulations were followed under an Experimental Fishing Permit (no ethics approval was required as per institutional and national guidelines).
Three captains participated in the project; all are part of the NEFSC Study Fleet. For model selected stations, captains fished as close as safely possible to the coordinates provided (i.e., avoid locations that will damage their gear). Captains selected their fishing locations using their “mental models” of where they thought incidental catch would be high and low. At each station, a 20-min tow (beginning when proper door spread was achieved) was conducted, and a conductivity, temperature, and depth probe (CTD) was attached to the net for each trip to compare the forecasted conditions with those observed. A scientist sorted and weighed (in pounds) all fish caught in each tow to estimate catch composition; when the hail exceeded 1,000 pounds a subsample was taken and extrapolated. Atlantic herring were caught in all tows except one (49 of 50), alewife were caught in 48 of 50 tows, and blueback herring were caught in 40 of 50 tows (Figure 3; see Supplementary Table 1 for catch weights by tow). Other species caught were American shad (A. sapidissima; 31 tows), Atlantic mackerel (19 tows), Atlantic menhaden (Brevoortia tyrannus; 18 tows), butterfish (Peprilus triacanthus; 2 tows), silver hake (Merluccius bilinearis; 1 tow), and long-finned squid (Doryteuthis pealeii; 1 tow).
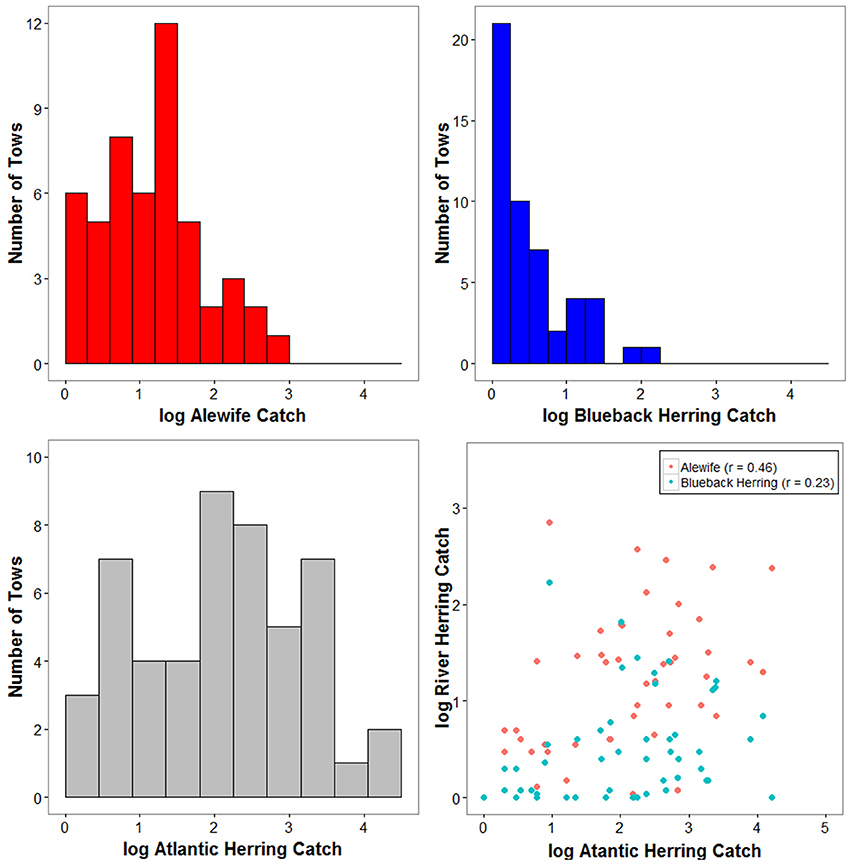
Figure 3. Summary of the observed catches (in pounds) during directed sampling; histogram of the log-transformed alewife catch (upper left), histogram of the log-transformed blueback herring catch (upper right), histogram of the log-transformed Atlantic herring catch (lower left), and a scatterplot of log-transformed alewife (red), and blueback herring (blue) catches against the log-transformed Atlantic herring catch.
Evaluation and Analyses
While the FVCOM model has been thoroughly evaluated, evaluation of temperature and salinity errors at the spatial and temporal scales of the study was deemed useful. Forecasted and observed temperature and salinity were compared using paired t-tests. CTD data were limited to when the net was on the bottom based on the pressure, following protocols established for other bottom trawl surveys, by omitting data where the pressure is <15 decibars and where the rate of change exceeds 0.3 decibars/10 s (measurements were recorded at 10 s intervals). The mean observed temperature and salinity for each tow were used to predict the probability of species' presence for comparison with forecasted probabilities. FVCOM forecasts predict up to 2 days in advance, and 1 or 2 day advance forecasts were used for station selection depending on how far in advance a fishing day was scheduled (previous work found no significant differences in conditions from 1 or 2 day forecasts; Turner et al., 2017). The forecasted conditions used for evaluations were the FVCOM model forecast node nearest to the start of the tow. Linear models were used to test if the relationships between the forecasted and observed conditions were correlated with the distance between the FVCOM forecast node and the coordinates for the trawling start.
Generalized additive models for the habitat associations of alewife, blueback herring, and Atlantic herring, based on fishery-independent data, were previously developed using the R package “mgcv” v. 1.8-6 (Hastie and Tibshirani, 1990; Wood, 2006; Politis et al., 2014; R Development Core Team, 2014; Turner et al., 2015). Species' presence was the response variable, using a binomial link function, and all models included smooth functions of bottom temperature, bottom salinity, and depth, a tensor product smooth of solar azimuth and solar elevation, and region as a factor variable (Turner et al., 2015). Model probabilities of species presence using forecasted and observed conditions were evaluated for all three species using paired t-tests. Linear models were used to test if the relationships between the forecasted and observed predictions were correlated with the distance between the FVCOM forecast node and the coordinates for the trawling start. Model predictions were compared with observed catches by calculating the ratio of alewife or blueback herring weight to Atlantic herring weight (i.e., weight of alewife/weight of Atlantic herring). The differences in model probabilities and catch proportions at high and low probability stations for each day (repeat tows were excluded) were then calculated for alewife and blueback herring to understand how the differences in modeled probabilities compare with observed catch differences. Relationships between model probabilities and catch proportions were examined using FVCOM modeled fields and CTD measurement, for model and captain predicted stations.
To examine one potential discrepancy between catch and forecasted species distribution, we examined how the probabilities changed over the course of the tow track. The vessel records the GPS location every 20 s, and these coordinates were matched to the nearest temporal CTD conditions. Similarly, the closest FVCOM node was matched to each coordinate recorded throughout each tow. The probability of each species' presence was modeled for each observation within each transect using the observed and forecasted conditions, to identify if any substantial changes in the probability of species' presence occurred.
Results
Deviations between forecasted and observed conditions, as well as the probabilities of species' presence based on the forecasted and observed conditions, were quantified to evaluate the ocean forecasts and species distribution forecasts. The differences between the forecasted and observed temperatures and salinities were significant (paired t-tests: t = −9.9 and 10.1, respectively; d.f. = 49; p < 0.0001; Figure 4). The correlation between the temperature deviation (forecasted–observed) and the distance between the FVCOM forecast node and the start location of each trawling station was marginally significant (d.f. = 48; p = 0.0599). The correlation between the salinity deviation and the distance between forecast and trawl stations was significant (d.f. = 48; p = 0.0144). Conversely, the correlation between the species' distribution model deviations and the distance between the FVCOM forecast node and the trawl start locations were not significant (d.f. = 48; p > 0.2). We also evaluated the differences in species distribution model probabilities derived using observed and forecasted conditions. Deviations between forecasted and observed species distribution model probabilities were significant for alewife and Atlantic herring (t < −5; d.f. = 49; p < 0.0001; Figure 5).
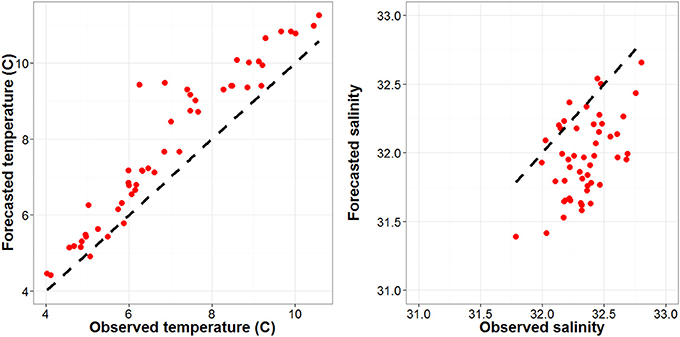
Figure 4. Scatterplots of the forecasted against the observed temperature (left) and salinity (right) for each tow. The dashed line is the 1:1 line.
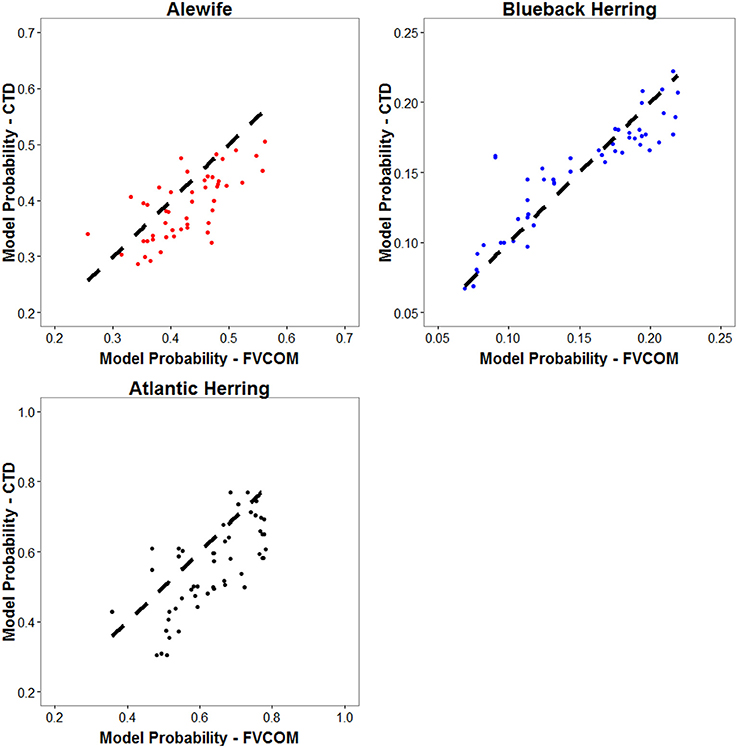
Figure 5. Scatterplots of the model probability of species presence using observed (CTD) conditions against model probabilities using forecasted (FVCOM) conditions for alewife (upper left), blueback herring (upper right), and Atlantic herring (lower left).
The differences were relatively small (average 0.06) between model probabilities of alewife or blueback herring presence for high and low probability stations using forecasted and observed conditions (Tables 1, 2).The differences in the catch proportions of alewife to Atlantic herring and blueback herring to Atlantic herring were generally small for each day (mean difference in proportion alewife = 0.27, mean difference in proportion blueback herring = 0.05; Tables 1, 2; Figure 6). There were weak correlations between the log-transformed alewife and blueback herring catches and the Atlantic herring catches (Figure 3). For 3 fishing days, the proportion of alewife to Atlantic herring catch was lower at the high probability station; the forecasted probability differences for these days ranged from 0.05 to 0.14. The observed condition probability differences on these days did not exceed 0.04 (Table 1; Figures 7, 8). The proportion of blueback herring to Atlantic herring catch was also lower at high probability stations for three fishing days (Table 2; Figures 7, 8). The blueback herring forecasted probability difference was small (<0.02) for all 3 of these days and negative (−0.01) for one. The observed probability differences for these days were similar (Table 2).
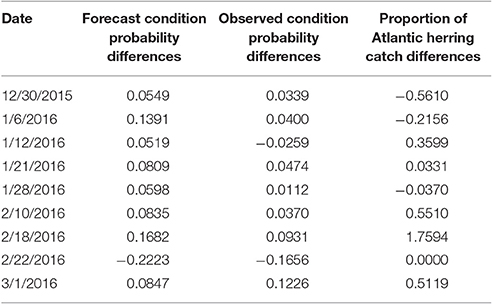
Table 1. Summary of the differences between high and low model probability stations for alewife based on forecasted and observed conditions, and observed difference in the proportion of alewife to Atlantic herring catch for each sampling trip.
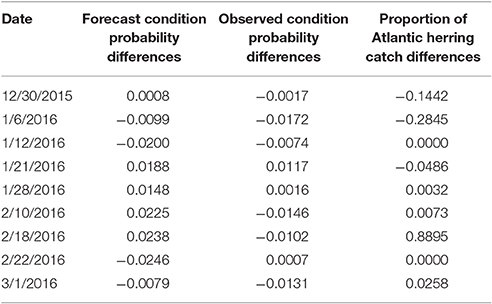
Table 2. Summary of the differences between high and low model probability stations for blueback herring based on forecasted and observed conditions, and observed difference in the proportion of blueback herring to Atlantic herring catch for each sampling trip.
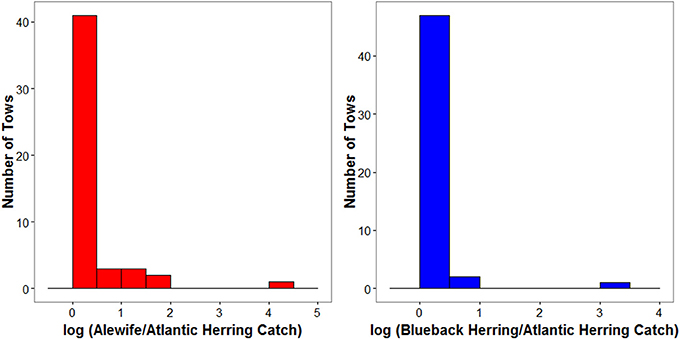
Figure 6. Histograms of the log-transformed proportion of alewife/Atlantic herring catch in pounds (left) and blueback herring to Atlantic herring catch in pounds (right).
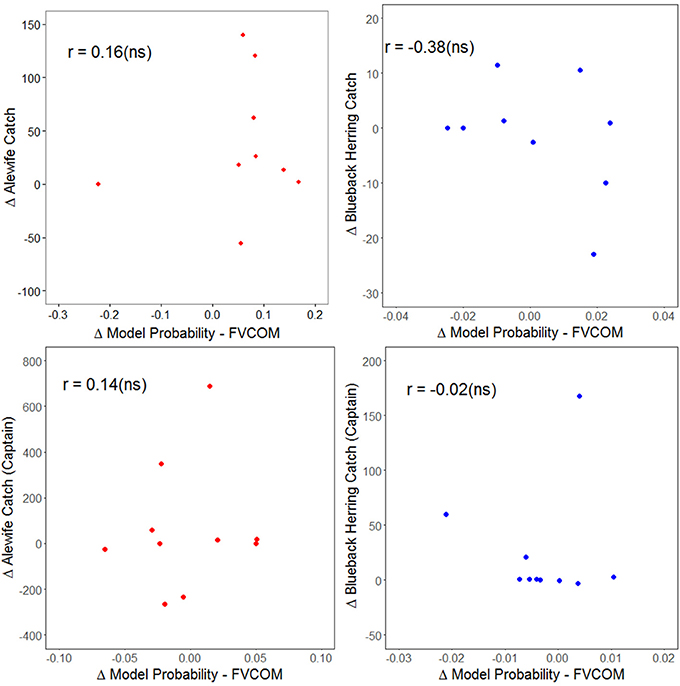
Figure 7. Scatterplots of the observed difference in catch (in pounds) at high and low probability stations against the difference in FVCOM forecasted model probability of species presence for model-selected stations for alewife (upper left) and blueback herring (upper right) and for captain-selected stations for alewife (lower left) and blueback herring (lower right).
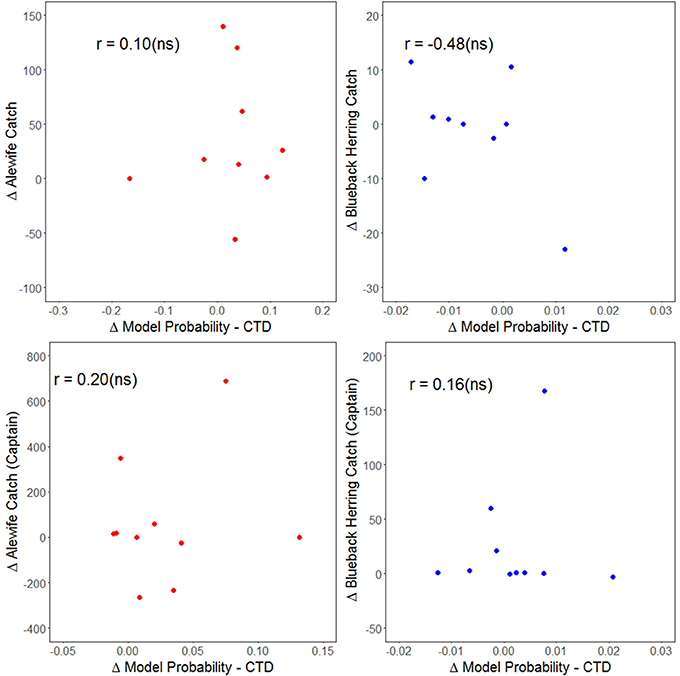
Figure 8. Scatterplots of the observed difference in catch (in pounds) at high and low probability stations against the difference in observed (CTD) model probability of species presence for model-selected stations for alewife (upper left) and blueback herring (upper right) and for captain-selected stations for alewife (lower left) and blueback herring (lower right).
There were minimal differences in the skill of the forecast model compared to the captains' mental models of where high and low catches of river herring would be encountered. There was one exception where the difference for the captain-predicted stations was very large (Figures 7, 8). There was a weak, non-significant, correlation between the catch proportions and forecast model predictions (i.e., alewife probability/Atlantic herring probability; alewife r = 0.25; blueback herring r = 0.20; Figure 9). No significant trends were identified between the differences in model probability and catch proportions between high and low probability stations for model or captain selected stations, using either FVCOM or CTD conditions (Figures 7, 8).
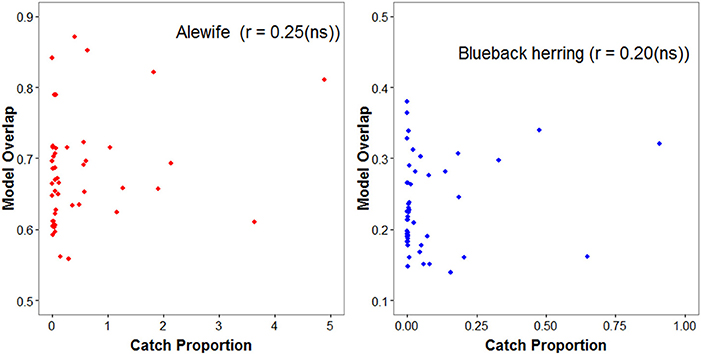
Figure 9. Scatterplots of the proportion of model probability overlap against the catch proportion for alewife (left) and blueback herring (right).
The differences in forecasted and observed model probabilities for all species across each transect were relatively small (all < 0.1) and the median observed probability ranges were all below 0.03 and the median forecasted probability ranges were less than 0.02 (Figure 10). Most tows did not show strong trends in the probability of alewife or blueback herring presence from the start to the end (Supplementary Figures 1, 2).
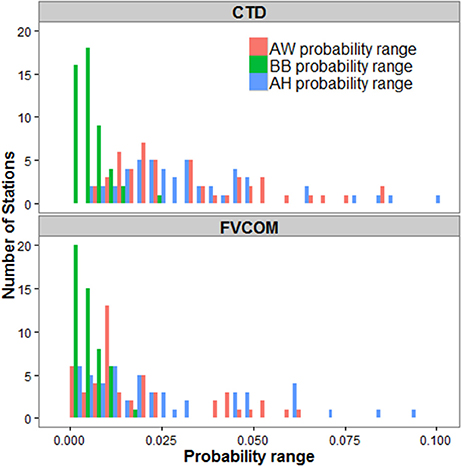
Figure 10. Histograms of the ranges in model probabilities of each species observed within each tow. The upper panel shows the ranges for probabilities derived using observed (CTD probe) data, and the lower panel shows the ranges for probabilities derived using forecast model (FVCOM) data. Red bars represent ranges of alewife (AW) model probability, green bars represent blueback herring (BB) model probability, and blue bars represent Atlantic herring (AH) model probability.
Discussion
Real-time spatial management (dynamic management) strategies have been demonstrated to be more effective than static time and area closures in a wide variety of fisheries (Lewison et al., 2015; Little et al., 2015; Dunn et al., 2016). Real-time management can now be taken a step further, as advancements in oceanographic forecasting permit forecasting species' distributions based on species' habitat associations (Eveson et al., 2015; Kaplan et al., 2016). This study illustrates how to integrate cooperative research for evaluating a potential real-time bycatch forecasting tool. We tested the potential for coupling ocean forecast models and species' distribution models to predict the likelihood of non-target catches of alewife and blueback herring in the winter Atlantic herring bottom trawl fishery at spatial and temporal scales relevant to the fishery. Our test showed little to no skill in our ability to predict high or low occurrence of river herring in the wintertime, small-mesh Atlantic herring bottom trawl fishery. However, the contrast between modeled high and low probability stations was also relatively small (<20%).
Model Evaluations
Forecasted temperature and salinity differed significantly from the observed conditions, but both deviations were related to the distance between the FVCOM forecast node and the trawl starting location. Thus, small spatial scale heterogeneity in conditions likely influences these deviations. The deviations observed here were similar to the deviations observed during fishery-independent model evaluations in Turner et al. (2017) for Southern New England. Forecasted and observed alewife and blueback herring distribution probabilities also differed significantly, but the differences were not related to the distances between FVCOM nodes and trawl start locations. Some additional improvements might be made through higher resolution numerical circulation models. However, the modeled probability of river herring occurrence was little affected by using forecast model based temperature and salinity or CTD-based temperature and salinity. This supports the conclusion of Turner et al. (2017) that much of the error in the model occurrence derives from the species distribution model and not the oceanographic forecasting model: it is the biology not the physics, where the majority of the uncertainty lies.
One weakness in our test of the models skill in predicting high and low incidental catches was the lack of contrast across the model domain. On any given day, the difference between modeled high and low probabilities never exceeded 0.25 and was 0.06 on average. This suggests that probabilities of alewife and blueback herring are relatively consistent within the study area (i.e., at the spatial scale of this fishery; Figure 1) on a given day. Sampling stations for the fishery-independent survey used for initial model development and testing are an average of 12 km apart and cover most of the Northeast U.S. continental shelf; probabilities of species presence at that spatial scale had ranges from 0.5 to 1.0. Despite small differences in probabilities and catches, weak positive correlations, albeit non-significant, were observed between the overall modeled probabilities of both species' presence and the proportion of the Atlantic herring catch for alewife and blueback herring.
Environmental forecast models have been used to predict species' distributions and habitat overlap with other commercially valuable species months in advance for southern bluefin tuna, Thunnus maccoyii (Hartog et al., 2011; Eveson et al., 2015). These models have longer temporal accuracy than those used here, but the spatial resolution is coarser; also, the study species' thermal associations are more distinct than observed for Atlantic herring, alewife, and blueback herring (Hartog et al., 2011; Turner et al., 2015). The difference between the spatial scales of the fishery-independent trawl survey (roughly 20 km or more between stations) that was used for model development and the Atlantic herring small-mesh bottom trawl fishery (total area of roughly 60 by 40 km) may further complicate our model evaluations. When species distribution forecasts were evaluated with fishery-independent data, the forecast model skill ranged from 0.68 to 0.69 for Atlantic herring, alewife, and blueback herring (Turner et al., 2017). At the scale of the small mesh bottom trawl fishery, habitat associations could be dependent on variables not included in models, or relationships with some variables might vary between the spatial scale of the trawl survey compared with the fishery (Hirzel and Le Lay, 2008).
Conditions, and therefore probability of species' presence, changed during the course of each tow, and while the changes in probability were relatively small and generally lacked trends, the ranges observed within tows were similar to the differences observed between high and low probability stations. This heterogeneity in environmental conditions within tows likely affects species distributions, but occurs at a scale finer than the species distribution models and potentially the ocean forecast models as well. Given the relatively small range of probabilities observed within and between tows, and that tow durations for this study were short relative to regular fishing trips (20 min vs. 2 h), species mixing may occur at spatial scales finer than sampled here. Interestingly, the species distribution forecast models and the captains' “mental models” had fairly similar accuracy. This suggests that small-scale physical heterogeneity is not driving differences in catch; which raises the importance of small-scale unresolved aspects of the biological distribution.
Implications and Next Steps
Models developed using fishery-dependent data, as opposed to fishery-independent data might provide greater skill for predicting incidental catch in commercial fisheries. Fishery-dependent models could be developed by deploying CTD probes on commercial small mesh bottom trawl and mid-water trawl vessels. These oceanographic data could be used to further evaluate the accuracy of FVCOM forecasts. Previously collected tow-by-tow catch data can also be used by coupling with FVCOM hindcast data. Tow-by-tow data on catch composition only began being regularly collected within the past decade, thus further limiting the amount of existing data (Bethoney et al., 2013). These data could then be used to generate species distribution models, which could then be tested similar to the test reported here.
The models, in their current form, have limited applicability to the winter small mesh bottom trawl Atlantic herring fishery, but they were useful at the broader scale of the Northeast Fisheries Science Center fishery-independent bottom trawl survey (Turner et al., 2015, 2017). Therefore, we hypothesize that model accuracy is confounded by spatial scale differences in habitat associations, and can be improved for commercial fisheries by developing models using fishery-dependent data. If fishery-dependent models have predictive skill, the next step would be to collaborate with the River Herring Bycatch Avoidance Program to incorporate the forecast models into the program. Given that the existing Bycatch Avoidance Program uses an ~5′ latitude by 10′ longitude grid (roughly 5 nautical miles by 8 nautical miles) for reporting, the forecasts will likely need to be adapted to the same scale to facilitate integrating forecasts models with current bycatch avoidance updates (Bethoney et al., 2013). While a lot of work remains, this tool has the potential to further reduce the ecological impacts of the fishery without large economic losses.
This study also paves the way for using oceanographic forecasting models to support fishery management in near-real time. While substantial work remains, the architecture of coupling circulation models with species distribution models, and providing the output to fishermen in near-real time has been developed. Continued involvement of multiple stakeholders is needed to improve upon this idea. There are numerous by-catch and incidental catch issues in the Northeast region where this approach may contribute to meeting the goals of reducing incidental catch in a cooperative framework, and is a relatively inexpensive method of sampling that could inform stock assessments.
Author Contributions
All authors contributed to the study design. CS performed data collection, and analyses were performed by ST and JH. The initial draft was drafted by ST and JH with input and critical feedback from all other coauthors. All authors approve the final submission.
Conflict of Interest Statement
The authors declare that the research was conducted in the absence of any commercial or financial relationships that could be construed as a potential conflict of interest.
Acknowledgments
This work was funded by the NOAA Greater Atlantic Regional Fisheries Office. Data used for model development and evaluation were collected by the NEFSC Ecosystems Survey Branch. Acknowledgement of the above groups does not imply their endorsement of this work. The views expressed herein are solely those of the authors and do not necessarily reflect those of NOAA or any of its sub-agencies. Many thanks to the captains and crews of the Darana R (Bobby Ruhle), Heather Lynn (Steve Follett), and Sea Breeze Too (Jason Sawyer) for their support and assistance.
Supplementary Material
The Supplementary Material for this article can be found online at: https://www.frontiersin.org/article/10.3389/fmars.2017.00116/full#supplementary-material
References
Bethoney, N. D., Schondelmeier, B. P., Stokesbury, K. D. E., and Hoffman, W. S. (2013). Developing a fine scale system to address river herring (Alosa pseudoharengus, A. aestivalis) and American shad (A. sapidissima) bycatch in the U.S. Northwest Atlantic mid-water trawl fishery. Fish. Res. 141, 79–87. doi: 10.1016/j.fishres.2012.09.003
Chen, C., Cowles, G., and Beardsley, R. C. (2006). An Unstructured Grid, Finite Volume Coastal Ocean Model: FVCOM User Manual, 2 Edn. SMAST/UMASSD Technical Report-06-0602, 315.
Cournane, J. M., Kritzer, J. P., and Correia, S. J. (2013). Spatial and temporal patterns of anadromous alosine bycatch in the US Atlantic herring fishery. Fish. Res. 141, 88–94. doi: 10.1016/j.fishres.2012.08.001
Cox, T. M., Lewiston, R. L., Žydelis, R., Crowder, L. B., Safina, C., and Read, A. J. (2007). Comparing effectiveness of experimental and implemented bycatch reduction measures: the ideal and the real. Conserv. Biol. 21, 1155–1164. doi: 10.1111/j.1523-1739.2007.00772.x
Dunn, D. C., Boustany, A. M., Roberts, J. J., Brazer, E., Sanderson, M., Gardner, B., et al. (2013). Empirical move-on rules to inform fishing strategies: a New England case study. Fish Fish. 15, 359–375. doi: 10.1111/faf.12019
Dunn, D. C., Maxwell, S. M., Boustany, A. M., and Halpin, P. N. (2016). Dynamic ocean management increases the efficiency and efficacy of fisheries management. Proc. Nat. Acad. Sci. U.S.A. 113, 668–673. doi: 10.1073/pnas.1513626113
Eveson, J. P., Hobday, A. J., Hartog, J. R., Spillman, C. M., and Rough, K. M. (2015). Seasonal forecasting of tuna habitat in the Great Australian Bight. Fish. Res. 170, 39–49. doi: 10.1016/j.fishres.2015.05.008
Fay, C. W., Neves, R. J., and Pardue, G. B. (1983). Species Profiles: Life Histories and Environmental Requirements of Coastal Fishes and Invertebrates (Mid-Atlantic) – Alewife/Blueback Herring. U.S. Fish and Wildlife Service; Division of Biological Services; FWS/OBS-82111.9. U.S. Army Corps of Engineers; TR EL-82-4, 25.
Gilman, E. L., Dalzell, P., and Martin, S. (2006). Fleet communication to abate fisheries bycatch. Mar. Policy 30, 360–366. doi: 10.1016/j.marpol.2005.06.003
Hare, J. A., Alexander, M. A., Fogarty, M. J., Williams, E. H., and Scott, J. D. (2010). Forecasting the dynamics of a coastal fishery species using a coupled climate-population model. Ecol. Appl. 20, 452–464. doi: 10.1890/08-1863.1
Hartley, T. W., and Robertson, R. A. (2006). Emergence of multi-stakeholder-driven cooperative research in the Northwest Atlantic: the case of the Northeast Consortium. Mar. Policy 30, 580–592. doi: 10.1016/j.marpol.2005.09.006
Hartog, J. R., Hobday, A. J., Matear, R., and Feng, M. (2011). Habitat overlap between southern bluefin tuna and yellowfin tuna in the east coast longline fishery – implications for present and future spatial management. Deep Sea Res. II 58, 746–752. doi: 10.1016/j.dsr2.2010.06.005
Hirzel, A. H., and Le Lay, G. (2008). Habitat suitability modeling and niche theory. J. Appl. Ecol. 45, 1372–1381. doi: 10.1111/j.1365-2664.2008.01524.x
Hobday, A. J., and Hartmann, K. (2006). Near real-time spatial management based on habitat predictions for a longline bycatch species. Fish. Manage. Ecol. 13, 365–380. doi: 10.1111/j.1365-2400.2006.00515.x
Johnson, T. R., and van Densen, W. L. (2007). Benefits and organization of cooperative research for fisheries management. ICES J. Mar. Sci. 64, 834–840. doi: 10.1093/icesjms/fsm014
Kaplan, I. C., Williams, G. D., Bond, N. A., Hermann, A. J., and Siedlecki, S. A. (2016). Cloudy with a chance of sardines: forecasting sardine distributions using regional climate models. Fish. Oceanogr. 25, 15–27. doi: 10.1111/fog.12131
Lewison, R., Hobday, A. J., Maxwell, S., Hazen, E., Hartog, J. R., Dunn, D. C., et al. (2015). Dynamic ocean management: identifying the critical ingredients of dynamic approaches to ocean resource management. Bioscience 65, 486–498. doi: 10.1093/biosci/biv018
Little, A. S., Needle, C. L., Hilborn, R., Holland, D., and Marshall, C. T. (2015). Real-time spatial management approaches to reduce bycatch and discards: experiences from Europe and the United States. Fish Fish. 16, 576–602. doi: 10.11111/faf.12080
Lynch, P. D., Nye, J. A., Hare, J. A., Stock, C. A., Alexander, M. A., Scott, J. D., et al. (2015). Projected ocean warming creates a conservation challenge for river herring populations. ICES J. Mar. Sci. 72, 374–387. doi: 10.1093/icesjms/fsu134
Manderson, J., Palamara, L., Kohut, J., and Oliver, M. J. (2011). Ocean observatory data are useful for regional habitat modeling of species with different vertical habitat preferences. Mar. Ecol. Prog. Ser. 438, 1–17. doi: 10.3354/meps09308
Mann, K. H. (1993). Physical oceanography, food chains, and fish stocks: a review. ICES J. Mar. Sci. 50, 105–119. doi: 10.1006/jmsc.1993.1013
O'Keefe, C. E., Cadrin, S. X., and Stokesbury, K. D. E. (2013). Evaluating effectiveness of time/area closures, quotas/caps, and fleet communications to reduce fisheries bycatch. ICES J. Mar. Sci. 71, 1286–1297. doi: 10.1093/icesjms/fst063
Palmer, M. C., Wigley, S. E., Hoey, J. J., and Palmer, J. E. (2007). An Evaluation of the Northeast Region's Study Fleet Pilot Program and Electronic Logbook System: Phases I and II. US Dept Commer; Northeast Fish Sci Cent Technical Memorandum NMFS-NE-204.
Politis, P. J., Galbraith, J. K., Kostovick, P., and Brown, R. W. (2014). Northeast Fisheries Science Center Bottom Trawl Survey Protocols for the NOAA Ship Henry B. Bigelow. US Dept Commer; Northeast Fish Sci Cent Ref Doc. 14-06, 138.
R Development Core Team (2014). R: A Language and Environment for Statistical Computing. Vienna: R Foundation for Statistical Computing. Available online at: http://www.R-project.org/
Stevenson, D. K., and Scott, M. L. (2005). Essential Fish Habitat Source Document: Atlantic Herring, Clupea Harengus, Life History and Habitat Characteristics, 2nd Edn. NOAA Tech Memo NMFS NE 192, 84.
Turner, S. M., Hare, J. A., Manderson, J. P., Richardson, D. E., and Hoey, J. J. (2017). Evaluation of species distribution forecasts: a potential predictive tool for reducing incidental catch in pelagic fisheries. Can. J. Fish. Aquat. Sci. doi: 10.1139/cjfas-2016-0274
Turner, S. M., Manderson, J. P., Richardson, D. E., Hoey, J. J., and Hare, J. A. (2015). Using habitat association models to predict Alewife and Blueback Herring marine distributions and overlap with Atlantic Herring and Atlantic Mackerel: can incidental catches be avoided? ICES J. Mar. Sci. 73, 1912–1924. doi: 10.1093/icesjms/fsv166
US Department of Commerce (US DOC) National and Oceanic Atmospheric Administration (NOAA), and National Marine Fisheries Service (NMFS). (2015). Standardized Bycatch Reporting Methodology: An Omnibus Amendment to the Fishery Management Plans of the Mid-Atlantic and New England Regional Fishery Management Councils. 50 CFR 648 Federal Register, 80, 37182–37199.
Keywords: cooperative research, species distribution models, bycatch avoidance, river herring, oceanographic forecast
Citation: Turner SM, Hare JA, Manderson JP, Hoey JJ, Richardson DE, Sarro CL and Silva R (2017) Cooperative Research to Evaluate an Incidental Catch Distribution Forecast. Front. Mar. Sci. 4:116. doi: 10.3389/fmars.2017.00116
Received: 25 January 2017; Accepted: 11 April 2017;
Published: 01 May 2017.
Edited by:
Alistair James Hobday, Commonwealth Scientific and Industrial Research Organisation, AustraliaReviewed by:
Alyson Susan Barratt, Scotland's Rural College, UKStephanie Brodie, University of New South Wales, Australia
Copyright © 2017 Turner, Hare, Manderson, Hoey, Richardson, Sarro and Silva. This is an open-access article distributed under the terms of the Creative Commons Attribution License (CC BY). The use, distribution or reproduction in other forums is permitted, provided the original author(s) or licensor are credited and that the original publication in this journal is cited, in accordance with accepted academic practice. No use, distribution or reproduction is permitted which does not comply with these terms.
*Correspondence: Sara M. Turner, Sara.Turner@state.ma.us