Functional Molecular Diversity of Marine Dissolved Organic Matter Is Reduced during Degradation
 Andrea Mentges
 Christoph Feenders
 Maren Seibt1
  Thorsten Dittmar
- 1Marine Geochemistry (MPI Bridging Group), Institute for Chemistry and Biology of the Marine Environment, University of Oldenburg, Oldenburg, Germany
- 2Mathematical Modeling, Institute for Chemistry and Biology of the Marine Environment, University of Oldenburg, Oldenburg, Germany
- 3Helmholtz Institute for Functional Marine Biodiversity at the University of Oldenburg, Oldenburg, Germany
Dissolved organic matter (DOM) is a highly diverse mixture of compounds, accounting for one of the world's largest active carbon pools. The surprising recalcitrance of some DOM compounds to bacterial degradation has recently been associated with its diversity. However, little is known about large-scale patterns of marine DOM diversity and its change through degradation, in particular considering the functional diversity of DOM. Here, we analyze the development of marine DOM diversity during degradation in two data sets comprising DOM of very different ages: a three-year mesocosm experiment and highly-resolved field samples from the Atlantic and Southern Ocean. The DOM molecular composition was determined using ultra-high resolution mass spectrometry. We quantify DOM diversity using three conceptually different diversity measures, namely richness of molecular formulas, abundance-based diversity, and functional molecular diversity. Using these measures we find stable molecular richness of DOM with age >1 year, systematic changes in the molecules' abundance distribution with degradation state, and increasing homogeneity with respect to chemical properties for more degraded DOM. Coinciding with differences in sea water density, the spatial field data separated clearly into regions of high and low diversity. The joint application of different diversity measures yields a comprehensive overview on temporal and spatial patterns of molecular diversity, valuable for general conclusions on drivers and consequences of marine DOM diversity.
Introduction
Dissolved organic matter (DOM) is a highly diverse mixture of compounds: up to ~20,000 molecular formulas can be detected in a single sample (Riedel and Dittmar, 2014). DOM has accumulated to one of the world's largest active carbon pools, containing a similar amount of carbon as all living biomass on land and in the oceans combined (Hedges, 1992). Due to the size of the DOM pool, even minor changes of DOM stability could impact atmospheric CO2 concentrations and thus the Earth's heat budget. However, it is still not understood why some DOM compounds are stable and accumulate in the oceans instead of being consumed by microorganisms. Several hypotheses for the surprising stability of DOM exist; the most common explanation is that the persisting molecules have intrinsic chemical properties, which prevent their microbial decomposition (“intrinsic stability hypothesis,” e.g., Dittmar, 2015). The recent “diversity hypothesis” gives an additional or alternative explanation, stating that all DOM compounds are in principle labile and can theoretically be decomposed by microorganisms, but their degradation is limited by their low concentration (leak-recovery argument of Flynn and Berry, 1999; Arrieta et al., 2015). The average concentration of an individual DOM compound is assumed to be very low, as the total concentration of dissolved organic carbon (<80 μmol kg−1, Hansell et al., 2009) is split among thousands of molecular formulas identified within DOM (Stenson et al., 2003; Koch et al., 2005), which in turn presumably comprise a multitude of different isomers (Zark et al., 2017). In this context, the concentration distribution of DOM molecules and overall DOM diversity are important descriptive parameters and accordingly, DOM diversity has been reported in recent studies as a characteristic property (e.g., Kellerman et al., 2014; Gonsior et al., 2016). Revealing general patterns of DOM diversity may thus help to explain why more than 600 Pg (Hansell et al., 2009) of climate-relevant carbon persist in the oceans.
Quantifying diversity, and biodiversity in particular, is an ongoing challenge faced by ecologists (Menhinick, 1964; Hurlbert, 1971; Hill, 1973; Washington, 1984; Gotelli and Colwell, 2001; Magurran, 2003; Tuomisto, 2012). As the concept of biodiversity lacks an intrinsic rule for its quantification, a variety of different indices were proposed over the past decades (e.g., Simpson, 1949; McIntosh, 1967; Rao, 1982; Villéger et al., 2008). Although biodiversity indices were designed in the context of species, they can be adapted to other organizational levels (Magurran, 2010), such as molecular mixtures. To apply biodiversity indices to molecular data, molecular formulas are interpreted as species, such that each compound corresponds to one individual. The relative species abundance, i.e., each species' fraction of the total individuals in the sample, is substituted by a measure of molecule abundance (e.g., signal intensity from ultra-high resolution mass spectrometry).
Little is known about general large-scale patterns of marine DOM diversity. In most previous studies, aspects of DOM diversity were studied in a non-marine environment, e.g. forest soils (Roth et al., 2015; Ide et al., 2017), lakes (Kellerman et al., 2014), shelf pore waters (Schmidt et al., 2009), and rivers (Seidel et al., 2015). Other works investigated the impact of experimental treatments on DOM diversity (e.g., photo-alteration, Stubbins and Dittmar, 2015) or compared the diversity of single DOM samples of different origins (marine vs. pore water Koch et al., 2005; bacterially vs. algae-produced, Landa et al., 2014; regions in the Amazon basin, Gonsior et al., 2016). The majority of DOM studies focus on molecular richness, i.e., they quantify diversity as the number of different molecular formulas detected (Schmidt et al., 2009; Roth et al., 2015; Stubbins and Dittmar, 2015). An experiment showed that microorganisms are able to generate more than one thousand molecular substances from few simple substrates in less than 30 days (Lechtenfeld et al., 2015), causing a rapid increase in molecular richness. Occasionally abundance-based diversity is studied, which has been reported to decrease from terrestrially-influenced toward marine samples (quantified by the inverse Simpson index, Seidel et al., 2015), and to increase in forest lakes with dissolved organic carbon concentration and nutrient concentration (quantified by the Chao richness estimator, Kellerman et al., 2014). Though different diversity measures have been applied to DOM in different contexts, a systematic comparison of DOM diversity measures (which exists in the context of biodiversity, Washington, 1984; Magurran, 2003) is currently missing.
In ecological diversity research, there is an increasing use of functional diversity measures (e.g., Petchey and Gaston, 2006; Fontana et al., 2014), which quantify the variety of functions carried out by an ecological community. Functional diversity indices can have advantages in comparison to conventional diversity measures: Petchey et al. (2004) showed that a measure of functional diversity is a better predictor of ecosystem productivity in comparison to species richness. Stuart-Smith et al. (2013) used a functional diversity index (Rao's entropy) to identify previously unrecognized high-diversity regions, which would not have been considered for environmental protection using traditional diversity measures. However, to date functional measures have been rarely applied to DOM. To transfer the concept of functional diversity to molecular mixtures, we assume that compounds reacting (“functioning”) in a similar way show similar chemical properties (a significant correlation of DOM molecular formulas and operational taxonomic units of bacteria has been shown by Osterholz et al., 2016). The term “function” here is not used in the structural, chemical sense, as in “functional groups,” but in the ecological sense. For example, less bioavailable and thus less reactive compounds often show low H/C ratios (Sun et al., 1997). Landa et al. (2014) argued similarly, stating that compounds which are chemically related occupy similar regions in a Van-Krevelen diagram (each molecular formula's O/C ratio is shown against its H/C ratio, this allows for qualitative analysis of major compound classes, Kim et al., 2003). Therefore, a molecular mixture of chemically different compounds can be considered to be more diverse than a mixture of compounds whose chemical properties are alike. The only study of functional diversity in DOM we are aware of was performed by Landa et al. (2014), who showed that algae-produced DOM has a higher functional diversity than bacterially-produced DOM. Detailed knowledge about both, temporal changes and spatial patterns of DOM functional diversity, is currently lacking.
The present study aims to (a) determine whether DOM diversity increases in the course of microbial degradation in the ocean, like molecular richness increases over short time scales in laboratory experiments (Lechtenfeld et al., 2015; Osterholz et al., 2015), and (b) to demonstrate how the joint application of different diversity indices yields a more complete picture of DOM diversity changes. Therefore, we compare three DOM diversity measures that cover three major diversity index groups (see Table 1): (1) The number of molecular formulas, as a measure of molecular richness DR, is a frequently used diversity index in DOM studies (Schmidt et al., 2009; Roth et al., 2015; Stubbins and Dittmar, 2015). (2) The abundance-based Gini-Simpson index DA is one of the most commonly used indices in biodiversity research (Gotelli and Chao, 2013), and has been applied to DOM data before (Seidel et al., 2015). (3) Rao's entropy (Rao, 1982), a functional biodiversity measure DF, has been adopted to DOM data in this paper. The three selected measures for molecular diversity were studied in one temporal and one spatial data set each. The temporal data consist of DOM samples from a three-year laboratory experiment by Osterholz et al. (2015). This data shows the development of DOM diversity, as DOM compounds interact with bacteria and phytoplankton on short time scales, i.e., under increasing degradation with experiment duration. The field data set comprises 285 natural DOM samples from the Southern Ocean and the Atlantic Ocean, suited to reveal in-situ patterns of DOM diversity due to gradients in DOM age along the oceanic currents.
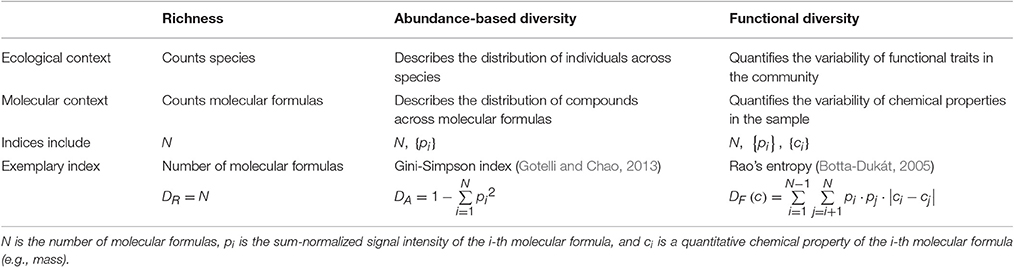
Table 1. Aspects of species diversity and their molecular counterparts.
Methods
Data Sets
The temporal data set is a time-series of molecular DOM data from an experimental set-up by Osterholz et al. (2015). The authors inoculated artificial sea water, containing very low dissolved organic carbon concentrations, with 1% of 200 μm pre-filtered coastal North Sea water, comprising its own phytoplankton and bacterial community, at favorable experimental conditions (average temperature 22.5°C, 12:12 h light:dark cycle). Three consecutive phases occurred in the experiment: a series of phytoplankton blooms (I, days 2–56), a post-blooms stage (II, days 122–370), and a net-heterotrophic phase of DOM consumption (III, days 469–1,011). As nitrate and ammonium were depleted by primary production below the detection limit within less than 1 week, subsequent phytoplankton production was based on recycled nutrients that derive from the bacterial degradation of organic matter. Accordingly, although DOC concentration increased until at least day 400, reworking of DOM continuously occurred. The molecular composition of DOM, as well as community composition and bulk DOC concentrations, was determined from three replicate mesocosms (M1, M2, M3) on 17 occasions during the three-year experiment. Additionally, a subsample of the mesocosms at day 167 was filtered and further incubated in the dark; these data are not shown in this study. Data are available at the PANGAEA data library (doi: 10.1594/PANGAEA.840595).
The field samples were collected during two expeditions of the research vessel Polarstern in austral spring and summer (ANT-XXVIII/5; and ANT-XXVIII/2), covering latitudes between 70°S and 43°N in the Atlantic and Southern Ocean. In total 285 DOM samples were taken at 42 stations from depths of 20–5,642 m. All samples were directly filtered from the Niskin bottles of the CTD using pre-combusted (400°C, 4 h) 0.7 μm glass fiber filter (GF/F, Whatman, United Kingdom). Samples for DOM analysis were extracted with a solid-phase extraction (SPE) method according to Dittmar et al. (2008). In brief, 4 l of filtered seawater were acidified to pH 2 (HCl, 25%, p.a., Carl Roth, Germany). The samples were extracted via gravity flow using commercially pre-packed cartridges (1 g of sorbent, PPL, Agilent, USA). All samples were deionized with acidic ultrapure water (pH 2), dried with nitrogen gas and eluted with 6 ml methanol (HPLC-grade, Sigma-Aldrich, USA). Extracts were stored in the dark at −20°C until further analysis in the home laboratory. The carbon based extraction efficiency was 53 ± 9% for all Atlantic and Southern Ocean samples.
The bathymetry data for the visualization of the ocean floor was extracted from a global bathymetry data set at 1 min resolution from Sandwell et al. (2008, see copyright notice in the supplement). All figures and analyses were generated using MATLAB (Version, 2015b, The MathWorks, Inc., Natick, Massachusetts, United States).
Molecular Composition of DOM
The molecular composition of the DOM samples was determined using ultra-high resolution mass spectrometry (Fourier-transform ion cyclotron resonance mass spectrometry, FT-ICR-MS). The solid-phase extractable DOM was analyzed using a 15 T Solarix FT-ICR-MS (Bruker Daltonics, USA) equipped with an electrospray ionization source (Bruker Apollo II) applied in negative mode. A fraction of DOM is lost in the concentration process prior to the FT-ICR-MS measurement, including very small polar molecules and colloidal aggregates (Hawkes et al., 2016). Therefore, our analyses are restricted to the extractable fraction of DOM. The DOM extracts of the field samples were mixed with ultrapure water and methanol (MS grade, 1:1 v/v) to a final carbon concentration of 10 mg organic carbon per Liter, injected at a flow rate of 120 μl h−1 with a capillary voltage of 4,000 V. Ion accumulation time in the hexapole was 0.25 s prior to transfer into the ICR cell. Mass spectra were recorded in a mass range of 152–2,000 Da with 500 acquired scans per sample, excluding the fraction of high molecular weight DOM, which has been shown to be very reactive (Amon and Benner, 1994). All detected ions were singly charged and the mass error after internal calibration was less than 0.1 ppm. The mass to charge ratio, resolution, and peak intensity were exported and processed using in-house MATLAB routines. For both data sets, masses with a minimum signal-to-noise ratio of 4 were assigned to molecular formulas, following the rules published in Koch et al. (2007). Only compounds with an assigned molecular formula were considered for further evaluation. Signal intensities of each detected molecular formula were normalized to the sum of all signals of molecular formulas detected in the respective sample. For a detailed method description we refer to Seidel et al. (2014).
Diversity Measures
Three diversity indices are considered in this paper (see Table 1): molecular richness DR, the abundance-based Gini-Simpson index DA, and the functional molecular diversity index DF.
Molecular richness DR is defined as the number of molecular formulas identified in a sample from FT-ICR-MS measurements. DR is a simple and easily interpretable measure of molecular diversity, however, it has been demonstrated to vary considerably in replicate measurements of the same sample (Riedel and Dittmar, 2014). DR typically ranges from ~800 to ~4,000 for marine DOM samples (e.g., Koch et al., 2005; Hansman et al., 2015). In our data we find 3, 434 ≤ DR ≤ 4, 402 for marine DOM and 783 ≤ DR ≤ 5, 920 for experimental DOM.
The Gini-Simpson index (Gotelli and Chao, 2013) applied to molecular mixtures takes the intensity distribution {pi} into account:
where N is the total number of molecular formulas in the data set and pi is the relative signal intensity of the molecular formula i. The value DA can be interpreted as the probability that the molecular formulas of two randomly chosen molecules (selection with replacement) differ. The index ranges between 0 and 1, where larger values indicate higher diversity. DA takes its maximal value of 1−1/N in case of a uniform distribution, where all signal intensities pi = 1/N are equal. The sensitivity of DA to the number of molecular formulas N is discussed in Section Comparison of diversity measures.
To quantify the functional molecular diversity DF of chemical mixtures, we used Rao's quadratic entropy (Rao, 1982), which has first been used on ecological data by Botta-Dukát (2005). Adapted to the chemical context, functional molecular diversity DF is defined as (using the absolute difference as distance function):
where ci is a quantitative chemical property of the molecular formula i (e.g., mass, number of carbon atoms, or double bond equivalents). For all molecule pairs (i, j) in the sample, the absolute difference in this property |ci − cj| is weighted by the sum-normalized signal intensities pi and pj of the two molecules. The value DF (c) can be interpreted as the expected difference between two molecules with respect to the chosen property (selection with replacement; assuming that the relative signal intensity represents the abundance of molecules). The functional diversity index has the unit of the chosen chemical property, which makes it easily interpretable in a chemical sense. For example the functional diversity of mass DF (mass) = 51.2 Da means that two randomly chosen molecules in the data set have an expected mass difference of 51.2 Da.
As a basis for the functional diversity measure, we chose three structural properties that determine aspects of a molecule's chemical behavior, e.g., its reactivity: (1) The number of carbon atoms indicates size and molecular weight of DOM molecules, which are known to be related to bioavailability (size-reactivity continuum, Amon and Benner, 1994). (2) The H/C ratio is an indicator of saturation: compounds with high H/C ratios are often more bioavailable and thus more easily degradable by bacteria than compounds with low H/C (Sun et al., 1997). (3) The nominal oxidation state of carbon (NOSC) describes the average oxidation state of a molecule independent of its chemical structure and can also be related to compound reactivity: the oxidation of an organic substance becomes on average thermodynamically more profitable as NOSC increases (LaRowe and Van Cappellen, 2011). For each of these three chemical properties, we derive the corresponding functional diversity DF (C), DF (H/C), and DF (NOSC), respectively.
Degradation Index and Radiocarbon Age
While for the temporal data set sample age is known from the duration of the experiment (in days), such information is missing for the spatial field data set. We therefore substitute sample age by the degradation index (IDEG, Flerus et al., 2012, see Figure S1A for spatial distribution of IDEG in the Atlantic and Southern Ocean). The IDEG gives an estimate of the average degradation state of molecules in the sample. It is calculated from the signal intensities of molecular formulas that have been identified to correlate negatively with Δ14C values, relative to the total intensity of negatively and positively correlating molecular formulas. The IDEG thus ranges between zero (only recent material) and one (only recalcitrant material). The IDEG of the field samples was between 0.64 and 0.83, which is similar to the values reported by Flerus et al. (2012) for the Eastern Atlantic (0.63–0.76 for the surface, 0.76–0.81 for deeper water >200 m). The authors show that the IDEG is significantly correlated to apparent DOC age indicated by Δ14C measurements. Hansman et al. (2015) reported a strong correlation of IDEG with water mass age, indicated by apparent oxygen utilization. As the IDEG seems to be an adequate indicator of apparent DOC age, we used the IDEG of our samples to derive a rough age estimate. We converted the reported Δ14C values for the Eastern Atlantic Ocean of Flerus et al. (2012) to radiocarbon age in years (according to Stenström et al., 2011) and approximated the radiocarbon ages for our samples via linear extrapolation (Figure S2). The resulting approximated DOC radiocarbon age for our Southern Ocean and Atlantic samples lies between 3,000 and 5,300 years, which falls into the range of values observed for the North-East Atlantic (−280‰ to −462‰, approximately 2,600–4,900 14C years, Druffel et al., 2016) and the Southern Ocean (5,600 14C years, Druffel and Bauer, 2000). It is important to note that marine DOM at any water depth represents a mixture of components with apparent radiocarbon ages ranging from modern to >10,000 years (Follett et al., 2014). The radiocarbon ages we refer to in our study are resulting average values of these mixtures.
Determination of Data Trends
A polynomial fit (degree 1 or 2, respectively) was used to determine the relationship between diversity and sample age. The better fit, i.e., line or parabola with the higher adjusted R2 was chosen. In contrast to R2, the adjusted R2 does not necessarily increase when explanatory variables are added (Legendre and Legendre, 2012), because the proportion of variance that random predictors would explain is eliminated from the result. The goodness of the chosen fit in Figure 1 is reported as non-adjusted R2 to facilitate interpretation. For each diversity-age-relationship, it was tested if the slope of the linear fit significantly deviates from slope zero (Student's t-test, Table S1).
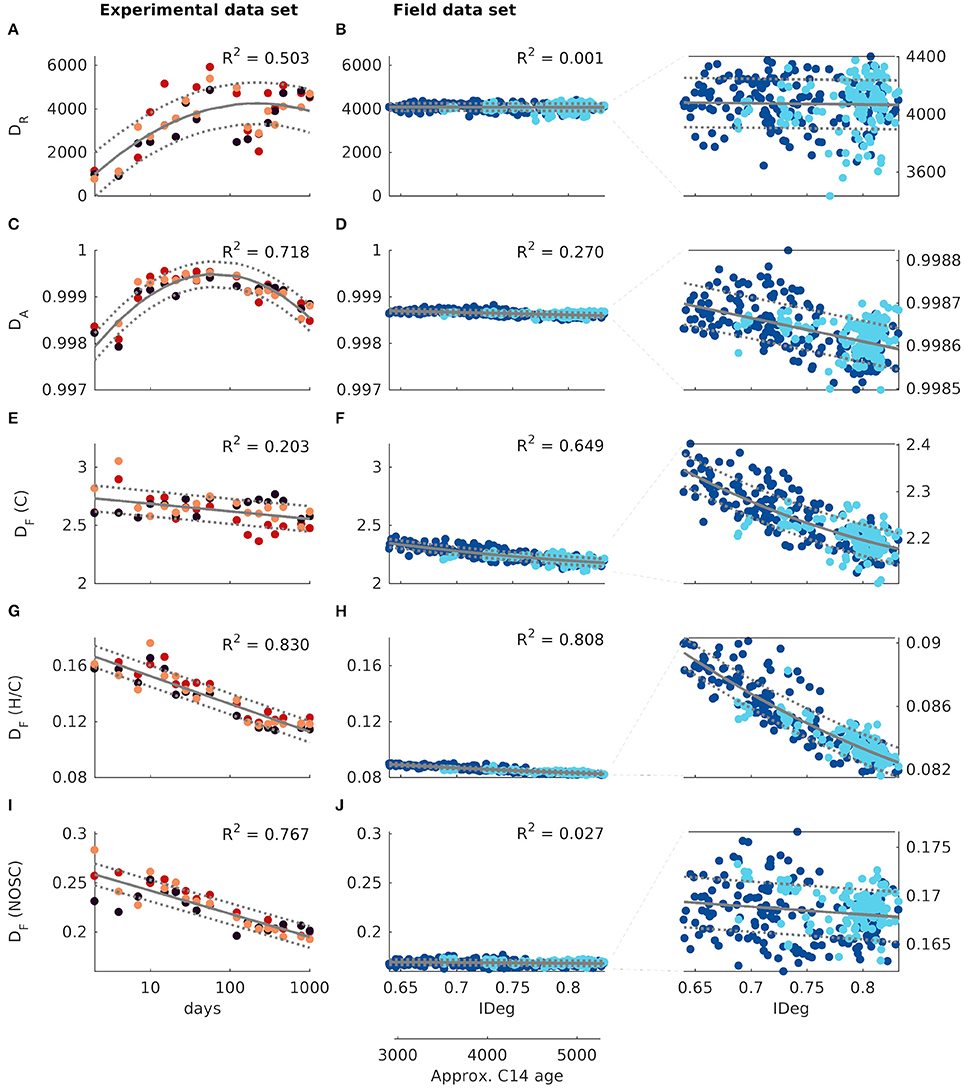
Figure 1. Diversity-age-relationship: Diversity is quantified by (A,B) molecular richness DR, (C,D) abundance-based diversity DA, (E,F) functional molecular diversity of number C atoms DF (C), (G,H) functional diversity of H/C ratios DF (H/C), and (I,J) functional diversity of nominal oxidation state of carbon DF (NOSC). The left column shows temporal experimental data. Sample age is indicated by experiment duration in days (logarithmic scale). The colors of the dots indicate the experimental replicate: red = M1, dark red = M2, orange = M3. The middle column shows spatial field data from the Atlantic and Southern Ocean. Sample age indicated by the degradation index IDEG. The additional horizontal axis below indicates the approximated radiocarbon age in years. The colors of the dots indicate the sampling region: dark blue = Atlantic Ocean, light blue = Southern Ocean (for sampling locations see Figure 2A). The right column shows the same data as the middle column, but with rescaled vertical axis. The bold line indicates the fit, the dotted lines give an estimate of the interval where at least 50% of the predictions of future observations lie according to the fit. The R2 value quantifies the goodness of fit.
Results
DOM Diversity Over Time and Degradation State
In the temporal mesocosm experiment the molecular richness DR increased during the first 2 months of the experiment, then dropped temporarily before raising back to high values (Figure 1A). Abundance-based diversity DA shared the initial increase and then declined from ~122 days onwards (note the logarithmic time-scale, Figure 1C). Functional diversity, quantified by DF (C), DF (H/C), and DF (NOSC), generally decreased during the 3 years of incubation (Figures 1E,G,I). DF (C) declined by 0.18 carbon atoms from day 2 to day 1,011, corresponding to a reduction of 6.4·10−2 carbon atoms per year, based on the fit. DF (H/C) is reduced over the same period of time at a rate of 2.0·10−2 per year, and DF (NOSC) is reduced at a rate of 2.3·10−2 per year, respectively.
For the field samples, molecular richness DR was rather stable for all degradation states (Figure 1B, no significant linear de-/increase). Diversity according to all other measures declined with increasing degradation index (Figures 1D,F,H,J). Functional diversity of number of carbon atoms DF (C) declined by 0.1684 carbon atoms from the least degraded to the most degraded sample (approximated average age of ~3,000 and ~5,300 years, respectively). This indicates that, in highly-degraded DOM, the expected difference of two molecules' carbon atom counts is 0.169 carbon atoms lower (corresponding to a reduction of 7.4·10−2 carbon atoms/1,000 years). The expected difference between two molecules' H/C ratio is 0.007 hydrogen per carbon atoms lower in highly-degraded DOM (reduction of 3.0·10−3/1,000 years), and the expected difference between two molecules' average nominal oxidation state NOSC is 0.002 lower (reduction of 6.8·10−4/1,000 years).
Comparison of Laboratory and Field DOM Diversity
After 3 years of incubation in the laboratory, all diversity measures reached values which were similar to those observed for surface field samples (estimated radiocarbon age ~3,000 years). For example, molecular richness DR was ~4,000 at the end of the laboratory experiment (Figure 1A) and similar for natural samples from the Atlantic and Southern Ocean (3,400–4,400, Figure 1B). The same consistency in diversity between aged laboratory DOM and fresh natural DOM is found for all other diversity measures as well.
Spatial Trends in the Field Data
Cross sections of the Southern and Atlantic Ocean showed different patterns for each diversity measure. Molecular richness DR spanned a moderate range and showed no systematic (e.g., gradual) changes in the Southern Ocean nor the Atlantic (Figure 2B). This was different for abundance-based diversity DA, which exhibited more gradual changes in both depth and latitude, resulting in regions of higher and lower diversity (Figure 2C). The Atlantic samples separated clearly into high diversity surface waters and low diversity deep waters. This separation was even more distinct for functional diversity DF (C) and DF (H/C) (Figures 2D,E). The border between high- and low-diversity regions seemed to coincide with changes in sea water density (see Figure S1B for density distribution), i.e., the strongest gradients in DOM diversity occur at the transition between low-density surface water and high-density deep water. Differently, DF (NOSC) showed no correlation with depth, but rather large patches, which could indicate region-specific influences (Figure 2F).
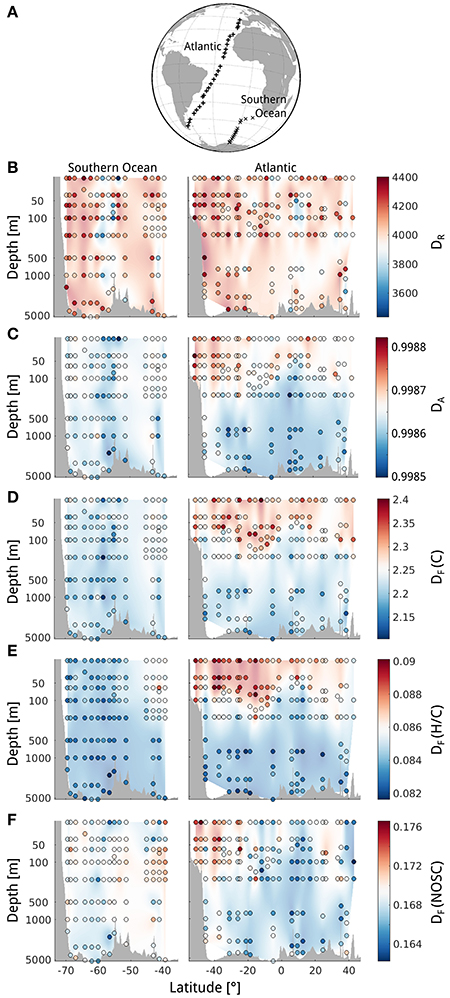
Figure 2. Spatial distribution of diversity in a South-to-North cross section of the Atlantic and Southern Ocean. (A) Map of sampling locations. Diversity quantified by (B) molecular richness DR, (C) abundance-based diversity DA, (D) functional molecular diversity of number C atoms DF (C), (E) functional diversity of H/C ratios DF (H/C), and (F) functional diversity of nominal oxidation state of carbon DF (NOSC). The values denoted at the colorbar correspond to the color of the dots. The interpolated background color is intended as a visual aid only.
Discussion
Effects of Degradation on DOM Diversity
In the laboratory experiment, production and transformation of organic material by the phytoplankton and bacterial communities increased molecular richness DR and abundance-based diversity DA for about ~122 days, before diversity according to both indices declined. From day 167 onwards (next sampling point following 122 days), the first growth phase of the communities was completed, as indicated by increased lysis (Osterholz et al., 2015). Accordingly, changes in richness and abundance-based diversity in the laboratory experiment seem to be coupled to the population dynamics of heterotrophic bacteria and primary producers: DR and DA increase as long as new production exceeds degradation. However, the increase of molecular richness during bloom stage cannot be exclusively attributed to primary producers, as bacteria are able to generate various DOM compounds in few weeks (Lechtenfeld et al., 2015). Functional diversity DF declined throughout the experiment and was thus not sensitive to the proportion of new production vs. degradation.
In the field samples, molecular richness DR remained roughly stable across all degradation states. This is surprising, since the samples cover a wide range of environmental conditions: open ocean waters from more than 5,000 m depth, which have traveled along the oceanic currents for presumably hundreds of years, as well as surface waters closer to the coast, which are exposed to irradiation and receive newly produced and riverine DOM. Data from Koch et al. (2005) indicates increasing molecular richness DR with depth. However, only three different depths of one station in the Weddell Sea are reported. In our highly-resolved Atlantic field data, DR neither showed an obvious depth-dependency, nor a reduction due to photoalteration near the surface, as reported by Stubbins and Dittmar (2015). It has further been observed that molecular richness DR decreases from terrestrially-influenced to marine samples (Koch et al., 2005; Schmidt et al., 2009). We did not observe increased molecular richness DR in presumably terrestrially-influenced water masses (North-Atlantic Deep Water, flowing southward at depths of 1,500–3,500 m, Talley et al., 2011), which might be due to the high dilution in the open ocean.
Abundance-based diversity DA decreased with increasing degradation index in the field samples. Since molecular richness DR remained roughly stable across all degradation states, the decrease in DA must result from changes in the abundance distribution, which becomes less uniform (corresponding to decreasing ecological evenness, Peet, 1974). Indeed, the relative intensity of molecules common to all field samples increases, and the intensity of sporadically identified molecules decreases (Figure S3). Thus, the ratio of high- to low-intensity molecular formulas increases, which could, for example, be explained by an accumulation of already high-concentrated compounds or further decomposition of low-concentrated compounds during aging of DOM.
In the field samples, functional diversity DF (C) decreased with increasing degradation state. This reduction in the variability of number of C atoms could be explained by an observation from Walker et al. (2016), who found that high molecular mass compounds are preferentially remineralized by microorganisms, such that molecular mass decreases while aging (i.e., size-reactivity-continuum, Amon and Benner, 1994). Fresh mixtures, containing both large and small molecules, thus show a high functional diversity DF (C), while degraded mixtures, lacking the larger molecules, show lower functional diversity with respect to molecule size. Functional diversity DF (H/C), and DF (NOSC) also showed a decrease during natural degradation. Fresh mixtures could show higher functional diversity DF (H/C) and DF (NOSC) because they include both the bioavailable high-H/C ratio compounds and the more reactive high-NOSC value compounds, which are preferentially degraded and thus lacking in aged DOM. Together, aged DOM compounds are more homogeneous with respect to size, saturation, and oxidation state.
Despite the profound age differences between the two data sets (less than 3 years old vs. estimated age of ~3,000–5,000 years), their comparison showed that (1) higher-degraded laboratory DOM is of similar diversity as natural surface DOM and (2) late stages of the laboratory incubation show the same trend in diversity as the field data. Thus, although the environmental conditions of the surface ocean are best represented in the early stages of the laboratory experiment, where light and warm conditions are complemented by strong production processes, the best agreement regarding the diversity is found between surface DOM and aged laboratory DOM. Note that there is no such match between the two data sets for the intensity-weighted average of chemical properties: the samples' weighted mean number of C atoms, weighted mean H/C ratio, and weighted mean NOSC markedly differ between the experimental and field data (Figure S4). Concerning diversity, however, the field data could be interpreted as a continuation of the experiment (“diversity continuum”).
Comparison of Diversity Measures
In the experimental data, molecular richness DR and abundance-based diversity DA initially increased while all three functional diversity measures DF decreased. For laboratory experiments, discrepancies between different diversity measures have been observed before (Landa et al., 2014). Our results for the spatial data demonstrate such divergent behavior of diversity measures for natural samples (molecular richness DR remains stable, while the other diversity measures decreased). Cases where different diversity indices yield opposing results for the same data might seem contradictory at first. However, a chemical mixture is a complex distribution, which cannot be characterized by a single number, and thus each diversity index captures specific aspects of this mixture. Therefore, statements about overall “DOM diversity” should be based on multiple, complementary diversity indices in combination.
Ultra-high resolution mass spectrometry allows for the identification of thousands of molecular formulas of intact molecules in a single sample (Koch et al., 2007). As such it is, to date, the only method through which the molecular diversity of DOM can be assessed. Other high-resolution methods are on the rise, e.g., multidimensional chromatography methods coupled to mass spectrometry (Ball and Aluwihare, 2014) or multidimensional nuclear magnetic resonance (Hertkorn et al., 2013). These emerging techniques will help to assess the molecular diversity of DOM in greater detail in the near future. Despite the enormous information richness of FT-ICR-MS data, the method also has its limitations. The signal intensity is a semi-quantitative measure of relative molecule abundance, as it depends not only on the concentration of the analyte, but e.g., also on its ionization efficiency (Urban et al., 2016). Measurement settings and analytical variations (e.g., ion-ion interactions) further influence the analytical results. Consequently, the number of molecular formulas, and hence DR, can range between 3,000 and 15,000 in replicate analyses of the same sample (Riedel and Dittmar, 2014). As the variability of DR is already considerable for a single sample measured with the same instrument, comparing molecular richness among studies with varying instrument resolution and different processing procedures may be problematic.
To assess robustness of the other diversity indices, the field data set was modified by discarding molecular formulas with low peak intensity, such that only half of identified formulas in each sample remained (i.e., simulating an increased signal-to-noise ratio). For this strongly reduced data set, abundance-based diversity DA is nearly identical to that of the full sample (maximal deviation 0.4%), while functional diversity DF (C), DF (H/C), and DF (NOSC) is maximally reduced by 10.1, 9.9, and 6.1%, respectively. Since abundance-based and functional diversity remain rather stable even when halving sample-size, it is reasonable to assume that these measures are also robust against variations in sample preparation and measurement settings, making them suitable candidate measures for comparison of DOM diversity among studies.
Implications for DOM Stability
Our field data suggest that the abundance distribution of marine DOM becomes less uniform while aging. In the context of the “intrinsic stability hypothesis” of DOM (e.g., Dittmar, 2015), this could be interpreted as supporting evidence: abundant compounds accumulate due to their stable structure, while rare compounds are labile and are thus effectively degraded, resulting in an increasingly uneven abundance distribution.
In the context of the “diversity hypothesis,” the uneven abundance distribution of aged oceanic DOM could be explained by the accumulation of molecular formulas comprising a high number of structural isomers. The apparent abundance of some molecular formulas could thus simply be due to a high number of structurally different constituents, each present at concentrations too low for microbial uptake (Arrieta et al., 2015). The observed decrease of functional diversity does not contradict this explanation, as increasing homogenization of DOM compounds with respect to size, saturation, and oxidation state does not imply a reduction of structural diversity.
Conclusions
Combining three conceptually different diversity measures, we showed, that the previously observed increase of DOM diversity during bacterial degradation (Lechtenfeld et al., 2015) is limited to the growth phase of phytoplankton and bacterial communities in experimental set-ups. Furthermore, the increase of DOM diversity due to production processes is only reflected in molecular richness and abundance-based diversity, while functional diversity is mainly driven by heterotrophic decomposition processes. Marine DOM is not diversified during degradation and transport, as all diversity measures were stable or even decreased with increasing degradation state in the field samples.
After 3 years of incubation in the laboratory, all diversity measures approached diversity values observed for the field samples, suggesting a continuum of diversity along the degradation state. Along this continuum, functional diversity showed the most pronounced decrease. The decrease of functional diversity indicates that aged, highly-degraded DOM is more homogeneous with respect to molecular size of compounds, saturation, and oxidation state than fresh DOM.
With increasing degradation state, the molecular richness of oceanic DOM, quantified by the number of molecular formulas, remained roughly the same, while abundance-based diversity and functional diversity declined. This divergent behavior of diversity measures illustrates that each diversity index captures specific and incomplete information on diversity. We conclude that several, complementary diversity measures should be combined to study DOM diversity.
Author Contributions
TD and BB conceived the study. MS acquired and processed the field data from the Atlantic and Southern Ocean. AM and CF carried out the analyses and prepared the manuscript. All authors revised the manuscript critically.
Funding
This work was funded by the ministry of science and culture of Lower Saxony (Niedersächsisches Ministerium für Wissenschaft und Kultur, MWK) within the research training program IBR (Interdisciplinary approach to functional biodiversity research).
Conflict of Interest Statement
The authors declare that the research was conducted in the absence of any commercial or financial relationships that could be construed as a potential conflict of interest.
Acknowledgments
We would like to thank the captain and crew of the research vessel Polarstern for help during sampling, M. Friebe, K. Klaproth, and I. Ulber for technical assistance. We thank H. Hillebrand for his contribution to data interpretation, as well as the two reviewers for their valuable comments.
Supplementary Material
The Supplementary Material for this article can be found online at: https://www.frontiersin.org/article/10.3389/fmars.2017.00194/full#supplementary-material
References
Amon, R. M. W., and Benner, R. (1994). Rapid cycling of high-molecular-weight dissolved organic matter in the ocean. Nature 369, 549–552. doi: 10.1038/369549a0
Arrieta, J. M., Mayol, E., Hansman, R. L., Herndl, G. J., Dittmar, T., and Duarte, C. M. (2015). Dilution limits dissolved organic carbon utilaization in the deep ocean. Science 348, 331–333. doi: 10.1126/science.1258955
Ball, G. I., and Aluwihare, L. I. (2014). CuO-oxidized dissolved organic matter (DOM) investigated with comprehensive two dimensional gas chromatography-time of flight-mass spectrometry (GC × GC-TOF-MS). Org. Geochem. 75, 87–98. doi: 10.1016/j.orggeochem.2014.06.010
Botta-Dukát, Z. (2005). Rao's quadratic entropy as a measure of functional diversity on multiple traits. J. Veg. Sci. 16, 533–540. doi: 10.1111/j.1654-1103.2005.tb02393.x
Dittmar, T. (2015). “Reasons behind the long-term stability of dissolved organic matter,” in Biogeochemistry of Marine Dissolved Organic Matter, eds D. A. Hansell and C. A. Carlson (Boston, MA: Elsevier Inc.), 369–388.
Dittmar, T., Koch, B., Hertkorn, N., and Kattner, G. (2008). A simple and efficient method for the solid-phase extraction of dissolved organic matter (SPE-DOM) from seawater. Limnol. Ocean. Methods 6, 230–235. doi: 10.4319/lom.2008.6.230
Druffel, E. R. M., and Bauer, J. E. (2000). Radiocarbon distributions in Southern Ocean dissolved and particulate organic matter. Geophys. Res. Lett. 27, 1495–1498. doi: 10.1029/1999GL002398
Druffel, E. R. M., Griffin, S., Coppola, A. I., and Walker, B. D. (2016). Radiocarbon in dissolved organic carbon of the Atlantic Ocean. Geophys. Res. Lett. 43, 5279–5286. doi: 10.1002/2016GL068746
Flerus, R., Lechtenfeld, O. J., Koch, B. P., McCallister, S. L., Schmitt-Kopplin, P., Benner, R., et al. (2012). A molecular perspective on the ageing of marine dissolved organic matter. Biogeosciences 9, 1935–1955. doi: 10.5194/bg-9-1935-2012
Flynn, K. J., and Berry, L. S. (1999). The loss of organic nitrogen during marine primary production may be significantly overestimated when using 15N substrates. Proc. R. Soc. B Biol. Sci. 266, 641–647. doi: 10.1098/rspb.1999.0684
Follett, C. L., Repeta, D. J., Rothman, D. H., Xu, L., and Santinelli, C. (2014). Hidden cycle of dissolved organic carbon in the deep ocean. Proc. Natl. Acad. Sci. U.S.A. 111, 16706–16711. doi: 10.1073/pnas.1407445111
Fontana, S., Jokela, J., and Pomati, F. (2014). Opportunities and challenges in deriving phytoplankton diversity measures from individual trait-based data obtained by scanning flow-cytometry. Front. Microbiol. 5:324. doi: 10.3389/fmicb.2014.00324
Gonsior, M., Valle, J., Schmitt-Kopplin, P., Hertkorn, N., Bastviken, D., Luek, J., et al. (2016). Chemodiversity of dissolved organic matter in the Amazon Basin. Biogeosciences 13, 4279–4290. doi: 10.5194/bg-13-4279-2016
Gotelli, N. J., and Chao, A. (2013). “Measuring and estimating species richness, species diversity, and biotic similarity from sampling data,” in Encyclopedia of Biodiversity, ed S. A. Levin (Waltham, MA: Academic Press), 195–211.
Gotelli, N. J., and Colwell, R. K. (2001). Quantifying biodiversity: procedures and pitfalls in the measurement and comparison of species richness. Ecol. Lett. 4, 379–391. doi: 10.1046/j.1461-0248.2001.00230.x
Hansell, D. A., Carlson, C. A., Repeta, D. J., and Schlitzer, R. (2009). Dissolved organic matter in the ocean. Oceanography 22, 202–211. doi: 10.5670/oceanog.2009.109
Hansman, R. L., Dittmar, T., and Herndl, G. J. (2015). Conservation of dissolved organic matter molecular composition during mixing of the deep water masses of the northeast Atlantic Ocean. Mar. Chem. 177, 288–297. doi: 10.1016/j.marchem.2015.06.001
Hawkes, J. A., Hansen, C. T., Goldhammer, T., Bach, W., and Dittmar, T. (2016). Molecular alteration of marine dissolved organic matter under experimental hydrothermal conditions. Geochim. Cosmochim. Acta 175, 68–85. doi: 10.1016/j.gca.2015.11.025
Hedges, J. I. (1992). Global biogeochemical cycles: progress and problems. Mar. Chem. 39, 67–93. doi: 10.1016/0304-4203(92)90096-S
Hertkorn, N., Harir, M., Koch, B. P., Michalke, B., and Schmitt-Kopplin, P. (2013). High-field NMR spectroscopy and FTICR mass spectrometry: powerful discovery tools for the molecular level characterization of marine dissolved organic matter. Biogeosciences 10, 1583–1624. doi: 10.5194/bg-10-1583-2013
Hill, M. O. (1973). Diversity and Evenness: a Unifying Notation and Its Consequences. Ecology 54, 427–432. doi: 10.2307/1934352
Hurlbert, S. H. S. (1971). The nonconcept of species diversity: a critique and alternative parameters. Ecology 52, 577–586. doi: 10.2307/1934145
Ide, J., Ohashi, M., Takahashi, K., Sugiyama, Y., Piirainen, S., Kortelainen, P., et al. (2017). Spatial variations in the molecular diversity of dissolved organic matter in water moving through a boreal forest in eastern Finland. Sci. Rep. 7:42102. doi: 10.1038/srep42102
Kellerman, A. M., Dittmar, T., Kothawala, D. N., and Tranvik, L. J. (2014). Chemodiversity of dissolved organic matter in lakes driven by climate and hydrology. Nat. Commun. 5, 3804. doi: 10.1038/ncomms4804
Kim, S., Kramer, R. W., and Hatcher, P. G. (2003). Graphical method for analysis of ultrahigh-resolution broadband mass spectra of natural organic matter, the van krevelen diagram. Anal. Chem. 75, 5336–5344. doi: 10.1021/ac034415p
Koch, B. P., Dittmar, T., Witt, M., and Kattner, G. (2007). Fundamentals of molecular formula assignment to ultrahigh resolution mass data of natural organic matter. Anal. Chem. 79, 1758–1763. doi: 10.1021/ac061949s
Koch, B. P., Witt, M. R., Engbrodt, R., Dittmar, T., and Kattner, G. (2005). Molecular formulae of marine and terrigenous dissolved organic matter detected by electrospray ionization Fourier transform ion cyclotron resonance mass spectrometry. Geochim. Cosmochim. Acta 69, 3299–3308. doi: 10.1016/j.gca.2005.02.027
Landa, M., Cottrell, M. T., Kirchman, D. L., Kaiser, K., Medeiros, P. M., Tremblay, L., et al. (2014). Phylogenetic and structural response of heterotrophic bacteria to dissolved organic matter of different chemical composition in a continuous culture study. Environ. Microbiol. 16, 1668–1681. doi: 10.1111/1462-2920.12242
LaRowe, D. E., and Van Cappellen, P. (2011). Degradation of natural organic matter: a thermodynamic analysis. Geochim. Cosmochim. Acta 75, 2030–2042. doi: 10.1016/j.gca.2011.01.020
Lechtenfeld, O. J., Hertkorn, N., Shen, Y., Witt, M., and Benner, R. (2015). Marine sequestration of carbon in bacterial metabolites. Nat. Commun. 6, 6711. doi: 10.1038/ncomms7711
Legendre, P., and Legendre, L. (2012). Numerical Ecology, Chapter 10 - Interpretation of Ecological Structures, 3rd Edn. Oxford: Elsevier Oxford.
McIntosh, R. P. (1967). An index of diversity and the relation of certain concepts to diversity. Ecology 48, 392–404. doi: 10.2307/1932674
Menhinick, E. F. (1964). A comparison of some species-individuals diversity indices applied to samples of field insects. Ecology 45, 859–861. doi: 10.2307/1934933
Osterholz, H., Niggemann, J., Giebel, H.-A., Simon, M., and Dittmar, T. (2015). Inefficient microbial production of refractory dissolved organic matter in the ocean. Nat. Commun. 6:7422. doi: 10.1038/ncomms8422
Osterholz, H., Singer, G., Wemheuer, B., Daniel, R., Simon, M., Niggemann, J., et al. (2016). Deciphering associations between dissolved organic molecules and bacterial communities in a pelagic marine system. ISME J. 10, 1–14. doi: 10.1038/ismej.2015.231
Peet, R. K. (1974). The measurement of species diversity. Annu. Rev. Ecol. Syst. 5, 285–307. doi: 10.1146/annurev.es.05.110174.001441
Petchey, O., Hector, A., and Gaston, K. (2004). How do different measures of functional diversity perform? Ecology 85, 847–857. doi: 10.1890/03-0226
Petchey, O. L., and Gaston, K. J. (2006). Functional diversity: back to basics and looking forward. Ecol. Lett. 9, 741–758. doi: 10.1111/j.1461-0248.2006.00924.x
Rao, R. (1982). Diversity and dissimilarity coefficients: a unified approach. Theor. Popul. Biol. 21, 24–43. doi: 10.1016/0040-5809(82)90004-1
Riedel, T., and Dittmar, T. (2014). A method detection limit for the analysis of natural organic matter via fourier transform ion cyclotron resonance mass spectrometry. Anal. Chem. 86, 8376–8382. doi: 10.1021/ac501946m
Roth, V.-N., Dittmar, T., Gaupp, R., and Gleixner, G. (2015). The molecular composition of dissolved organic matter in forest soils as a function of ph and temperature. PLoS ONE 10:e0119188. doi: 10.1371/journal.pone.0119188
Sandwell, D. T., Smith, W. H. F., and Becker, J. J. (2008). Global Bathymetry - Gridded at 1 Minute Resolution. Available online at: ftp://topex.ucsd.edu/pub/global_topo_1min/ (Accessed September 30, 2013).
Schmidt, F., Elvert, M., Koch, B. P., Witt, M., and Hinrichs, K.-U. (2009). Molecular characterization of dissolved organic matter in pore water of continental shelf sediments. Geochim. Cosmochim. Acta 73, 3337–3358. doi: 10.1016/j.gca.2009.03.008
Seidel, M., Beck, M., Riedel, T., Waska, H., Suryaputra, I. G. N. A., Schnetger, B., et al. (2014). Biogeochemistry of dissolved organic matter in an anoxic intertidal creek bank. Geochim. Cosmochim. Acta 140, 418–434. doi: 10.1016/j.gca.2014.05.038
Seidel, M., Yager, P. L., Ward, N. D., Carpenter, E. J., Gomes, H. R., Krusche, A. V., et al. (2015). Molecular-level changes of dissolved organic matter along the Amazon River-to-ocean continuum. Mar. Chem. doi: 10.1016/j.marchem.2015.06.019
Stenson, A. C., Marshall, A. G., and Cooper, W. T. (2003). Exact masses and chemical formulas of individual suwannee river fulvic acids from ultrahigh resolution electrospray ionization fourier transform ion cyclotron resonance mass spectra. Anal. Chem. 75, 1275–1284. doi: 10.1021/ac026106p
Stenström, K. E., Skog, G., Georgiadou, E., Genberg, J., and Johansson, A. (2011). A Guide to Radiocarbon Units and Calculations. LUNFD6(NFFR-3111)/1- 17/(2011), Lund University, Nuclear Physics. Available online at: http://lup.lub.lu.se/record/2173656
Stuart-Smith, R. D., Bates, A. E., Lefcheck, J. S., Duffy, J. E., Baker, S. C., Thomson, R. J., et al. (2013). Integrating abundance and functional traits reveals new global hotspots of fish diversity. Nature 501, 539–542. doi: 10.1038/nature12529
Stubbins, A., and Dittmar, T. (2015). Illuminating the deep: molecular signatures of photochemical alteration of dissolved organic matter from North Atlantic Deep Water. Mar. Chem. 177, 318–324. doi: 10.1016/j.marchem.2015.06.020
Sun, L., Perdue, E. M., Meyer, J. L., and Weis, J. (1997). Use of elemental composition to predict bioavailability of dissolved organic matter in a Georgia river. Limnol. Oceanogr. 42, 714–721. doi: 10.4319/lo.1997.42.4.0714
Talley, L. D., Pickard, G. L., Emery, W. J., and Swift, J. H. (2011). Descriptive Physical Oceanography: An Introduction. Boston, MA: Academic Press.
Tuomisto, H. (2012). An updated consumer's guide to evenness and related indices. Oikos 121, 1203–1218. doi: 10.1111/j.1600-0706.2011.19897.x
Urban, P. L., Chen, Y.-C., and Wang, Y.-S. (2016). “Data treatment in time-resolved mass spectrometry,” in Time-Resolved Mass Spectrometry: From Concept to Applications (Chichester: John Wiley & Sons, Ltd.), 231–248.
Villéger, S., Mason, N. W. H., and Mouillot, D. (2008). New multidimensional functional diversity indices for a multifaceted framework in functional ecology. Ecology 89, 2290–2301. doi: 10.1890/07-1206.1
Walker, B. D., Beaupré, S. R., Guilderson, T. P., McCarthy, M. D., and Druffel, E. R. M. (2016). Pacific carbon cycling constrained by organic matter size, age and composition relationships. Nat. Geosci. 9, 888–891. doi: 10.1038/ngeo2830
Washington, H. G. (1984). Diversity, biotic and similarity indices: a review with special relevance to aquatic ecosystems. Water Res. 18, 653–694. doi: 10.1016/0043-1354(84)90164-7
Keywords: dissolved organic matter, DOM, chemodiversity, functional diversity, diversity quantification, spatial distribution, aging, FT-ICR-MS
Citation: Mentges A, Feenders C, Seibt M, Blasius B and Dittmar T (2017) Functional Molecular Diversity of Marine Dissolved Organic Matter Is Reduced during Degradation. Front. Mar. Sci. 4:194. doi: 10.3389/fmars.2017.00194
Received: 22 March 2017; Accepted: 08 June 2017;
Published: 30 June 2017.
Edited by:
Christian Lønborg, Australian Institute of Marine Science, AustraliaReviewed by:
Valentina Amaral, University of Cádiz, SpainMaria Ll. Calleja, King Abdullah University of Science and Technology, Saudi Arabia
Copyright © 2017 Mentges, Feenders, Seibt, Blasius and Dittmar. This is an open-access article distributed under the terms of the Creative Commons Attribution License (CC BY). The use, distribution or reproduction in other forums is permitted, provided the original author(s) or licensor are credited and that the original publication in this journal is cited, in accordance with accepted academic practice. No use, distribution or reproduction is permitted which does not comply with these terms.
*Correspondence: Andrea Mentges, andrea.mentges@uol.de