Heterotrophic Extracellular Enzymatic Activities in the Atlantic Ocean Follow Patterns Across Spatial and Depth Regimes
 Adrienne Hoarfrost
 Carol Arnosti
- Department of Marine Sciences, University of North Carolina at Chapel Hill, Chapel Hill, NC, United States
Heterotrophic microbial communities use extracellular enzymes to initialize degradation of high molecular weight organic matter in the ocean. The potential of microbial communities to access organic matter, and the resultant rates of hydrolysis, affect the efficiency of the biological pump as well as the rate and location of organic carbon cycling in surface and deep waters. In order to investigate spatial- and depth-related patterns in microbial enzymatic capacities in the ocean, we measured hydrolysis rates of six high-molecular-weight polysaccharides and two low-molecular-weight substrate proxies at sites spanning 38°S to 10°N in the Atlantic Ocean, and at six depths ranging from surface to bottom water. In surface to upper mesopelagic waters, the spectrum of substrates hydrolyzed followed distinct patterns, with hydrolytic assemblages more similar vertically within a single station than at similar depths across multiple stations. Additionally, the proportion of total hydrolysis occurring above the pycnocline, and the spectrum of substrates hydrolyzed in mesopelagic and deep waters, was positively related to the strength of stratification at a site, while other physichochemical parameters were generally poor predictors of the measured hydrolysis rates. Spatial as well as depth-driven constraints on heterotrophic hydrolytic capacities result in broad variations in potential carbon-degrading activity in the ocean. The spectrum of enzymatic capabilities and rates of hydrolysis in the ocean, and the proportion of organic carbon hydrolyzed above the permanent thermocline, may influence the efficiency of the biological pump and net carbon export across distinct latitudinal and depth regions.
Introduction
Microbial communities are major drivers of organic carbon cycling in the ocean. The carbon cycling capacities of these communities ultimately affect the inventories of oxygen and CO2 in the atmosphere, the magnitude and composition of organic carbon export from the surface to the deep ocean, and resource availability to higher trophic levels (Azam and Malfatti, 2007; Jiao et al., 2010). Although 99.9% of autochthonous organic carbon is remineralized before it reaches sediments, a large standing pool of dissolved organic carbon (DOC) persists in the water column (Hedges, 1992), demonstrating that some fraction of marine organic carbon is not readily amenable to microbial degradation. The microbial enzymatic capacities to access organic carbon is a potentially important driver shaping the ocean carbon reservoir, but the factors that determine whether and how much organic matter is remineralized are poorly understood (Arnosti, 2011). Biogeographical patterns in microbial communities and their enzymatic capacities (Arnosti et al., 2012; Gomez-Pereira et al., 2012; Sunagawa et al., 2015), and their net effect on organic carbon transformations in the ocean, may in turn be shaped by a poorly constrained set of factors (Hanson et al., 2012).
The enzymatic capacity of a microbial community is a critical determinant of the breadth of organic compounds which may be recycled. Most organic carbon is biosynthesized as high molecular weight compounds, which are typically hydrolyzed by both endo-acting (mid-chain cleaving) and exo-acting enzymes (Warren, 1996). In order for heterotrophs to access natural organic matter, they must produce the appropriate enzymes to hydrolyze a particular substrate into sizes small enough to be transported into the cell. These enzymes have highly targeted structural specificities and are very diverse (Aspeborg et al., 2012; Teeling et al., 2012), reflecting both the complexity of natural organic matter and of the microbial communities that access it.
Differences in microbial enzymatic capacities thus may result in functional biogeographical patterns in carbon export and recycling. Field studies measuring activities of extracellular enzymes that degrade organic carbon have demonstrated that the types of substrates hydrolyzed and their rates of hydrolysis vary along latitudinal gradients (Arnosti et al., 2011, 2012), a pattern that parallels biogeographical patterns in microbial community composition (Fuhrman et al., 2008). Beyond community composition, the genetic capacity to hydrolyze individual substrates may also follow biogeographical patterns. Although, most of the enzymes involved in the extracellular breakdown of organic carbon have not yet been annotated, a targeted study of the biogeography of enzymes in glycosyl hydrolase family 5 revealed wide diversity and variation in relative abundance across the North Atlantic (Elifantz et al., 2008). Genetic distributions of polysaccharide-degrading enzymes in common heterotrophic marine microbial clades also vary considerably across oceanic provinces (Gomez-Pereira et al., 2012), as do the activities of polysaccharide hydrolyzing enzymes (Arnosti et al., 2012).
Organic carbon cycling capabilities are thus heterogeneously distributed across both microbial phylogenies (Zimmerman et al., 2013) and the natural environment. In order to examine latitudinal and depth-related patterns in hydrolytic capabilities of heterotrophic microbial communities, we measured extracellular enzyme activities across a broad range of latitude and depth, identified geospatial patterns in those activities, and investigated potential environmental factors affecting heterotrophic enzymatic activity. The hydrolysis of six high-molecular-weight and two low-molecular-weight organic substrates was measured across 48 degrees of latitude and from surface to bottom waters in the South and Equatorial Atlantic Ocean. These data enable us to explore the connectivity of hydrolytic capacities between stations and depths, and the relationship of hydrolysis rates to stratification and physicochemical parameters. These factors may shape biogeographical patterns in heterotrophy, and ultimately affect the location and magnitude of organic carbon remineralization, and thus carbon sequestration, by the biological pump.
Methods
Seawater Sampling
Seawater was collected via Niskin rosette equipped with a conductivity-temperature-depth sensor (CTD) at nine stations spanning 38°S to 10°N in the subtropical to equatorial Atlantic Ocean (Figure 1). Hydrolysis rates of polysaccharides and of monomeric substrates were measured at 6 stations, ranging from 38°S to 3.5°N; only activities of monomeric substrates could be measured at the northernmost three stations due to lack of time for extended substrate incubations.
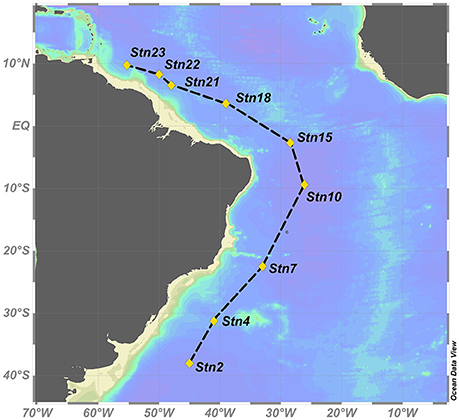
Figure 1. Map of DeepDOM cruise track from 38S to 9N in the South Atlantic. Figure made in Ocean Data View Schlitzer, 2015.
At each station (stations 2, 4, 7, 10, 15, 18, 21, 22, and 23; part of the DeepDOM cruise, Kujawinski, 2013), seawater was collected from six depths: surface (SuW, 5 m), deep chlorophyll maximum (DCM, ~50–100 m), mesopelagic (meso, 250 m), Antarctic Intermediate Water (AAIW, ~750–850 m), North Atlantic Deep Water (NADW, 2,500 m), and bottom water (bot, ~3,700–4,600 m). Specific depths of DCM, AAIW, and bottom water were chosen according to a maximum in fluorescence (DCM), a minimum in salinity and peak in oxygen (AAIW), and a few meters above bottom (bot), respectively (Supplementary Figure 1), and thus varied by station.
At each depth, 1 L glass Duran bottles were rinsed three times with seawater from the corresponding depth, then filled without using tubing from a single Niskin bottle. 200 mL of seawater from each depth was autoclaved in a separate glass Duran bottle for use in killed control incubations.
Physical and Chemical Parameters
Temperature, salinity, oxygen, and fluorescence were measured via CTD (Supplementary Figure 1), and used to calculate potential temperature (θ), potential density (σθ), and buoyancy frequency (N2) (Supplementary Figure 2). CTD data for every cast throughout the cruise, and nutrient data collected from discrete depths and analyzed by K. Longnecker, are available through the BCO-DMO database (Supplementary Figure 1, Kujawinski, 2013). CTD and nutrient data used for analysis in this study are provided through the associated BCO-DMO repository (Hoarfrost and Arnosti, 2016), and can be reproduced using scripts provided at the associated Github repository (Hoarfrost, 2016).
α-Glucosidase and Leucine Aminopeptidase Activities
Two substrate proxies, α- glucose linked to 4-methylumbelliferone (α-Glu; Chem Impex 21676) and leucine linked to 4-methylcoumarinyl-7-amide (L-MCA; Sigma 62480-44-8), were used to measure the activities of α-glucosidase and leucine aminopeptidase, respectively, after the method of Hoppe (1983). The enzymes hydrolyzing these substrates act on the α-1 → 4-linked terminal glucose of oligo- and polysaccharides, and N-terminal leucine residues of peptides or proteins, respectively. Recent work has demonstrated that L-MCA can also be hydrolyzed by enzymes other than leucine aminopeptidase (Steen et al., 2015), but this widely-used method still provides a measure of peptidase activity in the environment. For each substrate, triplicate aliquots of 4mL of live seawater and one autoclaved seawater killed control were incubated in plastic cuvettes at as close to in situ temperature as possible. Available incubation temperatures were 3, 12, 15, 18, 25, and 28°C. Two cuvettes with 4 mL of live or autoclaved seawater and no added substrate served as live and killed blank incubations, respectively.
Saturating concentrations were determined at each station via a saturation curve conducted over 24 h using surface water, testing increasing concentrations of substrate. The saturating concentration was identified as the concentration of substrate at which addition of higher concentrations of substrate does not induce higher rates of activity. Since enzymatic activity is typically highest in surface or near-surface waters (e.g., Baltar et al., 2009; Steen et al., 2012), and leucine aminopeptidase activity is typically higher than α-glucosidase activity (Baltar et al., 2010, 2013), saturation concentrations determined for leucine-MCA in surface waters were used for all depths and substrates at each station. Substrates were added at saturating concentrations 100 μM at stations 2, 4, and 7; 75 μM at stations 10, 15, 18, 22, and 23; and 50 μM at station 21.
Incubations were sampled at four timepoints, and fluorescence was measured in a Turner Biosystems spectrophotometer (TBS-380). Later timepoints were chosen based on the rate of activity at earlier timepoints. A typical timecourse for a rapidly-hydrolyzed substrate was 6, 12, and 24 h; for a low- to no-hydrolysis substrate, 24, 48, and 72 h. No incubation was sampled later than 72 h. All incubations were sampled at 24 h to provide a common timepoint reference.
Rates reported here are maximum hydrolysis rates, typically at T3 for α-glucosidase and at T1 for leucine aminopeptidase. T3 for α-glucosidase was typically sampled at 36–48 h in shallow, more active waters, or 60–72 h in deeper, less active waters. T1 for leucine aminopeptidase was typically sampled at 4–6 h in shallow waters, or 24 h in deeper waters. α-glucosidase activities sampled at later timepoints may include a growth response, whereas the shorter timecourse of leucine aminopeptidase incubations likely does not include a growth response. In all cases, rates represent potential hydrolysis rates, since added substrate competes with naturally-occurring substrate for enzyme active sites.
Polysaccharide Hydrolysis Measurements
Activities of extracellular enzymes that hydrolyze six different fluorescently labeled polysaccharides were measured at all six depths between 38°S and 3.5°N. These substrates—arabinogalactan, chondroitin sulfate, fucoidan, laminarin, pullulan, and xylan—were chosen for their diverse monosaccharide compositions and macromolecular structures. All of these polysaccharides are found in marine environments, and/or enzymes and genes corresponding to their hydrolysis have been identified in marine prokaryotes (e.g., Alderkamp et al., 2007; Wegner et al., 2013; Xing et al., 2015). Furthermore, the activities of enzymes hydrolyzing these substrates have been detected in a wide variety of marine environments (e.g., Arnosti, 2008; Arnosti et al., 2009, 2011).
Fluorescently-labeled polysaccharides were prepared after the method of Arnosti (1996, 2003). Each polysaccharide was incubated in triplicate live incubations in 17 mL sterilized glass vials, and one killed control incubation using autoclaved seawater. In addition, incubations without substrate with live seawater and autoclaved seawater were used as live and killed blank controls, respectively. Seawater was sterilized for 20 min in an autoclave upon recovery and incubations initiated after autoclaved water had cooled in an ice bath. Substrate was added at concentrations sufficient to detect fluorescence of the substrate, at 3.5 μM monomer-equivalent concentrations in all cases, except for fucoidan, which was added at a concentration of 5 μM due to its lower fluorescence intensity. Substrate addition is kept to the lowest concentration that is technically feasible in order to minimize growth responses due to added substrate. All samples were incubated at as close to in situ temperature as possible.
Each incubation was sampled at four timepoints: 0, 5, 12, and 21 days. Kill and live blank controls were sampled at T0 and Tfinal only. Due to time constraints, at Station 15 the final timepoint was taken at day 20 instead of 21, and at Station 18 only three timepoints were collected, at 0, 5, and 12 days. At each timepoint, ~1.8 mL was withdrawn from each incubation, filtered through a 0.2 μm pore-size syringe filter and stored at −20°C until analysis.
Enzyme activity was measured by tracking hydrolysis of the high-molecular-weight substrate into lower-molecular-weight hydrolysis products over time, as determined using gel permeation chromatography with fluorescence detection (Arnosti, 1996, 2003). Hydrolysis rates were calculated from these shifts in molecular size distribution over time from the size-separated chromatograms using the scripts hosted at the associated Github repository (Hoarfrost, 2016). Chromatograms were manually curated after processing to verify chromatographic changes and to identify incubations with zero activity or non-hydrolytic fluorescence of the free fluorophore label, which can produce artificially high hydrolysis rates. Those incubation sets were tagged and their calculated rates adjusted by setting the activity to zero, or recalculating the rate while neglecting the free fluorophore portion of the chromatogram, respectively.
Statistical Analyses
Polysaccharide Hydrolytic Diversity Using Shannon Diversity Indices
Shannon indices, which reflect both the number of substrates hydrolyzed as well as the evenness of hydrolysis rates, were used to calculate hydrolytic diversity at all sites (Steen et al., 2010). The Shannon index is expressed as , where n is the total number of substrates and pi is the hydrolysis rate of the ith substrate normalized to the summed hydrolysis rate of all substrates at that site. H is equal to zero when only one substrate is hydrolyzed, and is maximal at 1.79 when all six substrates are hydrolyzed at equal rates.
Hydrolytic Compositional Dissimilarity among Sampling Sites Using Bray-Curtis Dissimilarity
The Bray-Curtis Dissimilarity, BC, is used to describe the compositional dissimilarity between two sites (Bray and Curtis, 1957). As applied here, “composition” is defined as the hydrolytic composition, or the assemblage of substrates hydrolyzed and their relative rates of hydrolysis. BC is a unitless index between 0 and 1, with a minimum of 0 when the two sites have exactly the same composition (e.g., all the same substrates are hydrolyzed at the same rate), and a maximum of 1 when none of the same substrates are hydrolyzed at the two sites. The pairwise BC dissimilarity matrix was calculated between every site with every other site.
The Bray-Curtis Dissimilarity between two sites i and j is calculated as , where Cij is the sum of the lesser hydrolysis rates for only those substrates that were hydrolyzed at both sites i and j, and Si and Sj are the total hydrolysis rates at site i and site j respectively.
Multiple Regression Analysis of Environmental Parameters vs. Hydrolytic Activity
Multivariate linear regression models between polysaccharide hydrolysis rates and up to ten environmental parameters—in situ potential temperature, incubation temperature, salinity, oxygen, chlorophyll a, buoyancy frequency, phosphate, total nitrogen, DOC, and silicate—were generated. By testing several permutations of models considering different combinations of environmental parameters, the best fit multiple regression model was selected by manually maximizing correlation coefficient values (Supplementary Table 1).
Reproducibility
The scripts to process the GPC chromatograms and calculate rates, manipulate physicochemical data, perform statistical analyses, and generate the figures in this paper were all written in the R programming language (R Core Team, 2014), and can be reproduced using the scripts hosted at the associated Github repository (Hoarfrost, 2016). The raw data is hosted on BCO-DMO (Hoarfrost and Arnosti, 2016), and instructions to download raw data and run scripts can also be found in the Readme for the Github repository.
Results
Physical Context and Water Masses
The transect covered a broad range of latitude and physicochemical conditions, as well as several distinct water masses (Supplementary Figures 1, 3). Antarctic Intermediate Water (AAIW) flowing south to north was detectable as a minimum in salinity at ca. 750–850 m depth throughout the transect. North Atlantic Deep Water (NADW) flowing north to south was identified as a maximum in oxygen between ca. 1500–4,000 m water depth. A large circulation-driven oxygen minimum zone encompassed stations 10–23. At the southernmost station sampled, station 2, the influence of Antarctic circulation was still apparent, with circumpolar deep waters bounding NADW above and below, and Antarctic Bottom Water (AABW, detectable as a temperature minimum) in the bottom water sample (Supplementary Figures 1, 3). At the northernmost station (station 23), the Amazon River plume was sampled in surface waters, detectable by a sharp halocline. The strength of the pycnocline generally increased from south to north, such that the southernmost stations were less stratified than the northernmost stations (Supplementary Figures 2, 4). A south to north gradient in chlorophyll a concentrations was also evident at the deep chlorophyll maximum, which increased from ca. 0.242 mg m−3 at station 2 to over 1 mg m−3 at station 15 (Kujawinski, 2013). DOC concentrations ranged from ca. 70–82 μM in surface, ca. 62–77 μM in DCM, and ca. 47–58 μM in mesopelagic depths, and did not directly track chlorophyll a concentrations (Kujawinski, 2013).
Polysaccharide Hydrolysis Rates and Patterns
Polysaccharide hydrolysis rates and patterns varied across depths as well as stations, as evident for individual substrates (Figure 2), by the summed hydrolysis rates (Supplementary Figure 5), and by the diversity of substrates hydrolyzed at a given depth (Figure 3). Some polysaccharides—such as laminarin—were hydrolyzed at nearly every station and depth, whereas fucoidan was not measurably hydrolyzed at any site, and arabinogalactan was hydrolyzed only in surface waters of station 15. Chondroitin, pullulan, and xylan were hydrolyzed only at particular stations and depths: chondroitin was the only substrate other than laminarin hydrolyzed below 250 m, but at some stations it was not hydrolyzed at any depths. Pullulan was hydrolyzed only above the pycnocline, while xylan was also hydrolyzed in shallow waters but only at some stations (Figure 2).
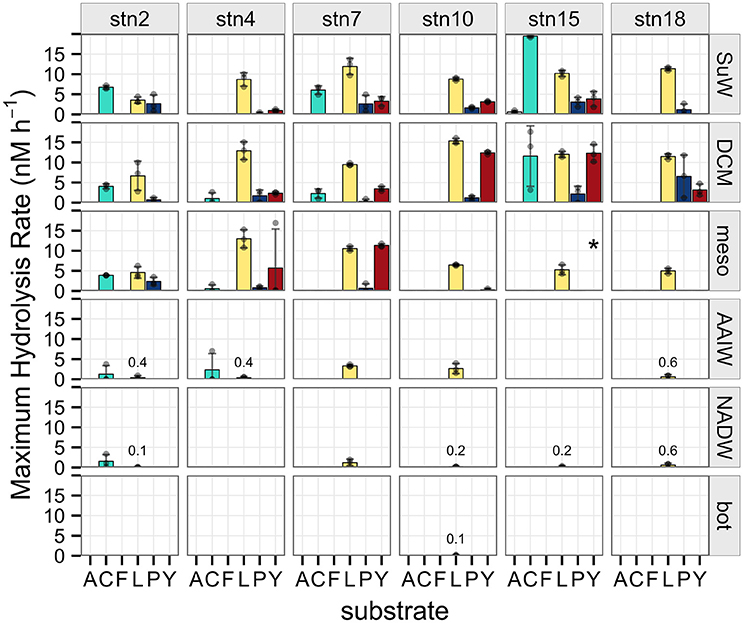
Figure 2. Maximum potential hydrolysis rate (nM h−1) of the six polysaccharide substrates arabinogalactan (A), chondroitin sulfate (C), fucoidan (F), laminarin (L), pullulan (P), and xylan (Y) at each station (vertical panels) and each depth (horizontal panels). Error bars indicate standard deviation of experimental triplicates. Missing data at stn 15, mesopelagic depth for the xylan substrate indicated by asterisk. Low, non-zero hydrolysis rates in deep waters indicated by numbers in the figure panel.
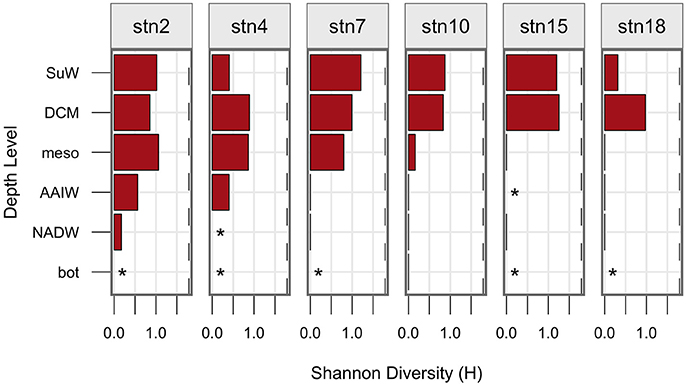
Figure 3. Shannon diversity, H, at each station (vertical panels) and each depth surface to bottom (y axis). A shannon diversiy of zero is indicated by a straight line, whereas asterisks indicate H was not calculated due to no detectable hydrolysis at that site. The maximum possible value of H, 1.79, is shown as a dashed line.
Hydrolysis rates (Figure 2) and summed hydrolysis rates (Supplementary Figure 5) decreased with depth. This decrease was more abrupt and occurred at shallower depths at more stratified stations, with most hydrolytic activity occurring in the surface and DCM depths. At less stratified stations (where maximum buoyancy frequency in the water column was lower), hydrolytic activities decreased more gradually with depth (Figure 2), and a greater proportion of summed activity occurred below the pycnocline (Figure 4, R2 = 0.66, P = 0.048).
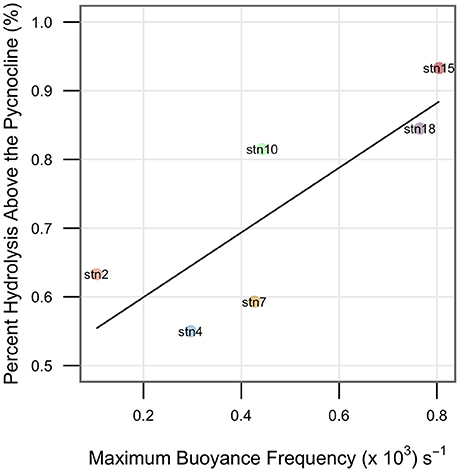
Figure 4. Percent of hydrolysis occurring above the pycnocline at each station is positively correlated with the maximum buoyancy frequency at that station. R2 = 0.66, P = 0.048.
The transect covered a gradient in water column productivity (as represented by chlorophyll a fluorescence) and in water column stratification. At the more northerly stations where stratification was stronger and chlorophyll a concentrations were higher, the highest hydrolytic diversity and rates of enzymatic activity were measured. Additionally, the depth at which the highest hydrolysis rate was observed at a particular station was at shallower depths at northerly, more stratified stations than at southerly, less stratified stations (Figure 4, Figure 2, Supplementary Figure 5).
Hydrolytic diversity also decreased with depth from shallow to deeper waters (Figure 3), and sites with higher overall rates of activity also had higher hydrolytic diversity (Supplementary Figure 6). Maximum hydrolytic diversity was typically measured at the surface or DCM, although station 2 exhibited highest hydrolytic diversity at mesopelagic depths, probably because the same assemblage of substrates was hydrolyzed at surface, DCM, and mesopelagic depths at station 2, but with different degrees of evenness.
In the upper 250 m of the water column, the assemblage of polysaccharide substrates hydrolyzed at a given station followed distinct patterns. Comparing Bray-Curtis dissimilarities among surface, DCM, and mesopelagic depths for each station, hydrolytic assemblages clustered strongly when grouped by station (Figure 5A, PERMANOVA P = 0.007). This result contrasted with grouping by depth sampled, which did not produce any distinguishable effect on Bray-Curtis distances between assemblages (Figure 5B, PERMANOVA P = 0.399). A similar analysis could not be done for the full depth range due to the lack of any detectable hydrolytic activity at many of the deeper depths.
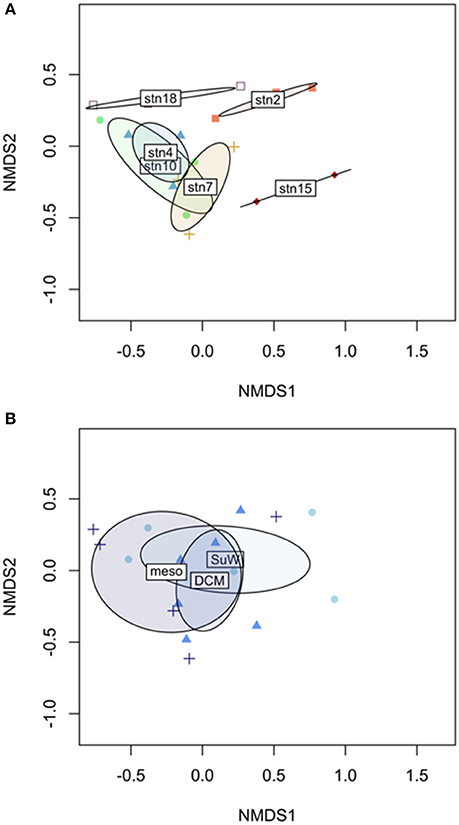
Figure 5. Non-metric multidimensional scaling (NMDS) representation of Bray-Curtis dissimilarities of hydrolytic compositions among sampling sites in the upper 250 m of the water column. Sites grouped by (A) station show significant hydrolytic compositional differences distinct from other stations (PERMANOVA P = 0.007), whereas the hydrolytic composition of sites grouped by (B) depth are not significantly different (PERMANOVA P = 0.399).
Monomeric Substrate Hydrolysis Rates
Hydrolysis rates of monomeric substrates also varied by station, with maximal activity at the surface or DCM, and decreasing activity with depth (Figure 6), with the exception of a single replicate for α-glucose at station 7 where high activity was observed at mesopelagic depths. Depth-related decreases in α-glucosidase and leucine aminopeptidase activities, unlike the polysaccharide hydrolase activities, did not correspond to the degree of water column stratification. Below 250 m, α-glucosidase activity was undetectable at all sites even after 72 h of incubation, whereas leucine activities were very low in deep water, but nonzero.
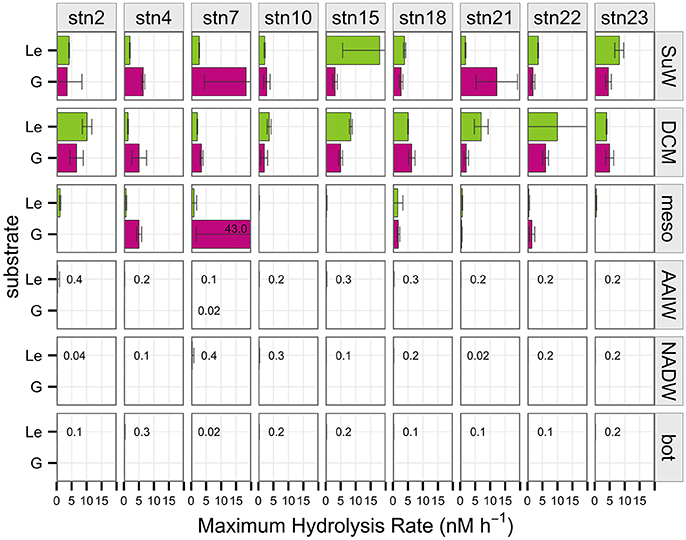
Figure 6. Maximum potential hydrolysis rate (nM h−1) of the monomeric substrates leucine (Le) and α-glucose (G) at each station (vertical panels) and depth (horizontal panels). Error bars indicate standard deviation of experimental triplicates. A particularly high hydrolysis rate of α-glucose at stn 7, mesopelagic depth indicated by the number in the panel. Low, non-zero hydrolysis rates in deep waters indicated by numbers in the figure panel.
Relationship between Polysaccharide Hydrolysis and Environmental Parameters
The strength of the relationship between polysaccharide hydrolysis rates and up to 10 environmental parameters was investigated by fitting the multiple regression model that maximized R2-values (Supplementary Table 1). Overall, environmental parameters poorly explained the observed variation in hydrolysis rates (R2 = 0.22). Since many of these parameters co-correlate with each other, one or two of these parameters generally explained as much or nearly as much of the variation in hydrolysis rates as all ten environmental variables. Temperature and chlorophyll a accounted for most of the relationship in the overall model (R2 = 0.19), while the inclusion of the additional eight environmental variables only slightly improved the model (R2 = 0.22). This result is mainly due to the difference in temperature and chlorophyll a in shallow vs. deep waters corresponding with higher rates of hydrolysis in shallower waters, since models using samples from just shallow or just deep water yielded very poor fits. The high frequency of zero hydrolysis rates did not appear to bias the model, however, since models using only non-zero rates yielded similar fits as the overall model (Supplementary Table 1).
When broken down by individual substrate, models were generally better fitted than the model of aggregated hydrolysis rates (Supplementary Table 1). However, the combination of environmental variables that best fit the data differed by substrate: for chondroitin, temperature only; for laminarin, temperature and chlorophyll a; for pullulan, temperature and buoyancy frequency; for xylan, chlorophyll a and salinity. Arabinogalactan and fucoidan were not modeled individually due to the lack of non-zero hydrolysis rates across all sites.
Discussion
Microbial communities rely on extracellular enzymes to hydrolyze high molecular weight organic matter prior to uptake. The structural specificities of the enzymes active at a given site and depth determine which substrates are available for further metabolism, while relative rates of hydrolysis reflect the potential speed of substrate processing. Site- and depth-related differences in hydrolysis rates and capacities imply differential remineralization of organic matter across latitude and depth in the ocean. The overall patterns of enzyme activities observed along this transect—spatial differences in hydrolytic diversity in surface waters and a decrease in the spectrum of polysaccharides hydrolyzed with depth—are consistent with studies of surface waters from other parts of the world's oceans (e.g., Arnosti et al., 2011), and add considerably to the very few other depth profiles of polysaccharide hydrolase activities in the ocean (Steen et al., 2012; D'Ambrosio et al., 2014).
Distinct functional assemblages characterized individual stations along the latitudinal gradient, such that the diversity of substrates hydrolyzed was more similar from surface to mesopelagic depths at a single station than at similar depth levels across different stations (Figure 5). These spatial and depth-related patterns in hydrolytic diversity, hydrolysis rate, and functional similarity together suggest that the vertical transfer of enzymatic capabilities through the upper depths of the water column—whether through cells, cellular material, or active enzymes—influences the hydrolytic signature of a station, but that this vertical transfer may be more limited at more stratified stations.
Patterns in hydrolytic assemblages among deeper water masses remain to be investigated, since activities were low or not measurable over the timescale of incubation at many of the deeper depths. A lack of measurable polysaccharide hydrolysis at deep sites may indicate that the heterotrophic community had no capacity to detect or to hydrolyze the substrates tested, or that the 21-day incubation timescale was insufficient to measure hydrolysis. In particular, low hydrolytic activities, or activities that require the growth of potentially slow-growing and/or rare members of the microbial community might not be detectable over a 21-day time course (Arnosti, 2008), since a sufficient fraction of the total added polysaccharide pool must be hydrolyzed to detect activity. The observation that leucine aminopeptidase was hydrolyzed—albeit at low rates—in bottom waters at almost all stations, however, demonstrates that an active heterotrophic community was present at these depths.
Measurable hydrolysis of leucine-MCA and MUF-α-glucose in deep waters has also been reported at other sites in the South and Equatorial Atlantic Ocean (Baltar et al., 2009, 2010, 2013). The leucine-aminopeptidase activities of 1–4 nM h−1 reported by Baltar and colleagues in deep water are considerably higher than the 0–0.35 nM h−1 in the present study, although the range of leucine-aminopeptidase activities measured in surface waters are similar between this study and previous studies (Baltar et al., 2009, 2010, 2013). The range of α-glucosidase activities measured in the present study in surface water (0–20 nM h−1) are much greater than reported in previous studies (~0–0.25 nM h−1), perhaps because of a growth response during the extended timecourse of our incubations (maximum of 72 h, vs. maximum of 48 h in Baltar et al., 2009, 2010, 2013). No α-glucosidase activity was detected at any depths below 250 m in this study, even after 72 h incubation, whereas previous investigations measured low but non-zero α-glucose hydrolysis rates in deep water (~0–0.8 nM/h, Baltar et al., 2009, 2010, 2013). For both leucine aminopeptidase and α-glucosidase activities, the subtraction of killed control fluorescence from live incubation fluorescence may have contributed to the lower rates measured in deep water in our experiments.
Multiple factors may contribute to the patterns of enzyme activities we measured. Environmental parameters alone are not likely to be the principal drivers for these patterns: the environmental variables measured at these stations poorly predicted observed rates, in univariate as well as multivariate models (Supplementary Table 1). While the specific environmental variable(s) that best fit each model varied by individual substrate (Supplementary Table 1), a causal explanation for the correlation strengths between hydrolysis rates of individual substrates and specific environmental factors is not obvious in most cases.
Instead, the patterns of enzymatic activities observed along this transect may be tied to the biogeography of the underlying microbial communities (Rusch et al., 2007; Fuhrman et al., 2008; Zinger et al., 2011; Sunagawa et al., 2015) and their functional capacities (DeLong et al., 2006; Shi et al., 2011). For example, the capacity to produce three extracellular enzymes (alkaline phosphatase, chitinase, and β-N-acetyl-glucosaminidase) commonly measured in field studies varies on very fine phylogenetic scales across all annotated prokaryotic genomes (Zimmerman et al., 2013). The heterogeneous distribution of heterotrophic genetic capacities among microbial phylogenies, and a varying distribution of these capabilities among surface water and subsurface environments (DeLong et al., 2006; Elifantz et al., 2008; Shi et al., 2011; Gomez-Pereira et al., 2012) results in functional stratification and resource partitioning along depth- and horizontal gradients. Differences in community composition and function are driven by a complex combination of factors that may include organic carbon composition and concentration (McCarren et al., 2010), distribution limitation (Follows et al., 2007; Hellweger et al., 2014), environmental selection (Ladau et al., 2013), or a confluence of interacting factors that defy simple categorization (Hanson et al., 2012).
Irrespective of the underlying factors, the relationship between water column stratification and the fraction of hydrolysis occurring in the shallow surface or DCM relative to deeper mesopelagic waters potentially has implications for the location of nutrient regeneration and for carbon export in the ocean. This point can be illustrated with a simple conceptual box model showing hypothetical DOC generation from particles sinking through the water column at the different stations along the transect (Figure 7). While there are many interacting factors that affect carbon export (De La Rocha and Passow, 2007), for the purposes of this discussion we consider only the degree of stratification and the spatial patterns of hydrolysis measured in this study. Assuming that particles are being hydrolyzed at the summed hydrolysis rates measured at our sites, DOC will be generated from particles during their passage through the water column at a rate related to the depth-integrated hydrolytic capacities at that location and the sinking rate of particles. For the purpose of this conceptual calculation, we assume a constant particle sinking rate of 100 m day−1 and divide the upper water column into three boxes: DCM—centered at the DCM sampling depth for that station and arbitrarily set at a thickness of 50 m; surface–all depths above the DCM; and upper mesopelagic—from below the DCM to 300 m. To estimate carbon remineralization, carbohydrates hydrolyzed from the particulate to the dissolved phase are then converted to DOC generated, assuming 6 C per monosaccharide produced. In this scenario, the total quantity of DOC generated in the upper 300 m of the water column, as well as the depth at which this DOC would be generated, varies greatly along the transect (Figure 7). At the productive and more strongly stratified station 15 (2.7°S), for example, most of the DOC would be generated in the surface and DCM, and labile DOC would likely quickly be respired to CO2 which would remain in the surface ocean. The highest overall quantity of DOC, however, would be produced at station 7 (22.5°S), where more than half of the total generated DOC would be in the mesopelagic zone, and thus below the permanent thermocline. Labile DOC that is respired to CO2 would likely remain below the thermocline, and would not exchange with surface waters or with the atmosphere on short timescales (Kheshgi, 2004).
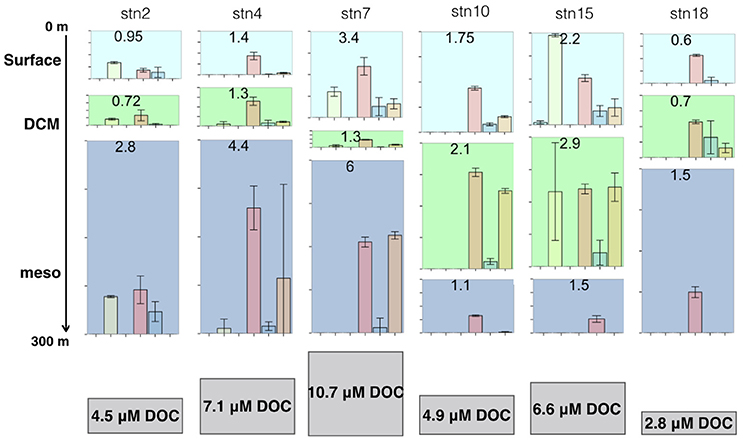
Figure 7. Conceptual model of DOC generation under varying hydrolytic capacities and rates observed in this study, at each station from southernmost to northernmost (vertical panels). The amount of DOC generated, in μM, at the surface (top), DCM (middle), and mesopelagic (bottom) is shown at the top of each panel, and varies according to the relative hydrolytic capacities and rates, and the degree of stratification at that site. The total amount of DOC generated throughout the upper water column is shown below each station, and varies by station.
The efficiency with which the biological pump removes surface-derived carbon from the upper ocean thus depends in part on the quantity of carbon remineralized from a sinking particle while it is still above the permanent thermocline (De La Rocha and Passow, 2007). This calculation in turn depends on the relative lability of the organic carbon in the sinking particles (Engel et al., 2009), the hydrolytic capacities of the microbial communities acting on them as they sink, the extent of water column stratification, and the residence time of the particle at different depths (Prairie et al., 2015). Holding all other factors constant, the biological pump would be more efficient at less stratified stations—such as stations 2, 4, and 7—where a larger proportion of the hydrolytic capacity occurs in the mesopelagic zone, below the permanent thermocline (Figure 7).
Biogeographical patterns in carbon cycling activities, and their relationship to oceanographic features, are of crucial significance to our ability to predict future conditions. For example, if increasing global temperatures result in a more stratified ocean (Capotondi et al., 2012), the quantity of organic matter sequestered by the biological pump below the thermocline may decrease. Such a decrease in turn would place greater influence on the relative hydrolytic capacities of microbial communities in the surface ocean, rather than in deeper waters, in determining the overall efficiency of the biological pump. The effects of an increase in stratification on carbon export will also depend on its impact on the biogeography of microbial communities and hydrolytic activities themselves. Increased stratification may in turn have complex downstream consequences for higher trophic levels that function in both shallow and deep waters, and depend on the availability of particulate organic carbon in both depth regions. Disentangling the roles of environmental characteristics, microbial community composition, functional capacities, and activities in regulating the marine carbon cycle is a prerequisite for a better understanding of the modern ocean, and of its sensitivity to perturbations in the future.
Author Contributions
AH and CA designed experiments. AH conducted field experiments, collected and processed samples, and processed data. AH and CA analyzed results and wrote the manuscript.
Funding
The authors would like to thank Liz Kujawinski for the invitation to join the DeepDOM cruise, and Krista Longnecker for providing nutrient measurements. Funding for this work was provided by the National Science Foundation (OCE-1332881 to CA).
Conflict of Interest Statement
The authors declare that the research was conducted in the absence of any commercial or financial relationships that could be construed as a potential conflict of interest.
Supplementary Material
The Supplementary Material for this article can be found online at: https://www.frontiersin.org/article/10.3389/fmars.2017.00200/full#supplementary-material
References
Alderkamp, A.-C., van Rijssel, M., and Bolhuis, H. (2007). Characterization of marine bacteria and the activity of their enzyme systems involved in degradation of the algal storage glucan laminarin. FEMS Microbiol. Ecol. 59, 108–117. doi: 10.1111/j.1574-6941.2006.00219.x
Arnosti, C. (1996). A new method for measuring polysaccharide hydrolysis rates in marine environments. Org. Geochem. 25, 105–115. doi: 10.1016/S0146-6380(96)00112-X
Arnosti, C. (2003). Fluorescent derivatization of polysaccharides and carbohydrate-containing biopolymers for measurement of enzyme activities in complex media. J. Chromatogr. B Analyt. Technol. Biomed. Life Sci. 793, 181–191. doi: 10.1016/S1570-0232(03)00375-1
Arnosti, C. (2008). Functional differences between Arctic seawater and sedimentary microbial communities: contrasts in microbial hydrolysis of complex substrates. FEMS Microbiol. Ecol. 66, 343–351. doi: 10.1111/j.1574-6941.2008.00587.x
Arnosti, C. (2011). Microbial extracellular enzymes and the marine carbon cycle. Ann. Rev. Mar. Sci. 3, 401–425. doi: 10.1146/annurev-marine-120709-142731
Arnosti, C., Fuchs, B. M., Amann, R., and Passow, U. (2012). Contrasting extracellular enzyme activities of particle-associated bacteria from distinct provinces of the North Atlantic Ocean. Front. Microbiol. 3:425. doi: 10.3389/fmicb.2012.00425
Arnosti, C., Steen, A. D., Ziervogel, K., Ghobrial, S., and Jeffrey, W. H. (2011). Latitudinal gradients in degradation of marine dissolved organic carbon. PLoS ONE 6:e28900. doi: 10.1371/journal.pone.0028900
Arnosti, C., Ziervogel, K., Ocampo, L., and Ghobrial, S. (2009). Enzyme activities in the water column and in shallow permeable sediments from the northeastern Gulf of Mexico. Estuar. Coast. Shelf Sci. 84, 202–208. doi: 10.1016/j.ecss.2009.06.018
Aspeborg, H., Coutinho, P. M., Wang, Y., Brumer, H., and Henrissat, B. (2012). Evolution, substrate specificity and subfamily classification of glycoside hydrolase family 5 (GH5). BMC Evol. Biol. 12:186. doi: 10.1186/1471-2148-12-186
Azam, F., and Malfatti, F. (2007). Microbial structuring of marine ecosystems. Nat. Rev. Microbiol. 5, 782–791. doi: 10.1038/nrmicro1747
Baltar, F., Arístegui, J., Gasol, J. M., Yokokawa, T., and Herndl, G. (2013). Bacterial versus archaeal origin of extracellular enzymatic activity in the Northeast Atlantic deep waters. Microb. Ecol. 65, 277–288. doi: 10.1007/s00248-012-0126-7
Baltar, F., Arístegui, J., Gasol, J., Sintes, E., van Aken, H., and Herndl, G. (2010). High dissolved extracellular enzymatic activity in the deep central Atlantic Ocean. Aquat. Microb. Ecol. 58, 287–302. doi: 10.3354/ame01377
Baltar, F., Arístegui, J., Sintes, E., van Aken, H. M., Gasol, J. M., and Herndl, G. (2009). Prokaryotic extracellular enzymatic activity in relation to biomass production and respiration in the meso- and bathypelagic waters of the (sub)tropical Atlantic. Environ. Microbiol. 11, 1998–2014. doi: 10.1111/j.1462-2920.2009.01922.x
Bray, J. R., and Curtis, J. T. (1957). An Ordination of the upland forest community of southern Wisconsin.pdf. Ecol. Monogr. 27, 325–349. doi: 10.2307/1942268
Capotondi, A., Alexander, M. A., Bond, N. A., Curchitser, E. N., and Scott, J. D. (2012). Enhanced upper ocean stratification with climate change in the CMIP3 models. J. Geophys. Res. 117, C04031. doi: 10.1029/2011JC007409
D'Ambrosio, L., Ziervogel, K., Macgregor, B., Teske, A., and Arnosti, C. (2014). Composition and enzymatic function of particle-associated and free-living bacteria: a coastal/offshore comparison. ISME J. 8, 1–13. doi: 10.1038/ismej.2014.67
De La Rocha, C. L., and Passow, U. (2007). Factors influencing the sinking of POC and the efficiency of the biological carbon pump. Deep Sea Res. 54, 5–7. doi: 10.1016/j.dsr2.2007.01.004
DeLong, E. F., Preston, C. M., Mincer, T., Rich, V., Hallam, S. J., Frigaard, N. U., et al. (2006). Community genomics among stratified microbial assemblages in the ocean's interior. Science 311, 496–503. doi: 10.1126/science.1120250
Elifantz, H. A., Waidner, L., Michelou, V. K., Cottrell, M. T., and Kirchman, D. L. (2008). Diversity and abundance of glycosyl hydrolase family 5 in the North Atlantic Ocean. FEMS Microbiol. Ecol. 63, 316–327. doi: 10.1111/j.1574-6941.2007.00429.x
Engel, A., Abramson, L., Szlosek, J., Liu, Z., Stewart, G., Hirschberg, D., et al. (2009). Investigating the effect of ballasting by CaCO3 in Emiliania huxleyi, II: Decomposition of particulate organic matter. Deep. Res. Part II Top. Stud. Oceanogr. 56, 1408–1419. doi: 10.1016/j.dsr2.2008.11.028
Follows, M. J., Dutkiewicz, S., Grant, S., and Chisholm, S. W. (2007). Emergent biogeography of microbial communities in a model ocean. Science 315, 1843–1846. doi: 10.1126/science.1138544
Fuhrman, J. A., Steele, J. A., Hewson, I., Schwalbach, M. S. V., Brown, M., and Brown, J. H. (2008). A latitudinal diversity gradient in planktonic marine bacteria. Proc. Natl. Acad. Sci. U.S.A. 105, 7774–7778. doi: 10.1073/pnas.0803070105
Gomez-Pereira, P. R., Schuler, B. M., Fuchs, C. M., Bennke, H., Teeling, H., Waldmann, J., et al. (2012). Genomic content of uncultured Bacteroidetes from contrasting oceanic provinces in the North Atlantic Ocean. Environ. Microbiol. 14, 52–66. doi: 10.1111/j.1462-2920.2011.02555.x
Hanson, C. A., Fuhrman, J. A., Horner-Devine, M. C., and Martiny, J. B. H. (2012). Beyond biogeographic patterns: processes shaping the microbial landscape. Nat. Rev. Microbiol. 10, 497–506. doi: 10.1038/nrmicro2795
Hedges, J. (1992). Global biogeochemical cycles: progress and problems. Mar. Chem. 39, 67–93. doi: 10.1016/0304-4203(92)90096-S
Hellweger, F. L., van Sebille, E., and Fredrick, N. D. (2014). Biogeographic patterns in ocean microbes emerge in a neutral agent-based model. Science 345, 1346–1349. doi: 10.1126/science.1254421
Hoarfrost, A. (2016). DeepDOM Github Repository. Available online at: https://github.com/ahoarfrost/DeepDOM
Hoarfrost, A., and Arnosti, C. (2016). Investigating microbial activities driving organic matter transformations in the deep subsurface. Biol. Chem. Oceanogr. Data Manag. Off. Available online at: http://www.bco-dmo.org/project/662055
Hoppe, H. (1983). Significance of exoenzymatic activities in the ecology of brackish water: measurements by means of methylumbelliferyl-substrates. Mar. Ecol. Prog. Ser. 11, 299–308. doi: 10.3354/meps011299
Jiao, N., Herndl, G. J. A., Hansell, D., Benner, R., Kattner, G., Wilhelm, S. W., et al. (2010). Microbial production of recalcitrant dissolved organic matter: long-term carbon storage in the global ocean. Nat. Rev. Microbiol. 8, 593–599. doi: 10.1038/nrmicro2386
Kheshgi, H. S. (2004). Ocean carbon sink duration under stabilization of atmospheric CO 2 : A 1, 000-year timescale. Clim. Dyn. 31, 1–5. doi: 10.1029/2004GL020612
Kujawinski, L. (2013). KN210-04. Biol. Chem. Oceanogr. Data Manag. Off. Available online at: http://www.bco-dmo.org/deployment/59057
Ladau, J., Sharpton, T. J., Finucane, M. M., Jospin, G., Kembel, S. W., O'Dwyer, J., et al. (2013). Global marine bacterial diversity peaks at high latitudes in winter. ISME J. 7, 1669–1677. doi: 10.1038/ismej.2013.37
McCarren, J., Becker, J. W., Repeta, D. J., Shi, Y., Young, C. R., Malmstrom, R., et al. (2010). Microbial community transcriptomes reveal microbes and metabolic pathways associated with dissolved organic matter turnover in the sea. Proc. Natl. Acad. Sci. U.S.A. 107, 16420–16427. doi: 10.1073/pnas.1010732107
Prairie, J. C., Ziervogel, K., Camassa, R., McLaughlin, R. M., White, B. L., Dewald, C., et al. (2015). Delayed settling of marine snow: Effects of density gradient and particle properties and implications for carbon cycling. Mar. Chem. 175, 28–38. doi: 10.1016/j.marchem.2015.04.006
R Core Team (2014). R: A Language and Environment for Statistical Computing. Vienna: R Foundation for Statistical Computing. Available online at: http://www.R-project.org/
Rusch, D. B., Halpern, A. L., Sutton, G., Heidelberg, K. B., Williamson, S., Yooseph, S., et al. (2007). The Sorcerer II global ocean sampling expedition: Northwest Atlantic through eastern tropical Pacific. PLoS Biol. 5:e77. doi: 10.1371/journal.pbio.0050077
Schlitzer, R. (2015). Ocean Data View. Available online at: http://odv.awi.de
Shi, Y., Tyson, G. W., Eppley, J. M., and DeLong, E. F. (2011). Integrated metatranscriptomic and metagenomic analyses of stratified microbial assemblages in the open ocean. ISME J. 5, 999–1013. doi: 10.1038/ismej.2010.189
Steen, A. D., Ziervogel, K., and Arnosti, C. (2010). Comparison of multivariate microbial datasets with the Shannon index: an example using enzyme activity from diverse marine environments. Org. Geochem. 41, 1019–1021. doi: 10.1016/j.orggeochem.2010.05.012
Steen, A. D., Ziervogel, K., Ghobrial, S., and Arnosti, C. (2012). Functional variation among polysaccharide-hydrolyzing microbial communities in the Gulf of Mexico. Mar. Chem. 138–139, 13–20. doi: 10.1016/j.marchem.2012.06.001
Steen, A., Vazin, J., Hagen, S., Mulligan, K., and Wilhelm, S. (2015). Substrate specificity of aquatic extracellular peptidases assessed by competitive inhibition assays using synthetic substrates. Aquat. Microb. Ecol. 75, 271–281. doi: 10.3354/ame01755
Sunagawa, S., Coelho, L. P., Chaffron, S., Kultima, J. R., Labadie, K., Salazar, G., et al. (2015). Structure and function of the global ocean microbiome. Science 348, 1–10. doi: 10.1126/science.1261359
Teeling, H., Fuchs, B. M., Becher, D., Klockow, C., Gardebrecht, A., Bennke, C. M., et al. (2012). Substrate-controlled succession of marine bacterioplankton populations induced by a phytoplankton bloom. Science 336, 608–611. doi: 10.1126/science.1218344
Warren, R. A. (1996). Microbial hydrolysis of polysaccharides. Annu. Rev. Microbiol. 50, 183–212. doi: 10.1146/annurev.micro.50.1.183
Wegner, C.-E., Richter-Heitmann, T., Klindworth, A., Klockow, C., Richter, M., Achstetter, T., et al. (2013). Expression of sulfatases in Rhodopirellula baltica and the diversity of sulfatases in the genus Rhodopirellula. Mar. Genomics 9, 51–61. doi: 10.1016/j.margen.2012.12.001
Xing, P., Hahnke, R. L., Unfried, F., Markert, S., Huang, S., Barbeyron, T., et al. (2015). Niches of two polysaccharide-degrading Polaribacter isolates from the North Sea during a spring diatom bloom. ISME J. 9, 1410–1422. doi: 10.1038/ismej.2014.225
Zimmerman, A. E., Martiny, A. C., and Allison, S. D. (2013). Microdiversity of extracellular enzyme genes among sequenced prokaryotic genomes. ISME J. 7, 1187–1199. doi: 10.1038/ismej.2012.176
Keywords: carbon cycling, extracellular enzymes, heterotrophy, functional biogeography, deep ocean, microbial activity, biogeochemistry
Citation: Hoarfrost A and Arnosti C (2017) Heterotrophic Extracellular Enzymatic Activities in the Atlantic Ocean Follow Patterns Across Spatial and Depth Regimes. Front. Mar. Sci. 4:200. doi: 10.3389/fmars.2017.00200
Received: 12 April 2017; Accepted: 12 June 2017;
Published: 23 June 2017.
Edited by:
Maria Montserrat Sala, Consejo Superior de Investigaciones Científicas(CSIC), SpainReviewed by:
Hila Elifantz, Bar-Ilan University, IsraelZhanfei Liu, University of Texas at Austin, United States
Copyright © 2017 Hoarfrost and Arnosti. This is an open-access article distributed under the terms of the Creative Commons Attribution License (CC BY). The use, distribution or reproduction in other forums is permitted, provided the original author(s) or licensor are credited and that the original publication in this journal is cited, in accordance with accepted academic practice. No use, distribution or reproduction is permitted which does not comply with these terms.
*Correspondence: Adrienne Hoarfrost, adrienne.l.hoarfrost@unc.edu