Patterns of Bacterial and Archaeal Gene Expression through the Lower Amazon River
 Brandon M. Satinsky1†
  Christa B. Smith2
  Shalabh Sharma2
  Nicholas D. Ward3†
  Alex V. Krusche4
  Jeffrey E. Richey3
  Patricia L. Yager2
  Byron C. Crump5
  Mary Ann Moran2*
- 1Department of Microbiology, University of Georgia, Athens, GA, United States
- 2Department of Marine Sciences, University of Georgia, Athens, GA, United States
- 3School of Oceanography, University of Washington, Seattle, WA, United States
- 4Center for Nuclear Energy in Agriculture-USP, Piracicaba, Brazil
- 5College of Earth, Ocean, and Atmospheric Sciences, Oregon State University, Corvallis, OR, United States
Analysis of metatranscriptomic and metagenomic datasets from the lower reaches of the Amazon River between Óbidos and the river mouth revealed microbial transcript and gene pools dominated by Actinobacteria, Thaumarchaeota, Bacteroidetes, Acidobacteria, Betaproteobacteria, and Planctomycetes. Three mainstem stations spanning a 625 km reach had similar gene expression patterns (transcripts gene copy−1) across a diverse suite of element cycling genes, but two tributary-influenced stations at the mouth of the Tapajós River and near the Tocantins River at Belém had distinct transcriptome composition and expression ratios, particularly for genes encoding light-related energy capture (higher) and iron acquisition and ammonia oxidation (lower). Environmental parameters that were useful predictors of gene expression ratios included concentrations of lignin phenols, suspended sediments, nitrate, phosphate, and particulate organic carbon and nitrogen. Similar to the gene expression data, these chemical properties reflected highly homogeneous mainstem stations punctuated by distinct tributary-influenced stations at Tapajós and Belém. Although heterotrophic processes were expected to dominate in the lower Amazon, transcripts from photosynthetic bacteria were abundant in tributary-influenced regions, and transcripts from Thaumarcheota taxa genetically capable of chemosynthetic ammonia oxidation accounted for up to 21% of the transcriptome at others. Based on regressions of transcript numbers against gene numbers, expression ratios of Thaumarchaeota populations were largely unchanged within the mainstem, suggesting a relatively minor role for gene regulation. These quantitative gene and transcript inventories detail a diverse array of energy acquisition strategies and metabolic capabilities for bacteria and archaea populations of the world's largest river system.
Introduction
The Amazon River runs nearly 6,500 km across the South American continent before emptying into the Western Tropical North Atlantic Ocean, and is the largest riverine system based on both volume and watershed area (Coles et al., 2013). The rainforest of the Amazon Basin is responsible for nearly 10% of global primary production (Field et al., 1998), and much of the 8.5 Pg C fixed per year (Malhi et al., 2008) ultimately ends up in the river. The main channel is well mixed and highly turbid, and high levels of CO2 as well as poor light penetration support an environment assumed to be dominated by heterotrophic bacteria. These microbes remove, transform, and stabilize riverine organic matter during transit, with their activities leading to river outgassing of as much as 1,390 Tg C y−1 to the atmosphere (Richey et al., 2002; Sawakuchi et al., 2017)
Within the mainstem of the Amazon, heterotrophic bacteria rely on allochthonous input of carbon and nutrients from the surrounding rainforest and drainage basins. Humic and fulvic acids likely derived from lignin and other terrestrial plant components account for ~60% of riverine dissolved organic carbon (DOC) (Ertel et al., 1986). Recent work suggests that bacterial degradation of these terrestrially-derived organic compounds contributes significantly to river respiration and outgassing (Ward et al., 2013, 2016). In contrast, the clearwater tributaries along the lower river have reduced turbidity and may provide conditions suitable for the growth of photosynthetic microbes (Quay et al., 1995; Gagne-Maynard et al., 2017). In addition to the major roles of bacteria in carbon cycling in the river, these microorganisms also process and cycle nitrogen, phosphorus, sulfur, iron, and other elements.
Evidence of Archaea belonging to the phylum Thaumarchaeota has recently been found in metagenomic libraries of the upper reaches of Amazon River system (Ghai et al., 2011; Santos-Júnior et al., 2017). The presence of amoABC genes in these data (Ghai et al., 2011) raises the question of whether chemoautotrophic ammonia oxidation might also be occurring in the lower Amazon reaches. Other freshwater habitats have been found to host Thaumarchaeota cells in the water column, including lakes and rivers (Urbach et al., 2001; Lehours et al., 2007; Auguet et al., 2011; Liu et al., 2011), where they can account for up to 47% of prokaryotic cells (Callieri et al., 2009). The freshwater region of the Pearl River, another large-river system, has been found to support substantial and diverse Thaumarchaeota lineages based both on 16S rRNA and archaeal amoA gene surveys (Liu et al., 2011, 2014).
There are an estimated 1.2 × 1024 prokaryotic cells in rivers globally, with average cell concentrations typically twice those in seawater (Whitman et al., 1998). Metagenomic- and metatranscriptomic-based gene and transcript inventories in freshwater environments have provided insights into the functions of these microbes (Rusch et al., 2007; Pope and Patel, 2008; Debroas et al., 2009; Ghai et al., 2011; Oh et al., 2011; Vila-Costa et al., 2013; Quaiser et al., 2014; Tsementzi et al., 2014). When normalized with internal standards (Gifford et al., 2011; Satinsky et al., 2013), metagenomic and metatranscriptomic datasets collected in parallel can be used to calculate expression levels for each gene (transcripts gene copy−1). This approach is particularly informative in comparisons of spatially or temporally dynamic environments where shifts in microbial gene regulation shape biogeochemical outcomes (Satinsky et al., 2014a,b).
In this study we present a quantitative assessment of bacterial and archaeal gene expression in the world's largest river ecosystem. Five stations were inventoried within the lower reaches of the Amazon River stretching from Óbidos to the three main discharge channels at Macapá and Belém (~150 km upstream of the river mouth). The river was surveyed during a period of high discharge in May 2011 using both metagenomic and metatranscriptomic methodologies benchmarked with internal standards. The analyses addressed three main questions: (1) Which microbial taxa are the largest contributors to the community transcriptome in the lower Amazon River? (2) What is the level of expression (transcripts gene copy−1) of key biogeochemical genes by the bacterial communities at the five river locations? (3) Does regulation of these biogeochemically-relevant genes change along the course of the lower Amazon River?
Methods
Sample Collection
In May 2011, microbial cells in the free-living (FL; 0.2–2.0 μm) and particle-associated (PA; 2.0–297 μm) size fractions at 5 stations in the lower reaches of the Amazon River system (Figure 1B) were collected by filtration. Duplicate samples of each size fraction were obtained for both metagenomic and metatranscriptomic sequencing. All samples were collected from 50% of river depth by pumping water to the boat's deck using a Shurflo submersible pump fitted with a 297 μm stainless steel screen. Water collected into 20 L carboys was sequentially filtered through a 2.0 μm pore-size, 142 mm diameter polycarbonate (PCTE) membrane filter (Sterlitech Corporation, Kent, CWA) and a 0.22 μm pore-size, 142 mm diameter Supor membrane filter (Pall, Port Washington, NY). Filtration was completed within 30 min of collection for the metatranscriptomic samples. Following filtration all membrane filters were immediately submerged in RNAlater (Applied Biosystems, Austin, TX) in sterile 15 mL conical tubes and stored at 4°C until returned to shore, at which point the samples were frozen at −20°C until processing. Additional details are given in the announcement of the public release of this dataset (Satinsky et al., 2015).
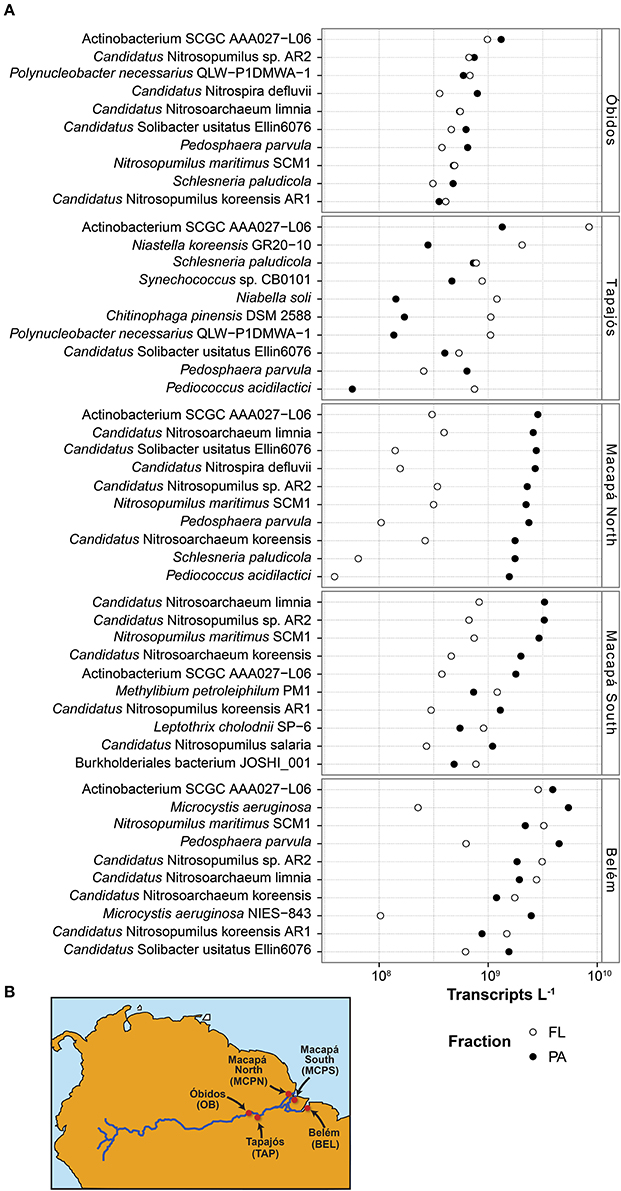
Figure 1. (A) Transcript inventories (transcripts L−1) for the ten most transcriptionally abundant bacterial and archaeal taxonomic bins at five river stations in May 2011. Circle fill indicates the microenvironment (free-living, open; particle-associated, closed). (B) Station locations in the lower Amazon River.
Sample Processing
For all metatranscriptomic samples, filters were thawed, removed from the RNAlater preservation solution, placed in Whirl-Pak® bags (Nasco, Fort Artkinson, WI), and flash-frozen in liquid nitrogen. Frozen filters in bags were crushed using a rubber mallet and transferred to a prepared 50 mL lysis tube containing 10 mL of Denaturation Solution (Ambion-Thermo Fisher, Waltham, MA, USA), 500 μL of RNA Plant Aid (Ambion), 2 mL of sterilized zirconium beads (OPS Diagnostics, Lebanon, NJ, USA), and internal standards (Satinsky et al., 2013). Tubes were vortexed for 10 min to lyse cells and contents were centrifuged for 1 min at 5,000 rpm. The lysates were transferred to sterile 15 mL conical tubes and centrifuged for 5 min at 5,000 rpm. Clarified lysates were transferred to sterile 50 mL conical tubes and 3.5 mL of saturated phenol (pH 4.3) was added and vortexed. The tubes were centrifuged for 8 min at 12,000 × g, the aqueous phase in each tube was transferred to a fresh 50 mL conical tube, and 3.5 mL of a phenol:chloroform solution (1:1, pH 5) was added and mixed. Following an 8 min centrifugation at 12,000 × g, the aqueous phase was transferred to a new 50 mL conical tube and mixed with 5 mL of chloroform:isoamyl alcohol solution. Tubes were vortexed and contents centrifuged for 5 min at 12,000 × g. The final aqueous phase was transferred to a new 50 mL conical tube, combined with an equal volume of 100% ethanol, and homogenized by passage through a 21 gauge needle. RNA purification was completed using the Zymo Direct-zol RNA MiniPrep kit (Zymo Research, Irvine, CA, USA) according to manufacturer's protocol. Following RNA extraction residual DNA was removed and rRNA was depleted. mRNA was linearly amplified and double-stranded cDNA was synthesized as previously described (Satinsky et al., 2014a, 2017) by poly-adenylating the end of the mRNA molecules and adding a T7 promoter for amplification (MessageAmp II-Bacteria Kit; Applied Biosystems, Austin, TX). For metagenomic samples, filters were processed as previously described with the inclusion of an internal standard consisting of Thermus thermophilus HB8 genomic DNA (Satinsky et al., 2013, 2014b).
Resulting cDNA and DNA preparations were sheared ultrasonically to ~200–250 bp fragments and libraries were constructed for paired-end sequencing (150 × 150) using the HiSeq 2500 platform (Illumina Inc., San Diego, CA). Following sequencing, reads were paired using PANDAseq (Masella et al., 2012) and filtered using the FASTX-Toolkit (Gordon and Hannon, 2010) with a minimum score cutoff of 20 over 80% of the read. From the paired, quality-controlled reads, internal standard sequences were quantified and removed. rRNA sequences were removed from the metatranscriptomes (Satinsky et al., 2014b).
Sequences are available from NCBI under accession numbers SRP039390 (metagenomes) and SRP037995 (metatranscriptomes). The NCBI sequences are fastq files from which internal standard sequences (metagenomes and metatranscriptomes) and rRNA sequences (metatranscriptomes only) were removed prior to deposition. Sequences are also available at iMicrobe under accession numbers 127-RCM1 to 127-RCM48.
Sequence Analysis
Protein encoding reads were identified and taxonomically assigned to public reference genomes through annotation against the RefSeq Protein database using RAPsearch2 (Zhao et al., 2012) with a score cutoff of 40, keeping only the best hit (Satinsky et al., 2015, 2017). Reads representing selected functional genes were also identified through annotation against a custom protein database (Table S1) consisting of reference sequences from diverse taxa as well as paralogs with sequence similarity to the genes of interest, with cut-off criteria determined by manual annotation. The 89 functional genes in this database represented steps in C, N, P, and S element cycling and several co-factors and vitamins (Table S2) (Satinsky et al., 2014a). Annotation was conducted using a blastx search with a bit score cutoff of 40, keeping only the top hit to non-paralogous sequences. Positive reads were then reanalyzed against the RefSeq protein database to assign taxonomy (Satinsky et al., 2014a, 2017; Zielinski et al., 2016).
Per liter numbers of genes and transcripts were calculated based on internal standard recovery (Table S3) by comparing the abundance of internal standard reads in the Illumina libraries to the number of standards added at the initiation of nucleic acid extraction (Satinsky et al., 2014a,b). For cases in which transcripts were observed but corresponding gene counts were zero, minimum estimates of expression ratios were made by setting the gene count equal to the limit of detection; the detection limit differed among samples based on sequencing depth (Table S3). The average of biological duplicates was obtained by generating a Poisson distribution for the two independent samples of each gene in the metagenomic and metatranscriptomic libraries using the rpois function in R with the lambda parameter equal to the count of reads and 10,000 randomly sampled values returned (Satinsky et al., 2014a). The Poisson distributions were converted to normalized count distributions (copies L−1) and the distributions averaged together for the replicate samples. The mean and standard deviation of the combined distributions were then used for subsequent calculations of expression ratios, calculated as average transcripts L−1 divided by the average gene copies L−1 (Satinsky et al., 2013) (dx.doi.org/10.17504/protocols.io.ftgbnjw). Standard deviations were propagated through the calculations.
Homogenous populations were identified as described previously (Satinsky et al., 2017) using ribosomal protein-encoding reads from genome bins abundant in the metatranscriptomes. Ribosomal proteins were selected for this analysis because they are single copy genes with high read counts, yet have sufficient dissimilarity (13.1 ± 5.8%) to distinguish between bins. Ribosomal protein reads were first identified using a RAPsearch2 similarity search against the full NCBI RefSeq protein database with a bit score cutoff of 40. Using the ribosomal protein with the highest coverage in each genome bin, reads were pooled from all stations and size fractions and clustered at 95% nucleotide identity with a minimal alignment coverage of 50% for the shorter sequence using CD-HIT (Huang et al., 2010). Reads from each station and size fraction were then independently assigned to the clusters using blastn, requiring a minimum alignment length of 50 nt (Satinsky et al., 2017). Because the ~225 nt reads cover only a fraction of a ribosomal protein sequence, a completely homogenous population can produce multiple read clusters within each gene. However, the clustering pattern will be consistent across samples if the population structure is consistent. Singletons (clusters with only a single hit across all samples) were removed from analyses, as were any stations or size fractions with fewer than 20 reads across all clusters. A Bray-Curtis dissimilarity analysis of the distributions of read clusters at each station/fraction was used to identify homogeneous genome bins across samples, defined here as those with dissimilarity scores of <30%.
Environmental Parameters
River water constituents were determined as described in Ward et al. (2013), Ward et al. (2015), and Doherty et al. (2017). Temperature and pH were measured using a Thermo Orion 290Aplus meter with the probe immersed in an overflowing graduated cylinder. Conductivity was measured using an Amber Science 2052 meter and dissolved oxygen with a YSI 55 meter with the probes immersed in the same graduated cylinder. Concentrations of , , , , and Cl− were determined by flow injection analysis using a FFOSS FIAstar 5000 Analyzer following sample filtration through a Whatman cellulose acetate filter (0.45 μm pore-size) and preservation with thymol at −20°C. Major ions (Si, , Na+, K+, Mg+, Ca+) were measured using a HORIBA Jobin Yvon Ultimainductively coupled plasma-optical emission spectroscope. Dissolved inorganic carbon (DIC) concentration was measured on a Shimadzu total organic carbon analyzer (Model TOC-VCPH) following filtration through 0.45 μm cellulose acetate membrane filter (Millipore) into acid-washed 60 mL HDPE bottles with no headspace to avoid degassing and preservation with thymol. DIC samples were analyzed for total organic carbon before and after acidification with 6 N HCl and sparging to remove gas; DIC was calculated as the difference between non-acidified and acidified/sparged samples. Dissolved CO2 concentrations were calculated based on DIC, pH and temperature measurements.
The maximal information-based non-parametric data exploration program (MINE) (Reshef et al., 2011) was used to identify gene expression ratios having strong associations with environmental parameters. The program analyzes scatterplots of pair-wise datasets (in this case, each gene expression ratio against each environmental parameter) to find the grid with the most mutual information (i.e., when knowing one variable provides the most information about the other).
Results
Samples for metagenomic (DNA) and metatranscriptomic (mRNA) analyses were collected in May 2011 from the lower reaches of the Amazon River at five stations stretching from Óbidos to the river mouth (Table 1). The Óbidos station (OB) was the furthest upriver, above which ~90% of the Amazon's water enters the mainstem (Figure 1B). Downriver, the Tapajós station (TAP) captured the major input of the Tapajós River into the mainstem, characterized by much clearer water than found in the river proper. Further downriver the Macapá north channel (MCPN) and Macapá south channel (MCPS) stations represented two of the major outflows of the Amazon mainstem into the ocean (30 and 50% of the discharge; Ward et al., 2015), while the Belém (BLM) station to the south represents the third outflow (20%) and captures the input from the Tocantins River. Thus, among the five stations, three represented well-mixed mainstem stations (OB, MCPN, MCPS) and two represented tributaries or had major tributary inputs (TAP, BLM). All stations had salinities less than 0.05 psu (Table 2).
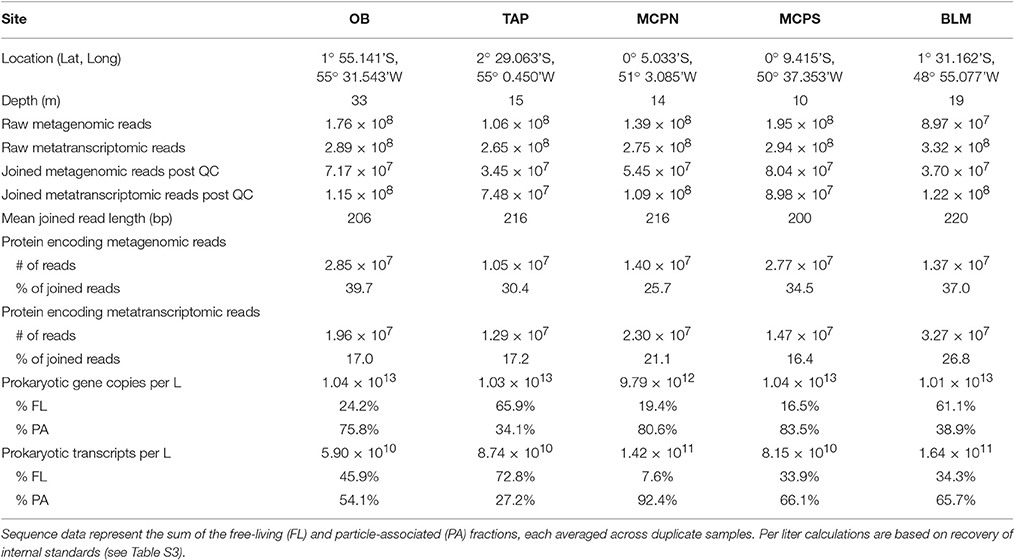
Table 1. Metagenome and metatranscriptome data summaries for five Amazon River stations in May 2011 sampled at 50% depth (10–33 m).
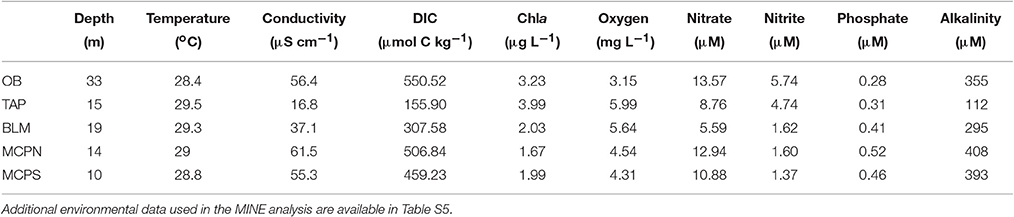
Table 2. Environmental conditions at five Amazon River stations in May 2011.
Two operationally defined microbial size fractions were sampled [free-living (FL), 0.2–2.0 μm; particle-associated (PA), 2.0–297 μm] at 50% river depth, which ranged from 10 to 33 m depending on the station (Table 2). Duplicate samples were collected at each station for each analysis type (metagenome, metatranscriptome) and size fraction (FL, PA), generating a total of 20 metagenomes and 20 metatranscriptomes and more than 500 million paired, quality controlled reads, amounting to 10–30 million potential protein encoding reads per library (Table 1). Here we detail the gene inventories and gene expression patterns of bacterial and archaeal communities based on functional and taxonomic analyses.
Transcript Inventories
Bacterial and archaeal genes were present in higher numbers than transcripts at all stations (Table 1). This finding is consistent with other natural microbial communities (Church et al., 2010; Moran et al., 2013; Satinsky et al., 2017) as well as laboratory-grown bacterial cultures (Neidhardt and Umbarger, 1987; Taniguchi et al., 2010; Gifford et al., 2016) and reflects a small and dynamic mRNA pool in Bacteria and Archaea (Moran et al., 2013). There was an average of 1.1 × 10¹¹ prokaryotic transcripts L−1 (Table 1) at the five Amazon River stations, with about 25% contributed by the 10 most dominant taxonomic bins at each station. The taxonomic composition and rank order of contribution to the transcript pool varied among stations, but several taxonomic bins dominated the transcriptome at multiple stations. The Actinobacterium SCGC AAA027-L06 genome, for example, was the highest recruiting bin at four of the five stations (OB, TAP, MCPN, BLM), accounting for 2–11% of the prokaryotic transcript pool (Figure 1A). Multiple highly-recruiting Thaumarchaeota bins (reference genomes Nitrosopumilus maritimus SCM1, Candidatus Nitrosoarchaeum limnia, Candidatus Nitrosopumilus sp. AR2, Candidatus Nitrosoarchaeum koreensis, Candidatus Nitrosopumilus salaria, and Candidatus Nitrosopumilus koreensis AR1) were present at all stations except TAP (Figure 1A). At the three stations near the river mouth (MCPN, MCPS, BLM), Thaumarchaeota bins accounted for as much as 21% of the total transcriptome. Transcripts binning to heterotrophic bacterial genomes representing Betaproteobacteria, Planctomycetia, Verrucomicrobia, and Sphingobacteria were abundant at multiple stations. The dominant autotrophic taxonomic bins were Synechococcus sp. CB0101 at the clearwater TAP station and Microcystis aeruginosa at BLM. Typically, more transcripts were present per liter in the particle-associated size fraction of the bacterial and archaeal community than the free-living size fraction; the extreme case was at MCPN where transcripts were an order of magnitude more abundant in the particle-associated community compared to the free-living. TAP was the only station where the pattern was reversed; here, transcripts were 4-fold more abundant in the free-living community (Figure 1A).
Gene Expression Ratios
Expression ratios (transcripts gene copy−1) were calculated for the 89 biogeochemically-relevant genes for each size fraction at each station (Tables S2, S4). Among the heterotrophic carbon metabolism genes surveyed, a polyhydroxyalkanoate synthase involved in carbon storage (phaP) had the highest per-gene expression averaged across all samples (Figure 2 and Table S4). Expression of genes linked to C1 metabolism (methane monooxygenase mmoB and formaldehyde activating enzyme fae) was also high, while expression of the three genes implicated in lignin and tannin processing (pcaH, vanA, and tannase) was low (Figure 2). Genes encoding autotrophic processes had the highest levels of expression overall. These included photosystem II genes psbA, psbB, and psbC encoding light capture, RuBisCO genes rbcL(IA) and rbcL(IB) encoding carbon fixation enzymes, and ammonia oxidation genes amoA and nirK mediating chemoautotrophy (Figure 2). High expression of genes encoding key steps in chemoautotrophy, including amoA, have been found previously (Franck et al., 2008; Gifford et al., 2011; Hollibaugh et al., 2011). Among the genes representing phosphorus acquisition, high-affinity phosphate transporter components were the most highly expressed across the stations and size fractions (pstACS and phoU), while those involved in phosphonate transport and metabolism (phnEGHM) were among the lowest (Figure 2). cysK and cysI, encoding the reduction of sulfite and incorporation of sulfide into cysteine, were the most highly expressed of the sulfur cycle genes (Figure 2 and Table S4).
Figure 2. Expression ratios (transcripts gene copy−1) for 89 biogeochemically-relevant genes averaged across all stations and size fractions. Off-scale values are indicated to the right of the truncated bar. Expression dynamics by individual station and size fraction are shown in Figure 3.
At the microenvironment scale, per-gene expression levels were consistently higher in the free-living fraction compared to the particle-associated fraction at both OB (81 of 89 genes) and MCPS (77 of 89 genes), but consistently higher in the particle-associated fraction at MCPN (87 of 89) and BLM (89 of 89) (Figure 3 and Table S4); the TAP station had no size fraction bias (43 genes had higher expression in the particle-associated fraction and 44 had higher expression in the free-living fraction; Figure 3 and Table S4). Within the specific functional categories, phaP peaked at 1.6 transcripts gene copy−1 in the particle-associated fraction at BLM, mmoB at 0.1 transcripts gene copy−1 in the particle-associated fraction at MCPN, and psbA and rbcL-IA at 5.2 and 1.7 transcripts gene copy−1 in the particle-associated fraction at BLM. Considering all 89 biogeochemical genes, the gene with the highest production of transcripts per gene copy in any sample was amoA in the particle-associated fraction at BLM, at 14 transcripts gene copy−1 (Figure 3 and Table S4).
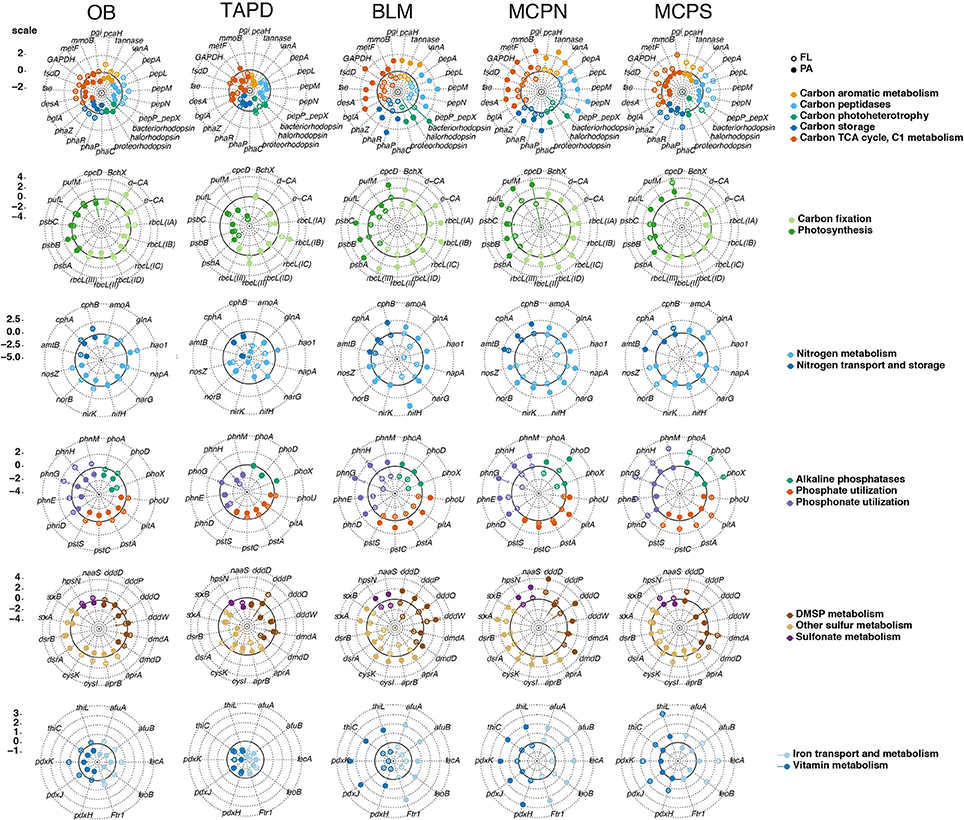
Figure 3. Expression ratios (transcripts gene copy−1) of 89 biogeochemically-relevant genes for two microbial size fractions at five river stations normalized to the median value for each gene. Genes are grouped according to broad functional categories and colored based on subcategories. Circle fill indicates microenvironment (free-living, open; particle-associated, closed). The scale bar at the left indicates the log2 deviation from the median value for all plots on that row. The ring drawn with a bold line in each plot indicates the median value (where log2 = 0).
How Important Is Gene Regulation?
We investigated the extent to which riverine microbes regulate genes as they are carried downriver through the lower mainstem. Genome bins with homogeneous population structure at multiple stations were identified in order to rule out shifting taxonomic composition as the explanation for differences in gene expression; otherwise expression level variation due to regulatory changes could not be distinguished from those due to population shifts. To identify these homogenous populations, transcripts mapping to highly expressed ribosomal protein genes were analyzed by hierarchical clustering (see Methods) for eight reference genome bins representing abundant taxa (three Bacteria and five Thaumarchaeota). The three bacterial reference bins (actinobacterium SCGC AAA027-L06, planctomycete Schlesneria paludicola, and verrucomicrobium Pedosphaera parvula) generated fingerprints with little similarity between stations (Figure 4), indicating that these populations would not be informative for assessing the extent of gene regulation. The five Thaumarchaeota reference bins, however, had similar populations at all four stations where they were quantitatively important: OB, MCPN, MCPS, and BLM (Figure 4).
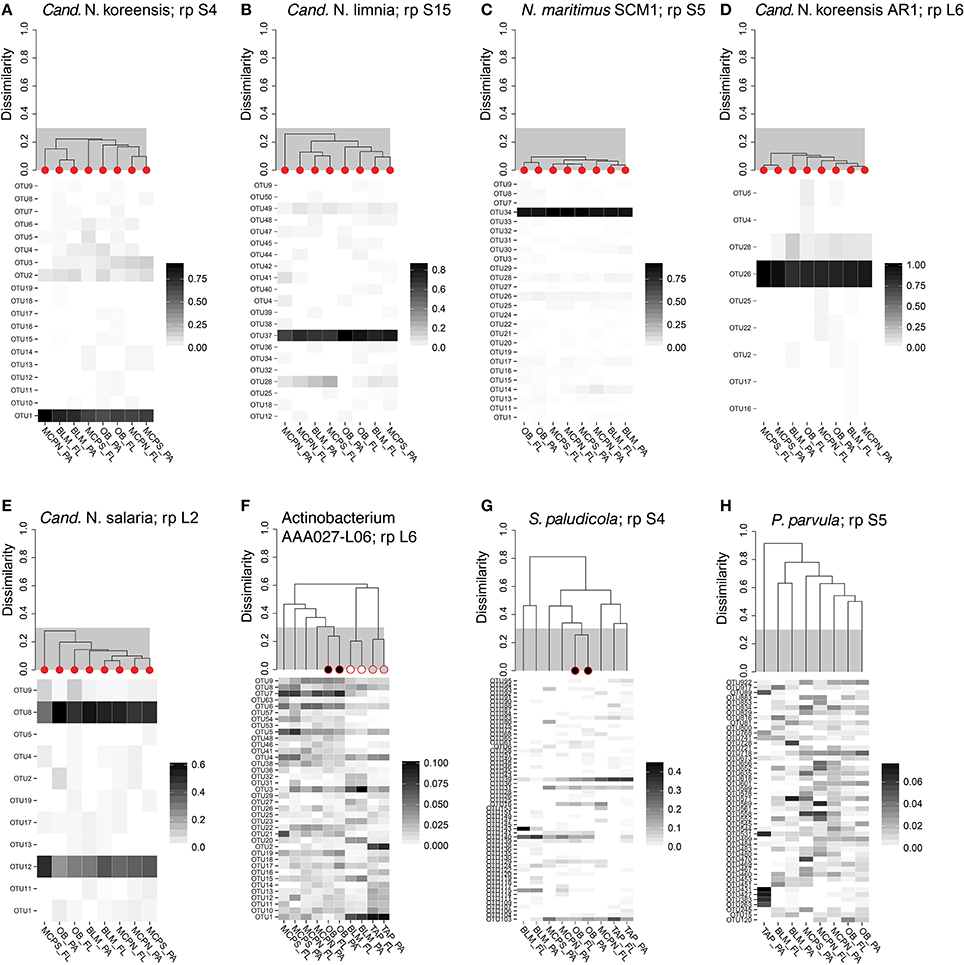
Figure 4. OTU fingerprints and hierarchical clustering of transcripts from a highly-expressed ribosomal protein for eight reference genome bins with high coverage in the metatranscriptomes. Individual samples identified as containing the same population structure at different locations (clustering at <30% dissimilarity) are marked with red circles in (A–E). In (F,G), Actinobacterium AAA027-L06 and Schlesneria paludicola ribosomal proteins met the cut-off criteria for different fractions at the same station, but not across different stations. In (H), Pedosphaera parvula populations were different for every size fraction and station. The ribosomal protein used in the clustering analysis is indicated after “rp” in the plot title.
We examined patterns of gene regulation in these five homogeneous Thaumarchaeota bins by plotting transcripts L−1 against genes L−1 (n = 8 for each analysis; 2 size fractions at each of 4 stations) (Figure 5). A high coefficient of determination of the linear regression (R2) was expected if transcription levels were constant for a given gene regardless of river location (that is, if each copy of a gene in a Thaumarchaeota reference bin produced a similar number of transcripts at all stations). For statistically significant relationships, the slope of the regression line provided an estimate of the average expression ratio (transcripts gene copy−1) for that gene. Of the nine genes examined (Figure 5), those with regression parameters most consistent with unchanging expression were ammonia transporter amtB and vitamin B1 biosynthetic gene thiC, for which an average of 68 and 55% of the variation in transcript counts was explained by a simple linear model against gene counts; transcripts gene copy−1 averaged 3.2 and 0.04 for these genes based on regression slopes. The gene for which regression parameters were most consistent with differential regulation was nitrous oxide reductase nosZ, for which an average of only 14% of transcript counts was explained by a linear model. Overall, 18 of 40 analyses (5 genome bins by 8–9 genes each) suggested that gene expression was being differentially regulated within Thaumarchaeota populations positioned at different locations in the Amazon mainstem; 22 of 40 analyses suggested constant rates of gene expression regardless of location (Table 3).
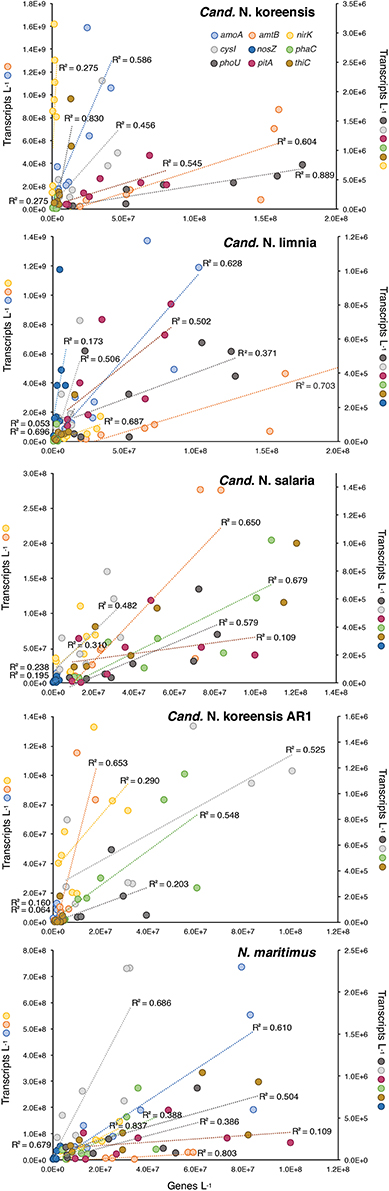
Figure 5. Plot of transcripts L−1 vs. genes L−1 for nine highly expressed element cycling genes in five homogeneous archaeal genome bins at stations OB, MCPS, MCPN, and BLM. An R2-value of 1.0 would indicate constant expression levels (transcripts gene copy−1) across stations and size fractions. Symbols on the Y axis titles show which genes are plotted on each scale. See Table 3 for regression analysis details.
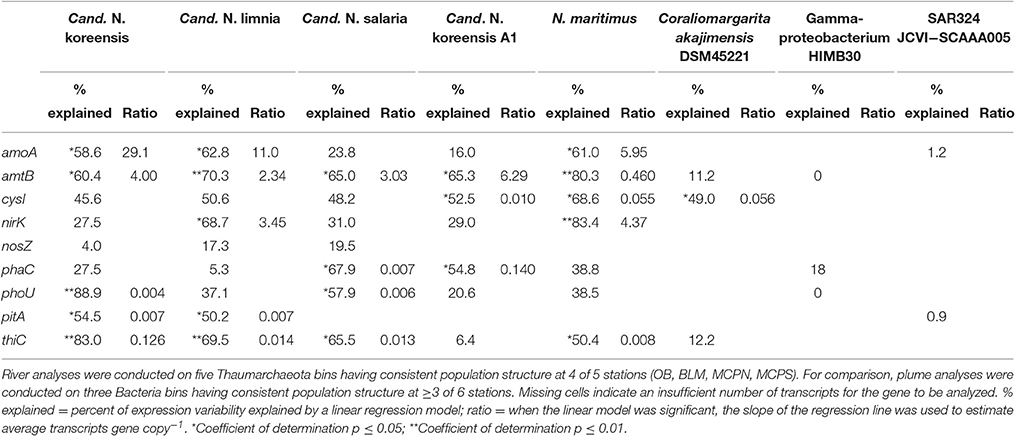
Table 3. Regression statistics for plots of transcripts L−1 against genes L−1 for nine biogeochemically relevant genes in homogeneous genome bins.
Relationships with Environmental Conditions
The maximal information-based non-parametric data exploration program (MINE; (Reshef et al., 2011) was used to detect associations between environmental properties and gene expression ratios. This analysis measured associations between data pairs (an environmental parameter paired with a gene expression ratio), assigning a normalized maximum information coefficient (MIC) value between 0 (no relationship) and 1 (strongest relationship). Of the 1,958 parameter-gene pairs examined for each microenvironment (22 parameters by 89 genes; Table S5), 73 high scoring linear relationships emerged for genes in free-living cells (defined as MIC >0.90 and Pearson correlation coefficient ≥0.90) and 35 emerged for genes in particle-associated cells (Table S6).
For bacteria and archaea in the free-living community, the most prominent pattern involved environmental parameters that were low at tributary-influenced stations TAP and BLM, but high at mainstem stations OB, MCPN, MCPS. These parameters included concentration of particulate lignin, dissolved lignin, fine suspended sediments (FSS), particulate organic carbon (POC), nitrate, dissolved inorganic carbon (DIC), and alkalinity (Figure 6). The parameters were good positive predictors of expression levels of four genes mediating sulfur cycling (aprB, cysK, soxA, and naaS) and two genes indicating heterotrophic activity (membrane fatty acid synthesis gene desA and carbon storage phasin gene phaP) (Figure 6). A second prominent pattern involved environmental parameters that were high at TAP and BLM but low at the three mainstem stations. These parameters were temperature and concentrations of dissolved oxygen and alkalinity. They were good negative predictors of the same four sulfur genes (aprB, cysK, naaS, soxB), as well as heterotrophy genes pepM and phaP, RuBisCO genes rbcL(IC) and rbcL(ID), and photosynthesis gene psbA.
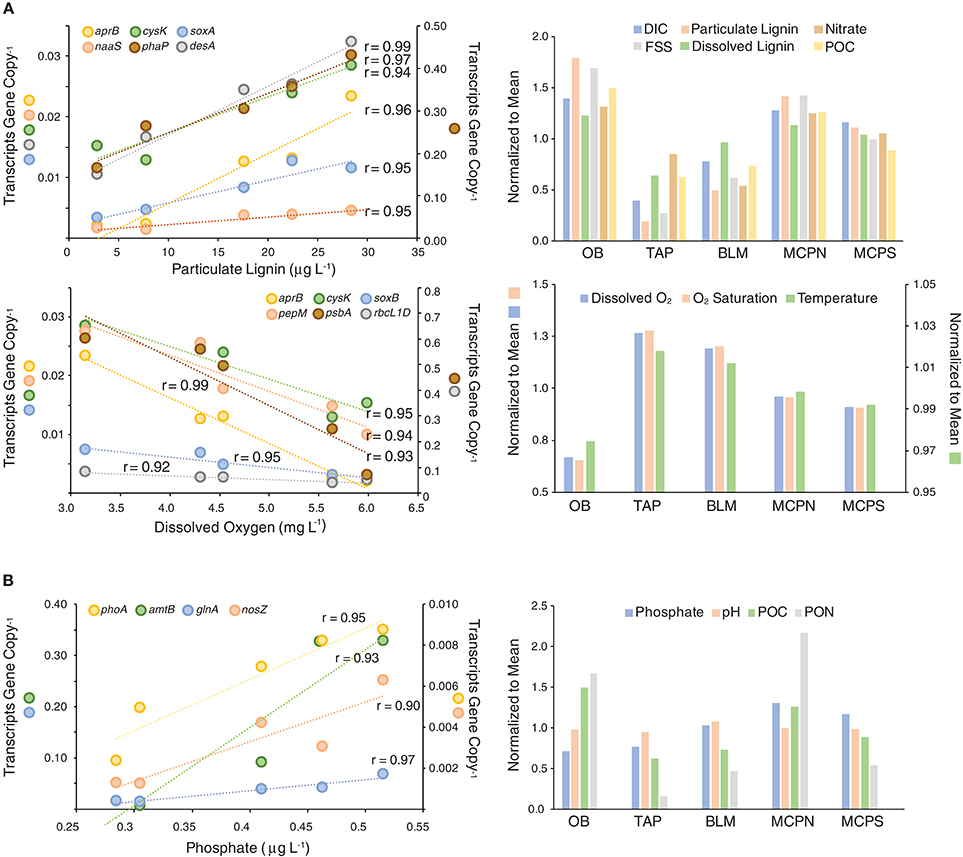
Figure 6. Correlations for high scoring data pairs in a MINE analysis of gene expression ratios and environmental properties for free-living (A) and particle-associated (B) cells. All correlations represent associations with a maximum information coefficient (MIC) >0.90 and a Pearson's correlation coefficient >0.90. Symbols on the Y axis titles show which genes are plotted on each scale.
A different set of environmental parameters best predicted gene expression ratios for cells making up the particle-associated community. Phosphate concentrations were positively correlated with four genes encoding processes in the phosphorus and nitrogen cycles: alkaline phosphatase gene phoA, ammonium transporter amtB, ammonia assimilation gene glnA, and nitrous oxide reductase nosZ (Figure 6B). Both POC and particulate organic nitrogen (PON) were correlated with expression ratios of dsrA and dsrB, genes encoding a reverse dissimilatory sulfite reductase that derives energy from reduced sulfur compounds. pH was positively correlated with heterotrophy genes phaP and bglA and with vitamin B6 biosynthesis genes pdxJ and pdxK.
Discussion
Few studies have examined the genomic potential of microbial communities in the Amazon River system. A previous metagenomic analysis of microbes at Amazon River mainstem sites several hundred kilometers upriver from the Óbidos station (Ghai et al., 2011) found a functional gene pool dominated by species related to Polynucleobacter sp. QLW-P1DMWA-1 and Polaromonas sp. JS666 (Betaproteobacteria), Acidothermus cellulolyticus 11B and Streptomyces (Actinobacteria), and Nitrosopumilus maritimus SCM1 (Thaumarchaeota). Although many of the highly-recruiting reference genomes emerging in this study were not available at the time of the Ghai et al. (2011) analysis, substantial similarities nonetheless exist at broad taxonomic levels between the datasets, with Actinobacteria, Betaproteobacteria, and Thaumarchaeota emerging as dominant members of the microbial communities in both the upper and lower mainstem of the Amazon, while Cyanobacteria, Verrucomicrobia, and Planctomycetes were found to be important primarily in the lower mainstem.
Since Thaumarchaeota accounted for only 3% of the metagenome reads, it was surprising to see a much higher relative abundance in the metatranscriptomes, particularly at MCPS where Thaumarchaeota transcripts accounted for 21% of the transcriptome. In contrast, a recent study of the Columbia River and estuary found only 1% Archaea reads in the metatranscriptomes (Fortunato and Crump, 2015). Heterotrophic processing of terrestrially-derived carbon is considered to be the most important biogeochemical role of prokaryotes in the Amazon and other large river systems (Benner et al., 1995; Battin et al., 2009). However, Thaumarchaeota are typically chemoautotrophic ammonia oxidizers not reliant on catabolizing organic substrates. Based on high levels of amoA expression, they are likely to be fixing carbon chemosynthetically in the lower reaches of the Amazon River (Figure 2), although they may not be obligate chemolithotrophs (Mußmann et al., 2011).
The abundant Thaumarchaeota transcripts were useful for addressing the influence of regulation on gene expression because they provided sizeable transcript bins with genetically homogeneous populations at multiple river locations. The genome binning approach used here can produce taxonomic groupings that intermingle different populations having highest sequence similarity to the same reference genome, an issue that is exacerbated if reference genomes are sparse, as they are for riverine prokaryotes (Ghai et al., 2011). For the five Thaumarchaeota reference bins, however, transcript clustering patterns indicated similar within-bin population structure across several stations. Gene transcription in each of these populations more often followed a pattern indicative of constitutive expression, as evidenced by statistically significant fits to a linear regression of transcript numbers vs. gene numbers in 55% of the tests (22 out of 40) (Table 3). Because a previous analysis of gene regulation in the Amazon Plume suggested a much larger role for gene regulation in coastal regions as river water mixes offshore (Satinsky et al., 2017), we made similar transcript number by gene number plots for the plume data. For eight analyses of three reference bins with homogeneous population structure across multiple plume locations and size fractions (Coraliomargarita akajimensis DSM45221, marine Gammaproteobacteria HIMB30, and SAR324 cluster bacterium JCVI-SC AAA005) we found a statistically significant linear regression for only 12.5% (1 out of 8), consistent with a higher frequency of gene regulation in plume compared to river communities (Table 3). Three possible explanations for such divergent levels of gene regulation of biogeochemically-important processes in the river vs. plume are that Thaumarchaeota inherently regulate genes to a lesser extent than bacteria; that freshwater bacteria and archaea inherently regulate genes to a lesser extent than marine bacteria and archaea; or that river environmental conditions are less variable than plume conditions and therefore gene regulation is not as necessary. Similar patterns of gene expression found for Thaumarcheota populations through several years in a temperate coastal system (Hollibaugh et al., 2011) supports the first explanation; similar environmental conditions in the mainstem stations (Table 2) supports the third explanation.
The environmental parameters with statistically significant relationships to gene expression emphasized the similar chemical and physical conditions at the widely-separated mainstem stations. Genes whose expression ratios were significantly predicted by these parameters encoded sulfur incorporation and oxidation, carbon storage, membrane biosynthesis, and carbon fixation in the free-living cells; and nitrogen and phosphorus acquisition, sulfur oxidation, and vitamin B6 biosynthesis in the particle-associated cells. These patterns echo an analysis of the taxonomic composition of the mainstem microbial communities in which spatially homogeneous assemblages were found in much of the lower reaches (Doherty et al., 2017) and analysis of the dissolved organic matter pool in which highly similar molecular composition was found within the mainstem (Seidel et al., 2016).
The influence of the Amazon River and its resident microbes continues beyond the river boundaries. Discharge from the Amazon accounts for 18% of the world's river input to the oceans (Richey et al., 1989; Subramaniam et al., 2008), and the dissolved and particulate nitrogen, phosphate, silica, and iron delivered to marine waters affect marine microbial activity and carbon sequestration at a global scale (Subramaniam et al., 2008). A recent inventory of genes and transcripts of the Amazon Plume (Satinsky et al., 2014a,b) provides an opportunity to compare transcript inventories of elemental cycling genes in microbes inhabiting the lower mainstem (sampled in May 2011) to those in the oceanic plume (sampled in May-June 2010). When relative transcript abundance of the 89 biogeochemically-relevant genes was compared across the river and plume stations, river samples were more strongly dominated by amoA, nirK and amtB transcripts generated by Thaumarchaeota populations (Figure 7). Nitrogen fixation transcripts were a more important feature of the plume transcriptomes, particularly at two stations where diatoms harbored an endosymbiotic N-fixing cyanobacterium (Hilton et al., 2014; Satinsky et al., 2017). Transcripts from the high-affinity phosphate transporter (pstACS) were more important at the plume sites and the TAP station, while the low-affinity phosphate transporter (pitA) was more important at the other river stations and the coastal plume stations, consistent with generally higher PO4 availability in the river compared to the tributaries and ocean. Transcripts involved in light utilization were more dominant at TAP and BLM relative to the mainstem stations and more similar to the plume stations, indicative of greater light availability in the clearwater tributaries and plume. Taken as a whole the relative transcript abundances of these 89 functional genes suggest a clear separation in the expression patterns between the marine and riverine prokaryotic communities with the exception of the clear water riverine TAP station which more closely resembles marine stations.
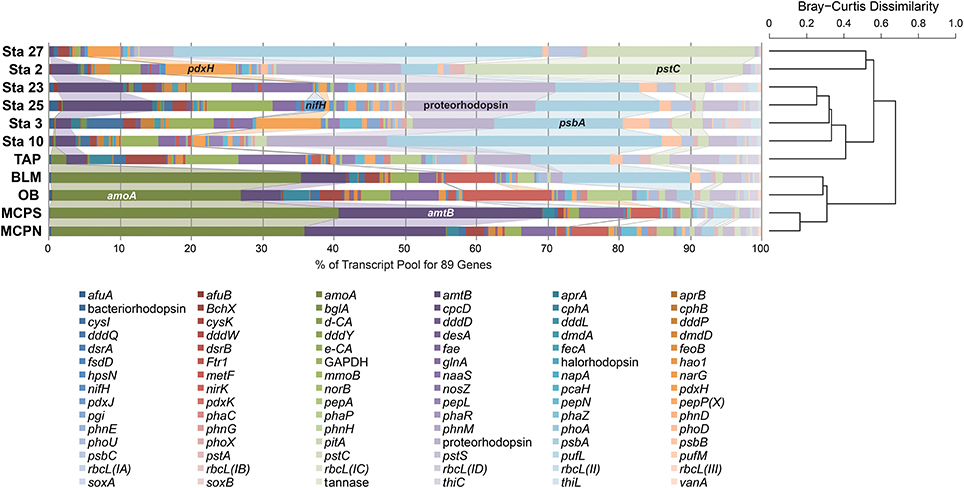
Figure 7. Hierarchical clustering of relative abundance patterns of 89 biogeochemically-relevant genes in the metatranscriptomes from five Amazon River stations and six Amazon Plume stations. The samples were clustered using the Bray-Curtis Dissimilarity algorithm based on relative transcript abundance.
Despite higher concentrations of aromatic carbon compounds derived from vascular plant material in the river (Ward et al., 2013), expression ratios of genes for degradation of aromatic compounds (pcaH and vanA), tannin (tanA), and cellulose (bglA) were considerably lower in the river compared to the plume by 18- to 155-fold. However, poor understanding of the enzymes encoding lignin degradation in aquatic systems in combination with the heterogeneous nature of lignin molecules, the likelihood of multiple enzymes being involved in its oxidation, and roles for photochemical oxidation and microbial priming (Ward et al., 2016) may explain this finding. DOM analyses indicate a transition from higher plant-derived DOM to more algal/microbial-derived DOM between Óbidos and Macapá (Seidel et al., 2016), suggesting active loss of terrestrial carbon within the river.
The metabolic activity of Amazon River microbes has not yet been fully characterized despite the recognized importance of Bacteria and Archaea in controlling energy production and consumption in this ecosystem. Similar to findings by Doherty et al. (2017) for microbial community composition, gene expression patterns detailed here are consistent with a spatially homogeneous mainstem in which microbial metabolism changes relatively little from Óbidos to the mouth in the well-mixed river, simultaneously supporting heterotrophic, chemoautotrophic, and photosynthetic processes. However, tributary inputs drive discrete communities with distinctive biogeochemical activities at Tapajós and Belém, and these are biased toward free-living cells that rely more on phototrophy. Overall, this analysis of gene expression in the world's largest river system provides insights into microbial processes important in the biogeochemistry of large rivers and adjacent plume systems, and highlights the potential importance of the archaeal community members and the nutrient cycling processes they mediate within freshwater habitats.
Author Contributions
BS for sample collection, laboratory analysis, data analysis, intellectual contributions and manuscript preparation. CS for sample collection, laboratory analysis, and data analysis. SS for data analysis. NW for sample collection, laboratory analysis, and intellectual contributions. AK for project leadership, sample collection, and intellectual contributions. JR for project leadership, sample collection, and intellectual contributions. PY for project leadership and intellectual contributions. BC for project leadership, data analysis, and intellectual contributions. MAM for project leadership, data analysis, intellectual contributions, and manuscript preparation.
Conflict of Interest Statement
The authors declare that the research was conducted in the absence of any commercial or financial relationships that could be construed as a potential conflict of interest.
Acknowledgments
We appreciate the assistance of Roger Nilsen with preparation of sequencing libraries, and thank the scientists of the ROCA and ANACONDAS projects, Henrique O. Sawakuchi (CENA, Piracicaba), Alan Cavalcanti da Cunha (UNIFAP, Macapá), Daímio Brito (UEAP, Macapá), Troy P. Beldini (UFOPA, Santarem), José Mauro (UFOPA, Santarem), and Rodrigo da Silva (UFOPA, Santarem) for supporting data and insights. This research is funded by the Gordon and Betty Moore Foundation through Grants GBMF 2293 and 2928 to PY, JR, BC, and MAM and 538.01 to MAM. Resources and technical expertise were provided by the Georgia Advanced Computing Resource Center.
Supplementary Material
The Supplementary Material for this article can be found online at: https://www.frontiersin.org/article/10.3389/fmars.2017.00253/full#supplementary-material
References
Auguet, J.-C., Nomokonova, N., Camarero, L., and Casamayor, E. O. (2011). Seasonal changes of freshwater ammonia-oxidizing archaeal assemblages and nitrogen species in oligotrophic alpine lakes. Appl. Environ. Microbiol. 77, 1937–1945. doi: 10.1128/AEM.01213-10
Battin, T. J., Kaplan, L. A., Findlay, S., Hopkinson, C. S., Marti, E., Packman, A. I., et al. (2009). Biophysical controls on organic carbon fluxes in fluvial networks. Nat. Geosci. 2, 595–595. doi: 10.1038/ngeo602
Benner, R., Opsahl, S., Chinleo, G., Richey, J. E., and Forsberg, B. R. (1995). Bacterial carbon metabolism in the Amazon River system. Limnol. Oceanogr. 40, 1262–1270. doi: 10.4319/lo.1995.40.7.1262
Callieri, C., Corno, G., Caravati, E., Rasconi, S., Contesini, M., and Bertoni, R. (2009). Bacteria, Archaea, and Crenarchaeota in the epilimnion and hypolimnion of a deep holo-oligomictic lake. Appl. Environ. Microbiol. 75, 7298–7300. doi: 10.1128/AEM.01231-09
Church, M. J., Wai, B., Karl, D. M., and Delong, E. F. (2010). Abundances of crenarchaeal amoA genes and transcripts in the Pacific Ocean. Environ. Microbiol. 12, 679–688. doi: 10.1111/j.1462-2920.2009.02108.x
Coles, V. J., Brooks, M. T., Hopkins, J., Stukel, M. R., Yager, P. L., and Hood, R. R. (2013). The pathways and properties of the Amazon River Plume in the tropical North Atlantic Ocean. J. Geophys. Res. Oceans 118, 6894–6913. doi: 10.1002/2013JC008981
Debroas, D., Humbert, J. F., Enault, F., Bronner, G., Faubladier, M., and Cornillot, E. (2009). Metagenomic approach studying the taxonomic and functional diversity of the bacterial community in a mesotrophic lake (Lac du Bourget - France). Environ. Microbiol. 11, 2412–2424. doi: 10.1111/j.1462-2920.2009.01969.x
Doherty, M., Yager, P. L., Moran, M. A., Coles, V. J., Fortunato, C. S., Krusche, A. V., et al. (2017). Bacterial biogeography across the Amazon river-to-ocean continuum. Front. Microbiol. 8:882. doi: 10.3389/fmicb.2017.00882
Ertel, J. R., Hedges, J. I., Devol, A. H., Richey, J. E., and Ribeiro, M. D. G. (1986). Dissolved humic substances of the Amazon River System. Limnol. Oceanogr. 31, 739–754. doi: 10.4319/lo.1986.31.4.0739
Field, C. B., Behrenfeld, M. J., Randerson, J. T., and Falkowski, P. (1998). Primary production of the biosphere: integrating terrestrial and oceanic components. Science 281, 237–240. doi: 10.1126/science.281.5374.237
Fortunato, C. S., and Crump, B. C. (2015). Microbial gene abundance and expression patterns across a river to ocean salinity gradient. PLoS ONE 10:e0140578. doi: 10.1371/journal.pone.0140578
Franck, W. L., Chang, W.-S., Qiu, J., Sugawara, M., Sadowsky, M. J., Smith, S. A., et al. (2008). Whole-genome transcriptional profiling of Bradyrhizobium japonicum during chemoautotrophic growth. J. Bacteriol. 190, 6697–6705. doi: 10.1128/JB.00543-08
Gagne-Maynard, W., Ward, N. D., Keil, R., Sawakuchi, H. O., Cunha, A. C. D., Neu, V., et al. (2017). Evaluation of primary production in the lower Amazon River based on a dissolved oxygen stable isotopic mass balance. Front. Mar. Sci. 4:26. doi: 10.3389/fmars.2017.00026
Ghai, R., Rodriguez-Valera, F., McMahon, K. D., Toyama, D., Rinke, R., De Oliveira, T. C. S., et al. (2011). Metagenomics of the water column in the pristine upper course of the Amazon River. PLoS ONE 6:e23785. doi: 10.1371/journal.pone.0023785
Gifford, S. M., Becker, J. W., Sosa, O. A., Repeta, D. J., and Delong, E. F. (2016). Quantitative transcriptomics reveals the growth- and nutrient-dependent response of a streamlined marine methylotroph to methanol and naturally occurring dissolved organic matter. MBio 7:e01279-16. doi: 10.1128/mBio.01279-16
Gifford, S. M., Sharma, S., Rinta-Kanto, J. M., and Moran, M. A. (2011). Quantitative analysis of a deeply sequenced marine microbial metatranscriptome. ISME J. 5, 461–472. doi: 10.1038/ismej.2010.141
Gordon, A., and Hannon, G. (2010). Fastx-toolkit. FASTQ/A Short-Reads Pre-Processing Tools. Available online at: http://hannonlab.cshl.edu/fastx_toolkit.
Hilton, J. A., Satinsky, B. M., Doherty, M., Zielinski, B. L., and Zehr, J. P. (2014). Metatranscriptomics of N2-fixing cyanobacteria in the Amazon River plume. ISME J. 9, 1557–1569. doi: 10.1038/ismej.2014.240
Hollibaugh, J. T., Gifford, S., Sharma, S., Bano, N., and Moran, M. A. (2011). Metatranscriptomic analysis of ammonia-oxidizing organisms in an estuarine bacterioplankton assemblage. ISME J. 5, 866–878. doi: 10.1038/ismej.2010.172
Huang, Y., Niu, B., Gao, Y., Fu, L., and Li, W. (2010). CD-HIT Suite: a web server for clustering and comparing biological sequences. Bioinformatics 26, 680–682. doi: 10.1093/bioinformatics/btq003
Lehours, A.-C., Evans, P., Bardot, C., Joblin, K., and Gérard, F. (2007). Phylogenetic diversity of archaea and bacteria in the anoxic zone of a meromictic lake (Lake Pavin, France). Appl. Environ. Microbiol. 73, 2016–2019. doi: 10.1128/AEM.01490-06
Liu, J., Yu, S., Zhao, M., He, B., and Zhang, X.-H. (2014). Shifts in archaeaplankton community structure along ecological gradients of Pearl Estuary. FEMS Microbiol. Ecol. 90, 424–435. doi: 10.1111/1574-6941.12404
Liu, Z., Huang, S., Sun, G., Xu, Z., and Xu, M. (2011). Diversity and abundance of ammonia-oxidizing archaea in the Dongjiang River, China. Microbiol. Res. 166, 337–345. doi: 10.1016/j.micres.2010.08.002
Malhi, Y., Roberts, J. T., Betts, R. A., Killeen, T. J., Li, W. H., and Nobre, C. A. (2008). Climate change, deforestation, and the fate of the Amazon. Science 319, 169–172. doi: 10.1126/science.1146961
Masella, A. P., Bartram, A. K., Truszkowski, J. M., Brown, D. G., and Neufeld, J. D. (2012). PANDAseq: PAired-eND assembler for illumina sequences. BMC Bioinformatics 13:31. doi: 10.1186/1471-2105-13-31
Moran, M. A., Satinsky, B., Gifford, S. M., Luo, H. W., Rivers, A., Chan, L. K., et al. (2013). Sizing up metatranscriptomics. ISME J. 7, 237–243. doi: 10.1038/ismej.2012.94
Mußmann, M., Brito, I., Pitcher, A., Damsté, J. S. S., Hatzenpichler, R., Richter, A., et al. (2011). Thaumarchaeotes abundant in refinery nitrifying sludges express amoA but are not obligate autotrophic ammonia oxidizers. Proc. Natil. Acad. Sci. U.S.A. 108, 16771–16776. doi: 10.1073/pnas.1106427108
Neidhardt, F., and Umbarger, H. (1987). “Chemical composition of Escherichia coli,” in Escherichia coli and Salmonella: Cellular and Molecular Biology, ed F. C. Neidhardt (Washington, DC: American Society for Microbiology), 13–16.
Oh, S., Caro-Quintero, A., Tsementzi, D., Deleon-Rodriguez, N., Luo, C. W., Poretsky, R., et al. (2011). Metagenomic insights into the evolution, function, and complexity of the planktonic microbial community of Lake Lanier, a temperate freshwater ecosystem. Appl. Environ. Microbiol. 77, 6000–6011. doi: 10.1128/AEM.00107-11
Pope, P. B., and Patel, B. K. C. (2008). Metagenomic analysis of a freshwater toxic cyanobacteria bloom. FEMS Microbiol. Ecol. 64, 9–27. doi: 10.1111/j.1574-6941.2008.00448.x
Quaiser, A., Bodi, X., Dufresne, A., Naquin, D., Francez, A.-J., Dheilly, A., et al. (2014). Unraveling the stratification of an iron-oxidizing microbial mat by metatranscriptomics. PLoS ONE 9:e102561. doi: 10.1371/journal.pone.0102561
Quay, P., Wilbur, D., Richey, J., Devol, A., Benner, R., and Forsberg, B. (1995). The 18O: 16O of dissolved oxygen in rivers and lakes in the Amazon Basin: determining the ratio of respiration to photosynthesis rates in freshwaters. Limnol. Oceanogr. 40, 718–729. doi: 10.4319/lo.1995.40.4.0718
Reshef, D. N., Reshef, Y. A., Finucane, H. K., Grossman, S. R., McVean, G., Turnbaugh, P. J., et al. (2011). Detecting novel associations in large data sets. Science 334, 1518–1524. doi: 10.1126/science.1205438
Richey, J. E., Melack, J. M., Aufdenkampe, A. K., Ballester, V. M., and Hess, L. L. (2002). Outgassing from Amazonian rivers and wetlands as a large tropical source of atmospheric CO2. Nature 416, 617–620. doi: 10.1038/416617a
Richey, J. E., Nobre, C., and Deser, C. (1989). Amazon Rriver discharge and climate variability: 1903 to 1985. Science 246, 101–103. doi: 10.1126/science.246.4926.101
Rusch, D. B., Halpern, A. L., Sutton, G., Heidelberg, K. B., Williamson, S., Yooseph, S., et al. (2007). The sorcerer II global ocean sampling expedition: northwest atlantic through eastern tropical pacific. PLoS Biol. 5:e77. doi: 10.1371/journal.pbio.0050077
Santos-Júnior, C. D., Kishi, L. T., Toyama, D., Soares-Costa, A., Oliveira, T. C. S., De Miranda, F. P., et al. (2017). Metagenome sequencing of prokaryotic microbiota collected from rivers in the upper Amazon basin. Genome Announc. 5:e01450-16. doi: 10.1128/genomeA.01450-16
Satinsky, B. M., Crump, B. C., Smith, C. B., Sharma, S., Zielinski, B. L., Doherty, M., et al. (2014a). Microspatial gene expression patterns in the Amazon River Plume. Proc. Natl. Acad. Sci. U.S.A. 111, 11085–11090. doi: 10.1073/pnas.1402782111
Satinsky, B. M., Fortunato, C. S., Doherty, M., Smith, C. B., Sharma, S., Ward, N. D., et al. (2015). Metagenomic and metatranscriptomic inventories of the lower Amazon River, May 2011. Microbiome 3:39. doi: 10.1186/s40168-015-0099-0
Satinsky, B. M., Gifford, S. M., Crump, B. C., and Moran, M. A. (2013). “Use of internal standards for quantitative metatranscriptome and metagenome analysis,” in Methods in Enzymology, ed E. F. Delong (Burlington: Academic Press), 237–250.
Satinsky, B. M., Smith, C. B., Sharma, S., Landa, M., Medeiros, P. M., Coles, V. J., et al. (2017). Expression patterns of elemental cycling genes in the Amazon River Plume. ISME J. 11, 1852–1864. doi: 10.1038/ismej.2017.46
Satinsky, B. M., Zielinski, B. L., Doherty, M., Smith, C. B., Sharma, S., Paul, J. H., et al. (2014b). The Amazon continuum dataset: quantitative metagenomic and metatranscriptomic inventories of the Amazon River plume, June 2010. Microbiome 2:17. doi: 10.1186/2049-2618-2-17
Sawakuchi, H. O., Neu, V., Ward, N. D., Barros, M. D. L. C., Valerio, A. M., Gagne-Maynard, W., et al. (2017). Carbon dioxide emissions along the lower Amazon River. Front. Mar. Sci. 4:76. doi: 10.3389/fmars.2017.00076
Seidel, M., Dittmar, T., Ward, N. D., Krusche, A. V., Richey, J. E., Yager, P. L., et al. (2016). Seasonal and spatial variability of dissolved organic matter composition in the lower Amazon River. Biogeochemistry 131, 281–302. doi: 10.1007/s10533-016-0279-4
Subramaniam, A., Yager, P. L., Carpenter, E. J., Mahaffey, C., Bjorkman, K., Cooley, S., et al. (2008). Amazon River enhances diazotrophy and carbon sequestration in the tropical North Atlantic Ocean. Proc. Natl. Acad. Sci. U.S.A. 105, 10460–10465. doi: 10.1073/pnas.0710279105
Taniguchi, Y., Choi, P. J., Li, G. W., Chen, H. Y., Babu, M., Hearn, J., et al. (2010). Quantifying E. coli proteome and transcriptome with single-molecule sensitivity in single cells. Science 329, 533–538. doi: 10.1126/science.1188308
Tsementzi, D., Poretsky, R., Rodriguez, L. M., Luo, C. W., and Konstantinidis, K. T. (2014). Evaluation of metatranscriptomic protocols and application to the study of freshwater microbial communities. Environ. Microbiol. Rep. 6, 640–655. doi: 10.1111/1758-2229.12180
Urbach, E., Vergin, K. L., Young, L., Morse, A., Larson, G. L., and Giovannoni, S. J. (2001). Unusual bacterioplankton community structure in ultra-oligotrophic Crater Lake. Limnol. Oceanogr. 46, 557–572. doi: 10.4319/lo.2001.46.3.0557
Vila-Costa, M., Sharma, S., Moran, M. A., and Casamayor, E. O. (2013). Diel gene expression profiles of a phosphorus limited mountain lake using metatranscriptomics. Environ. Microbiol. 15, 1190–1203. doi: 10.1111/1462-2920.12033
Ward, N. D., Bianchi, T. S., Sawakuchi, H. O., Gagne-Maynard, W., Cunha, A. C., Brito, D. C., et al. (2016). The reactivity of plant-derived organic matter and the potential importance of priming effects along the lower Amazon River. J. Geophys. Res. Biogeosci. 121, 1522–1539. doi: 10.1002/2016JG003342
Ward, N. D., Keil, R. G., Medeiros, P. M., Brito, D. C., Cunha, A. C., Dittmar, T., et al. (2013). Degradation of terrestrially derived macromolecules in the Amazon River. Nat. Geosci. 6, 530–533. doi: 10.1038/ngeo1817
Ward, N. D., Krusche, A. V., Sawakuchi, H. O., Brito, D. C., Cunha, A. C., Moura, J. M. S., et al. (2015). The compositional evolution of dissolved and particulate organic matter along the lower Amazon River-Obidos to the ocean. Mar. Chem. 177, 244–256. doi: 10.1016/j.marchem.2015.06.013
Whitman, W. B., Coleman, D. C., and Wiebe, W. J. (1998). Prokaryotes: the unseen majority. Proc. Natl. Acad. Sci. U.S.A. 95, 6578–6583. doi: 10.1073/pnas.95.12.6578
Zhao, Y., Tang, H., and Ye, Y. (2012). RAPSearch2: a fast and memory-efficient protein similarity search tool for next-generation sequencing data. Bioinformatics 28, 125–126. doi: 10.1093/bioinformatics/btr595
Keywords: Amazon River, metatranscriptomics, metagenomics, gene expression, biogeochemistry
Citation: Satinsky BM, Smith CB, Sharma S, Ward ND, Krusche AV, Richey JE, Yager PL, Crump BC and Moran MA (2017) Patterns of Bacterial and Archaeal Gene Expression through the Lower Amazon River. Front. Mar. Sci. 4:253. doi: 10.3389/fmars.2017.00253
Received: 28 April 2017; Accepted: 24 July 2017;
Published: 08 August 2017.
Edited by:
Chuanlun Zhang, Southern University of Science and Technology, ChinaReviewed by:
Achim Quaiser, University of Rennes 1, FranceBarbara J. Campbell, Clemson University, United States
Copyright © 2017 Satinsky, Smith, Sharma, Ward, Krusche, Richey, Yager, Crump and Moran. This is an open-access article distributed under the terms of the Creative Commons Attribution License (CC BY). The use, distribution or reproduction in other forums is permitted, provided the original author(s) or licensor are credited and that the original publication in this journal is cited, in accordance with accepted academic practice. No use, distribution or reproduction is permitted which does not comply with these terms.
*Correspondence: Mary Ann Moran, mmoran@uga.edu
†Present Address: Brandon M. Satinsky, Department of Civil and Environmental Engineering, Massachusetts Institute of Technology, Cambridge, MA, United States
Nicholas D. Ward, Marine Sciences Laboratory, Pacific Northwest National Laboratory, Sequim, WA, United States