Common Environment Policies in Different Sustainability Paradigms: Evidence From the Baltic, Adriatic, and Black Seas
 Fabio Zagonari
 Stella Tsani
 Sotiris Mavrikis
 Phoebe Koundouri
- 1Dipartimento di Scienze Economiche, Università di Bologna, Bologna, Italy
- 2Athens University of Economics and Business, Athens, Greece
- 3International Centre for Research on the Environment and the Economy, Athens, Greece
- 4Centre for Climate Change and Economic Policy, London School of Economics, London, United Kingdom
We develop a model for four sustainability paradigms (weak sustainability, a-growth, de-growth, strong sustainability) within a single framework that accounts for responsibility for nature and future generations and for intra- and inter-generational equality. The model is applied in three case studies: the Baltic, the Adriatic and the Black Sea with the aim to identify feasible sustainability solutions for shared seas under alternative sources of environmental pressure and cooperation strategies. The Baltic Sea is analyzed as an example of pollution from agriculture, the Adriatic Sea as an example of over-exploitation of fish in fishery, and the Black Sea as an example of pollution from industry. Empirical results show that different cooperation strategies are feasible in each case and that they yield different results in different context. Also welfare implications vary between different cooperation strategies. The main policy implication of the analysis is two-fold. Environmental conservation must be preferred to environmental innovation, where both intra- and inter-generational equity concerns are unessential. The choice of a different sustainability approaches must be combined with the feasibility of the differently required management institutions, while considerations of the sectoral sources of environmental pressure are essential.
Introduction
Four main sustainability paradigms have been suggested in the literature (Zagonari, 2016): weak sustainability, a-growth, de-growth, and strong sustainability. Two main value changes have been evoked to achieve sustainability: (i) a sense of responsibility for nature (Van der Werff et al., 2013; Pedersen, 2015) and future generations (Koukouzelis, 2012; Caselles, 2013) and (ii) an aversion to inequality with respect to current and future generations (Golub et al., 2013; Kopnina, 2016). Under weak sustainability, current generations meet their needs without considering future generations and their needs. In contrast, strong sustainability, assumes a development path that allows for future generations to access to the same amount of natural resources and the same environmental status as the current generation. A-growth refers to the ecological and economic strategy that is indifferent to economic level and growth as it considers it a non-robust and unreliable indicator of social welfare and progress. De-growth is an ecological and economic perspective that assumes a socially sustainable and equitable reduction. Note that the economic general equilibrium framework is similar to weak sustainability, whereas the ecosystem services framework is close to strong sustainability.
The purpose of this paper is to develop a model for the four sustainability paradigms (weak sustainability, a-growth, de-growth, strong sustainability) within a single framework that accounts for the two value changes: (i) a sense of responsibility for nature and future generations and (ii) aversion to intra- and inter-generational inequality, which could socially characterize each single country. The goal is to identify feasible sustainability solutions for a common environment that depend on value changes which could democratically (i.e., everyone is involved or has equal rights in the outcome achieved) support specific environmental policies in each country.
We employ our model in three case studies: the Baltic Sea, the Adriatic Sea and the Black Sea with the perspective of national actions and trans-boundary cooperation as set out in the Marine Strategy Framework (MSF) Directive of the European Union. The MSF Directive aims to achieve good environmental status of the EU's marine waters by 2020 as well as to protect the resource base upon which depend the marine-related economic and social activities. The MSF Directive is the first EU legislative instrument associated with the protection of marine biodiversity that makes explicit the regulatory objective of maintaining biodiversity in EU marine waters by 2020. The Directive puts in a legislative framework the ecosystem approach with the integration of environmental protection and sustainable use to the management of human activities that impact on the marine environment. The case studies are defined as regions in the Directive complying with certain geographical and environmental criteria and fall within the geographical boundaries of the existing Regional Sea Conventions.
Complying with the Conventions, countries falling within the specific marine regions cooperate with other neighbor countries with which they share the same marine waters. According to the MSF Directive in order to achieve good environmental status by 2020 each Member State has to develop a Marine Strategy that includes: the initial assessment of the current environmental status of national marine waters and the environmental impact and socio-economic analysis of human activities in these waters, the definition of good environmental status for national marine waters, the setting of environmental targets and indicators to achieve good environmental status by 2020, the setting of a monitoring programme for the continuous assessment and update of the targets and the development of a programme of measures so as to achieve and maintain the good environmental status by 2020.
We identify feasible sustainability solutions for the shared waters under alternative sources of environmental pressure associated with different sectors of production, i.e., agriculture, fishing and industry. Thus the Baltic Sea is analyzed as an example of over-concentration of nutrients (i.e., pollution) from agriculture, the Adriatic Sea as an example of over-exploitation of fish (i.e., resource) in fishery, and the Black Sea as an example of over-discharge of oil (i.e., pollution) from industry. The characterization of each case study follows recent studies and literature on the environmental status in each case. The Baltic Sea faces significant challenges associated to eutrophication (EEA, 2008, 2014) and surplus amounts of nutrients (mainly nitrogen and phosphorus)1. The Adriatic Sea is the northernmost waterbody of the Mediterranean Sea and has a significant impact on the national economies and specifically, the fishing sector of the countries within the region, due to its high diversity and quality of aquatic species (Severini, 2013). Nonetheless, the region suffers from poor fishing stocks as a result of unsustainable fishing practices (European Commission, 2017). The Black Sea suffers from numerous environmental issues with pollution having a primary negative impact on the sea's biodiversity, biological resources and ecology (REEFS, 2015).
We model and assess the different sustainability paradigms for the case studies of shared waters and we derive useful implications for the strategies to be followed and policy design. The model employed assesses the feasibility of alternative sustainability solutions for the shared marine environment, based on changes in values that support specific environmental policies in the relevant countries. The model results are characterized using the welfare changes on average and in each country respectively. The analysis offers both theoretical and empirical results. Alternative solutions are theoretically compared and the discussion is backed up by empirical findings in terms of efficiency, i.e., welfare changes.
The remainder of the paper develops as follows: section Methods and Data summarizes the methods and the data employed. Section Numerical Results presents the numerical results. General and case study specific insights are discussed in section Discussion. Last section concludes with some useful policy considerations.
Methods and Data
Methodology
Four sustainability paradigms are assessed: Strong sustainability, weak sustainability, a-growth and de-growth. This categorization follows Zagonari (2016) which operationalizes sustainability and discusses the derivation of the sustainability paradigms employed in this paper2. A summary of the assumptions employed in each case are provided in Table 1. The main assumptions behind weak sustainability (i.e., development that meets the needs of the present generation without compromising the ability of future generations to meet their own needs) can be summarized as follows (Schlör et al., 2015): needs are used as the unit of measurement, the same weights are used for current and future generations and there is unconditional substitution among current economic, social, and environmental forms of capital at both intra- and inter-generational levels.
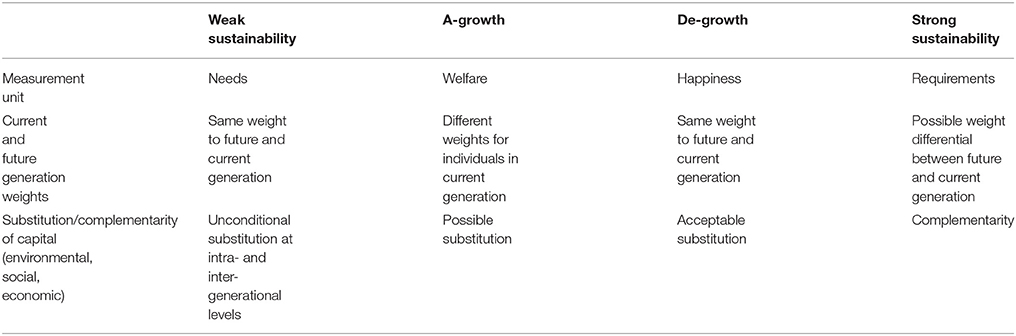
Table 1. Assumptions employed in the different sustainability paradigms.
A-growth is an ecological and economic strategy focused on indifference to or neutrality about the economic level and growth as a non-robust and unreliable indicator of social welfare and progress (Van den Bergh, 2010, 2011). It can be characterized as follows: welfare is used as the unit of measurement, as deduced from the aim of moving from wrong prices that result from the many neglected non-market transactions (e.g., informal activities and relationships) and the many unpriced environmental effects to right prices (i.e., prices that account for both non-market and unpriced values), different weights are used for individuals in current generations and substitution between forms of capital is possible.
De-growth is an ecological and economic perspective based on achieving a socially sustainable and equitable reduction (and eventually stabilization) of the materials and energy that a society extracts, processes, transports, distributes, consumes, and returns to the environment as wastes (Kallis, 2011; Kallis et al., 2012). It can be characterized as follows: happiness is the unit of measurement with a priority on meeting the needs of the poorest individuals, as deduced from the aim of introducing a basic income, same weight is assigned to current and future generations and substitution among forms of capital is acceptable.
The main assumptions behind strong sustainability (i.e., a development that allows future generations to access to the same amount of natural resources and the same environmental status as the current generation) (Jain and Jain, 2013) can be summarized as follows: requirements for some incommensurable categories as unit of measurement, possibly assignment of different weights to current and future generations, no substitution between current or future forms of capital and natural and physical or social capital considered to be complementary.
The sustainability paradigms identified above are formalized as follows: Let us assume that Ei identifies the per capita use of the shared environment by the current generation in country i3. The per capita equilibrium level consistent with the current population is η 4. Let us assume that Xi identifies the per capita consumption of the current generation in country i. Thus, the use of the environment for the current generation in country i is given by Ei = θi Xi, and for the future generation is given by EF = θF XF, where θi and θF represent the use of the environment for each consumption unit for the current generation in country i and for the future generation, respectively: θi will be set at current values based on the current technology, whereas θF is assumed to be the average of θi across all countries:
with n being the number of countries.
Two main sustainability conditions can be formalized. The weighted sustainability condition requires that use of the shared environment be weighted according to the proportions of the total population in the relevant countries (pi):EC = ∑piEi, where EC stands for the total weighted use of the shared environment by the current generation. The non-weighted sustainability condition requires that use of the shared environment be averaged between the representative individuals in each country:EC = 1/n∑Ei5. Thus, in terms of consumption levels, these sustainability conditions become, respectively: η = EC = ∑piθiXi and η = EC = 1/n∑θiXi. We use the non-weighted sustainability condition for strong sustainability to stress the equity access to natural resources and environment status for each individual; and the weighted sustainably condition for the other sustainability paradigms to stress the sustainability goal at the regional level. Let us assume that the utility for the future generation (UF) depends only on the consumption level:
Where αF represents the future preference for consumption, and it is assumed to be the average across all countries of the current preference for consumption, αi. Needless to say that this assumption tries to tackle operationally a theoretical problem behind sustainability paradigms referring to future generations. However, since we focus on preferences and technologies characterizing countries at a basin level, it seems to be plausible that some convergence between these countries could be observed in the future. We assume that use of the environment is in a long-run equilibrium so that people do not need to feel a duty to preserve the environment for subsequent generations.
Let us assume that the welfare of the current generation in country i (Ui) depends on the consumption level, the current use of the shared environment, and the welfare of the future generation:
Where αi represents the current preference for consumption in country i, βi represents the degree of concern for nature, and γi represents the degree of concern for future generations. In other words, each country is assumed to be concerned about the shared environment (i.e., EC) rather than about its own environment (i.e., Ei). Note that βi has a negative sign because this parameter is applied to the use of the environment, and a larger degree of concern for nature applied to a larger use of the environment must reduce welfare.
Let us assume that a representative individual in the current generation is concerned about welfare inequality between countries:
Where ε is the degree of aversion to intra-generational inequality (Asheim et al., 2012). Thus, the overall utility is given by:
Where ζ is the degree of aversion to inter-generational inequality. Alternatively, a representative individual in the current generation could be concerned about inequality in use of the shared environment between countries:
Thus, the overall welfare would be given by:
Alternative cooperation options are considered. In a non-cooperative context countries develop individual polices and aim for own welfare maximization as a best response to what other countries sharing the same environmental good do. This situation corresponds to a Nash equilibrium for each country's welfare. In this scenario each country attempts to maximize its own welfare rather than overall welfare. In the cooperative option countries develop common polices and approaches with the aim to maximize overall country group utility as opposed to individual country or group utility6. Many theoretical definitions of the four sustainability paradigms can be suggested (Aznar-Marquez and Ruiz-Tamarit, 2016). Here, the analytical definitions summarized in Table 2 are applied7. Note that needs in weak sustainability, welfare in a-growth, and happiness in de-growth are all operationally represented by U.
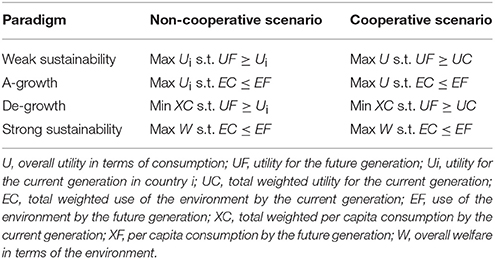
Table 2. Analytical definitions of the four sustainability paradigms.
Each parameter attached to an item of the Cobb-Douglas utility function (e.g., α to consumption, β to the environment, γ to the welfare of future generations) can be related to the current proportion of the budget spent to purchase it. Thus, the following notation applies:
• α = % expenditures in consumption
• β = % expenditures in environmental conservation
• γ = % expenditures in environmental R&D
Coefficients of Cobb-Douglass are normalized so that initial α = 1 − β − γ. Thus, the following changes are focused:
• dβ = change in value attached to environment or change in expenditures in environmental conservation
• dγ = change in value attached to future generations or change in expenditures in environmental R&D
The approach employed here allows for the identification of the optimal strategies to be followed in the context of shared environments and binding directives (such as the MSF Directive) considering different sectoral drivers of pressures on the shared seas (agriculture, industry and fishing as pollution source). The methodology considers the implications of environmental free-riding, i.e., not all individuals pay for the consequences of environmental use by going deeper into the sectoral sources and implications of it. The methodology allows for the explicit incorporation of sustainability and equity considerations in the analysis allowing thus for the identification of democratic, i.e., everyone is involved or has equal rights in achievement of sustainability. Toward this end the analysis does not consider the different economic and policy instruments with which sustainable solutions can be achieved, neither the ambiguity associated with the different options and this is something future research should address. The analysis though offers insights on the efficient approach that needs to be considered in each case with regards to the balance between environmental conservation and wellbeing of present and future generations.
With regards to the data approaches employed in the paper: Many indicators are suggested by the UE Marine Strategy Framework to assess the environmental status of a sea (Borja et al., 2011). We refer to:
(i) Concentration of contaminants (like nitrogen and phosphorous) for the Baltic Sea, as linked to the agriculture sector (item 5 in Borja et al., 2011)
(ii) Exploitation of fish and shellfish for the Adriatic Sea, as linked to the fishery sector (item 3 in Borja et al., 2011)
(iii) Concentration of contaminants (oil, chemical products, etc.) for the Black Sea, as linked to the industry sector (item 8 in Borja et al., 2011)
Unfortunately, these detailed data are not available for all countries included in the study. To overcome this limitation we use the sustainability indicators developed by the UN. Specific data and characterization for each case study are discussed in the following subsections.
Data
Baltic Sea
The Baltic Sea remains one for the world's largest brackish water areas inhabited by both marine ad freshwater species8. Countries sharing waters include: Denmark, Estonia, Finland, Germany, Latvia, Lithuania, Poland, Russia and Sweden9. The region hosts around 85 million people, the activities of which impact on the status of the Baltic Sea10. Due to the limited level of water exchange, nutrients and other substances from the drainage area accumulate in the Baltic Sea and are only slowly diluted. Over-concentration of nutrients from agriculture remains one of the most important problems the Baltic Sea is faced with. Agriculture is responsible for approximately 75% of total nutrient input in the Baltic Sea (HELCOM, 2011) accounting for 90 and 70% of nitrogen and phosphorus discharge, respectively11.
Some of the top performers in environmental policy and Sustainable Governance Indicators are located in the region (Sweden, Germany and Denmark) (SGI, 2017). Sweden's response to the pollution of the Baltic Sea as a result of intensive agriculture has been swift (see for instance the establishment of the Environmental Objectives Council to develop policies related biodiversity, toxicity and preservation of the natural environment)12. Germany is considered as a global leader in environmental policy performing well in terms of biodiversity, water and energy. The biggest challenge it currently faces is to significantly reduce its concentrations of particulate matter and NO2, O3 (SOER, 2015). One of the country's greatest recent achievements in the field was to officially adopting the UN sustainable development goals (SOER, 2015; BMUB, 2017; SGI, 2017).
At the same time activities driven by lower quality in environmental policies in Russia and Poland also impact on the developments in the Baltic Sea (SGI, 2017). Poland has taken a number of measures to reduce one of the country's biggest environmental challenges, which is effective wastewater treatment & agri-environmental protection. Poland's National Strategic Plan (NSP) and new Rural Development Programme (RDP) have significantly improved wastewater treatment leading to a considerable reduction of nutrient discharges into the Baltic Sea. Russia's biggest environmental concern remains water pollution from agricultural, waste, with the country being a major polluter of the seas (Black, Caspian, Azov, etc.) that surround it (NIC, 1999). Unsustainable agricultural practices (overgrazing, unrestricted harvesting) that date back to the Soviet Union era, which did not prioritize environmental protection policies, have resulted in considerable quantities of chemicals and fertilizers contaminating nearby waters (Word Bank Group, 2002; OECD, 2008). While there has been an initiative to promote environmental policy in the country, effectuation remains a significant obstacle due to political instability and mistrust associated with the government (OECD, 2006; FAO, 2017b; Newell and Henry, 2017).
Estonia's environmental policies are in accordance with international standards, yet effectuation remains an obstacle, due to insufficient expertise, lack of funding, meager social acceptance and fear of job-loss (Kraus and Amtsberg, 1998). Agricultural practices are regulated by the Baltic Sea Action Plan (BSAP) which tackles eutrophication, protects biodiversity and reduces hazardous waste (HELCOM, 2007). In order to minimize nutrient pollution from agricultural practices, the country has implemented the Water Act, along with the River Basin Management Plans and Nitrates Action Program (NAP), which targets a nitrogen discharge reduction and ultimately total elimination of eutrophication (FAO, 2016).
Following the dissolution of the Soviet Union and the tough transitional period that ensued, it can be claimed that environmental policy is not a priority for Lithuania. Low priority in environmental policies adds to the impact of inadequate environmental leadership and financial resources (Kraus and Meyer, 1998; SGI, 2017). Nonetheless, the country was involved in the Baltic Sea Region Programme, and is actively participating in the follow up, Interreg Baltic Sea Region Programme, which aims at reducing nitrogen and phosphorus discharges.
For the Baltic region countries population data and per capita GDP13 (see Table 3) are from the World Bank, World Development Indicators database, whereas the share of agriculture to GDP figures are from OECD data14. For the estimation of the consumption of domestic agricultural products as a percentage of GDP we have made use of the OECD Input-Output tables and include consumption figures for agriculture, hunting, forestry and fishing as a percentage of gross output production (at basic prices)15.
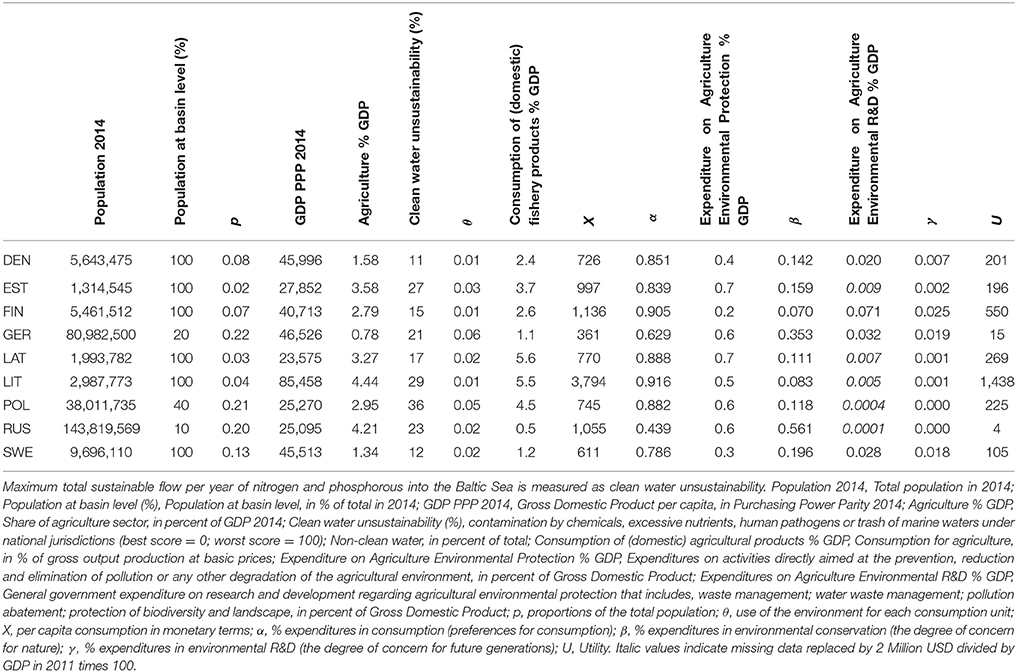
Table 3. The dataset for the case study in the Baltic Sea.
Data on Expenditure on Agriculture Environmental Protection have been extracted from Eurostat: and regard figures on total general government expenditure on environmental protection (in % of GDP) (Eurostat, 2017). Figures on Expenditures on Agriculture Environmental R&D are obtained from Lowder et al. (2012)16. Due to data scarcity, in order to complete the dataset, we used data on 2012 instead of 2014 for Lithuania, and we assumed that Russia shows the same percentage of expenditure on Agricultural R&D as Poland.
Adriatic Sea
Countries sharing the Adriatic Sea, that is part of the Mediterranean Sea, include Albania, Croatia, Italy, Montenegro, Serbia, and Slovenia17. Unsustainable fishing and overexploitation has led to the stock-depletion of several of the 450 species that live in the Adriatic (Houde et al., 1999). Measures have already been taken, for instance fishing vessels have been drastically reduced (Tsikliras et al., 2015). Trawling at depths of more than 1 km was also banned by the General Fisheries Commission for the Mediterranean; however, a business-as-usual approach will have continuous, negative consequences for the region's biodiversity, food-webs and ecology (WWF, 2015).
Countries in the Adriatic region rank relatively low in terms of environmental policy. Italy's last financial crisis diminishes and deprioritizes environmental policy (SGI, 2017). In Croatia environmental policies are regulated and monitored by the European Commission, however implementation continues to face obstacles like insufficient amount of data and a lack of cooperation from all relative stakeholders (UNECE, 2013; SOER, 2015). Albania has taken steps toward improving coastal water quality and increase public awareness about the effects of climate change, however further progress is required if the country is to achieve its ambition of gaining membership into the European Union (IEP, 2015; SOER, 2015). Montenegro has a number of national environmental programmes in place which tackle significant country-specific issues regarding biodiversity (Strategic Plan for Biodiversity). In Serbia factors associated to the last financial crisis, political instability and lack of environmental protection are all obstacles for substantial environmental progress (Nadić, 2011). As an exemption to the region, Slovenia receives a high ranking in terms of environmental protection, with a top 20 ranking worldwide (SGI, 2017). The country has also taken action regarding water quality and biodiversity protection (SOER, 2015).
In accordance to EU laws, countries in the region should adhere to strict rules and regulations, related to fisheries and aquaculture within the Adriatic region, that include: national fishing licenses (commercial and recreational), transboundary conservation measures, prohibited fishing zones, fishing method guides, a list of protected and endangered species, and monitoring, control and surveillance (MSC) programmes (FAO AdriaMed, 2017).
For the Adriatic region population data have been extracted from the World Bank, World Development Indicators18. Data on the share of fishing output as a percentage of GDP are extracted from FAO (2017a). Data on Slovenia are obtained from official national reports19. Data was not available for Albania. In order to complete the dataset, we assumed that Albania records the same percentage of fishery on GDP as Croatia and Slovenia. Montenegro's and Serbia's fishing industries account for a very small percentage of the GDP, therefore a value of 0.1% is used.
Figures on consumption of domestic fishery products are estimated with the use of figures of the OECD Input-Output on Agriculture, Hunting, Forestry and Fishing (OECD, 2017)20. For Croatia the respective figure is calculated following the report of Soullard and Bencetić (2016) 21. We assumed that consumption of fishery in Albania is the same as Montenegro and in Serbia as an average between Croatia and Slovenia. Data on Expenditure on fishery Environmental Protection and Expenditures on fishery Environmental R&D are obtained from Eurostat database (Eurostat, 2017)22.
Black Sea
The inland Black Sea23 spreads between Bulgaria, Georgia, Romania, Russia, Turkey and Ukraine. Key issues that the Black Sea region faces include: chemical and oil pollution, biodiversity loss, eutrophication and marine habitat changes (CPBSAP, 2009; SOER, 2015). Chemical pollution has been recognized as the biggest challenge the Black Sea area faces, with frequent oil discharges from ships and poorly-managed wastewater, as well as the release of heavy metals such as lead, chromium, cadmium and copper from industrial activity and coal combustion (Black Sea SCENE, 2017). The Black Sea Commission (BSC) in association with the International Commission for the Protection of the Danube River (ICPDR) has enforced a number of protocols to reduce pollution and preserve the region's environment, with some positive results recorded, but more work needs to be done on a consistent basis in order to achieve the environmental conditions observed in the past (CPBSAP, 2009; Cogălniceanu, 2011; ICPDR, 2017)24.
Bulgaria and Romania are included in the top 20 countries, globally, concerning environmental policy (SGI, 2017). Bulgaria's priorities concentrate on protecting biodiversity (SOER, 2015). The two countries still face obstacles in policy development and implementation due to corruption, infringements and lack of funding (SGI, 2017). Turkey is ranked as the poorest of performers concerning the implementation of environmental policy due to its political instability of the last years (SGI, 2017).
For the Black sea region population data are from World Bank, World Development Indicators (Table 5). The share of industry in GDP and Expenditures on Environmental R&D figures are obtained from the World Bank database (World Bank, 2017), Eurostat (Eurostat, 2017) and (Knoema, 2017). Consumption of domestic industry products is calculated from the OECD Input-Output Tables (OECD, 2017)25. Data on Expenditures on industry Environmental R&D are obtained from Eurostat (2017); World Bank (2017) and Knoema (2017). Data was missing for Georgia. Thus, in order to complete the dataset, we assumed that percentage of expenditures on industry R&D in Georgia is the same as in Bulgaria.
Numerical Results
We define sustainability as 10% unsustainability, i.e., unsustainability indicators with regards to clean water and fish catchment, where 0 and 100 depict the best and worst scores respectively (see Tables 3–5 for definitions), do not exceed 10%. Note that weighted averages of unsustainability are 22, 33, and 29% in Baltic, Adriatic and Black Sea, respectively. Moreover, we assume that weighted averages of required changes in β and in γ must be positive. Finally, we assume that required changes in β and in γ in each country cannot be larger than 100 times the current level (i.e., + or – 10,000 %).
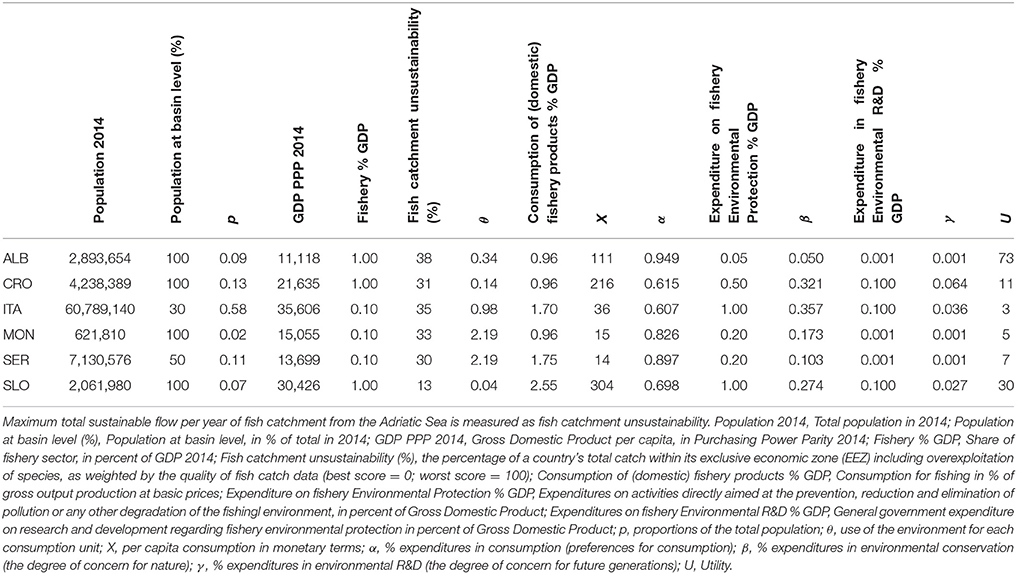
Table 4. The dataset for the case study in the Adriatic Sea.
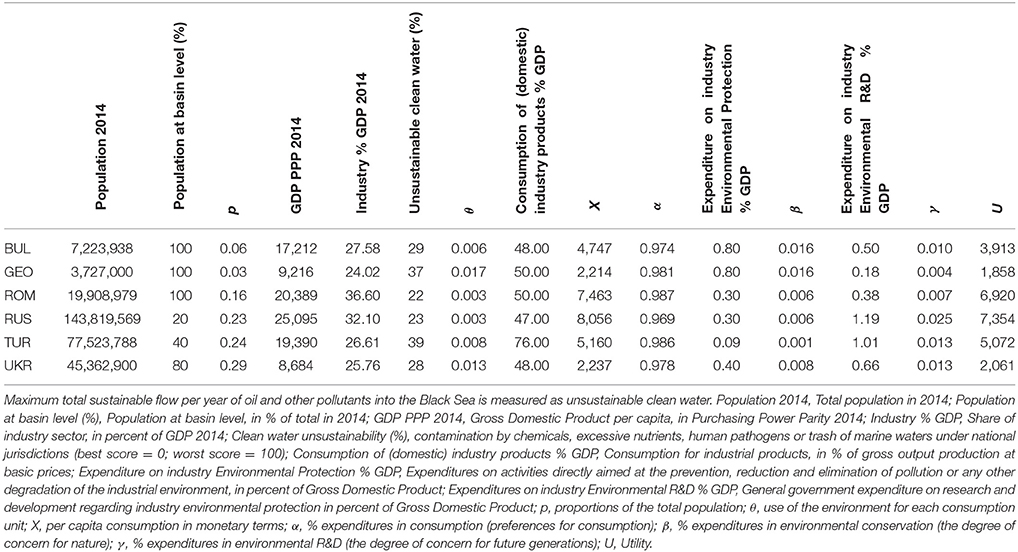
Table 5. The dataset for the case study in the Black Sea.
Baltic Sea
If a non-cooperative approach is adopted (Table 6) strong sustainability can achieve sustainability with the smallest welfare burden (dU = −0.21), with Denmark and Russia increasing welfare. Relative larger welfare change burden is recorded for Lithuania, Estonia and Poland indicating that countries in the group lacking behind in economic terms might suffer more in terms of welfare loss in the case of a non-cooperative approach. De-growth with change in expenditures in environmental conservation (dβ) could also be considered, although the weighted average of dβ is negative, since it is more efficient than strong sustainability (i.e., dU = 7.08).
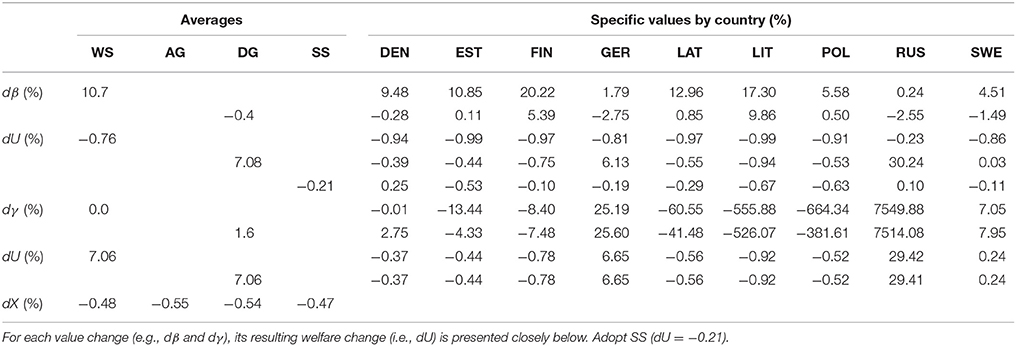
Table 6. Baltic Sea: non-cooperative solutions.
If a cooperative approach is adopted (Table 7), weak sustainability with changes in environmental conservation (dβ) and without inequality aversions (ε = 0, ζ = 0) is suggested as in this case are recorded net welfare gains (dU = 3.10), with Germany and Russia decreasing their environmental conservation and increasing their welfare. Note that the weighted average of dβ for weak sustainability is 5.0 (the non-linear average is 7.0) and standard deviation of dU is 5.4126.
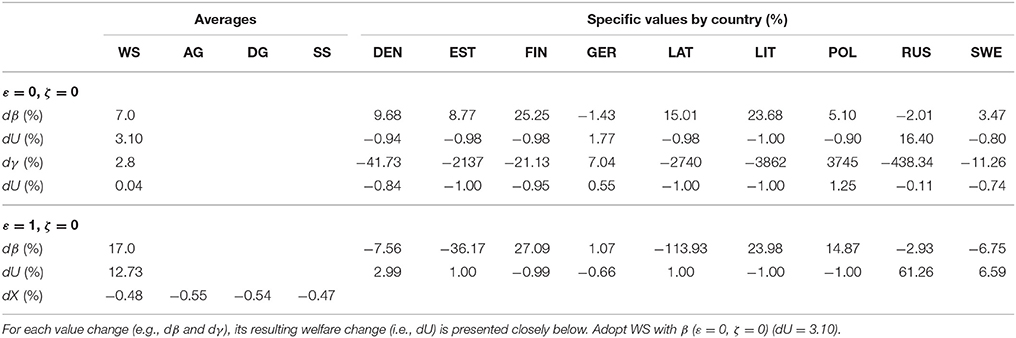
Table 7. Baltic Sea: cooperative solutions.
Adriatic Sea
If a non-cooperative approach is adopted (Table 8), strong sustainability is suggested (dU = −0.34), although in this case Italy maintains its welfare if weak sustainability with changes in value attached to environment or change in expenditures in environmental conservation (dβ) is implemented (dU = −0.37). Note that a-growth with change environmental conservation could also be considered, since it is more efficient than strong sustainability (i.e., dU = −0.26), although the weighted average of dβ is 140.1. Moreover, the weighted average of dβ for weak sustainability is 3.6 (the non-linear average is 12.7). Finally, standard deviation of dU for strong sustainability and weak sustainability are 0.21 and 0.34, respectively.
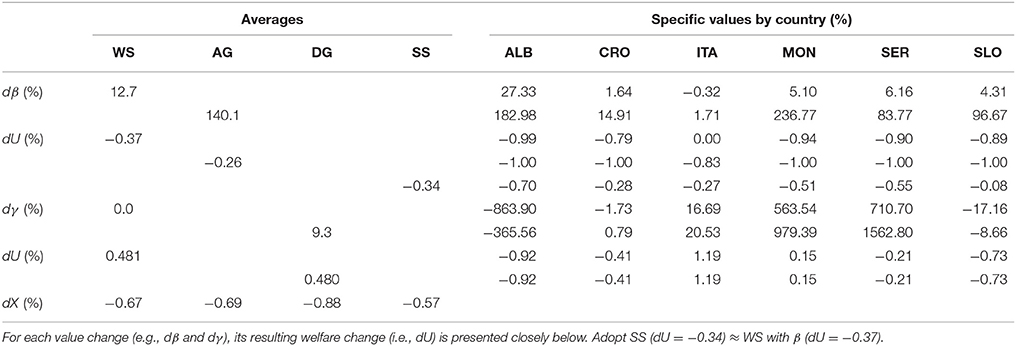
Table 8. Adriatic Sea: non-cooperative solutions.
If a cooperative approach is adopted (Table 9), weak sustainability with changes in value attached to environment or change in expenditures in environmental conservation (dβ) and without inequality aversions (ε = 0, ζ = 0) is suggested, with Italy decreasing its environmental conservation and increasing its welfare.
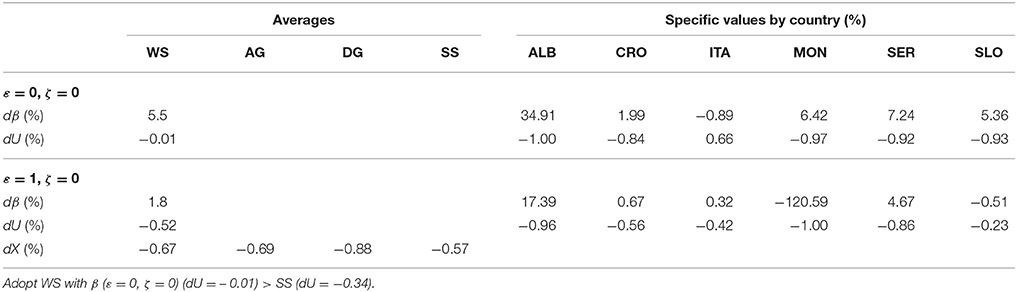
Table 9. Adriatic Sea: cooperative solutions.
Note that an intra-generational equity approach (ε = 1, ζ = 0) could be adopted, by reducing Montenegro specificities, although it is less efficient (dU = −0.52) as compared to the case of no inequality aversions (ε = 0, ζ = 0). Moreover, the weighted average of dβ for weak sustainability is 4.2 (the non-linear average is 5.5). Finally, standard deviation of dU for weak sustainability is 0.60.
Black Sea
If a non-cooperative approach is adopted (Table 10), strong sustainability is suggested (dU = −0.64). Note that de-growth with changes in expenditures in environmental conservation (dβ) and weak sustainability with change in value attached to future generations or change in expenditures in environmental R&D (dγ) could also be considered, although these are less efficient (dU = −0.71). Moreover, the weighted average of dβ for de growth is 12.5 (the non-linear average is 8.5), whereas the weighted average of dγ for weak sustainability is 2.3 (the non-linear average is 0.0). Finally, standard deviation of dU is 0.17 for both de-growth with environmental conservation expenditures (β) and weak sustainability with expenditures in R&D (γ). In the case of cooperative approach, results show that no feasible (Table 11) solutions can be obtained. Indeed, the required changes in β are larger than 100 times the current level in 4 out of 6 countries.
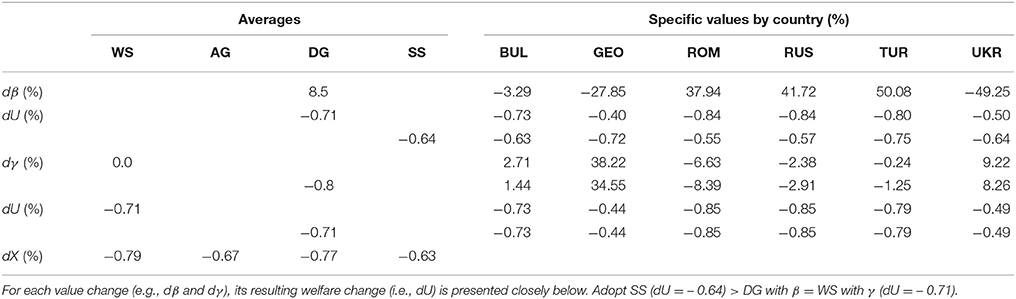
Table 10. Black Sea: non-cooperative solutions.
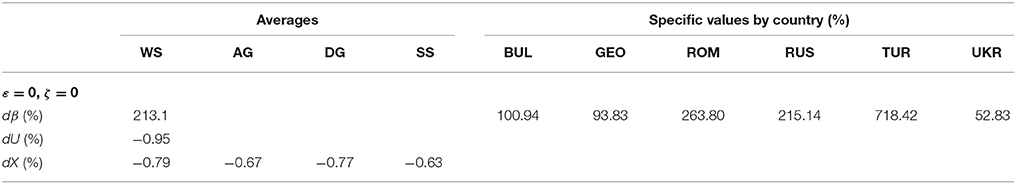
Table 11. Black Sea: cooperative solutions.
Discussion
Based on the analysis of the different cases studies we derive several general but also country specific insights. As a general observation, the change in the value attached to the environment or environmental conservation is positive (dβ > 0) if and only if the change in the value attached to future generations or change in expenditures in environmental R&D is negative (dγ < 0). This is the case in Black Sea where some countries must invest in environmental conservation and some countries must invest in environmental R&D (e.g., Romania, Russia and Turkey must invest in preservation, whereas Bulgaria, Georgia and Ukraine must invest in R&D). From the same case study of the Black sea, if follows that the value of environmental conservation is higher than the value attached to future generations. Thus investing in environmental preservation is less effective than investing in environmental R&D (e.g., a redistribution of investment in R&D (dγ = 0) and an increase in preservation (dβ = 8.5) produce the same dU = −0.71).
In case where a cooperative approach is adopted, inter-generational equity (ε = 0, ζ = 1) should not be used. Intra-generational equity (ε = 1, ζ = 0) can be used in the case of countries being similar (e.g., Montenegro in Adriatic Sea). If weak sustainability within a cooperative approach is adopted, some countries might gain and some countries might lose (e.g., Baltic Sea, Adriatic Sea). The analysis of different sustainability paradigms suggests the adoption of same policies across countries, for instance policies targeting R&D and future generations in the weak sustainability and de-growth paradigms in the Black Sea.
The welfare reduction could be smaller than reduction in consumption to achieve sustainability if a value change is applied (e.g., 3.10 > −0.21 in Baltic Sea, −0.01 > −0.34 in Adriatic Sea). Overall an a-growth strategy is not suggested while strong sustainability approaches can be welfare improving as shown by the results for Denmark and Russia in the Baltic Sea.
Specific insights obtained for the Baltic and the Adriatic Seas indicate that the weak sustainability paradigm in cooperative solutions with dβ and without inequality aversions (ε = 0, ζ = 0) is more efficient than strong sustainability in non-cooperative solutions (i.e. for the Baltic countries dU = 3.10 in cooperative solutions with ε = 0, ζ = 0 as compared to dU = −0.21 with strong sustainability in non-cooperative solutions. For the Adriatic Sea countries the values are dU = −0.01 in cooperative solutions without inequality aversions (ε = 0, ζ = 0) and dU = −0.34 with strong sustainability in non-cooperative solutions. For the Adriatic sea the weak sustainability paradigm in cooperative solutions is preferred even after comparison with the case of weak sustainability with changes in environmental expenditure (β) in non-cooperative solutions (dU = −0.37). For the Black Sea strong sustainability in non-cooperative solution is more efficient than weak sustainability with expenditures in R&D (γ) in non-cooperative solutions (dU = −0.64>dU = −0.71).
Note that combining results for the Baltic Sea from the whole approach used in Zagonari (2017) and results from the sectoral approach focused on agriculture applied here leads to interesting insights: in case of a whole approach, strong sustainability should be chosen and all countries must reduce utility. Other options, in particular weak sustainability with positive changes in the value attached to the environment or environmental conservation, are not feasible. In the case where a sectoral approach is applied, if strong sustainability is adopted, then the weighted average utility change is the same at −21%, but Russia and Denmark gain. However if weak sustainability is adopted with change in environmental conservation (dβ), then the weighted average utility change is at +3.10, and Russia and Germany gain.
Thus, a sectoral approach focused on agriculture suggests cooperation (and weak sustainability with environmental conservation, whereas a whole approach suggests non-cooperation (and strong sustainability). In other words, HELCOM can go on with its current approach (strong sustainability for the whole economy), but it could also decide to move to a sectoral approach, i.e. weak sustainability with environmental conservation focused on agriculture. In this case two potential issues draw attention. The first regards the compensation mechanisms (e.g., from Russia and Germany to other countries) and the second regards the presence and adequacy of the cooperative institutions (e.g., from Ministries to other agricultural stakeholders).
Several insights can be obtained from a cross-case study analysis of the previous results (summarized in Table 12). First, the required reduction of welfare depends on the case study to a greater extent than on the adopted approach or paradigm. In particular, where the unsustainable sector accounts for a larger proportion of GDP (like industry in the Black Sea), achieving sustainability is more demanding than where the unsustainable sector accounts for a smaller proportion of GDP (like fishery in the Adriatic Sea and agriculture in the Baltic Sea).
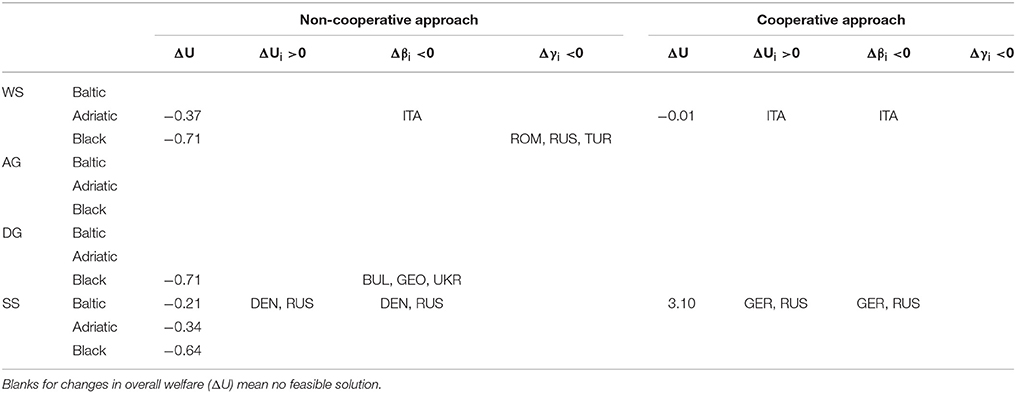
Table 12. Challenging results: countries improving welfare (i.e., ΔUi> 0); and countries expected to implement anti-environmental policies (i.e., Δβi <0 and Δγi <0).
Second, SS is better linked to non-cooperative approach (i.e., each country must achieve sustainability by reducing Ei, so a cooperative approach is useless), whereas WS (with ε = ζ = 0) is better linked to a cooperative approach (i.e., if you maximize the total welfare U, a Nash equilibrium represents a constraint). DG is likely to be linked to a non-cooperative approach (i.e., each country must achieve sustainability by reducing Xi, so a cooperative approach is useless), whereas AG is never feasible (i.e., getting “prices right” seems to be inadequate). Note that the 3 out of 6 anti-environmental policies obtained in the Black Sea for WS (i.e., ROM, RUS, TUR) and for DG (i.e., BUL, GEO, UKR) are impracticable, whereas the 1 out of 6 in the Adriatic Sea (i.e., ITA) and the 2 out of 9 in the Baltic Sea (i.e., DEN and RUS for non-cooperative SS and GER and RUS for cooperative SS) are realistic.
Third, SS is likely to be matched with an increase in environmental protection (i.e., the reduction of Ei is triggered by an increase in βi), whereas WS might be matched with an increase in environmental R&D (i.e., the reduction of Ui is compensated by an increase in γi).
Forth, a non-cooperative approach is less effective than a cooperative approach, if any (i.e., it is unlikely if the unsustainable sector accounts for a large proportion of GDP), although a cooperative approach requires redistributive policies (i.e., the total welfare is maximized, but there are gainers and losers).
In summary, if the unsustainable sector accounts for a large proportion of GDP, SS must be adopted. In contrast, if the unsustainable sector accounts for a small proportion of GDP, either SS or WS, by bearing in mind that a cooperative approach is more efficient but it requires complementary redistributive policies.
Conclusions
Our analysis provides several insights about the sustainability paradigms in shared waters under alternative sectoral sources of environmental pressures and cooperation strategies. Different solutions can support sustainability with different implications on welfare and burden sharing. From an optimal strategy perspective, results indicate that alternative approaches, and not necessarily only cooperative ones, can work toward a sustainable use of the shared waters. Cooperative and non-cooperative approaches are feasible in the Baltic and Adriatic Seas while only non-cooperative approaches are feasible in the Black sea. In non-cooperative approaches strong sustainability paradigms incur the smallest welfare loss on average. In this case, countries such as Denmark and Russia gain in terms of welfare. However it should be noted that in non-cooperative approaches, strong sustainability might incur a higher burden in terms of welfare losses for the smaller countries. In a non-cooperative solution, de-growth can also be considered for the Baltic Sea countries with changes in expenditures in environmental conservation as it incurs larger welfare gains. In cooperative approaches in the Baltic and the Adriatic seas weak sustainability with changes in environmental conservation and without inequality aversions result in group welfare gains with Germany, Russia and Italy decreasing their environmental conservation and increasing their welfare.
The identification of alternative optimal strategies in alternative contexts indicates the differentials in terms of environmental and intra-generational policies adopted in each case and the available knowledge and capital to address environmental issues in each country and region. The alternatives identified here as the most efficient ones indicate that both cooperation and non- cooperation can be an option. These findings point to the need to look more thoroughly at the cooperation requirements of neighboring countries as envisaged in the MSF Directive and already taking place within the geographical boundaries of the existing Regional Sea Conventions. The Directive specifies that Member States utilize the existing regional cooperation structures to coordinate among themselves and their actions with those of third countries in the same region or sub-region. In terms of designing and implementing the optimal marine policies non-cooperation can also be considered as a valid alternative. In this case the issue of institutional capacity requires attention with regards to allocation of burden sharing and benefits across countries.
The policy implications of our analysis are important suggesting the need to take into consideration the sources of environmental pressure on the shared seas, the inter- and intra-generational allocation of any gains and losses, the cooperation alternatives and the importance of institutions to the sustainable management policies. Environmental conservation must be preferred to environmental innovation, where both intra- and inter-generational equity concerns are unessential. The choice of a different sustainability approach must be combined with the feasibility of the differently required management institutions. Policy making needs to identify and employ the appropriate economic tools and institutions that can address sustainability concerns but also intra- and inter-generational equity concerns in terms of burden and benefit allocation between smaller and larger economies taking into account at the same time the “polluters' pay principle”. In this respect the identification and appropriate designs of the cooperative institutions remains equally important.
Author Contributions
FZ developed the model and performed simulations. SM collected data. ST and PK presented cases studies and discussed results.
Conflict of Interest Statement
The authors declare that the research was conducted in the absence of any commercial or financial relationships that could be construed as a potential conflict of interest.
The handling editor declared a large-scale project collaboration with one of the authors PK, and confirms the absence of any other professional relationship or collaboration.
Supplementary Material
The Supplementary Material for this article can be found online at: https://www.frontiersin.org/articles/10.3389/fmars.2018.00216/full#supplementary-material
Footnotes
1. ^In addition to organic material, nutrients that are discharged into the Baltic Sea, result in the excessive growth of algae, phytoplankton and other aquatic plants, leading to decreased light conditions in the water, oxygen depletion, water turbidity and alterations in the composition of species (see HELCOM, 2007; WWF, 2017).
2. ^For a detailed discussion and links to sustainabilty theory see Zagonari (2016) and references therein.
3. ^Per capita use of the shared environment is defined as the percapita consumption of the environmental good under question, i.e., fish catchment, clean water, etc.
4. ^We obtained population figures at the basin level by applying the following percentages to the total population figures: 20 for GER, 40 for POL, 10 for RUS in Baltic Sea; 30 for ITA; 50 for SER in Adriatic Sea; 80 for UKR, 40 for TUR, 20 for RUS in Black Sea.
5. ^Following the definition of representative agent in economics we assume here all individuals are identical and can be thus modeled by a representative agent.
6. ^Discussion on Nash equilibrium and common utility maximization extends beyond the purpose of this paper. To save space and make the discussion easier to follow for the readers we refer to the wide literature on game theory and social utility for a detailed analysis of the concepts.
7. ^Analytical solutions are detailed in the Appendix.
8. ^See: http://stateofthebalticsea.helcom.fi/in-brief/summary-of-findings/
9. ^See: http://www.newworldencyclopedia.org/entry/Baltic_Sea
10. ^Data availability does not allow for the estimation of resource use by country. The same applies for the Adriatic and Black Sea.
11. ^The Baltic Sea Action Plan aims at reducing and halting nutrient diffusion in the Baltic Sea waters via agri-environmental measures, though visible and long-lasting results will require a strong level of commitment and a long period time (HELCOM, 2007, 2011).
12. ^See: http://www.miljomal.se/Global/24_las_mer/broschyrer/2016/Swedens-environmental-objectives.pdf
13. ^Note that sectoral per capita GDP will be 4-digit figures for industry in the Black case study, 3/4-digit figures for fishery in the Baltic case study, and 2/3-digit figures for fishery in the Adriatic case study. We discuss next the particularities and data for each case study.
14. ^See http://www.oecd-ilibrary.org
15. ^A percentage exclusively for agriculture itself is not assumed in order to avoid inaccuracies and/or miscalculations. Household consumption as a percentage of GDP from Eurostat was also considered but ultimately not utilised, as there is no distinction between agricultural products, food and non-alcoholic beverages (OECD, 2017).
16. ^Countries with Agriculture Environmental R&D spending of below $2 million, are not presented in the report. This could refer to values between 0.0001 and 0.01% for countries such as Estonia, Russia, Poland etc. and therefore, for the sake of the model, $2 million is divided by the 2011 GDP of the respective country, in order to come up with an indicative hypothetical and maximum value for those countries.
17. ^http://www.newworldencyclopedia.org/entry/Adriatic_Sea
18. ^http://data.worldbank.org
19. ^Information on Slovenia was derived the country's official website (http://www.slovenia.si/). where it is stated that around 2% of the GDP is invested in Agriculture, Fishing and Forestry. It is assumed that Agriculture would make up the majority of that percentage and therefore it is considered that an estimation of around 0.1–1.0% would be appropriate for the fishing industry.
20. ^In general, data on domestic fish consumption as a percentage of GDP is very scarce, and therefore an estimation between 1.0 and 3.0% for each country, falls in line with data available for countries within the region.
21. ^Calculations are based on what the average person spends on fish per year, the population of Croatia and the country's GDP. In general, data on domestic fish consumption as a percentage of GDP is scarce, however an estimation between 1.0 and 3.0% seems to be appropriate.
22. ^The countries in the region record very low levels of environmental R&D spending. Thus for modelling purposes a distinction is made for biodiversity protection and therefore a minimum value is used. For Environmental Protection, the total value is used, as no distinction is made between the subsections.
Subsections for total environmental protection include: Waste management; wastewater management; pollution abatement; protection of biodiversity and landscape; R&D environmental protection; Environmental protection nec. So, for fishery environmental R&D, the biodiversity protection value is used, as the R&D Environmental Protection value is zero. For Expenditure on fishery Environmental Protection, the whole value is used, as we consider waste, wastewater, biodiversity and pollution all important aspects within the fishery sector. To complete the dataset we fixed the percentage of expenditures on fishery R&D at a tiny value for Albania, Montenegro and Serbia.
23. ^http://www.newworldencyclopedia.org/entry/Black_Sea
24. ^Programmes implemented to deal with these issues include the Black Sea Strategic Action Plan, as well several research projects regarding fisheries and coastal management (see CPBSAP, 2009; SOER, 2015; for details). The six countries around the Black Sea, have made joined efforts in association with the ICPDR and Black Sea Scene to combat pollution flow into the sea, as a result of heavy industry, dating back to the Soviet Union. All six countries have also signed the Convention on the Protection of the Black Sea against Pollution, another measure aimed at reducing spillage into the region's surface waters (CPBSAP, 2009).
25. ^The following sectors have been included in industry: Food products, beverages and tobacco; Textiles, textile products, leather and footwear; Wood and products of wood and cork; Pulp, paper and paper products, printing and publishing; Coke, refined petroleum products and nuclear fuel; Chemicals and chemical products; Rubber and plastics products; Other non-metallic mineral products; Basic metals; Fabricated metal products; Machinery and equipment nec; Computer, Electronic and optical equipment; Electrical machinery and apparatus, nec; Motor vehicles, trailers and semi-trailers; Other transport equipment; Manufacturing, recycling nec; Electricity, gas and water supply.
26. ^To save space and make it simpler for the readers to focus on results standard deviation figures are not reported in tables. Authors can make them available upon request.
References
Asheim, B., Mitra, T., and Tungodden, B. (2012). Sustainable recursive social welfare functions. Econ. Theory 49, 267–292. doi: 10.1007/s00199-010-0573-7
Aznar-Marquez, J., and Ruiz-Tamarit, J. R. (2016). Environmental pollution, sustained growth, and sufficient conditions for sustainable development. Econ. Model. 54, 439–449. doi: 10.1016/j.econmod.2016.01.017
BMUB (2017). The 2030 Agenda for Sustainable Development. Available online at: http://www.bmub.bund.de/en/topics/sustainability-international/sustainability/2030-agenda/
Black Sea SCENE (2017). Major Problem Areas. Available online at: http://www.blackseascene.net/content/content.asp?menu=0040034_000000
Borja, A., Galparsoro, I., Irigoien, X., Iriondo, A., Menchaca, I., Muxika, I., et al. (2011). Implementation of the European marine strategy framework directive: a methodological approach for the assessment of environmental status, from the Basque country (Bay of Biscay). Mar. Pollut. Bull. 62, 889–904. doi: 10.1016/j.marpolbul.2011.03.031
CPBSAP (2009). Strategic Action Plan for the Environmental Protection and Rehabilitation of the Black Sea. Available online at: http://www.blacksea-commission.org/_bssap2009.asp
Caselles, A. (2013). An application of fuzzy cognitive maps to improve well-being, sustainability and the globalization process. Syst. Res. Behav. Sci. 30, 646–660. doi: 10.1002/sres.2235
Cogălniceanu, D. (2011). “Black Sea environmental status improvement through the restoration of wetlands along the Danube River,” in NATO Science for Peace and Security Series C. Environmental Security (Dordrecht: Springer). doi: 10.1007/978-94-007-2460-0_6
European Commission (2017). Mediterranean Sea. Available online at: https://ec.europa.eu/fisheries/cfp/mediterranean_en
EEA (2008). The Baltic Sea - the Largest Brackish Sea in the World. Copenhagen: European Environment Agency.
EEA (2014). Lithuania‘s Environment State, Processes and Trends. Available online at: https://forum.eionet.europa.eu/nrc-state-environment/seris/reports/599/?country=Lithuania
Eurostat (2017). Eurostat: Statistics Explained. Available online at: http://ec.europa.eu/eurostat/statistics-explained/images/1/15/Total_general_government_expenditure_on_environmental_protection%2C_2015_%28%25_of_GDP_%25_of_total_expenditure%29.png
FAO (2017a). Fishery and Aquaculture Country Profiles. Available online at: http://www.fao.org/fishery/countryprofiles/search/en
FAO (2017b). Russia Looks to Smart Technologies for the Future of Agroecology and Farming. Available online at: http://www.fao.org/partnerships/container/news-article/en/c,/881418/
FAO -AdriaMed (2017). General Outline of Marine Capture Fisheries Legislation and Regulations in the Adriatic Sea Countries. Available online at: http://www.faoadriamed.org/html/Legislation/EntryLeg.html
Golub, A., Mahoney, M., and Harlow, J. (2013). Sustainability and intergenerational equity: do past injustices matter? Sustain. Sci. 8, 269–277. doi: 10.1007/s11625-013-0201-0
Hanna, E. G., Bell, E., King, D., and Woodruff, R. (2008). Russia Agriculture Policy Review. Paris: OECD.
Houde, E. D., Jukić Peladic, S., Brandt, S. B., and Leach, S. D. (1999). “Trends in Catches, Abundance and Management,” in Ecosystems at the Land-Sea Margin: Drainage Basin to Coastal Sea, eds T. C. Malone, A. Malej, L. W. Harding Jr., N. Smodlaka, and R. E. Turner (Washington: American Geophysical Union), 1–35.
HELCOM (2007). HELCOM Baltic Sea Action Plan, Krakow. Available online at: http://www.helcom.fi/Documents/Baltic%20sea%20action%20plan/BSAP_Final.pdf
HELCOM (2011). The Fifth Baltic Sea Pollution Load Compilation (PLC-5). Helsinki: Baltic Sea Environmental. Proceedings, No. 128.
IEP (2015). Pollution. Available online at: http://iep-al.org/?page_id=58
ICPDR (2017). Danube Basin - Black Sea. Available online at: https://www.icpdr.org/main/danube-basin/black-sea
Jain, P., and Jain, P. (2013). Sustainability assessment index: a strong sustainability approach to measure sustainable human development. Int. J. Sustain. Dev. World Ecol. 20, 116–122. doi: 10.1080/13504509.2013.766910
Knoema (2017). Environmental Protection Expenditure in Europe - EUR Per Capita and % of GDP. Available online at: https://knoema.com/qdtnogg/environmental-protection-expenditure-in-europe-eur-per-capita-and-of-gdp?geo=1000260-turkey
Kallis, G. (2011). In defence of de-growth, Ecological Economics 70, 873–880. doi: 10.1016/j.ecolecon.2010.12.007
Kallis, G., Kerschner, C., and Martinez-Alier, J. (2012). The economics of de-growth, Ecological Economics 84, 172–180. doi: 10.1016/j.ecolecon.2012.08.017
Kopnina, H. (2016). The victims of unsustainability: a challenge to sustainable development goals. Int. J. Sustain. Dev. World Ecol. 23, 113–121. doi: 10.1080/13504509.2015.1111269
Koukouzelis, K. (2012). Sustainable development, liberty, and global social justice. Public Reason 4, 165–181.
Kraus, H., and Amtsberg, D. (1998). Environmental Policy in Estonia. Luxembourg: Directorate-General for Research Division of the Environment, Energy, Research and STOA.
Kraus, H., and Meyer, T. (1998). Environmental policy in Estonia. Luxembourg: Directorate-General for Research Division of the Environment, Energy, Research and STOA.
Lowder, S. K., Carisma, B., and Skoet, J. (2012). Who Invests in Agriculture and How much? An Empirical Review of the Relative Size of Various Investments in Agriculture in low- and Middle-Income Countries. Rome: ESA Working Papers.
Nadić, D. (2011). Environmental Policy of Serbia and Challenges of Accession to Europe. Univerzitet u Beogradu: Fakultet političkih nauka.
Newell, J., and Henry, L. (2017). The state of environmental protection in the Russian Federation: a review of the post-Soviet era. Eurasian Geogr. Econ. 57, 779–801. doi: 10.1080/15387216.2017.1289851
OECD (2006). Environmental Policy and Regulation in Russia - The Implementation Challenge. Paris: OECD Publishing.
OECD (2017). Input-Output Tables. Available online at: http://www.oecd.org/trade/input-outputtables.htm
Pedersen, K. P. (2015). Religious ethics and the environment: a review essay J. Relig. Ethics 43, 558–585. doi: 10.1111/jore.12111
REEFS (2015). The Environmental Problems in the Black Sea – Present and Future. Available online at: http://reefsproject.net/article-example-3/
SOER (2015). Black Sea Region Briefing - The European Environment — State and Outlook 2015. Copenhagen: EEA.
SGI (2017). Environmental Policy Performance. Available online at: http://www.sgi-network.org/2017/Policy_Performance/Environmental_Policies
Schlör, S., Fischer, W., and Hake, J. F. (2015). The system boundaries of sustainability. J. Cleaner Prod. 88, 52–60. doi: 10.1016/j.jclepro.2014.04.023
Severini, N. (2013). “Management and overfishing problems in the High Adriatic sea and the future policy perspectives,” in Proceedings 2013 Second Congress, June 6-7, 2013 Parma, Italy 149930, Italian Association of Agricultural and Applied Economics (AIEAA).
Tsikliras, A. C., Dinouli, A., Tsiros, V. Z., and Tsalkou, E. (2015). The Mediterranean and Black Sea fisheries at risk from overexploitation. PLoS ONE 10:e0121188. doi: 10.1371/journal.pone.0121188
UNECE (2013). Republic of Croatia. Available online at: https://www.unece.org/environmental-policy/environment-for-europe/initiatives/envawa/croatia.html
Van den Bergh, J. C. J. M. (2010). Externality or sustainability economics? Ecol. Econ. 69, 2047–2052. doi: 10.1016/j.ecolecon.2010.02.009
Van den Bergh, J. C. J. M. (2011). Environment versus growth—a criticism of “de-growth” and a plea for “a-growth”. Ecol. Econ. 70, 881–890. doi: 10.1016/j.ecolecon.2010.09.035
Van der Werff, E., Stegand, L., and Keizer, K. (2013). It is a moral issue: the relationship between self-identity, obligation-based intrinsic motivation and pro-environmental behaviour. Global Environ. Change 23, 1258–1265. doi: 10.1016/j.gloenvcha.2013.07.018
WWF (2015). Blue Growth Trends in the Adriatic Sea: the Challenge of Environmental Protection. WWF - Mediterranean.
WWF (2017). Eutrophication. Available online at: http://wwf.panda.org/what_we_do/where_we_work/baltic/threats/eutrophication/
Zagonari, F. (2016). Four sustainability paradigms for environmental management: a methodological analysis and an empirical study based on 30 Italian industries. Sustainability 8, 504–537. doi: 10.3390/su8060504
Keywords: sustainability, equity, marine strategy framework, Adriatic Sea, Black Sea, Baltic Sea
JEL Classification: Q2, Q56, Q57, R11.
Citation: Zagonari F, Tsani S, Mavrikis S and Koundouri P (2018) Common Environment Policies in Different Sustainability Paradigms: Evidence From the Baltic, Adriatic, and Black Seas. Front. Mar. Sci. 5:216. doi: 10.3389/fmars.2018.00216
Received: 05 January 2018; Accepted: 30 May 2018;
Published: 25 June 2018.
Edited by:
Rachel Gjelsvik Tiller, SINTEF, NorwayReviewed by:
Encarna Esteban, Universidad de Zaragoza, SpainAthanasios Kampas, Agricultural University of Athens, Greece
Copyright © 2018 Zagonari, Tsani, Mavrikis and Koundouri. This is an open-access article distributed under the terms of the Creative Commons Attribution License (CC BY). The use, distribution or reproduction in other forums is permitted, provided the original author(s) and the copyright owner are credited and that the original publication in this journal is cited, in accordance with accepted academic practice. No use, distribution or reproduction is permitted which does not comply with these terms.
*Correspondence: Fabio Zagonari, fabio.zagonari@unibo.it