Better Regional Ocean Observing Through Cross-National Cooperation: A Case Study From the Northeast Pacific
 John A. Barth1*
  Susan E. Allen2 Edward P. Dever1
  Richard K. Dewey3
  Wiley Evans4
  Richard A. Feely5
  Jennifer L. Fisher1,6 Jonathan P. Fram1 Burke Hales1
  Debby Ianson2,7
  Jennifer Jackson4
  Kim Juniper3,8 Orest Kawka9 Deborah Kelley9 Jody M. Klymak8 John Konovsky10
  P. Michael Kosro1 Alexander Kurapov1,11 Emilio Mayorga9 Parker MacCready9
  Jan Newton9 R. Ian Perry12
  Craig M. Risien1 Marie Robert7 Tetjana Ross7 R. Kipp Shearman1 Joe Schumacker13
  Samantha Siedlecki14
  Vera L. Trainer15
  Stephanie Waterman2 Christopher E. Wingard1
- 1College of Earth, Ocean, and Atmospheric Sciences, Oregon State University, Corvallis, OR, United States
- 2Department of Earth, Ocean and Atmospheric Sciences, University of British Columbia, Vancouver, BC, Canada
- 3Ocean Networks Canada, Victoria, BC, Canada
- 4Hakai Institute, Heriot Bay, BC, Canada
- 5National Oceanic and Atmospheric Administration, Pacific Marine Environmental Laboratory, Seattle, WA, United States
- 6Fish Ecology Division, Northwest Fisheries Science Center, National Oceanic and Atmospheric Administration, Newport, OR, United States
- 7Institute of Ocean Sciences, Fisheries and Oceans Canada, Sidney, BC, Canada
- 8University of Victoria, Victoria, BC, Canada
- 9University of Washington, Seattle, WA, United States
- 10Tsleil-Waututh Nation, North Vancouver, BC, Canada
- 11Coast Survey Development Laboratory, National Oceanic and Atmospheric Administration, Silver Spring, MD, United States
- 12Pacific Biological Station, Department of Fisheries and Oceans Canada, Nanaimo, BC, Canada
- 13Quinault Indian Nation, Taholah, WA, United States
- 14Department of Marine Sciences, University of Connecticut, Avery Point, Groton, CT, United States
- 15Environmental and Fisheries Sciences Division, Northwest Fisheries Science Center, National Oceanic and Atmospheric Administration, Seattle, WA, United States
The ocean knows no political borders. Ocean processes, like summertime wind-driven upwelling, stretch thousands of kilometers along the Northeast Pacific (NEP) coast. This upwelling drives marine ecosystem productivity and is modulated by weather systems and seasonal to interdecadal ocean-atmosphere variability. Major ocean currents in the NEP transport water properties such as heat, fresh water, nutrients, dissolved oxygen, pCO2, and pH close to the shore. The eastward North Pacific Current bifurcates offshore in the NEP, delivering open-ocean signals south into the California Current and north into the Gulf of Alaska. There is a large and growing number of NEP ocean observing elements operated by government agencies, Native American Tribes, First Nations groups, not-for-profit organizations, and private entities. Observing elements include moored and mobile platforms, shipboard repeat cruises, as well as land-based and estuarine stations. A wide range of multidisciplinary ocean sensors are deployed to track, for example, upwelling, downwelling, ocean productivity, harmful algal blooms, ocean acidification and hypoxia, seismic activity and tsunami wave propagation. Data delivery to shore and observatory controls are done through satellite and cell phone communication, and via seafloor cables. Remote sensing from satellites and land-based coastal radar provide broader spatial coverage, while numerical circulation and biogeochemical modeling complement ocean observing efforts. Models span from the deep ocean into the inland Salish Sea and estuaries. NEP ocean observing systems are used to understand regional processes and, together with numerical models, provide ocean forecasts. By sharing data, experiences and lessons learned, the regional ocean observatory is better than the sum of its parts.
Introduction
An array of ocean observing assets, as well as numerical ocean circulation and biogeochemical models, focus on the Northeast Pacific (NEP) off the coasts of Oregon, Washington, British Columbia, and Alaska. This region includes the open-ocean bifurcation of the North Pacific Current (aka West Wind Drift) into the southward flowing California Current and the northward flowing Alaska Current. Spring and summer wind-driven coastal upwelling strongly influences waters on the continental shelf and slope off of the Pacific Northwest (PNW) coast (Smith, 1974; Thomson, 1981). In the winter, the PNW coastal waters are subject to strong wind-driven downwelling, considerable freshwater and iron input from rivers (Chase et al., 2007), large waves and swift northward currents (Mazzini et al., 2014). Both the Fraser and Columbia Rivers, the largest sources of freshwater to the North American west coast, also influence the region, as do numerous distributed coastal river systems. Highly productive marine fisheries and aquaculture facilities are found in PNW waters, including a diverse range of valuable and iconic species like Dungeness crab, razor clams, oysters, salmon, halibut, and hake. The NEP is home to the Cascadia Subduction Zone where the Juan de Fuca Plate dives beneath the North American Plate. The region is subject to seismic activity, most consequentially by large (magnitude > 8) subduction zone earthquakes with inter-event times ranging from 200 years to 1,200 years (Atwater, 1987). The PNW is home to several major metropolitan areas with a population of about 10 million people and NEP waters include key shipping routes. Observations and models cover the full-ocean depth and seafloor beneath, spanning from the continental shelf and slope to the open ocean, including major estuaries and inland seas, and reaching all the way to shore (Figure 1).
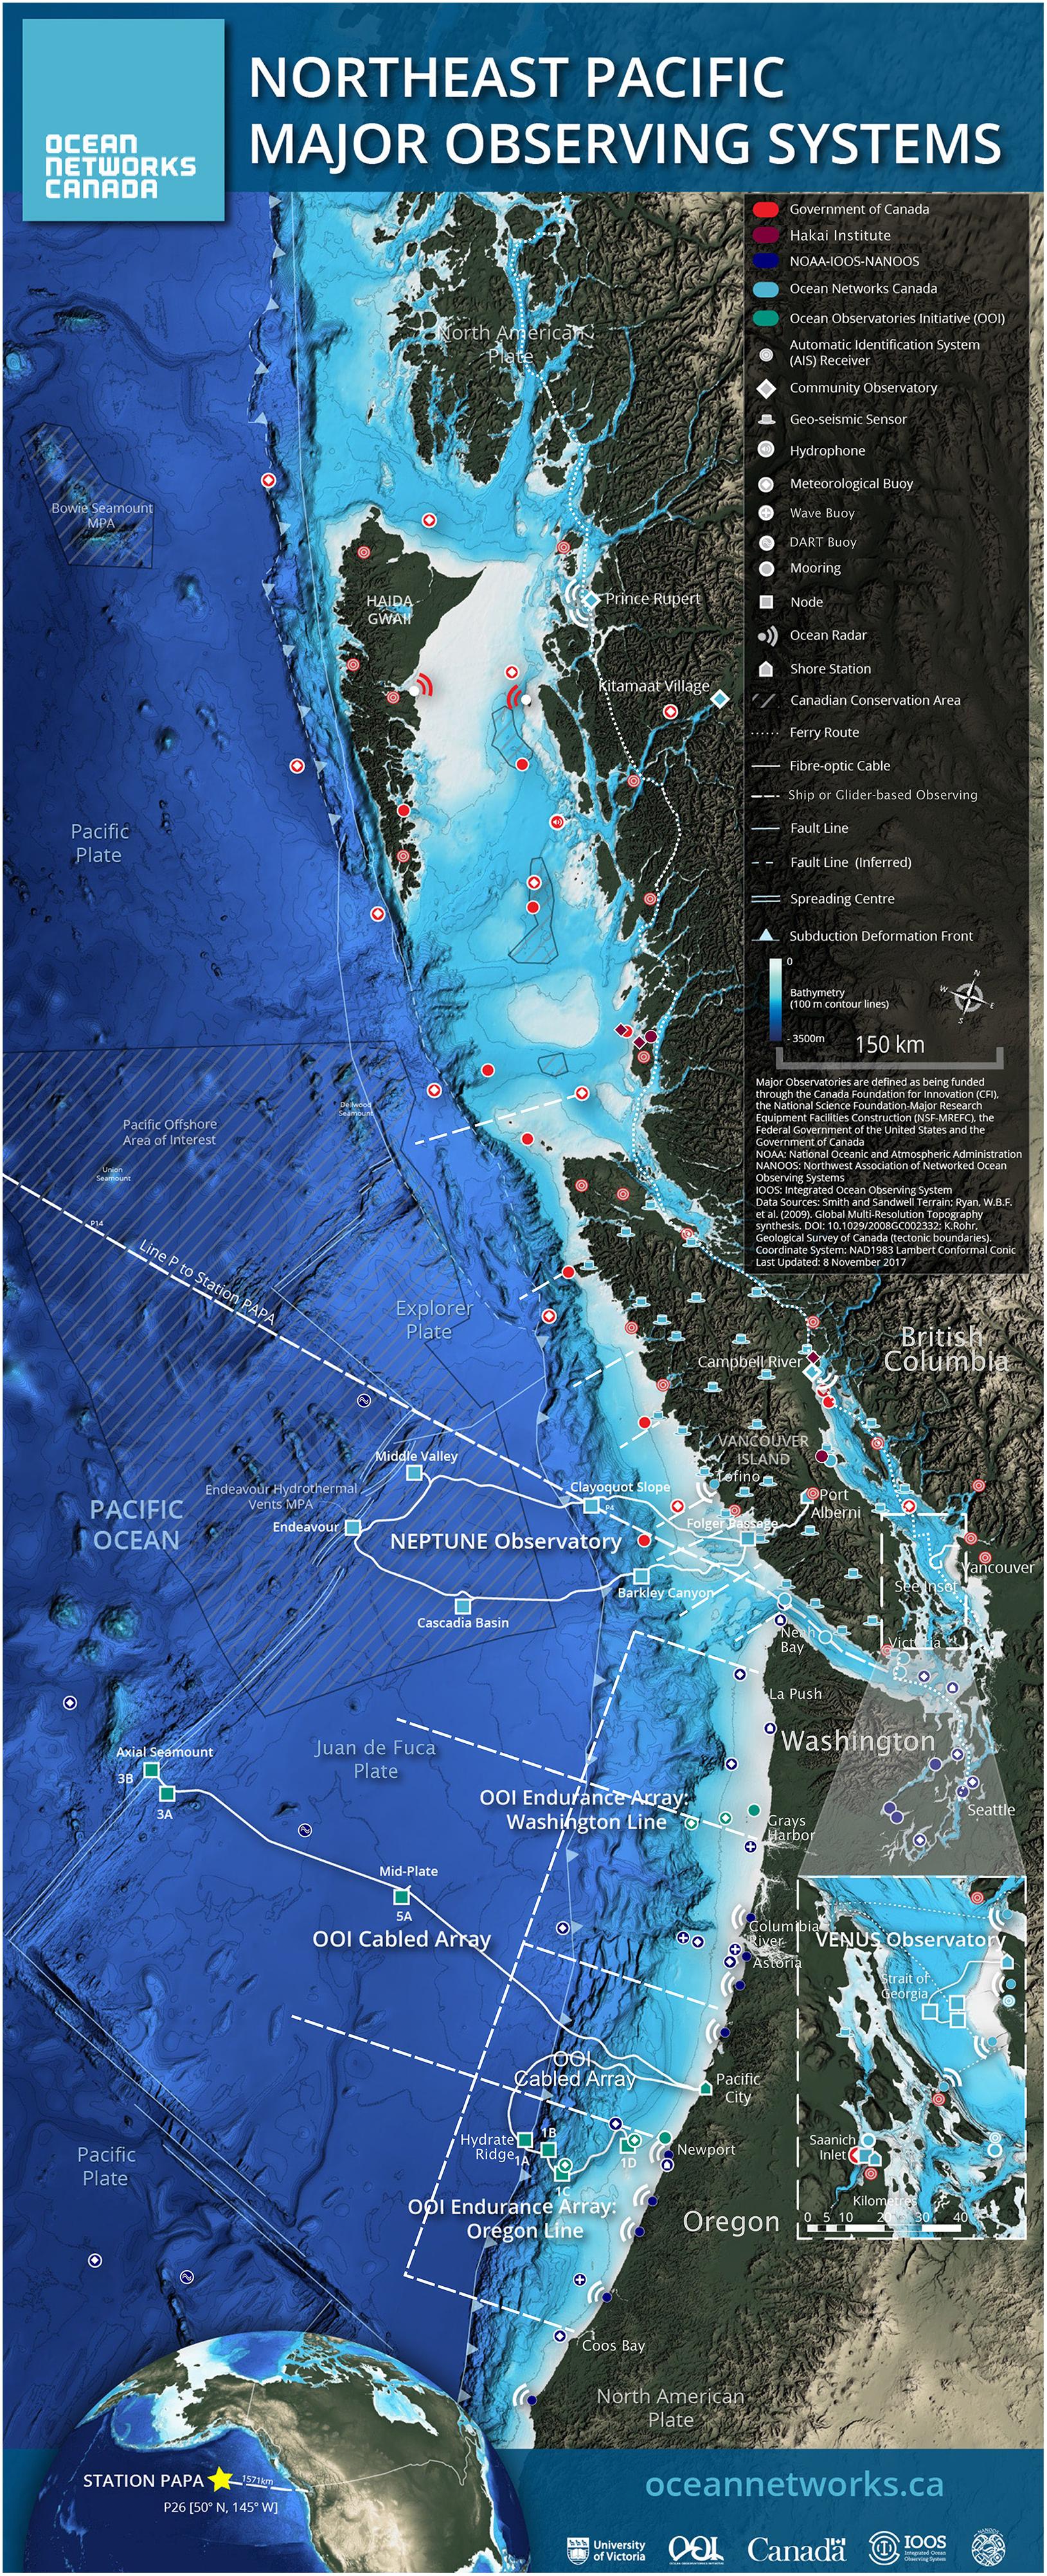
Figure 1. Map of the ocean observing assets in the Northeast Pacific. Colors indicate ocean observing assets funded by the Canadian (red) and United States governments (dark blue), by the private Hakai Institute (maroon), and by two major ocean observing programs: Ocean Networks Canada (light blue) and the Ocean Observatories Initiative (teal). Buoys and shore-side infrastructure are shown as distinct symbols, while ship or glider lines (dashed) and instrumented ferry routes (dotted) are shown as continuous curves. Seafloor cables are shown as curvy, solid lines. Bottom depth, in meters, is shaded in blue. Courtesy of Ocean Networks Canada as modified by C. Risien (OSU).
Waters off the PNW are influenced by climate and ocean anomalies on a year-to-year (“interannual”) and decade-to-decade (“interdecadal”) timescale (Figure 2). In response to interannual variability forced by the El Niño Southern Oscillation at the equator, upper-ocean stratification, ocean currents, and local winds change in the NEP through signals that arrive through both the ocean and atmosphere (Huyer et al., 2002). A relatively higher sea level and warmer water is present during El Niños and vice versa for La Niñas. There is evidence for larger river discharge into the ocean following La Niña events (Dracup and Kahya, 1994), notably in 2011 (Mazzini et al., 2015). During the winter of 2013–2014, the atmospheric Jet Stream shifted anomalously northward leading to less wind-driven mixing in the central Gulf of Alaska, that subsequently led to the formation of a large region of anomalously warm surface water. This “warm blob” (Bond et al., 2015) was subsequently observed to be advected south and toward the Canadian and United States west coasts, persisting on the shelf at least through 2017 (Barth et al., 2018) and until 2018 at 140 m in a deep British Columbia fjord (Jackson et al., 2018) (Figure 2). On interdecadal time scales, PNW waters are affected by the Pacific Decadal Oscillation that manifests itself as 10- to 40-year cycles in the upper-ocean temperature and swings between the dominance of northern, “fatty” zooplankton and southern, “skinny” zooplankton (Mackas et al., 2001; Peterson and Schwing, 2003) (Figure 2D).
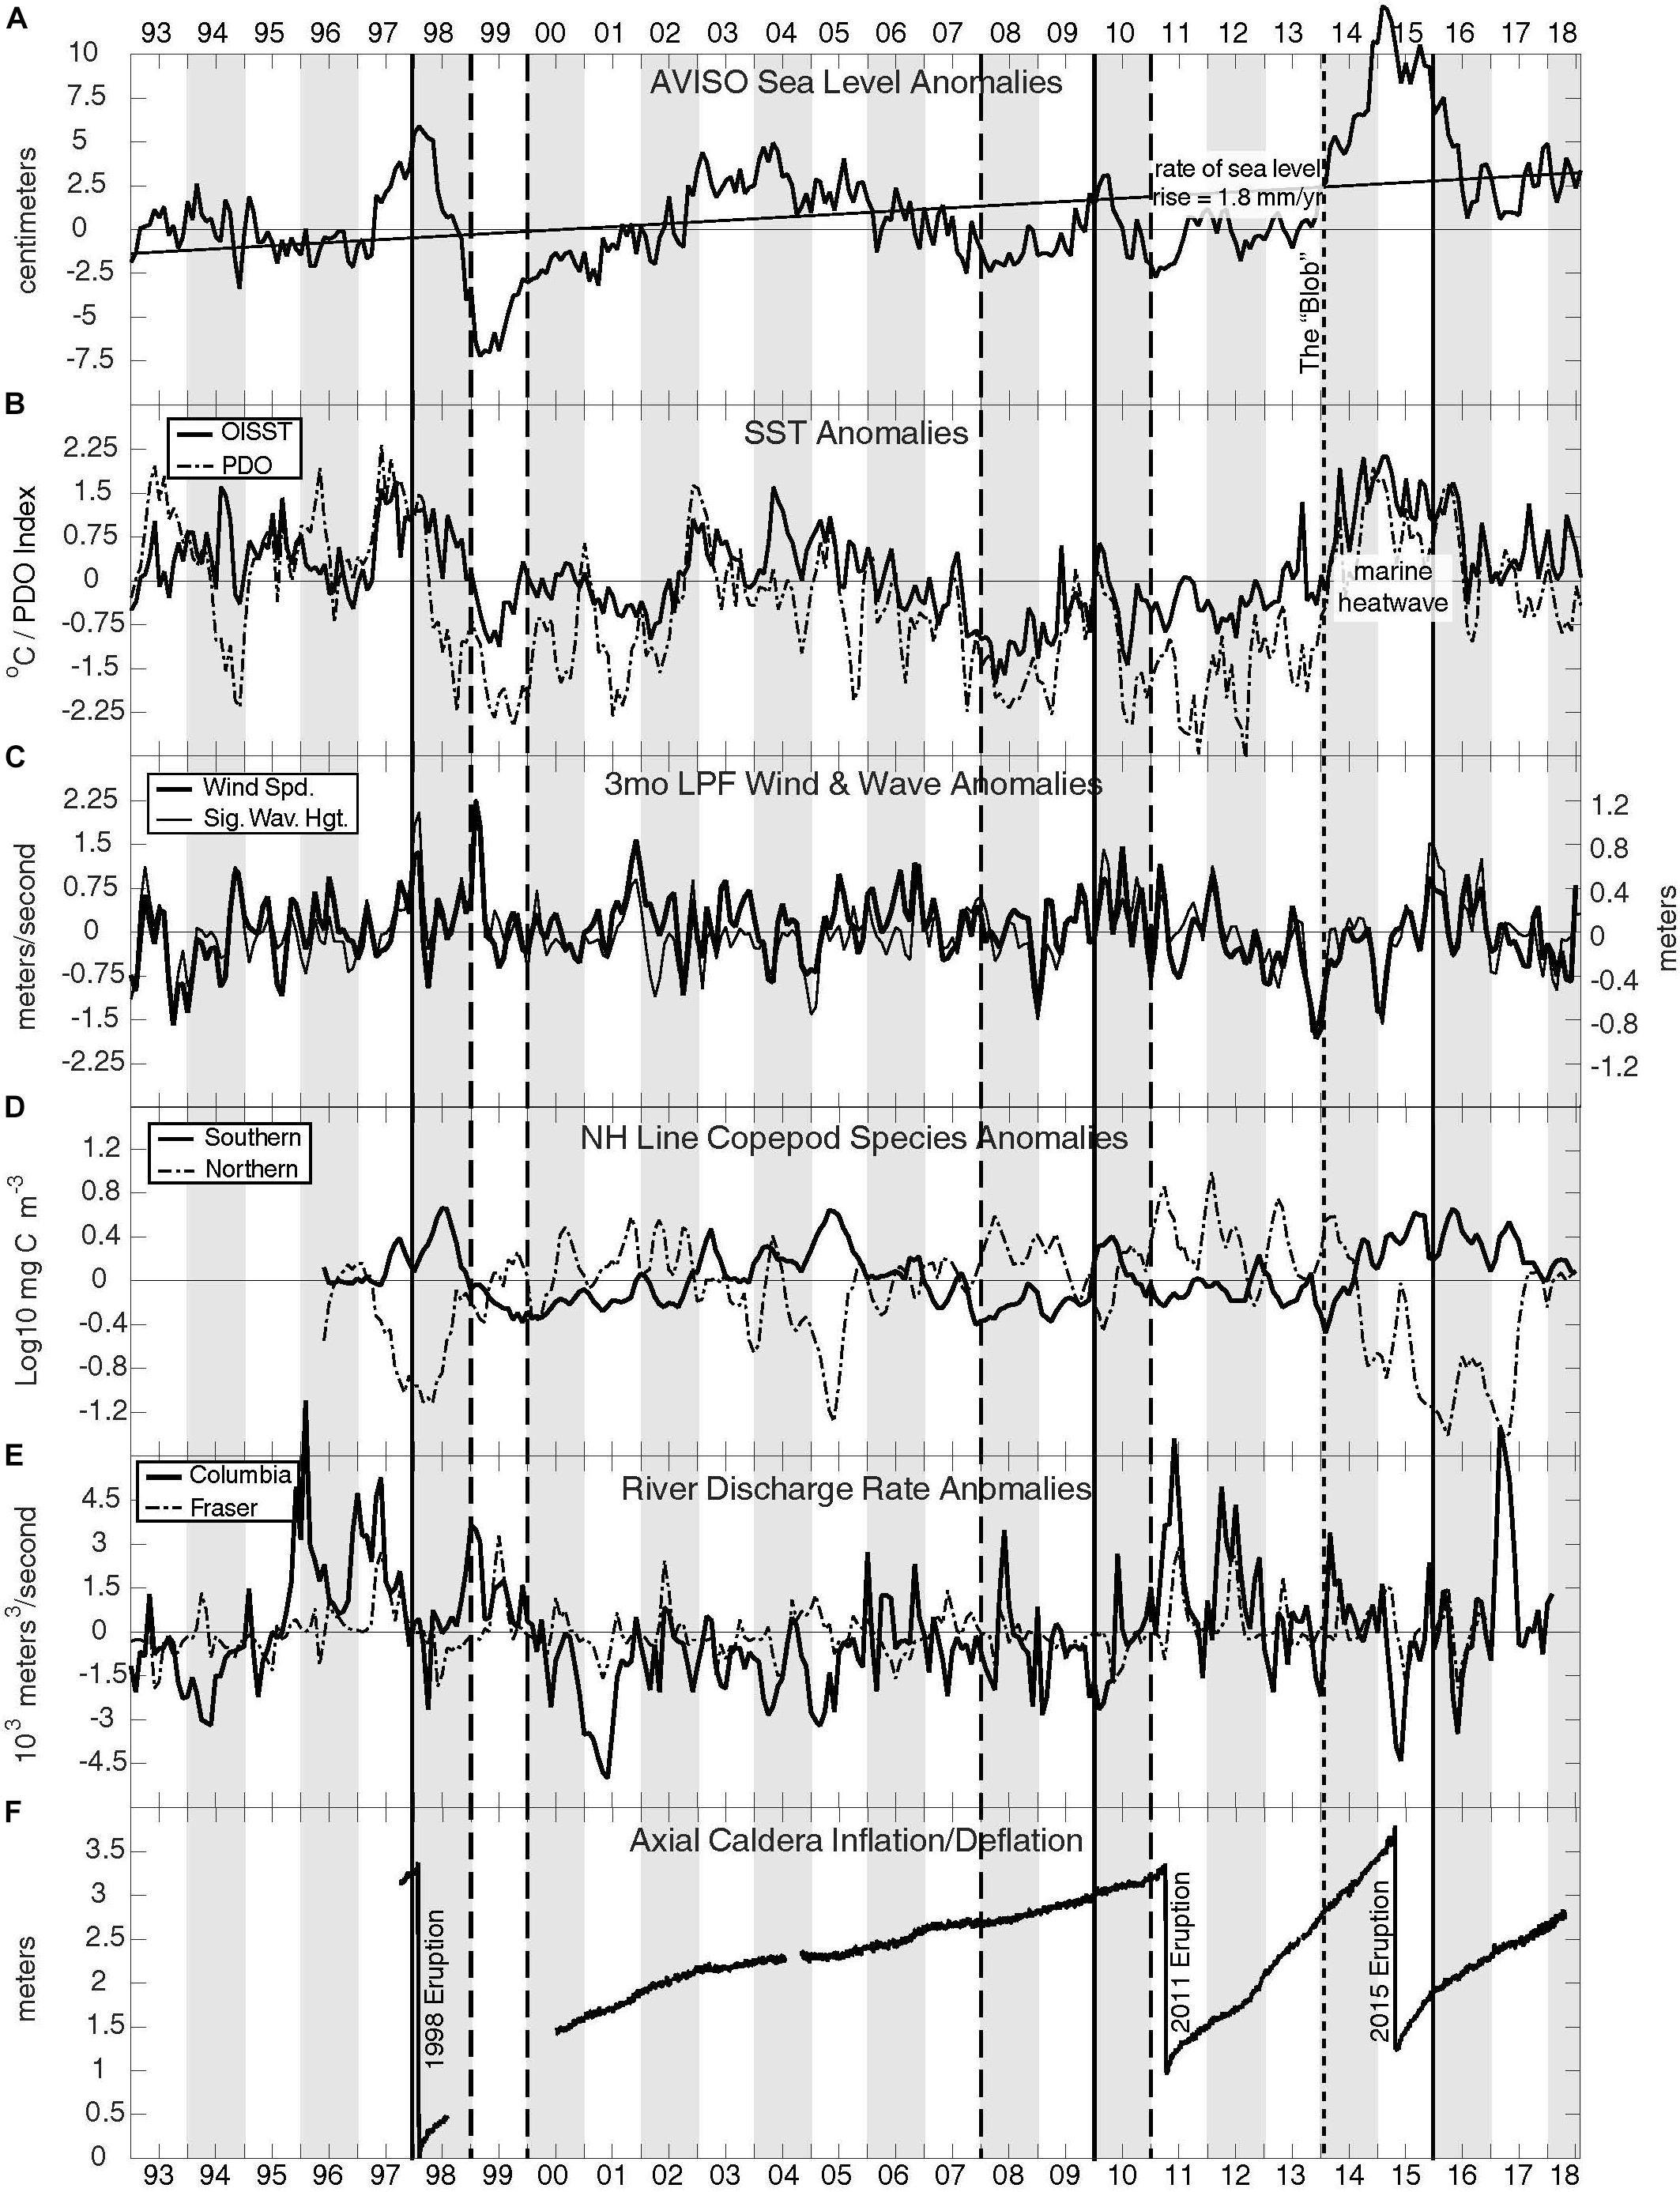
Figure 2. Northeast Pacific anomalies showing interannual and interdecadal variability over the last 25 years: (A) AVISO blended satellite sea level; (B) Sea Surface Temperature and Pacific Decadal Oscillation; (C) 3-month filtered surface winds and significant wave height; (D) zooplankton (copepod) species indices; (E) Columbia and Fraser River discharge; and (F) Axial Volcano inflation/deflation measurements. Strong El Niño (solid) and La Niña (dashed) events are indicated, as is the “warm blob.” A significant 1.8 mm year-1 rise in sea level is indicated in the top panel. The satellite and model output are spatially averaged (45–50°N, 125–130°W) monthly anomaly fields. The copepod species anomalies are from the Newport, Oregon, Hydrographic Line (44° 39.1′N). See Table 2 for data sources.
Over the last 15 years, PNW waters have been exposed to hypoxic and even anoxic events (Grantham et al., 2004; Hales et al., 2006; Chan et al., 2008) that have the potential to severely disrupt local fisheries. Upwelled waters are both low in oxygen and high in dissolved inorganic carbon dioxide (DIC), making PNW coastal waters particularly vulnerable to ocean acidification (OA; Feely et al., 2008). OA results in low pH and carbonate-mineral stability (Ω). Further increases in DIC, from the decay of upwelling-fueled plankton blooms on the continental shelf, drives pH even lower (Feely et al., 2016, 2018; Bednaršek et al., 2017). These low-Ω waters harm the development of oyster and mussel larvae (Waldbusser et al., 2015), and leads to failures in larval production in the PNW shellfish hatcheries that support the majority of west coast shellfish growers (Barton et al., 2012, 2015). The region is also known for the appearance of harmful algal blooms (HABs) which generate toxic substances that become incorporated into the ocean food chain, leading to the closure of valuable commercial, subsistence, and recreational fisheries. Recently, warm blob waters were identified as contributing to an enhanced HAB in the area (McCabe et al., 2016; McKibben et al., 2017), specifically the toxic diatom bloom (Pseudo-nitzschia) that produces the toxin, domoic acid. These toxic cells were ingested by the iconic and valuable Dungeness crab (Cancer magister) resulting in the economically devastating, coastal-wide closure of this fishery.
Bounding the western part of the Juan de Fuca Plate in the NEP, is a linear chain of underwater volcanoes. Here, the Juan de Fuca (JdF) spreading center is part of the mid-ocean ridge system that accounts for >70% of the volcanism on Earth. Studying these underwater volcanoes provides insight on the processes that form oceanic crusts and the role of submarine volcanoes in exchanging heat and chemicals with the ocean (Kelley et al., 2016; Wilcock et al., 2018). Underwater volcanoes also support chemosynthetic biological communities. Axial Seamount is the most magmatically robust volcano on the Juan de Fuca ridge and erupted in 1998 and 2011, and most recently in 2014, resulting in a lava flow 127 m thick (Chadwick et al., 2016) (Figure 2F). Between eruptions, magma recharges beneath the summit caldera, leading to steady inflation and increasing rates of seismicity. During each eruption, the volcano deflates over days to weeks.
There is keen interest in understanding seismic activity in the Cascadia Subduction Zone and the subsequent potential for local tsunamis. While seismic activity is measured with cabled and uncabled ocean bottom seismometers, the signatures of tsunami waves are measured with high-precision bottom pressure recorders. These bottom pressure sensors can also detect waves associated with remotely generated tsunamis. These open-ocean observations are uncontaminated by coastal effects, such that local seafloor bottom pressure records from future tsunami events may be used as real time input to a regional numerical tsunami forecast model (Thomson et al., 2011).
This review begins with a description of various ocean observing efforts in the NEP that span from offshore and deep ocean to measurements being made in estuaries and at the coast. The observing techniques include measurements made from ships and ferries, moorings, cabled and land-based sensors, and autonomous underwater gliders. A description of ocean modeling in the region is provided next, followed by a discussion on how we endeavor to make both measurements and models useful to ocean users. We summarize this by looking to the future.
Northeast Pacific Ocean Observing: Open Ocean to Shore
Waters of the NEP change on time scales from hours to decades, requiring ocean sensors to collect samples at minute intervals and deploying these on to platforms designed and operated for decades. Ocean observing assets in the NEP span from Station Papa in the central Gulf of Alaska, across the continental slope and shelf from British Columbia to Oregon, into major estuaries and inland seas, and to the shore (Figure 1). For a list of NEP ocean observing programs, their acronyms, pointers to their web pages, and a list of the coauthors and key contributors involved with each program, see Table 1.
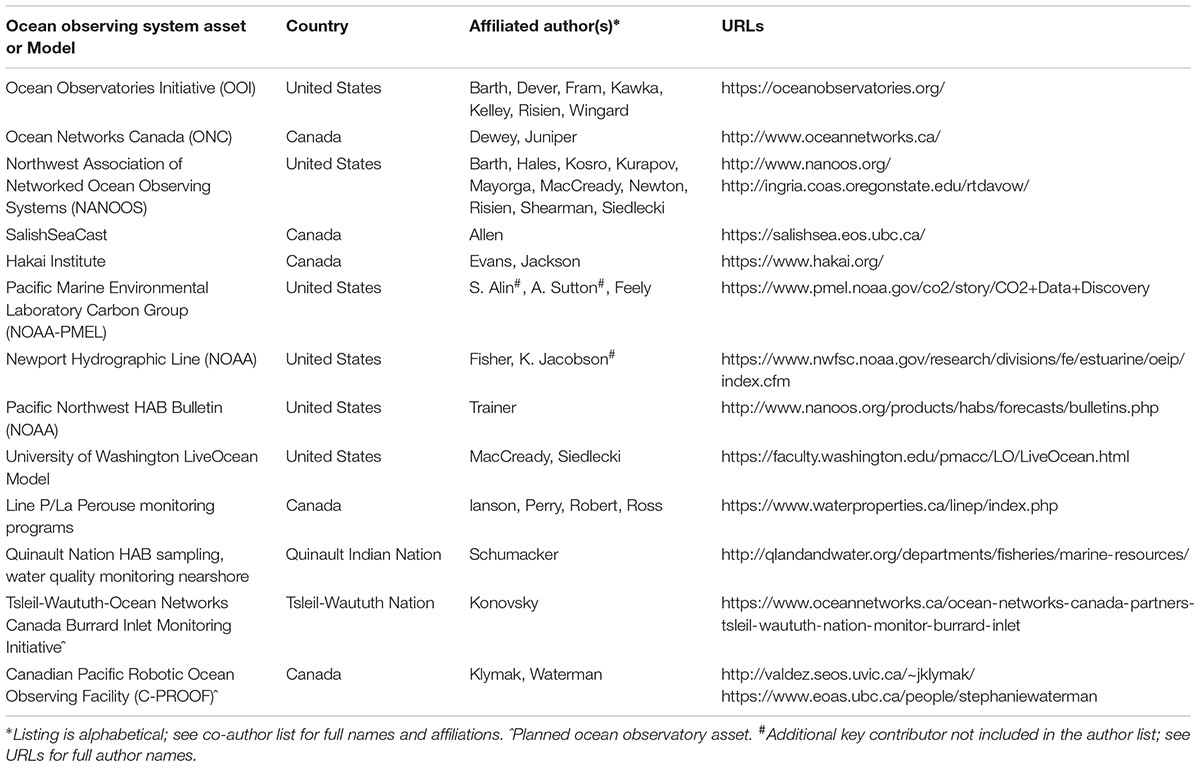
Table 1. List of Northeast Pacific ocean observing systems and models.
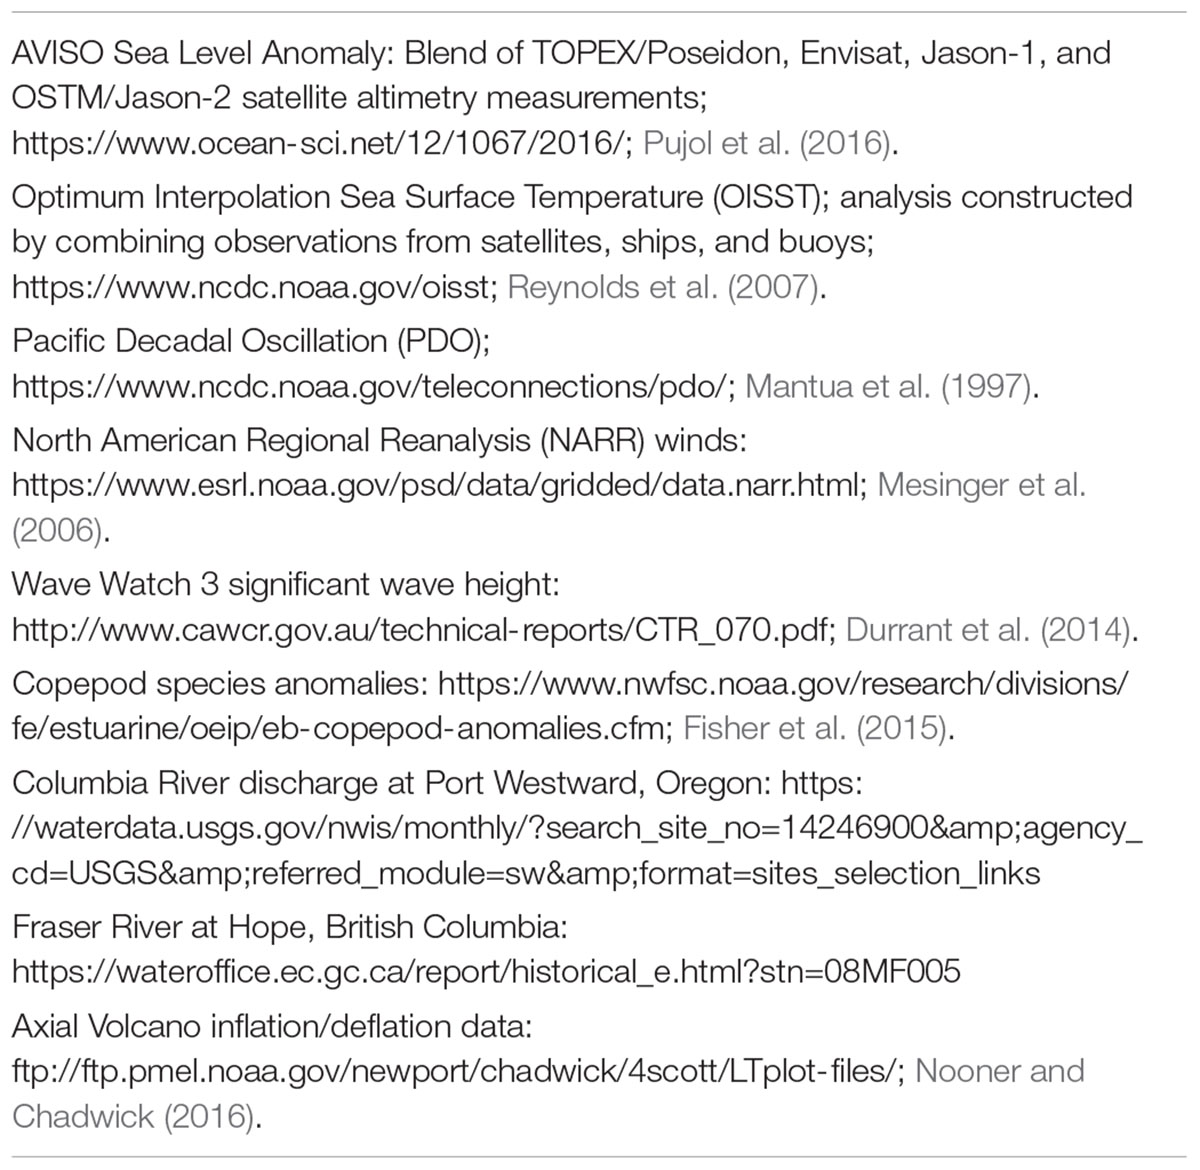
Table 2. Data sources for Figure 2.
The farthest offshore, open-ocean observing elements in the NEP are associated with Ocean Station Papa (50°N, 145°W), and include moorings operated by the United States National Science Foundation (NSF) funded Ocean Observatories Initiative (OOI) and the National Oceanic and Atmospheric Administration (NOAA), and the Line P hydrographic line occupied by Fisheries and Oceans Canada (DFO). The coastal and regional ocean observing network in the NEP includes DFO’s La Perouse monitoring program, NOAA’s Newport Hydrographic Line, the OOI’s Endurance and Cabled Arrays, Ocean Networks Canada’s NEPTUNE and VENUS arrays, and the Northwest Association of Networked Ocean Observatories (NANOOS), and the regional association of the United States Integrated Ocean Observing System (IOOS) supported by NOAA. Closest to shore are the shore-based and cabled oceanographic monitoring stations operated by the United States and Canadian governments, the private Hakai Institute, and by Native American Tribes and First Nations. This combination of ocean observatories affords an exceptional opportunity to study the eastern boundary current and coastal ocean processes, within the context of regional climate and ocean changes. NOAA’s Pacific Marine Environmental Laboratory’s carbon group is working with a number of academic and government partners to conduct large-scale coastal surveys and underway measurements of OA, to determine spatial scales of carbon dioxide sources and sinks, and causes thereof, along the entire west coast of North America. These surveys have taken place every few years since 2007 (Feely et al., 2008, 2016).
Hydrographic and Net Sampling
The Line P program was created in 1956, by adding regular physical and chemical oceanographic observations on the weather ship already transiting regularly to Ocean Station Papa1 (Whitney and Tortell, 2006). The La Perouse program started in 1979, as a means to monitor the physical and biological characteristics of the ocean immediately west of Vancouver Island, and to relate these characteristics to the recruitment of various fish species that comprise some of the major commercial fisheries (Mackas, 1992). In 1999, Strait of Georgia Surveys were added (Masson, 2006). More regular chemical and biological observations were added over time to all three programs (e.g., Whitney et al., 2005; Tortell et al., 2012; Ianson et al., 2016). The Newport Hydrographic Line (44° 39.1’N) has a history of observations extending back to 1961 (Huyer et al., 2007). Bi-weekly biological sampling for zooplankton begun on the Newport Hydrographic Line in 1996 (Fisher et al., 2015). These monitoring programs have long-formed the base upon which many process studies have been launched. These studies have wide-ranging interests from air-sea interactions, to mixed-layer dynamics, plankton ecology, iron depletion and enrichment, and seabird populations. A recent example includes the first phase of the NASA/NSF funded EXPORTS project which quantifies the export and fate of upper ocean net primary production at Ocean Station Papa2.
Vancouver Island and Strait of Georgia Moorings
The Institute of Ocean Sciences (DFO) has maintained three autonomous moorings along the continental shelf off Vancouver Island for over 30 years and one mooring in the Strait of Georgia for 10 years. This array has recently been extended north into Queen Charlotte Sound, Hecate Strait, and Chatham Sound. The typical properties measured are temperature, salinity, dissolved oxygen and current velocity. In 2018, biological settling plates were installed as part of a systematic effort to monitor aquatic invasive species in offshore waters. In August 2018, a coastal surface mooring with a water column profiler was installed in the central Strait of Georgia.
Ocean Observatories Initiative Coastal and Cabled Arrays
The OOI Endurance Array is built using a variety of oceanographic sampling platforms including surface moorings, water column profilers, and instruments on the sea floor as well as on a mid-water platform (Kelley et al., 2016; Barth et al., 2018). The Endurance Array backbone includes the Oregon Line, off Newport near 44.6°N, and the Washington Line, off Grays Harbor near 47°N (Figure 1). These lines each have three sites: the inner shelf site ∼25–30 m water depth and 4–6 km from the shore; the mid shelf site ∼80–90 m water depth and 20–30 km from the shore; and the continental slope site ∼500–600 m water depth and 60–65 km from the shore. All EA platforms and sites measure fundamental ocean properties like temperature, salinity, pressure, water velocity, chlorophyll fluorescence, and dissolved oxygen. Many surface and water-column platforms host sensors measuring CO2 partial pressure (pCO2), both in water and in the atmosphere above, pH, spectral light absorption and attenuation, incoming spectral radiation, and nutrients. Cabled echo sounders that obtain acoustic backscatter from targets in the water column, including zooplankton and fish, sample continuously at the Oregon shelf and offshore sites at three-frequencies (38, 120 split beam, and 200 kHz). Uncabled, autonomous 4-frequency echo sounders (38, 125, 200, and 455 kHz) are mounted to the bottom of each Endurance Array mooring.
Coastal surface moorings consist of a surface buoy with local wind and solar power generation and are equipped with meteorological instruments that provide continuous measurements of winds, air temperature and humidity, and solar radiation at 1-min intervals. A mooring line supports the delivery of power and data to instruments along the line and an instrumented seafloor platform. The Endurance Array sensors and platforms return data to shore via a cellular or satellite link at the sea surface for autonomous moorings or seafloor cables shared with the OOI Cabled Array (see next paragraph). Data are available at https://oceanobservatories.org/.
The OOI Cabled Array consists of two legs heading offshore from Pacific City, Oregon (Figure 1). The Cable Array provides unprecedented power (10 kV, 8 kW) and bandwidth (10 Gigabit Ethernet), and two-way communication to scientific sensor arrays on the seafloor and throughout the water column (Kelley et al., 2016; Smith et al., 2018). One leg goes west for ∼500 km, spanning the Juan de Fuca Plate, to host a multi-platform, instrumented underwater laboratory at the base and summit of the Axial Seamount (Figure 2F). Cabled infrastructure at the summit of the volcano is comprised of the most advanced submarine volcanic observatory in the oceans. Here, a diverse array of geophysical, chemical, and biological sensors/samplers, as well as a high-definition cameras and digital still cameras, provide real-time information on linkages between seismic events, fluid flow, and changes in biological communities. Application of the real-time data provided by the Cabled Array was highlighted by the 2015 eruption that was marked by >8,000 earthquakes and a concomitant drop in the seafloor by 2.4 m on April 24, 2015, followed by >30,000 explosions, heating of waters within the caldera, and explosive ash-generating events (Nooner and Chadwick, 2016; Caplan-Auerbach et al., 2017; Wilcock et al., 2018; Xu et al., 2018). At the base of the volcano, water-column sensors are deployed on cabled moorings with instrumented wire-following profilers, and state-of-the-art two-legged moorings that provide 3 kW power and 1 GB communication to instrumented platforms at 200-m depth, and to instrumented winched profilers.
A second OOI cable leg loops south from Pacific City and hosts infrastructure on the Southern Hydrate Ridge (SHR) site to provide insight into actively venting methane hydrate systems (Kelley et al., 2016). Processes of interest include the temporal evolution of methane hydrate systems in response to seismic events, determining chemical fluxes from the seafloor and impacts on overlying ocean chemistry, and understanding biogeochemical coupling associated with gas-hydrate formation and dissolution (Philip et al., 2016). Since 2016, significant instrument expansion of the Axial and SHR sites has occurred through funding by NSF, United States Office of Naval Research, and Germany. The cable continues up the continental slope and shelf to connect to the OOI EA offshore (587 m) and shelf (80 m) sites.
Profiling Moorings
Northeast Pacific observatories host cutting-edge profiling moorings that use self-contained instrument packages that move up and down through the water column to provide fine vertical resolution (∼1 m) at fixed stations. The OOI hosts several types of vertical profilers including both autonomous and cabled wire-following profilers that carry low-power instruments from just below a subsurface float at ∼30-m depth down to a maximum specified depth (∼500 m for Endurance Array, ∼2,500 m for Cabled Array) ascending and descending many times per day. Two types of shallow winched profilers are deployed by OOI, including one type on the Cabled Array 200-m platforms that profiles the water-column to just beneath the sea surface, using a sensor package that transmits data back in real-time via a cable (Kelley et al., 2016; McRae, 2016). Since 2015, the three Cabled Array winched science pods have obtained >30,000 profiles. Communications conducted at the speed of light, from shore, allow adjustments to be made to profiling missions that include documentation of thin layers, storms, and major subsurface currents that result in blow down of the 7,000-lb, 12-ft across platforms 200 m beneath the surface. A Coastal Surface Piercing Profiler (CSPP) is deployed at the Endurance Array shelf and inshore sites and profiles from near the sea floor to the sea surface where it returns data to shore via Iridium satellite. The CSPP rises toward the sea surface under positive buoyancy and then, after reaching the sea surface, is winched back down to near the seafloor where it resides until the next profile. A nearby surface coastal mooring is equipped with an acoustic modem so that the CSPP can be commanded from shore to not profile in the case of large (>3 m) surface waves.
Ocean Networks Canada
Ocean Networks Canada (ONC) is committed to continuous, long-term recording of temperature, salinity, water velocity, dissolved oxygen, pH and pCO2 using sensors installed on the North East Pacific Time-series Underwater Networked Experiments (NEPTUNE) observatory (Figure 1). Data are sent to shore via an 840-km loop of fiber optic cable with five nodes3. Each node is instrumented with a diverse suite of sensors that enable researchers to study interactions among geological, chemical, physical, and biological processes that drive the dynamic Earth-ocean system over a broad spectrum of oceanic environments including the continental shelf at Folger Passage, the continental slope at Clayoquot Slope and the Barkley Canyon, the mid-plate on the abyssal plain at Cascadia Basin, a mid-ocean ridge at the crest of the Endeavour Segment of the Juan de Fuca Ridge, and the axial rift valley at Middle Valley.
Ocean Networks Canada sensors are also installed throughout the Salish Sea with cabled systems in the Saanich Inlet, naturally anoxic at depth through much of the year, and in the Strait of Georgia, comprising of the Victoria Experimental Network Under the Sea (VENUS) (Figure 1). The Fraser River delta in the Strait of Georgia is an ideal location for examining sedimentation processes. Sensors installed on two VENUS nodes (at Central and East Strait of Georgia) are able to measure variables that can affect slope stability and observe what mechanisms regulate underwater landslides in near real-time. ONC also operates a variety of non-cabled observing systems in the Salish Sea (Figure 1).
From the very beginning, a central pillar for ONC has been the development of the Oceans 2.0 data management system4. ONC has made and continues to make investments in the management of data collection, metadata management, and data delivery services. Approximately one-third of the ONC staff have always been devoted to data management, including a core systems and operations group, a software development team, a data quality and data product department, and finally a team in charge of managing metadata. While a few users require near real-time data access, the majority demand high quality and reliable data archive access, including comprehensive metadata management services.
The OOI and ONC offshore cabled arrays were originally planned to be connected offshore to provide a redundant power and data path in case of cable failure in one of the two systems. This did not happen because of a mismatch in the timing for the funding of the two systems. Achieving such a desirable engineering goal in the future for systems in the NEP or elsewhere will require concerted, advanced planning.
Northwest Association of Networked Ocean Observing Systems
The Northwest Association of Networked Ocean Observing Systems (NANOOS) is the IOOS regional association in the PNW, serving primarily Washington and Oregon. NANOOS has five areas of emphasis: climate, coastal hazards, ecosystem assessment, fisheries and biodiversity, and maritime operations5. Initiated by academic oceanographers and built through public engagement of groups with ocean and estuarine interests, NANOOS’s governing council includes representatives of all 66-member organizations from academia/research, federal/state/local government, tribal government, industry, and non-governmental organizations.
Northwest Association of Networked Ocean Observing Systems coordinates the collection of ocean and estuary data from a wide network of offshore buoys, estuarine stations, underwater gliders, shore stations and instrumented ferries (Figure 1). These include approximately 40 monthly stations in the United States part of the Salish Sea collected for nearly three decades by the Washington Department of Ecology and the summer-season moorings near the northern coast of Washington, deployed by NOAA’s Olympic Coast National Marine Sanctuary. NANOOS combines data it collects and regional model output with observations from local (including, for example, Washington King County, Washington Department of Health, Pacific Shellfish Institute, Penn Cove Shellfish, Taylor Shellfish, Hakai Institute) and regional partners (OOI and ONC), and with that from other NOAA observing assets, satellites, and regional and global-scale models, and Environment Canada moorings, and distributes them via the NANOOS Visualization System6 as well as to nationally integrated IOOS systems. NANOOS data are accessed by a variety of ocean users including fishers, resource managers, marine pilots and academics.
Land-Based Coastal Radar
Northwest Association of Networked Ocean Observing Systems operates land-based coastal radar stations (CODAR) that provide ocean surface currents out to about 150 km offshore along the coast of Oregon (Figure 1). Surface current maps are provided to ocean users for navigation, to NOAA’s Office of Response and Restoration, and to the United States Coast Guard Search and Rescue. Surface current maps are assimilated into regional ocean circulation models (see below). Expansion is underway to extend land-based radar coverage up the Washington State coast and, in collaboration with ONC, to improve coverage in the Strait of Juan de Fuca. ONC also operates land-based coastal radars. A WERA system is installed at Tofino Airport, Vancouver Island, and provides maps of ocean surface currents and significant wave height and direction over long distances offshore. ONC has also installed coastal Wave Radar (WAMOS) and Coastal Radar (CODAR) systems in the Strait of Georgia and also in partnership with communities on British Columbia’s north coast and on Haida Gwaii. PNW coastal radar data are integrated and redistributed by the IOOS High-Frequency Radar Data Assembly Center (HF Radar DAC).
Underwater Gliders
There is an extensive underwater glider network in operation in the NEP (Figure 1). Sensors onboard the gliders measure temperature, salinity, pressure, dissolved oxygen, chlorophyll and colored dissolved organic matter fluorescence, light backscatter, and depth-averaged velocity. Data are reported to shore by the Iridium satellite cell phone and made available via various data servers (NANOOS NVS, OOI, IOOS GliderDAC). Glider sampling started off La Push, WA, United States, in 2003 using a University of Washington Seaglider. Regular glider observations along the Newport Hydrographic Line, OR, United States, using Teledyne Webb Research Slocum gliders and Seagliders started in spring 2006 (Adams et al., 2016; Saldias et al., 2016) and continues through to the present day under funding from OOI. The OOI glider network adds a second, ∼300-km long cross-margin, glider-monitored section off Grays Harbor, WA, United States, with shorter cross-margin lines from La Push, WA, United States, to Coos Bay, OR, United States. Since 2014, a NANOOS-supported glider line has been operating off Trinidad Head, CA, United States (41.1°N), connecting the NEP glider array to the central and southern California glider array farther south. Future glider lines are planned off Vancouver Island as part of the recently funded Canadian Pacific Robotic Ocean Observing Facility.
Ferry-Based Systems
Flow-through and meteorological measurement systems are installed in many regularly scheduled passenger ferries in the NEP including in Puget Sound and the Strait of Juan de Fuca, operated by the Washington State Department of Transportation and Clipper Vacations, in the Strait of Georgia, operated by BC Ferries, and off northern British Columbia and into Alaska, operated by the Alaska State Ferry system (Figure 1). Sensors measure oxygen, temperature, salinity, turbidity, chlorophyll, and organic matter and data are transmitted to shore stations via a Wi-Fi connection.
Shore and Estuarine Stations
Shore and estuarine stations measure sea level, e.g., NOAA and Canadian Hydrographic Service tide gauges, and water properties, often in cooperation with coastal communities. These “community observatories” are motivated by local ocean challenges, e.g., OA, and the need for information, and often funded locally. Instrumentation and data delivery are coordinated through the larger NEP ocean observing systems (NANOOS, ONC). Shore stations include a diversity of sensors including temperature, salinity, nutrients, phytoplankton biomass, pH, pCO2, DIC, carbonate mineral stability, and other metrics of OA. Examples of shore stations are at Campbell River, northern Vancouver Island, on Kwakwaka’wakw and Coast Salish Territory operated by ONC, and on nearby Quadra Island at the northern end of the Strait of Georgia operated by the privately funded Hakai Institute. There are 10 other stations that monitor metrics of OA between Carlsbad, California, and Kodiak, Alaska. A future shore station is planned for Burrard Inlet by the Tsleil-Waututh Nation in collaboration with ONC. Earthquake-detecting accelerometers are installed and operated by ONC at many Vancouver Island stations. Weather stations are also installed at many shore sites.
Ocean Modeling and Forecasting
There are several regional coastal and inland sea models in use for PNW waters. These stretch from Vancouver Island, Canada, to southern Oregon or farther into northern California. They are forced by numerical weather models and obtain boundary conditions from a variety of basin-scale ocean models. Most of the models are based on the Regional Ocean Modeling System7 (Haidvogel et al., 2000). A common goal is to accurately represent flow-topography interactions by using high spatial resolution to represent coastline and bottom topographic features. Some models are purely physical, while others include marine ecosystem modules, the latter sometimes including carbon and oxygen dynamics. Output from all these models is integrated into NANOOS NVS for wider, user-friendly access.
The Oregon State University coastal ocean forecast system for PNW waters produce daily updates of 3-day forecasts of the currents, temperature, salinity, sea surface height, and other dynamic information at 2-km resolution8 (Figure 3). The wind and surface heat flux forcings are obtained from NOAA’s North American Mesoscale weather forecast model. Information about the surrounding ocean comes from a lower-resolution global Navy prediction system. The accuracy of the oceanic forecasts is improved through assimilation of surface currents measured by land-based coastal radars, and satellite sea surface temperature and satellite sea-surface height (Kurapov et al., 2011; Yu et al., 2012). This methodology was transitioned to NOAA where the West Coast Operational Forecast System (WCOFS), spanning the entire United States West Coast, is being developed and tested (Kurapov et al., 2017).
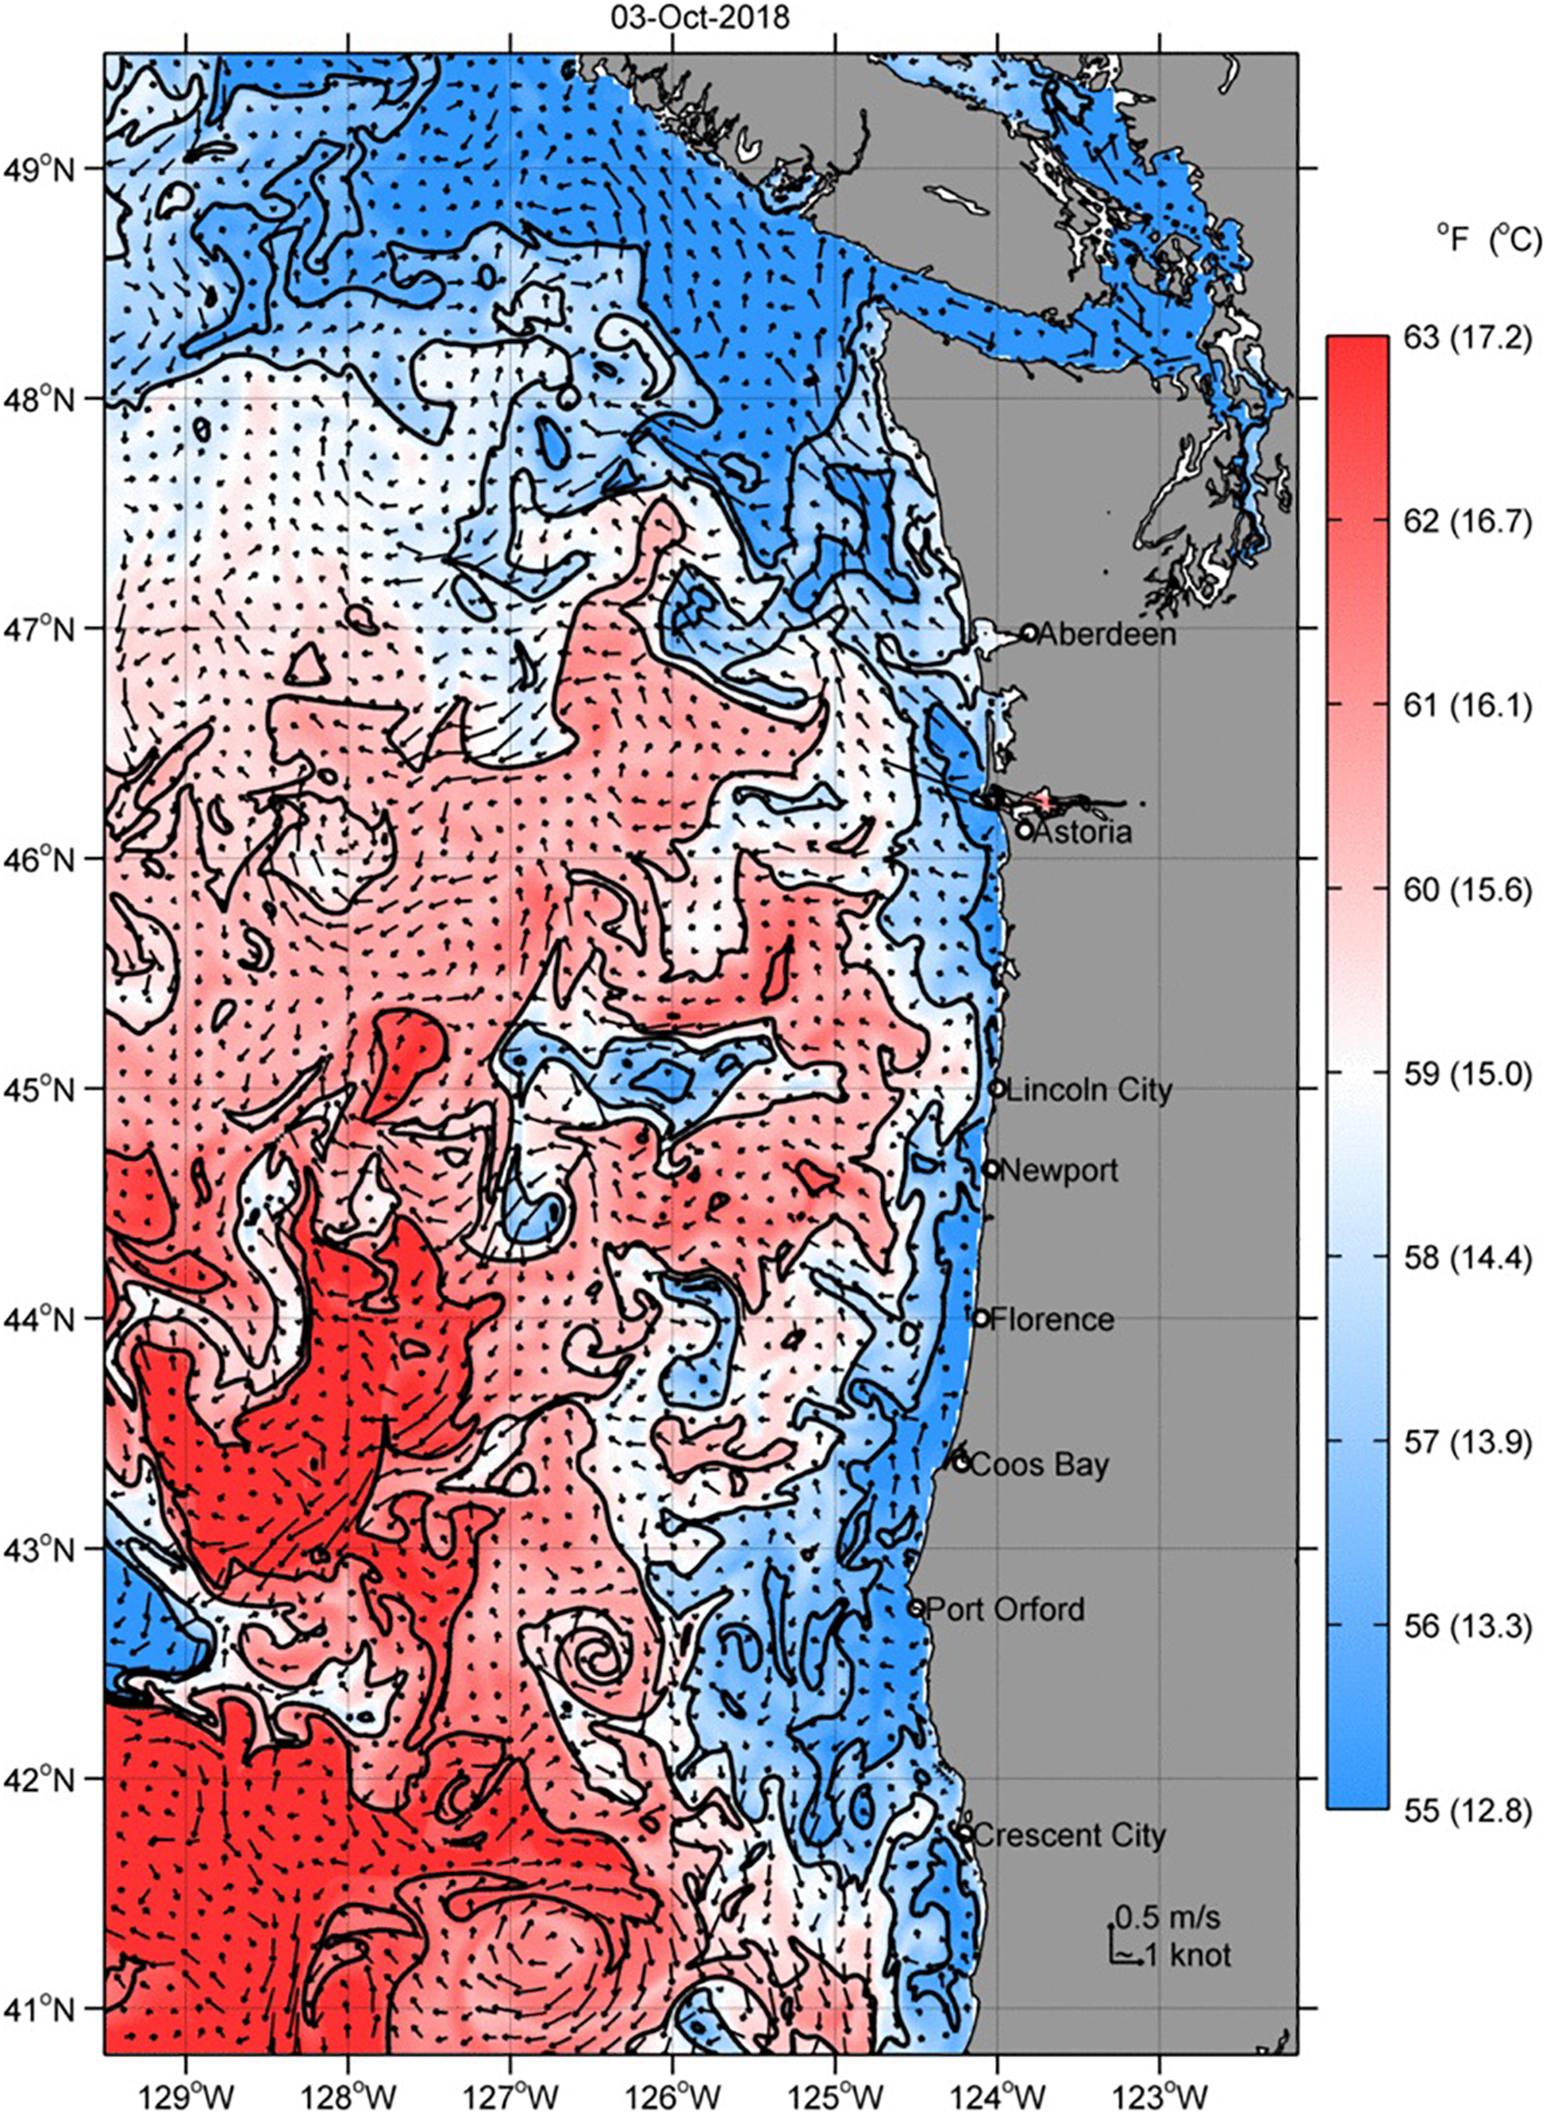
Figure 3. Numerical ocean circulation model nowcast of sea surface temperature off the Pacific Northwest. The color bar is tailored to highlight the location of the 59° Fahrenheit contour, the temperature used by albacore tuna (Thunnus alalunga) fishermen to identify the boundary between cold, upwelled waters and offshore, warm waters where tuna is more likely to be found. Produced by A. Kurapov’s group at OSU and NOAA, and available on the NANOOS Visualization System, http://nvs.nanoos.org/TunaFish.
The SalishSeaCast model operated at the University of British Columbia is a coupled physical-biogeochemical model for the Salish Sea9. Model output is used to predict storm surge for the Strait of Georgia (Soontiens et al., 2016), with storm surge advisories published on the web and pushed to Port Metro Vancouver (Figure 4). Efforts are also underway to create oil spill risk maps and to make sea surface height and current predictions useful for search and rescue and vessel pilots.
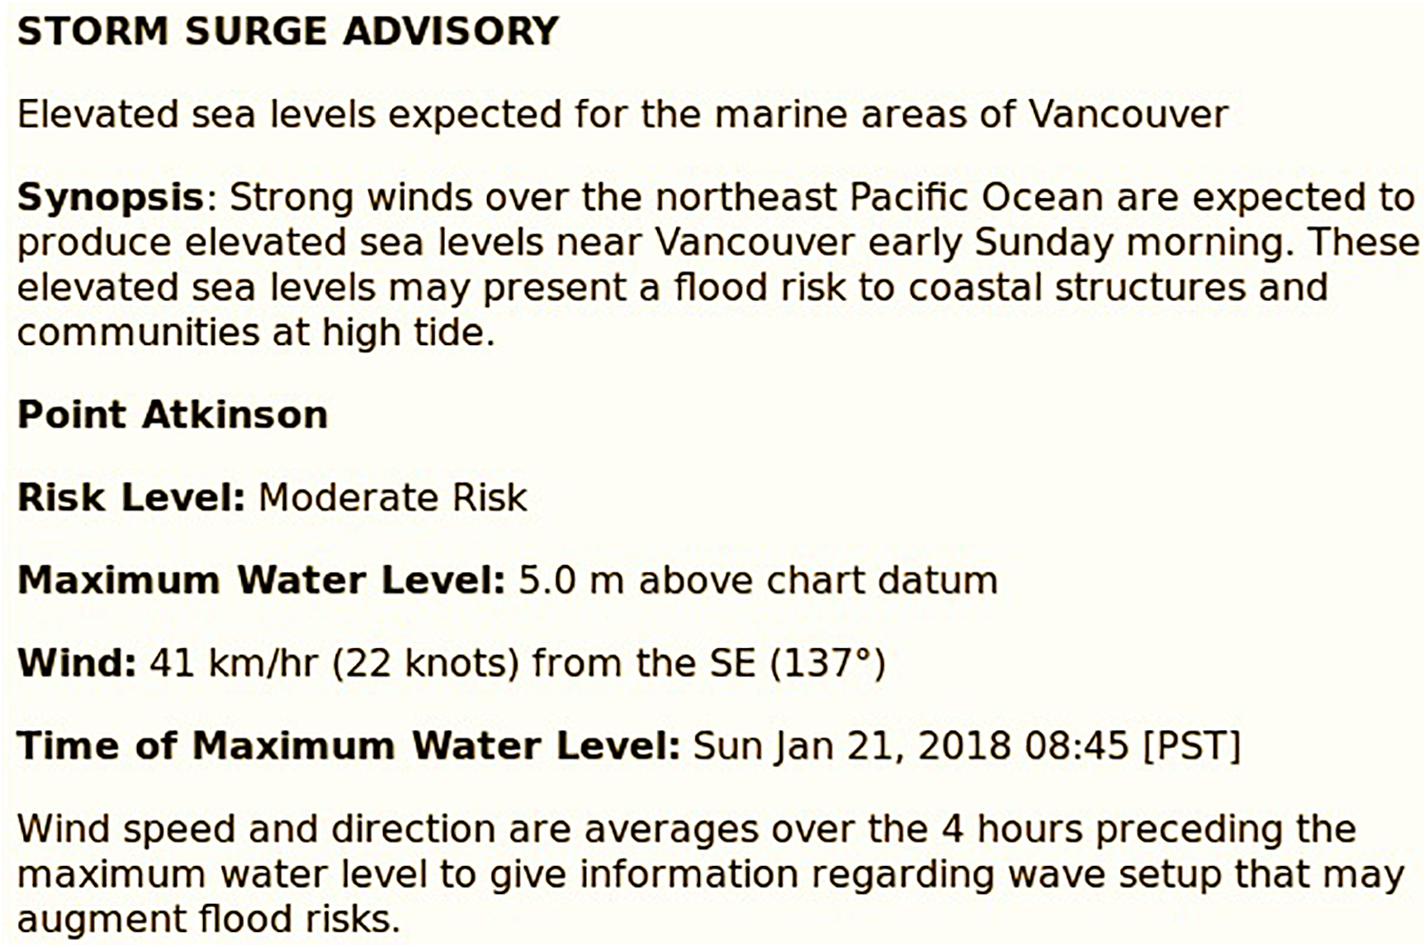
Figure 4. Example of a storm surge advisory for the major Pacific Northwest urban area of Vancouver, BC, Canada. The advisory is produced by a numerical ocean circulation forecast model run by S. Allen (University of British Columbia) and is available at https://salishsea.eos.ubc.ca/storm-surge.
Another active modeling program at the University of Washington is LiveOcean, that simulates ocean water properties in the NEP and Salish Sea10. The model provides 3-day forecasts of aragonite saturation states and pH of waters entering shellfish growing areas on the coast. The model system is built using existing 3D circulation-biogeochemistry hindcast models, incorporating carbon chemistry (Davis et al., 2014; Siedlecki et al., 2015). The modeling has been successful because of its links to the strong NEP observational and stakeholder community. As one stakeholder example, resource managers from Washington and Oregon use LiveOcean forecasts as part of a system to decide whether to close shellfish harvest at the coast in response to HAB (Giddings et al., 2014; and see below).
Northwest Association of Networked Ocean Observing Systems serves output from all three of these models, OSU ROMS, UBC Salish SeaCast, and UW LiveOcean, from its NVS portal, allowing users to compare outputs. A “comparator” feature allows for comparison of model output with the real-time data.
Making Measurements and Models Useful
It is a shared goal in the NEP to make ocean data and model output useful to ocean users, educators, policy makers and the public. By engaging with ocean users, we work to display and make available ocean measurements and model output. Engagement with ocean users is critical and continual iteration and refinement leads to the best results. Examples of ocean and model “products” are found at the web sites of NEP observing and modeling efforts (Table 1). As one example (see Figure 3), ocean circulation model surface temperature nowcast and forecast fields are redrawn using a red-blue color scale to highlight the 59° Fahrenheit contour, the temperature used by albacore tuna (Thunnus alalunga) fishermen to identify the boundary between cold, upwelled waters and offshore, warm waters where tuna are more likely to be found11. The value of these model fields is evident in YouTube videos by fishermen explaining to their fellow fishers how to access and use these fields12. A second example (see Figure 4), is the storm surge advisory issued for the major urban area of Vancouver, BC, United States produced from a numerical ocean circulation forecast model13. A final example is a twice-monthly, web-based bulletin for the early warning of PNW coast HAB events14. Forecasts based on LiveOcean are intended to help resource managers from Neah Bay, WA, United States, to Newport, OR, United States, to target their beachside monitoring of toxicity levels in shellfish and fine-tune decisions regarding closures of beaches to shellfish harvest.
Summary and a Look to the Future
We are fortunate to have a wide range of ocean and seafloor observing assets in the NEP that provides data which adds to longstanding climatologies for the region and that are used to verify and drive ocean circulation and biogeochemical models. The NEP is home to a subduction zone ripe for a magnitude > 8, tsunami-generating earthquake and underwater volcanoes that bound one of the smallest tectonic plates on Earth, the Juan de Fuca plate. Recently, thousands of methane seep sites underlain by gas hydrates have also been discovered along the margin, with unknown impacts on release of greenhouse gas and associated ecosystems. For these reasons, and because of the recent dramatic adverse effects on marine ecosystems from hypoxia, OA and HABs, we dedicate ourselves to maintaining, expanding, improving and integrating the ocean observing system and modeling of the NEP.
There are several examples of cooperation across borders to enhance ocean observing in the NEP. The continued time series at Ocean Station Papa are a result of Canadian and United States coordination of mooring systems, locations, servicing, and field measurement programs. The two large offshore NEP cabled observatories, the OOI Cabled Array and ONC’s NEPTUNE, coordinated placement of cabled measurement nodes along the Juan de Fuca plate and at the subduction zones off Oregon and Vancouver Island, respectively. Many of the oceanographic sensors used across the NEP observing assets are the same or similar, e.g., Conductivity-Depth-Temperature instruments from Sea-Bird Scientific and dissolved oxygen optodes from Aanderaa Data Instruments and are deployed in similar manners. We suggest that this is implicit rather than explicit coordination, but at least demonstrates the commonality of science issues and available instrumentation. It has also been advantageous to have cross-border representation of scientists on some governing boards and oversight committees. Examples of this are United States scientists serving on ONC’s International Science Advisory Board and tribal representation on NANOOS’s Governing Council. Committee members can help cross-pollinate the latest ideas and new measurement techniques between observatories and can help guide the addition of new ocean observing capabilities needed to address their concerns.
Even with this degree of cooperation, there is room for improvement. For example, there could be more coordination on the placement (water depth), functionality and sampling protocols amongst the coastal ocean moorings across the NEP. Data are handled and distributed with different approaches, for example the Canadian data are distributed through a relatively sophisticated, centralized ONC data system while United States data are available across a variety of distribution platforms (OOI, NOAA NODC, NANOOS). There is room for improved coordination on instrument types, sampling, biofouling protection, best practices, metadata, and data quality assurance and control, etc. Activities for this coordination are becoming more routine and should be encouraged, for example, the North Pacific Marine Science Organization’s (PICES) Advisory Panel on North Pacific Coastal Ocean Observing Systems and the inaugural March, 2018, National Coastal Ecosystem Moorings Workshop, organized and hosted by the Alliance for Coastal Technologies and sponsored by IOOS. We are eager to make continued improvements in these areas.
The many needed and planned improvements and expansions of ocean observing and modeling in the NEP are discussed next. A gap in sampling of shelf break processes off Vancouver Island is targeted to be filled soon by regular glider transects. Although some systems are in place, we need to improve our ability to make accurate long-term surface and subsurface measurements of chemical properties and rates. We also need information on the causes of variability in phytoplankton community structure, as well as growth rate information for both phyto- and zooplankton. Another need is the automated physical sampling of phytoplankton at HAB initiation sites such as the Juan de Fuca Eddy, WA, United States, and Heceta Bank, OR, United States. A pilot program by IOOS tested an autonomous underwater vehicle to sample the Juan de Fuca Eddy, with samples delivered to the Makah Tribal analytical lab for measurement of domoic acid and HAB cells. Finally, events such as the Tohoku, Sumatra, and Chilean earthquakes and resultant tsunamis that resulted in the loss of thousands of lives and billions of dollars of damage, serve as an important impetus to increase seismic and tsunami monitoring systems offshore that could feed into NOAA as well as the recently implemented Shake Alert system15.
We have been fortunate to interact with ocean users, international partners, policy makers and private foundations in seeking support for our ocean observing and modeling. We expect the mix of public and private funding to continue into the future but anticipate the day when ocean data and model forecasts are used and increasingly supported by entities that directly benefit from their use. While some of this is happening now, e.g., surf forecasts from Surfline16, there is great potential for the use of ocean data and models in “value added” products that are routinely used by ocean users. It is imperative for us to continue to “seatruth” our ocean models, in particular forecasts of ocean biogeochemical properties like dissolved oxygen and pH (aragonite saturation). We will continue to interact with ocean users to improve our data delivery and derived products. NEP observing systems can be made more efficient by targeting observing assets to key locations identified through ocean observing system simulation experiments.
In addition to our oceanographic fleets and government and academic modeling groups, there are other sources of data to develop. Several examples of “citizen science” are found in the NEP, including a “Netflix” model – based on the original Netflix approach of DVD rental by mail – for placing and regularly exchanging robust pH sensors in Oregon’s Marine Reserves17. As ocean sensors become more robust and affordable, there are more ways to get citizens involved in monitoring our environment. While some ferries plying NEP, waters are instrumented with flow-through systems that return data to shore, there is opportunity to partner with the commercial and recreational fishing communities to make cost-effective ocean observations.
Lastly, in addition to continuing to use our data, models and understanding to inform public policy, we dedicate ourselves to sharing and delivering ocean and seafloor data, including aids in using and understanding them, to the classroom. The investment in the next generation is key as they take on continued challenges of our planet.
Data Availability
Publicly available datasets were analyzed in this study. This data can be found here: http://nvs.nanoos.org.
Author Contributions
JB conceived of this review and wrote the draft based on input from all authors. CR created Figure 2. All authors contributed to editing and improving the final manuscript.
Conflict of Interest Statement
The authors declare that the research was conducted in the absence of any commercial or financial relationships that could be construed as a potential conflict of interest.
Acknowledgments
We thank all members of our ocean observing and modeling teams for their tireless efforts to create and maintain NEP ocean observing and modeling assets. We are grateful to the captains and crews of the research vessels that get us to sea, and to those who grant us access to shore and pier locations. We thank our numerous government and private funders, and our local, national, and international leaders who recognize the importance of the ocean to economies, health and well-being. To tackle important regional ocean issues and all they influence at sea and on land takes cooperation – we are grateful for our oceanographic community in the PNW. The lead author and K. Juniper contributed to this paper while being members on the North Pacific Marine Science Organization’s (PICES) Advisory Panel on North Pacific Coastal Ocean Observing Systems. This is contribution number 4875 from the NOAA Pacific Marine Environmental Laboratory.
Footnotes
- ^https://waterproperties.ca/linep/history.php
- ^http://oceanexports.org/
- ^http://www.oceannetworks.ca/
- ^http://www.oceannetworks.ca/innovation-centre/smart-ocean-systems/ocean-observing-systems/oceans-20
- ^http://www.nanoos.org/
- ^http://nvs.nanoos.org
- ^www.myroms.org
- ^http://ingria.coas.oregonstate.edu/rtdavow/
- ^https://salishsea.eos.ubc.ca/
- ^https://faculty.washington.edu/pmacc/LO/LiveOcean.html
- ^http://nvs.nanoos.org/TunaFish
- ^https://www.youtube.com/watch?v=SctTzbZ-1us
- ^https://salishsea.eos.ubc.ca/storm-surge
- ^http://www.nanoos.org/products/habs/forecasts/bulletins.php
- ^https://www.shakealert.org/
- ^https://www.surfline.com
- ^https://oregon.surfrider.org/monitoring-ocean-acidification-in-oregons-marine-reserves/
References
Adams, K. A., Barth, J. A., and Shearman, R. K. (2016). Intraseasonal cross-shelf variability of hypoxia along the Newport, Oregon, Hydrographic Line. J. Phys. Oceanogr. 46, 2219–2238. doi: 10.1175/JPO-D-15-0119.1
Atwater, B. F. (1987). Evidence for great Holocene earthquakes along the outer coast of Washington state. Science 236, 942–944.
Barth, J. A., Fram, J. P., Dever, E. P., Risien, C. M., Wingard, C. E., Collier, R. W., et al. (2018). Warm blobs, low-oxygen events, and an eclipse: the Ocean Observatories Initiative Endurance Array captures them all. Oceanography 31, 90–97.
Barton, A., Hales, B., Waldbusser, G. G., Langdon, C., and Feely, R. A. (2012). The Pacific oyster, Crassostrea gigas, shows negative correlation to naturally elevated carbon dioxide levels: implications for near-term ocean acidification effects. Limnol. Oceanogr. 57, 698–710.
Barton, A., Waldbusser, G. G., Feely, R. A., Weisberg, S. B., Newton, J. A., Hales, B., et al. (2015). Impacts of coastal acidification on the Pacific Northwest shellfish industry and adaptation strategies implemented in response. Oceanography 28, 146–159.
Bednaršek, N., Feely, R. A., Tolimieri, N., Hermann, A. J., Siedlecki, S. A., Waldbusser, G. G., et al. (2017). Exposure history determines pteropod vulnerability to ocean acidification along the US West Coast. Sci. Rep. 7:4526. doi: 10.1038/s41598-017-03934-z
Bond, N. A., Cronin, M. F., Freeland, H., and Mantua, N. (2015). Causes and impacts of the 2014 warm anomaly in the NE Pacific. Geophys. Res. Lett. 42, 3414–3420.
Caplan-Auerbach, J., Dziak, R. P., Haxel, J., Bohnenstiehl, D. R., and Garcia, C. (2017). Explosive processes during the 2015 eruption of Axial Seamount, as recorded by seafloor hydrophones. Geochem. Geophys. Geosyst. 18, 761–761.
Chadwick, W. W. Jr., Paduan, J. B., Clague, D. A., Dreyer, B. M., Merle, S. G., Bobbitt, A. M., et al. (2016). Voluminous eruption from a zoned magma body after an increase in supply rate at Axial Seamount. Geophys. Res. Lett. 43, 12,063–12,070.
Chan, F., Barth, J. A., Lubchenco, J., Kirincich, A., Weeks, H., Peterson, W. T., et al. (2008). Emergence of anoxia in the California current large marine ecosystem. Science 319:920. doi: 10.1126/science.1149016
Chase, Z., Strutton, P. G., and Hales, B. (2007). Iron links river runoff and shelf width to phytoplankton biomass along the U.S. West Coast. Geophys. Res. Lett. 34:L04607. doi: 10.1029/2006GL028069
Davis, K. A., Banas, N. S., Giddings, S. N., Siedlecki, S. A., MacCready, P., Lessard, E. J., et al. (2014). Estuary-enhanced upwelling of marine nutrients fuels coastal productivity in the U.S. Pacific Northwest. J. Geophys. Res. Oceans 119, 8778–8799.
Dracup, J. A., and Kahya, E. (1994). The relationships between U.S. Streamflow and La Niña events. Water Resour. Res. 30, 2133–2141.
Durrant, T., Greenslade, D., Hemer, M., and Trenham, C. (2014). A Global Wave Hindcast Focussed on the Central and South Pacific. CAWCR Technical Report, No. 070. Melbourne, VIC: Centre for Australian Weather and Climate Research.
Feely, R. A., Alin, S., Carter, B., Bednaršek, N., Hales, B., Chan, F., et al. (2016). Chemical and biological impacts of ocean acidification along the west coast of North America. Estuar. Coast. Shelf Sci. 183, 260–270. doi: 10.1016/j.ecss.2016.08.043
Feely, R. A., Okazaki, R. R., Cai, W.-J., Bednaršek, N., Alin, S. R., Byrne, R. H., et al. (2018). The combined effects of acidification and hypoxia on pH and aragonite saturation in the coastal waters of the Californian Current Ecosystem and the northern Gulf of Mexico. Cont. Shelf Res. 152, 50–60. doi: 10.1016/j.csr.2017.11.002
Feely, R. A., Sabine, C. L., Hernandez-Ayon, J. M., Ianson, D., and Hales, B. (2008). Evidence for upwelling of corrosive “acidified” water onto the continental shelf. Science 320, 1490–1492. doi: 10.1126/science.1155676
Fisher, J. L., Peterson, W. T., and Rykaczewski, R. R. (2015). The impact of El Niño events on the pelagic food chain in the northern California Current. Glob. Change Biol. 21, 4401–4414. doi: 10.1111/gcb.13054
Giddings, S. N., MacCready, P., Hickey, B. M., Banas, N. S., Davis, K. A., Siedlecki, S. A., et al. (2014). Hindcasts of potential harmful algal bloom transport pathways on the Pacific Northwest coast. J. Geophys. Res. Oceans 119, 2439–2461. doi: 10.1002/2013JC009622
Grantham, B. A., Chan, F., Nielsen, K. J., Fox, D. S., Barth, J. A., Huyer, A., et al. (2004). Upwelling-driven nearshore hypoxia signals ecosystem and oceanographic changes in the northeast Pacific. Nature 429, 749–754.
Haidvogel, D. B., Arango, H. G., Hedstrom, K., Beckmann, A., Malanotte-Rizzoli, P., and Shchepetkin, A. F. (2000). Model evaluation experiments in the North Atlantic Basin: simulations in nonlinear terrain-following coordinates. Dyn. Atmos. Oceans 32, 239–281.
Hales, B., Karp-Boss, L., Perlin, A., and Wheeler, P. (2006). Oxygen production and carbon sequestration in an upwelling coastal margin. Glob. Biogeochem. Cycles 20:GB3001. doi: 10.1029/2005GB002517
Huyer, A., Smith, R. L., and Fleischbein, J. (2002). The coastal ocean off Oregon and northern California during the 1997–8 El Niño. Prog. Oceanogr. 54, 311–341.
Huyer, A., Wheeler, P. A., Strub, P. T., Smith, R. L., Letelier, R., and Kosro, P. M. (2007). The Newport line off Oregon—Studies in the northeast Pacific. Prog. Oceanogr. 75, 126–160.
Ianson, D., Allen, S. E., Moore-Maley, B. L., Johannessen, S. C., and Macdonald, R. W. (2016). Vulnerability of a semi-enclosed estuarine sea to ocean acidification in contrast with hypoxia. Geophys. Res. Lett. 43, 5793–5801. doi: 10.1002/2016GL068996
Jackson, J. M., Johnson, G. C., Dosser, H. V., and Ross, T. (2018). Warming from recent marine heatwave lingers in deep British Columbia fjord. Geophys. Res. Lett. 45, 9757–9764.
Kelley, D. S., Delaney, J. R., and The Cabled Array Team. (2016). “NSF’s Cabled Array: a wired tectonic plate and overlying ocean,” in Proceedings of the OCEANS 2016 MTS/IEEE, Monterey, CA. doi: 10.1109/OCEANS.2016.7761398
Kurapov, A. L., Foley, D., Strub, P. T., Egbert, G. D., and Allen, J. S. (2011). Variational assimilation of satellite observations in a coastal ocean model off Oregon. J. Geophys. Res. 116:C05006. doi: 10.1029/2010JC006909
Kurapov, A. L., Pelland, N. A., and Rudnick, D. L. (2017). Seasonal and interannual variability in along-slope oceanic properties off the US West Coast: inferences from a high-resolution regional model. J. Geophys. Res. Oceans 122, 5237–5259. doi: 10.1002/2017JC012721
Mackas, D. L. (1992). Seasonal cycle of zooplankton off Southwestern BC 1979-89. Can. J. Fish. Aquat. Sci. 49, 903–921.
Mackas, D. L., Thomson, R. E., and Galbraith, M. (2001). Changes in the zooplankton community of the British Columbia continental margin, and covariation with oceanographic conditions, 1985-1999. Can. J. Fish. Aquat. Sci. 58, 685–702.
Mantua, N. J., Hare, S. R., Zhang, Y., Wallace, J. M., and Francis, R. C. (1997). A Pacific interdecadal climate oscillation with impacts on salmon production. Bull. Am. Meteorol. Soc. 78, 1069–1079.
Masson, D. (2006). Seasonal water mass analysis for the Straits of Juan de Fuca and Georgia. Atmos. Ocean 44, 1–15.
Mazzini, P. L. F., Barth, J. A., Shearman, R. K., and Erofeev, A. (2014). Buoyancy-driven coastal currents off the Oregon coast during fall and winter. J. Phys. Oceanogr. 44, 2854–2876.
Mazzini, P. L. F., Risien, C. M., Barth, J. A., Pierce, S. D., Erofeev, A., Dever, E. P., et al. (2015). Anomalous near-surface low-salinity pulses off the central Oregon coast. Nat. Sci. Rep. 5:17145. doi: 10.1038/srep17145
McCabe, R. M., Hickey, B. M., Kudela, R. M., Lefebvre, K. A., Adams, N. G., Bill, B. D., et al. (2016). An unprecedented coastwide toxic algal bloom linked to anomalous ocean conditions. Geophys. Res. Lett. 43,10,366–10,376.
McKibben, S. M., Peterson, W., Wood, A. M., Trainer, V. L., Hunter, M., and White, A. E. (2017). Climatic regulation of the neurotoxin domoic acid. Proc. Natl. Acad. Sci. U.S.A. 114, 239–244. doi: 10.1073/pnas.1606798114
McRae, E. (2016). “Continuous real time scanning of the upper ocean water column,” in Proceedings of the MTS/IEEE OCEANS Conference, Monterey, CA. doi: 10.1109/OCEANS.2016.7761359
Mesinger, F., DiMego, G., Kalnay, E., Mitchell, K., Shafran, P. C., Ebisuzaki, W., et al. (2006). North American regional reanalysis. Bull. Am. Meteorol. Soc. 87, 343–360. doi: 10.1175/BAMS-87-3-343
Nooner, S. L., and Chadwick, W. W. Jr. (2016). Inflation-predictable behavior and co-eruption deformation at Axial Seamount. Science 354, 1399–1403.
Peterson, W. T., and Schwing, F. B. (2003). A new climate regime in northeast pacific ecosystems. Geophys. Res. Lett. 30:1896. doi: 10.1029/2003GL017528
Philip, B. T., Denny, A. R., Solomon, E. A., and Kelley, D. S. (2016). Time-series measurements of bubble plume variability and water column methane distribution above Southern Hydrate Ridge, Oregon. Geochem. Geophys. Geosyst. 17, 1182–1196. doi: 10.1002/2016GC006250
Pujol, M.-I., Faugère1, Y., Taburet, T., Dupuy, S., Pelloquin, C., Ablain, M., et al. (2016). DUACS DT2014: the new multi-mission altimeter data set reprocessed over 20 years. Ocean Sci. 12, 1067–1090. doi: 10.5194/os-12-1067-2016
Reynolds, R. W., Smith, T. M., Dudley, C. L., Chelton, B., Casey, K. S., and Schlax, M. G. (2007). Daily high-resolution-blended analyses for sea surface temperature. J. Clim. 20, 5473–5496.
Saldias, G., Shearman, R. K., Barth, J. A., and Tufillaro, N. (2016). Optics of the offshore Columbia River plume from glider observations and satellite imagery. J. Geophys. Res. Oceans 121, 2367–2384.
Siedlecki, S. A., Banas, N. S., Davis, K. A., Giddings, S., Hickey, B. M., MacCready, P., et al. (2015). Seasonal and interannual oxygen variability on the Washington and Oregon continental shelves. J. Geophys. Res. Oceans 120, 608–633. doi: 10.1002/2014JC010254
Smith, L. M., Barth, J. A., Kelley, D. S., Plueddemann, A., Rodero, I., Ulses, G. A., et al. (2018). The ocean observatories initiative. Oceanography 31, 16–35.
Smith, R. L. (1974). A description of current, wind and sea level variations during coastal upwelling off the Oregon coast, July-August 1972. J. Geophys. Res. 79, 435–443.
Soontiens, N., Allen, S. E., Latornell, D., Le Souef, K., Machuca, I., Paquin, J.-P., et al. (2016). Storm surges in the Strait of Georgia simulated with a regional model. Atmos. Ocean 54, 1–21.
Thomson, R., Fine, I., Rabinovich, A., Mihály, S., Davis, E., Heesemann, M., et al. (2011). Observation of the 2009 Samoa tsunami by the NEPTUNE-Canada cabled observatory: test data for an operational regional tsunami forecast model. Geophys. Res. Lett. 38:L11701.
Thomson, R. E. (1981). Oceanography of the British Columbia coast. Can. Spec. Publ. Fish. Aquat. Sci. 56:291.
Tortell, P. D., Merzouk, A., Ianson, D., Pawlowicz, R., and Yelland, D. R. (2012). Influence of regional climate forcing on surface water on pCO2, Delta O2/Ar and dimethylsulfide (DMS) along the southern British Columbian coast. Cont. Shelf Res. 47, 119–132. doi: 10.1016/j.csr.2012.07.007
Waldbusser, G. G., Hales, B., Langdon, C. J., Haley, B. A., Schrader, P., Brunner, E. L., et al. (2015). Saturation-state sensitivity of marine bivalve larvae to ocean acidification. Nat. Clim. Change 5, 273–280. doi: 10.1038/NCLIMATE2479
Whitney, F. A., Crawford, D. W., and Yoshimura, T. (2005). The uptake and export of silicon and nitrogen in HNLC water of the NE Pacific Ocean. Deep Sea Res. II 52, 1055–1067.
Whitney, F. A., and Tortell, P. D. (2006). Fifty years of ocean observations in the Pacific Northeast. EOS Trans. Am. Geophys. Union 87, 551–555. doi: 10.1029/2006EO490005
Wilcock, W. S. D., Dziak, R., Tolstoy, M., Chadwick, W. Jr., Nooner, S., Bohnenstiel, D., et al. (2018). The recent volcanic history of Axial Seamount: geophysical insights into past eruption dynamics with an eye toward enhanced observations of future eruptions. Oceanography 31, 114–123.
Xu, G., Chadwick, W. W., Wilcock, W. S. D., Bemis, K., and Delaney, J. (2018). Observation and modeling of hydrothermal response to the 2015 eruption at Axial Seamount, Northeast Pacific. Geochem. Geophys. Geosyst. 19, 2780–2797. doi: 10.1029/2018GC007607
Keywords: ocean observation, marine eco system, coastal oceanography, ocean model and observations comparison, data delivery
Citation: Barth JA, Allen SE, Dever EP, Dewey RK, Evans W, Feely RA, Fisher JL, Fram JP, Hales B, Ianson D, Jackson J, Juniper K, Kawka O, Kelley D, Klymak JM, Konovsky J, Kosro PM, Kurapov A, Mayorga E, MacCready P, Newton J, Perry RI, Risien CM, Robert M, Ross T, Shearman RK, Schumacker J, Siedlecki S, Trainer VL, Waterman S and Wingard CE (2019) Better Regional Ocean Observing Through Cross-National Cooperation: A Case Study From the Northeast Pacific. Front. Mar. Sci. 6:93. doi: 10.3389/fmars.2019.00093
Received: 28 October 2018; Accepted: 18 February 2019;
Published: 28 March 2019.
Edited by:
Sanae Chiba, Japan Agency for Marine-Earth Science and Technology, JapanReviewed by:
Shinya Kouketsu, Japan Agency for Marine-Earth Science and Technology, JapanChristian T. K.-H. Stadtlander, Independent Researcher, St. Paul, MN, United States
Copyright © 2019 Barth, Allen, Dever, Dewey, Evans, Feely, Fisher, Fram, Hales, Ianson, Jackson, Juniper, Kawka, Kelley, Klymak, Konovsky, Kosro, Kurapov, Mayorga, MacCready, Newton, Perry, Risien, Robert, Ross, Shearman, Schumacker, Siedlecki, Trainer, Waterman and Wingard. This is an open-access article distributed under the terms of the Creative Commons Attribution License (CC BY). The use, distribution or reproduction in other forums is permitted, provided the original author(s) and the copyright owner(s) are credited and that the original publication in this journal is cited, in accordance with accepted academic practice. No use, distribution or reproduction is permitted which does not comply with these terms.
*Correspondence: John A. Barth, jack.barth@oregonstate.edu