Contrasting Controls on Microzooplankton Grazing and Viral Infection of Microbial Prey
 David Talmy1*
  Stephen J. Beckett2*
  Adam B. Zhang2
  Darcy A. A. Taniguchi3
  Joshua S. Weitz2,4 Michael J. Follows5
- 1Department of Microbiology, University of Tennessee, Knoxville, TN, United States
- 2School of Biological Sciences, Georgia Institute of Technology, Atlanta, GA, United States
- 3Scripps Institution of Oceanography, University of California, San Diego, La Jolla, CA, United States
- 4School of Physics, Georgia Institute of Technology, Atlanta, GA, United States
- 5Department of Earth, Atmospheric and Planetary Sciences, Massachusetts Institute of Technology, Cambridge, MA, United States
The encounter and capture of bacteria and phytoplankton by microbial predators and parasites is fundamental to marine ecosystem organization and activity. Here, we combined classic biophysical models with published laboratory measurements to infer functional traits, including encounter kernel and capture efficiency, for a wide range of marine viruses and microzooplankton grazers. Despite virus particles being orders of magnitude smaller than microzooplankton grazers, virus encounter kernels and adsorption rates were in many cases comparable in magnitude to grazer encounter kernel and clearance, pointing to Brownian motion as a highly effective method of transport for viruses. Inferred virus adsorption efficiency covered many orders of magnitude, but the median virus adsorption efficiency was between 5 and 25% depending on the assumed host swimming speed. Uncertainty on predator detection area and swimming speed prevented robust inference of grazer capture efficiency, but sensitivity analysis was used to identify bounds on unconstrained processes. These results provide a common functional trait framework for understanding marine host-virus and predator-prey interactions, and highlight the value of theory for interpreting measured life-history traits.
1. Introduction
Marine ecosystems include diverse microbial communities whose interactions mediate and drive biogeochemical cycles. Within these systems, photosynthetic primary producers, and heterotrophic bacteria are infected by viruses, and preyed upon by microzooplankton grazers (Dussart, 1965; Landry and Hassett, 1982; Bergh et al., 1989; Fuhrman and Noble, 1995; Sunagawa et al., 2015). Marine ecosystem models are increasingly resolving the diversity of metabolisms and traits that influence ecosystem function (Bruggeman and Kooijman, 2007; Follows et al., 2007; Stock et al., 2014; Weitz, 2015; Coles et al., 2017), but questions remain about how to empirically parameterize key interactions. In particular, as the biogeochemical significance of viruses is increasingly recognized (Brussaard, 2004; Suttle, 2007; Weitz and Wilhelm, 2012; Brum et al., 2015; Guidi et al., 2015), it is imperative to incorporate the diversity of virus-microbe interactions within models of global-scale impacts of viruses on ecosystem structure and function (Mateus, 2017).
By regenerating nutrients (Weinbauer, 2004; Jover et al., 2014), viruses and grazers can have significant “bottom-up” effects on marine microbial communities. Viruses, in particular, can impact ocean ecology and biogeochemistry through modification of cellular metabolism during infection (Lindell et al., 2005; Sullivan et al., 2006; Bidle and Vardi, 2011; Ankrah et al., 2014; Rosenwasser et al., 2016). Nonetheless, viruses and grazers can also impose “top-down” controls on marine microbial communities by infecting and lysing their hosts, or by engulfing and metabolizing their prey (Thingstad and Lignell, 1997; Thingstad, 2000; Breitbart, 2012; Weitz, 2015). Understanding viral and grazer impacts on microbial ecosystems requires a common framework connecting key traits that underly their mortality-inducing behaviors.
Many factors influence the ability of a predator or parasite to encounter and capture its prey. For example, grazers adopt a range of strategies, including filter feeding, ambush feeding, and cruising (Kiørboe, 2011). Furthermore, there are a variety of mechanisms used by predators to sense and capture their prey, including infochemicals such as dimethylsulfoniopropionate (DMSP) (Vos et al., 2006), and sensing of hydromechanical signals generated during prey swimming (Visser, 2001). Trait based approaches to ecology have been used to parameterize diversity, and organism size is a key trait that constrains organism growth, respiration, as well as predator-prey interactions (Kleiber, 1947; Banse, 1976; Armstrong, 1999; Brose et al., 2006; Weitz and Levin, 2006; Ward et al., 2012; Andersen et al., 2016). But how does organism size influence virus and grazer encounter, and “capture” of their shared prey?
Viruses are typically smaller than bacterial hosts, and grazers tend to be larger (Figure 1). Differences in size, and also life-strategy, suggest there are contrasting rules for viruses and grazers that dictate their transport, encounter, and ultimately the capture of microbial prey. Indeed, viruses depend passively on Brownian motion for encounter, whereas grazers typically use some form of motility. These differences are thought to emerge from the size dependence of Brownian motion (Berg and Purcell, 1977; Fenchel, 1984; Murray and Jackson, 1992). In the virus size range, transport by Brownian motion is rapid, rendering motile transport unnecessary (Shimeta and Jumars, 1991; Shimeta, 1993; Dusenbery, 1997). For predators the size of microzooplankton grazers, transport due to Brownian motion is negligible, necessitating some form of motility.
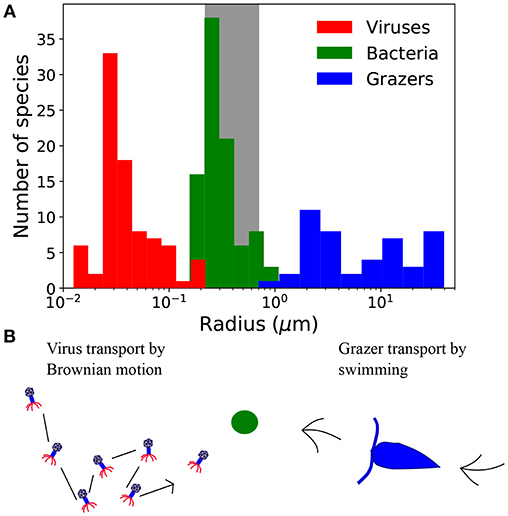
Figure 1. (A) Size distribution of virus, bacteria, and grazers. Virus radius relates to capsid cross-section, and bacteria and grazer values are equivalent spherical radius. Viruses include a compilation of bacteriophage (Brum et al., 2013; Jover et al., 2014) and viruses of eukaryotic algae (Brussaard, 2004; Brum et al., 2013), including the largest, “giant viruses” (Abergel et al., 2015). Bacteria are from the compilation of DeLong et al. (2010), and include a range of marine and non-marine species. Grazers are from Taniguchi et al. (2014). Frequency at each size represents the number of cultured strains, which says nothing of the relative abundance at each size, or phylogenetic contrast (Felsenstein, 2017). (B) Contrasting strategies to encounter prey, represented here with the green circle. Viruses are dependent on Brownian motion, whereas grazers must swim to find prey.
Here, size related controls on predator-prey and host-parasite encounter and capture will be used to constrain key ecosystem model traits. We combine well-known theoretical predictions of microbial encounter rates with published measurements of capture rates, and explore the capture efficiency of viruses and microzooplankton grazers. Our coverage of biophysical models and published literature represents review of established literature. Our novel findings arise through comparison of theory and synthesized data, and the development of a unified framework to compare and contrast microzooplankton and virus interactions with other microbes. For convenience, we will refer to viruses and grazers collectively as “predators,” and to bacteria and phytoplankton collectively as “prey.”
2. Materials and Methods
We first define virus and grazer encounter and capture traits and their connection with microbial loss processes. We then revisit classic biophysical parameterizations of virus and grazer encounter kernels, and an empirical rationale that was used to assess capture rates. We then explain how empirical estimates of virus and grazer capture rates were combined with theoretical predictions of encounter kernel to predict virus and grazer capture efficiencies.
2.1. Predator-Prey Interaction Models
Consider the following mass balance of a producer P, preyed upon by viruses, Vi, and microzooplankton grazers, Zj (where P, Vi and Zj all have units fmol C μm−3):
In Equation 1, producers grow at rate μ, and losses due to viral infection and grazing are parameterized through linear encounter terms, according to the infection and grazing parameters ϕv,i and ϕz,j, respectively. The indices i and j differentiate virus and grazer types. Equation 1 is a relatively simple representation of producer growth and losses. Many more complicated forms exist, accounting for nonlinear interactions (Gentleman et al., 2003; Blackford et al., 2004), and additional feedbacks (Thingstad, 2000; Weitz, 2015). Nonetheless, the limited set of parameters in Equation 1 remain poorly constrained.
The parameters ϕv, i and ϕz, j are influenced by physical controls on encounter between viruses, predators, and their shared prey, along with biological factors that influence whether each encounter is converted to successful capture. Let the encounter kernel of a virus and a microzooplankton grazer be ρv and ρz, respectively. The encounter kernel has units μm3 s−1, and is the volume of water shared by each individual predator-prey pair per unit time. Let the probability that each encounter is converted to a successful capture be ηv and ηz. Infection and grazing parameters ϕv and ϕz may then be expressed in the following way:
All parameters and variables are defined in Table 1. In Equations 2 and 3, i, j indices are suppressed for notational parsimony. We normalize by virus and grazer carbon quotas, Qv and Qz (fmol C individual−1; Table 1) respectively, to express each trait per unit predator or parasite biomass. In the following, we develop a parameterization of the infection and grazing parameters ϕv and ϕz. We revisit classic biophysical models that predict ρv and ρz from contrasting lifestyles of viruses and microzooplankton grazers. We present literature compilations of virus adsorption to hosts and grazer maximal clearance rates, and use these to infer the capture efficiencies ηv and ηz.
Table 1. Model parameter and variable descriptions and units.
2.2. Size Dependent Encounter
We revisit classic biophysical models of predator-prey encounter kernel. Our aim is to provide a rationale to constrain ecosystem model parameters ρv and ρz. Full model descriptions are given in Appendix A (Supplementary information), and here we summarize the main equations.
Assume predators and prey are spheres with radius rpred and rprey, respectively. With knowledge of the predator and prey swimming speed (upred and uprey, respectively) and Brownian motion (Dpred and Dprey, respectively) the predator-prey encounter kernel may be predicted with (Berg and Purcell, 1977; Fenchel, 1984; Evans, 1989 Murray and Jackson, 1992; Kiørboe, 2008):
In Equation 4, motile predators have a detection area proportional to body size, due to chemosensing, and sensing ability connected with mechanical disruption of the surrounding water (Visser, 2001; Martens et al., 2015). We separate the effects of predator-prey encounter associated with the transport mode of motile predators (i.e., grazers, ρz) and diffusion predators (i.e., viruses, ρv):
Equations 5 and 6 are special cases of Equation 4, with Dpred = 0 and upred = 0, respectively. Setting Dpred = 0 neglects predator Brownian motion, accounting only for the effects of predator swimming speed. On the other hand, setting upred = 0 neglects predator swimming, and accounts only for the effects of Brownian motion. Prey diffusivity and swimming are both accounted for in Equations 5 and 6, and only the traits of the predators are different. We use these special cases to contrast predator motion by swimming (grazers) and Brownian motion (viruses), allowing both forms of motion in the prey.
2.3. Parameterizing Predator-Prey Encounter Kernels
To understand encounter by diffusion and swimming in different sized predators, we require knowledge of the predator detection radius (rdetect), predator swimming velocity (upred), prey swimming velocity (uprey) and predator and prey diffusivity (Dpred and Dpred), respectively. Of these, the diffusion constants Dpred and Dprey are the most reliably constrained, as they arise directly from physical principles (Appendix A, Supplementary information, and Table 1). For swimming velocities, we rely on compilations of measured swimming velocities for organisms ranging from bacteria to macrozooplankton. Specifically, we assume swimming velocity scales with organismal radius according to a power law with exponent 0.79 (Kiørboe, 2011; see Table 2). The power law relation arises from linear regression of measured swimming speed against organismal radius.
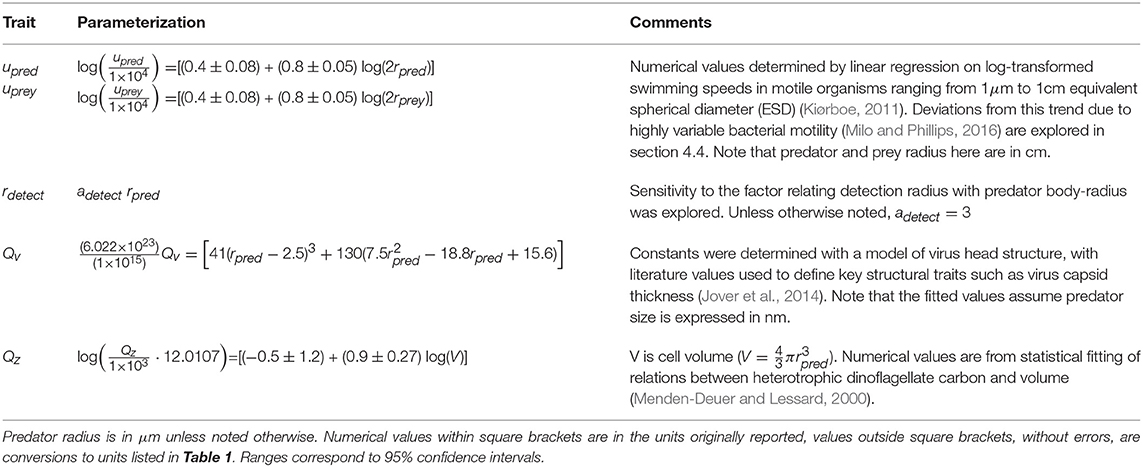
Table 2. Size dependent trait parameterizations for individual predators and prey.
Microzooplankton detect prey with a combination of hydromechanical signals (Visser, 2001), and chemosensing (Martens et al., 2015). Models that predict detection radius due to hydromechanical signals generated by prey motion exist (Visser, 2001). These models typically contain many parameters, such as the predator “effective radius,” or the angle of approach between grazer and prey (Gerritsen and Strickler, 1977; Visser, 2001), which are poorly constrained empirically. By making assumptions regarding the size-dependence of prey swimming velocity, Martens et al. (2015) predicted a power-law relation between predator size and detection radius. We tested a range of power-law dependencies of detection radius on predator size, but these had negligible influence on our main findings. In the absence of thorough empirical constraint on key processes across a large range of sizes, we chose a parsimonious description which assumes a linear relation between rdetect and predator radius (Table 2). We conduct sensitivity of our main findings to different factors relating motile predator detection radius with body size.
3. Empirical Prey Capture Rates
Theoretical encounter kernel predictions demonstrate the influence of physics on microbial transport and encounter. Yet, the flow of carbon from microbial prey to viruses and grazers is controlled by additional phenomena that determine whether each encounter leads to successful capture (Equations 1 to 3). The capture efficiency parameters ηv and ηz encompass many biological interactions that are difficult to motivate and constrain theoretically. We therefore look to experimental data to understand virus and grazer prey capture.
We assumed that virus adsorption rates and grazer maximal clearance rates are empirical analogs of prey capture, and gathered existing literature with measurements of these key traits. Viral adsorption is typically measured by the rate of disappearance of free viruses shortly after addition to cultures of susceptible hosts (Supplementary Table 1). When the loss of virus due to adsorption is the only control on free-virus concentration (excluding viral production due to release of viral progeny), the change with time is simply:
If it is assumed that each adsorption leads to successful infection and host lysis, and that additional complications associated with virus latent period may be ignored, then ϕv in Equation 7 also controls the loss of host material in Equation 1. We acknowledge that host resistance mechanisms or lysogenic interactions could prevent viral adsorption from leading to lysis, and that latent periods can have a major impact on this coupling (Stewart and Levin, 1984; Beretta and Kuang, 1998; Labrie et al., 2010; Record et al., 2016). Nonetheless, adsorption measurements are relatively widely available. We compiled a dataset of published virus adsorption rates (Supplementary Table 1, Appendix C) that we think of here as capture rates, ϕv. The data include a mix of marine and non-marine species. Adsorption values were collected from experiments with a single viral strain adsorbing to a host specific to that virus.
Grazer maximal clearance rates, ϕz, were inferred by dividing maximal grazing rates by half saturation values in a large compilation of published laboratory measurements reported by Taniguchi et al. (2014). These data in most cases were of microzooplankton grazing on a single species of phytoplankton and the data only include cases where the prey were within the size range thought to be optimal for each predator (Hansen et al., 1994, 1997).
We compared virus adsorption rates ϕv, inferred through Equation 7, with grazer maximal clearance rates ϕz, keeping in mind the caveat that not all adsorption leads immediately to infection and host lysis. We also combined these traits with theoretical estimates of encounter kernel to predict virus and grazer capture efficiencies.
4. Results
We begin by presenting the size-dependence of predator encounter kernel due to Brownian motion and motility. We then present published data of virus and grazer capture rate due to adsorption and clearance, respectively. Finally, we combine empirical capture rates with theoretical encounter kernel predictions to infer capture efficiencies for viruses and microzooplankton grazers.
4.1. Swimming vs. Brownian Motion
In Figure 2a, we show a comparison between the predator encounter kernel by a purely diffusive (ρv) and a purely motile (ρz) predator, ignoring for now the effects of prey motion by setting uprey = 0 and Dprey = 0 in Equations 5 and 6. We acknowledge that transport of very small grazers could also be influenced by Brownian motion, but we ignore these effects and focus on first-order physical controls on grazer and virus transport. The encounter kernel due to Brownian motion diminishes with body size. In contrast, since search area and swimming velocity both increase with size (Table 2), predators that swim are predicted to encounter ever more prey the larger they become (Figure 2a).
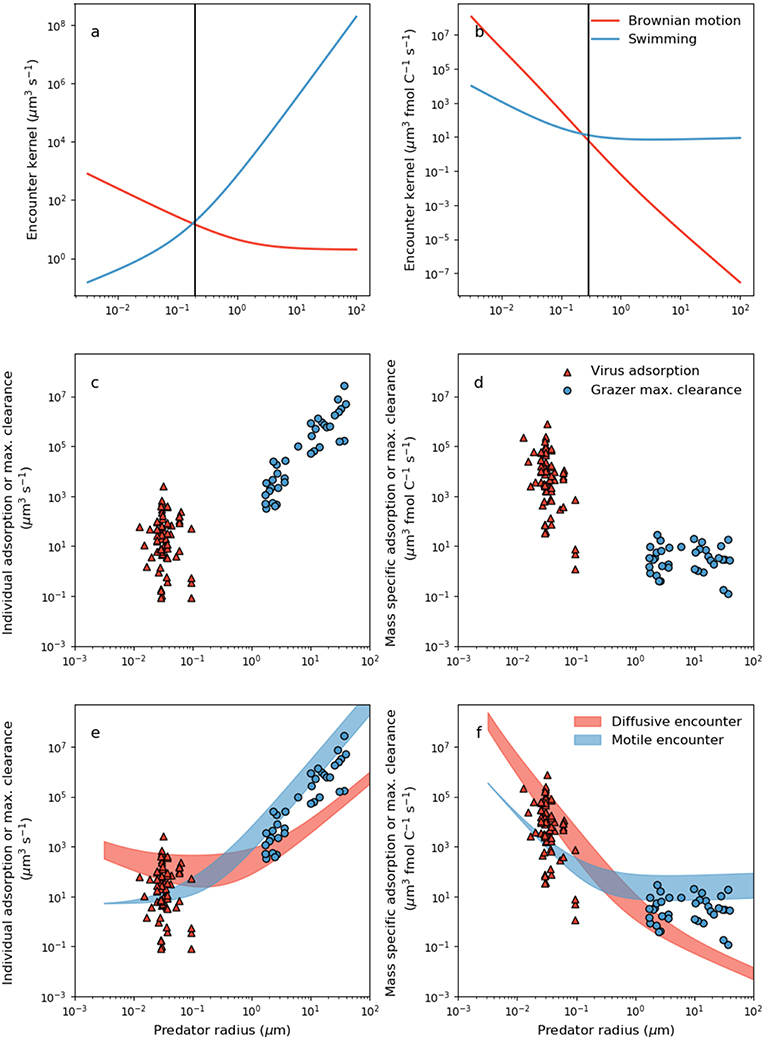
Figure 2. Dependence of theoretical encounter kernel and empirical capture rate on predator size and mode of transport. (a) Per-capita theoretical encounter kernel predictions of motile predators (ρz) and predators whose transport is dictated by Brownian motion (ρv) using Equations 5 and 6, respectively. Prey motility was neglected by setting uprey = 0. Prey cell radius was assumed to be 1 μm. (b) Mass specific encounter kernels (ρv/Qv and ρz/Qz for diffusive and motile predators, respectively). The vertical lines in (a,b) demarcate two domains: a small size domain where predator movement by Brownian motion is most effective, and a large size domain where movement by swimming is most effective. (c) Per capita viral adsorption rates and grazer maximal clearance rates. Viral data are in Supplementary Table 1. (d) The same data in (c) normalized per unit carbon in either the virus or the grazer (Equations 2 and 3, Table 2). (e) Comparison of per-capita theoretical encounter kernels with per capita capture rates. Filled regions are theoretical encounter kernels accounting for prey motion by allowing uprey to vary with predator and prey size according to the parameterizations in Table 2. The ranges cover [0.5,5]μm host radius (viruses only), and a 10-fold change in swimming velocity across all size ranges (grazers only) (f) Mass-specific equivalents of the relations in (e).
The encounter kernels in Figure 2a are the volume of water shared by each individual predator-prey pair, per unit time. In Figure 2b, we show size dependence of encounter kernel normalized by predator individual carbon content, ρv/Qv and ρz/Qz for viruses and grazers, respectively. It is common practice in the zooplankton literature to normalize per unit volume or biomass in the predator (e.g., Hansen et al., 1997; Kiørboe, 2011). Large motile predators encounter more prey simply due to the larger volume of water that they occupy (Figure 2a), but this overlooks the greater concentration of prey required to sustain larger body size. Normalizing by cellular carbon is one way to correct for the higher requirement of larger predators for prey biomass, and isolates trait variation with body size that is due to physical and behavioral controls on encounter.
Viewed through the lens of either individual or carbon normalized values, we can deduce that smaller predators achieve a higher encounter rate from passive diffusion than swimming (Figures 2a,b). In contrast, for larger predators passive diffusion is a poor method of encounter, by comparison to swimming. Interestingly, the predator radius at which Brownian motion and motile encounter kernals are predicted to intersect, marked by the vertical lines in Figures 2a,b, is ~200nm, corresponds approximately to the capsid radius of the largest known viruses (Figure 1). Below the size threshold, the theory predicts non-motile predators that depend on Brownian motion have relatively large encounter kernels. The steep decline in predator diffusivity with size necessitates swimming for larger predators. The theory thus predicts a biophysical limit on the upper size of non-motile predators, and on the lower size of motile predators. With similar analysis, Dusenbery (1997) showed that a size threshold exists in the bacteria size range, below which Brownian motion is a more effective mode of transport, and above which motile transport is necessary. In Appendix B (Supplementary information), we show that the size threshold where transport by Brownian motion and motile behavior intersect shows very little sensitivity to assumptions regarding predator swimming speed, detection area, and prey motion. The results in Figures 2a,b and Appendix B (Supplementary information) extend the analysis of Dusenbery (1997) and suggest that mode of transport of microbial predators is also controlled by the size dependence of Brownian motion, and motile behavior.
4.2. Prey Capture Rates
We compiled a dataset of bacteriophage adsorption rates, containing a mix of marine and non-marine viruses (Supplementary Table 1, Appendix C). Each adsorption value is of a single viral strain adsorbing onto a host. In Figures 2c,d, we show a comparison of these virus adsorption data with estimates of grazer maximal clearance rates. For both viral adsorption and maximal clearance rates, we report both the adsorption per virus, and maximal clearance rate per individual grazer (Figure 2c), and the biomass normalized values (Figure 2d). Conversion between per-capita and carbon specific values was made with estimates of carbon quota in Table 2. Values per individual are equivalent to ηvρv and ηzρz for viruses and grazers, respectively. Mass specific values are assumed to be equivalent to ϕv and ϕz in Equations 2 and 3, respectively.
Whether normalized per individual, or per unit biomass, virus adsorption and grazer maximal clearance rates are extremely scattered, in both cases covering several orders of magnitude (Figures 2c,d). When normalized per-capita, it is not possible to rule out the possibility that there is no linear relationship between virus adsorption rate and capsid radius (Figure 2c) (regression slope −0.5, R2 = −0.085, p−value 0.7). Variability in per-capita virus adsorption that is unrelated to size may be due to variability in host motility, host surface receptor density, virus and host morphology, host physiological state, virus affinity for host surface receptors, and experimental uncertainty. Nevertheless, conversion to carbon specific values (Figure 2d) indicates a negative relationship between mass specific encounter kernel and virus radius. The negative relation may be driven by the normalization of encounter kernel by individual carbon quota, and cannot be attributed to the diminishing effect of Brownian motion on the encounter kernel of larger viruses.
When expressed per individual grazer, there is a strong increase in maximal clearance rate with individual body size (Figure 2c) (regression slope 2.65, R2 = 0.92, p−value <10−15). Normalizing per unit carbon highlights considerable variability in grazer maximal clearance rate that is independent of body size (Figure 2d). Mass specific grazer maximal clearance rates cover several orders of magnitude, but there is very little trend in maximal carbon specific clearance rates with respect to microzooplankton size (Figure 2d). Kiørboe (2011) reported a similar absence of size-based variability in volume specific maximal clearance rates for a much larger range of zooplankton sizes.
4.3. Connecting Encounter and Capture Rates
Despite significant scatter in the data, several patterns emerge in our estimates of per-capita and mass specific adsorption and maximal clearance rates (Figures 2,b), that are qualitatively consistent with theoretical encounter kernel predictions (Figures 2c,d). Per-capita grazer encounter kernel and maximal clearance rates both increase with individual body size (Figures 2a,c), but this trend disappears when normalized per unit carbon (Figures 2b,d). Moreover, when expressed per individual, large grazers have the propensity to encounter and capture more prey than virus-sized competitors (Figures 2a,c), but carbon specific values suggest the opposite. Despite virus particles being orders of magnitude smaller than microzooplankton grazers, the largest virus per-capita encounter kernels and adsorption rates are comparable in magnitude to per-capita encounter kernel and clearance rates of grazers several orders of magnitude larger (Figures 2a,c). The ability of viruses to encounter large volumes of water despite their small size points to Brownian motion as an effective method of transport. The effects of rapid transport by Brownian motion are heightened when viewed through the lens of mass specific normalization, where encounter kernel and adsorption rates of virus-size organisms exceed encounter kernel and maximal clearance rates of grazer-sized organisms by several orders of magnitude (Figures 2b,d).
The qualitative consistency between theoretical predictions of encounter (Figures 2a,b), and measurements of virus adsorption and maximal clearance rates (Figures 2c,d), points toward a mechanistic link between the two processes. Indeed, theoretical encounter kernel predictions should set upper limits on observed capture rates. In Figures 2e,f, we show theoretical encounter kernel predictions, this time allowing also for prey motility according to Equations 5 and 6 and the parameterizations in Table 2. The red filled region covers encounter kernels for diffusive predators of prey within the range [0.5,5]μm. The blue filled region allows 10-fold variability in the swimming velocity of motile predators across all size ranges. The theoretical encounter kernel predictions in the filled regions in Figures 2d,e should set upper limits on the capture rates, but the comparison depends critically on rates of swimming velocity and cell size that are specific to each predator-prey pair. In the next section, we combine theoretical encounter kernel predictions and measured capture rates to infer capture efficiencies of diverse predators.
4.4. Capture Efficiency
A measure of virus and grazer capture efficiency may be found by dividing measured capture rates by theoretical upper limits predicted with encounter kernels. Rearranging Equations 2 and 3 leads to capture efficiency expressions:
In Equations 8 and 9, and may be thought of intuitively as the ratio of per-capita capture rate (either viral adsorption, or grazer maximal clearance), to encounter kernal. The quotas Qv and Qz convert between the carbon specific values more relevant to Equation 1 (see also Equations 2, 3, Figure 2d), and individual units that emerge directly from theoretical predictions (Equations 5 and 6).
Equations 8 and 9 combine theoretical predictions of encounter kernel with adsorption and maximal clearance rates, to predict virus and grazer capture efficiency. Not every predator-prey encounter leads to successful prey capture (adsorption for viruses, clearance for grazers), so ηv and ηz should be less than one. Values of ηv and ηz greater than one imply capture efficiencies greater than 100%, and that our theoretical model of encounter is incomplete, measurements of virus and grazer maximal clearance rates include unaccounted for error, or a combination of both. Thus, a test of the compatability of our biophysical parameterizations (Equations 5 and 6, Figures 2a,b) and the laboratory measurements (Figures 2c,d), are whether predictions of ηv and ηz are consistently less than one.
Theoretical predictions of ηv and ηz are shown in Figure 3. The predictions are ranked from low to high values. Ordering with respect to predator size did not yield meaningful trends. Due to the large potential for variability in microbial swimming speed (Milo and Phillips, 2016), we include a sensitivity allowing 10-fold increase and decrease in the swimming velocities upred and uprey, provided by the relations in Table 2. These values account fully for variability in observed swimming speeds for organisms ranging from bacteria to krill (Kiørboe, 2011). For viruses, ~70% of the measured adsorption rates fall at or below the theoretical encounter kernel limit (Figure 3A), with median predicted “capture” (adsorption) efficiency ~5% when fast swimming is assumed, and ~25% when slow swimming is assumed. These results are relatively insensitive to assumptions about prey swimming speed (Figures 3A,B), and suggest that in the majority of cases, measured adsorption rates indeed fall at or below the theoretical encounter kernel limit. Notably however, ~30% of measurements suggest that viruses adsorb to hosts faster than expected based on biophysical arguments; an observation which remains unresolved and could indicate the presence of other virus loss mechanisms not accounted for in the experiments.
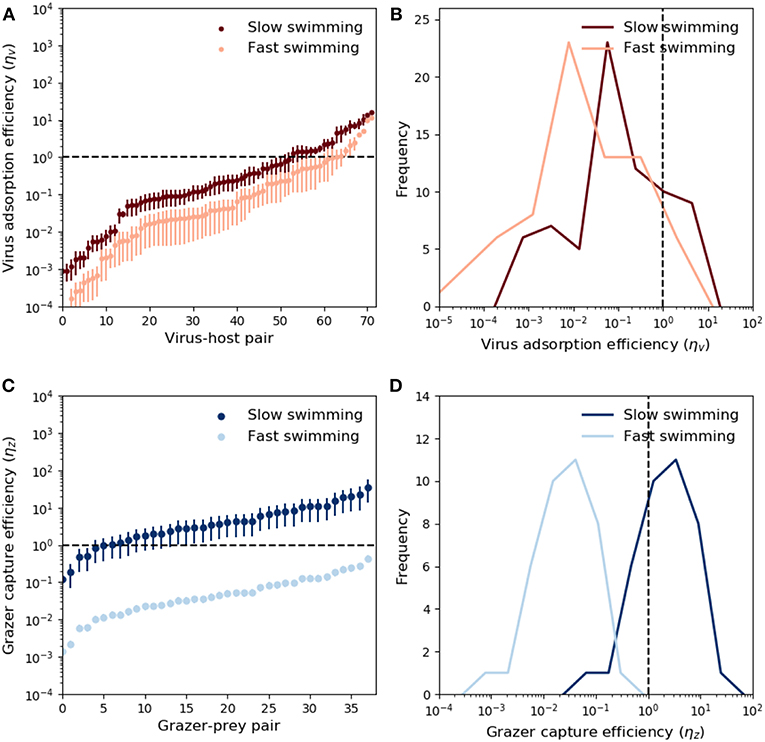
Figure 3. Modeled virus and grazer capture efficiency. For viruses, these values are the measured mass specific adsorption rate, ϕv, divided by theoretical predictions of mass-specific encounter kernel (ρv/Qv, Equation 5 and Table 2). For grazers, the capture efficiency is the mass specific maximal clearance rate, ϕz, divided by mass specific encounter kernel (ρz/Qz, Equation 6 and Table 2). Predator and prey swimming speed and detection area were calculated with knowledge of predator-prey size, and the relations in Table 2. (A) Adsorption efficiency for each virus-host pair. The horizontal dashed line marks the case of perfect adsorption, where the theoretical prediction of encounter kernel matches exactly the observed adsorption value (ϕd = ρv/Qv). Different shades show the sensitivity of these predictions to a range of scaling between body size and swimming speed (see main text). Whiskers correspond to uncertainty in measurements of virus and host size (Supplementary Table 1). (B) Same data in (A), expressed as histograms. (C) Capture efficiencies for each grazer-prey pair. Prey size was not specified, but whiskers indicate prediction uncertainty when predator:prey size ratios cover the full range reported in the data (Hansen et al., 1994, 1997). Different shades correspond to uncertainty in swimming speeds. (D) Same data in (C), expressed as histograms.
By contrast to viruses, grazer capture efficiency shows strong sensitivity to assumptions about predator and prey swimming speed. This is demonstrated in Figure 3 by assuming “fast” and “slow” dependence of swimming on predator and prey body size. For a 5μm cell, “slow swimming” is roughly equivalent to one body length per second, whereas “fast swimming” is roughly equivalent to one hundred body lengths per second. The fast and slow scenarios in Figure 3 are approximately a 10-fold increase and decrease in the scaling relationships reported by Kiørboe (2011). These modifications were applied to both predators and prey simultaneously, and are therefore likely to lead to somewhat extreme upper and lower limits on inferred capture efficiencies. Fast swimming elevates predicted encounter kernel (see Appendix B, Supplementary information), causing theoretical predictions of encounter kernel to exceed observed maximal clearance rate (Figure 3C), leading to median capture efficiency ~4% (Figure 3D). Slow swimming significantly lowers theoretical encounter kernel predictions, in many cases leading to predictions of ηz greater than one (Figures 3C,D). Predator swimming speeds that lead to inferred capture efficiency greater than 100% are implausible theoretically. In this way, the analysis in Figures 3C,D, suggests “fast” microbial swimming speeds are unlikely to be true. Slower predator and prey swimming speeds lead to more plausible capture efficiencies (Figures 3C,D).
Through its influence on encounter kernel, an additional source of uncertainty on grazer capture efficiency is the assumed detection radius of motile predators (Table 2). Sensitivity to different assumptions regarding the size-dependence of predator detection area are shown in Appendix B (Supplementary information). Larger detection areas lead to larger encounter kernels. By inspection of Equation 5, we see that predator detection area has qualitatively similar influence on predicted encounter kernel to the swimming speed; larger swimming velocity and detection area both promote larger encounter kernels. Thus, precise estimates of grazer capture efficiencies require constraint on both microbial detection distance (Martens et al., 2015), and microbial swimming speed (Milo and Phillips, 2016).
When the dependence of swimming speed on predator size is known, it is possible to place lower bounds on the detection radius necessary for encounter kernel predictions to place upper limits on measured grazer maximal clearance rates. In Figure 4, as the assumed predator detection radius increases, so does the theoretical grazer encounter kernel, which raises the theoretical upper limit on grazer maximal clearance rates, and pushes inferred capture efficiencies below 100%. The analysis in Figure 4 shows that, depending on the assumed scaling of swimming speed with predator size, predator detection radius must be at least 1-10 times the predator body radius, for theoretical encounter kernel predictions to place upper bounds on measured clearance rates. When predators and prey both swim according to the scaling reported by Kiørboe (2011), the detection radius must be at least four-times the predator body radius (adetect ≈ 4), for theoretical encounter kernel predictions to place upper bounds on all pairwise predator-prey measured capture rates.
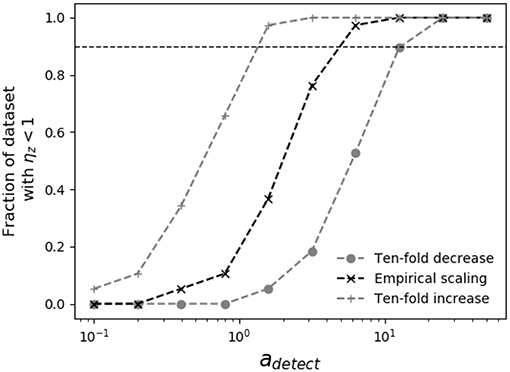
Figure 4. Sensitivity of grazer capture efficiency to assumed predator detection area. Shown is the fraction of measured grazer maximal clearance rates, ϕz that fall at or below the theoretical upper limit, ρz (i.e., ηz < 1), for various assumptions regarding predator swimming speed and detection area. The horizontal dashed line shows when 90% of the theoretical estimates of ρz place upper bounds on ϕz. Different assumptions about swimming speeds cover ranges reported in the literature (Martens et al., 2015; Milo and Phillips, 2016), allowing 10-fold increase and decrease in the empirical scaling reported by Kiørboe (2011) (Table 2). When swimming speed and body size are related by the empirical scaling reported by Kiørboe (2011), predator detection radius must be at least four times the predator radius (adetect ≈ 4) for theoretical encounter kernels to place upper bounds on measured maximal clearance rates.
5. Discussion
Motivated by the need to parameterize and constrain virus and grazer traits that control material transfer through microbial ecosystems, we explored underlying biophysical controls on the lifestyles of microbial predators, and asked whether theoretical predictions of encounter kernel relate to measurements of per-capita and mass-specific virus adsorption and grazer maximal clearance rates. We compared theoretical predictions of encounter kernel with published measurements of virus adsorption and maximal clearance to infer capture efficiencies. Capture efficiencies for viruses and grazers both cover many orders of magnitude and depend strongly on assumptions about microbial swimming speed. Despite significant uncertainty on capture efficiencies, a consistent theme emerges that links encounter kernel with observed capture rates: mass specific viral adsorption rates exceed equivalent values for grazers, and these predictions are consistent with the contrasting effects of Brownian motion and motility on predator transport and encounter with prey. Mass specific rates directly control material transfer in microbial systems. Fast mass specific viral adsorption rates suggests Brownian motion is a highly effective mode of transport for marine viruses. Rapid transport by Brownian motion may be a major driver of efficient and rapid infection in microbial ecosystems.
Our results suggest systematic differences between virus adsorption and grazer clearance that are driven by organism size and method of transport. Nonetheless, measurements of virus adsorption and grazer clearance both cover many orders of magnitude, highlighting the challenge to constrain the influence of these processes on microbial ecosystems. For viruses, rates of adsorption that are much smaller than theoretical encounter kernel predictions could arise for many reasons, including surface resistance or incompatibility between virus and host. In addition, the observation that measured adsorption rates exceed putative biophysical limits for ~30% of cases remains unresolved. One possibility is that there are other sources of decay unaccounted for by adsorption assays. Viruses are prone to degradation by UV damage and hydrolytic enzymes (Wilhelm et al., 1998; Noble and Fuhrman, 1999). Loss of viruses due to either of these mechanisms could lead to overestimation of viral adsorption rates. Routine correction of adsorption assays for losses in host-free media could help to isolate adsorption from other loss processes. Additionally, we are unable to discount the potential for hosts to mediate viral degradation rates. Another possibility is that our biophysical model is an underestimate of true host-virus encounter rates. If so, it is likely host motility is the source of the discrepancy, rather than viral diffusion which is based on established physical principles. Quantifying the efficiency of virus adsorption in a broad range of species, and resolving limits in biophysical models and experimental measurements remains a major challenge to connect virus life-histories with microbial ecosystem structure and organization.
The biophysical arguments underlying predicted virus and grazer traits contain several assumptions that limit their ability to explain mortality inducing behaviors of viruses and grazers in microbial ecosystems. Most pressing perhaps is the comparison of predicted encounter kernel with measurements of adsorption from single host-virus systems cultivated in the laboratory. In more diverse systems, not every host strain is susceptible to infection by every virus strain (Flores et al., 2011; Weitz et al., 2013). Many systems contain a mix of generalist and specialist viruses. Viruses with a narrow host range are likely to successfully infect only a small portion of the hosts they encounter. When only a small portion of encounters leads to successful infections, adsorption could be significantly smaller than physical predictions of encounter. Grazer prey preferences could cause similar discrepancies for motile predators (Gentleman et al., 2003; Campbell et al., 2009).
Our biophysical models did not account for effects of turbulent diffusion (Breitbart, 2012; Durham and Stocker, 2012; Stocker, 2012; Pecseli et al., 2014). Both phyto- and microzoo- plankton motility has long been thought to be selected for by environmental turbulence (Margalef, 1978), with a gradient in turbulence expected to select grazers that employ contrasting strategies, such as filter feeding, ambush feeding, and cruise-feeding (Levandowsky et al., 1988; Lewis and Pedley, 2001). Encounter between zooplankton grazers and their prey is modified by turbulence (Rothschild and Osborn, 1988; Marrase et al., 1990; Yamazaki et al., 1991; Huisman et al., 2002). We neglected turbulence in our analysis for a number of reasons. First, our focus here was on microzooplankton with body size smaller than Kolmogorov lengthscales (~0.1–10mm). Turbulent effects on encounter are increasingly important for larger grazers, but are less significant for predator-prey pairs small enough to be transported cohesively by turbulent flow. Second, our main aim was to contrast and explain differences between virus and grazer traits, as opposed to explaining variability within the different groups. Accounting for grazing strategies such as ambush, filter, or cruise-feeding, may help to explain variability in observed grazer traits, but we reserve this analysis for future exploration.
We assumed that populations are well-mixed and homogenous, but at the microscale, numerous mechanisms promote patchy distributions of organic material, predators, and prey (Lehman and Scavia, 1982; Blackburn, 1997; Blackburn and Fenchel, 1999; Seymour et al., 2006). For example, the microenvironment surrounding phytoplankton cells is rich in dissolved organic material and can be attractive to motile bacteria (Smriga et al., 2016). We neglected the possibility for swimming to be directed, but the ability of motile predators and prey to direct their motion toward or away from resource patches is likely to be a major influence on encounter in heterogeneous environments. We also did not explore temperature effects on microbial predator-prey encounter and capture rates. Swimming velocity of motile predators can vary up to 3-fold with temperature ranging from 5 to 20°C (Larsen et al., 2008), but temperature dependence is highly species specific and can depend on acclimation state (Beveridge et al., 2010). Temperature can influences transport through energetic effects on Brownian motion and metabolic activity of motile organisms (Beveridge et al., 2010; Simoncelli et al., 2019). Temperature can also influence encounter through modifications in fluid viscosity, and is a factor influencing virus adsorption rates (Moldovan and Wu, 2007; Tokman et al., 2016). The effects of heterogeneous microenvironments and temperature on microbial predator-prey encounter and capture both require in-depth consideration, which we reserve for future investigation.
Our encounter kernel predictions, combined with measurements of adsorption and maximal clearance rates, motivate a rationale for contrasting controls on virus and grazer induced mortality, but are by no means the only factors influencing population and community structure and dynamics. Virus degradation and grazer mortality (Steele and Frost, 1977; Noble and Fuhrman, 1997; Weinbauer et al., 1997; De Paepe and Taddei, 2006), as well as differences in metabolism, virus lysogenic cycles, host resistance mechanisms, and grazer respiratory costs, all impact ecosystem function (Weitz, 2015; Våge et al., 2018). We anticipate that the biophysical framework presented here may in future be combined with more complete ecosystem model structures to explore virus and grazer impacts on ocean ecology and biogeochemistry. Theoretical predictions of virus-host and grazer-prey encounter kernel, ground-truthed with laboratory measurements of virus adsorption and maximal clearance, are a simple, mechanistic way to understand the rules that control emergence of traits in marine ecosystems. Quantitative constraint on predator traits offers a path to understanding top-down control on microbial communities and their influence on ocean biogeochemistry.
Author Contributions
DT and SB conceived the idea for the study. DT, SB, DAT, JW, and MF developed the theory. DT, SB, and AZ collected and analyzed the literature data on virus adsorption, and DAT provided source material and datasets for the grazer maximal clearance rates. DT, SB, DAT, JW, and MF all contributed to writing the manuscript.
Funding
DT and MF acknowledge NSF Biological Oceanography grant 1536521. MF and JW acknowledge support from the Simons Foundation (SCOPE Award ID 329108). MF also acknowledges Simons Collaboration CBIOMES Award 549931.
Conflict of Interest Statement
The authors declare that the research was conducted in the absence of any commercial or financial relationships that could be construed as a potential conflict of interest.
Supplementary Material
The Supplementary Material for this article can be found online at: https://www.frontiersin.org/articles/10.3389/fmars.2019.00182/full#supplementary-material
Supplementary Table 1. Virus adsorption rates.
References
Abergel, C., Legendre, M., and Claverie, J. M. (2015). The rapidly expanding universe of giant viruses: Mimivirus, Pandoravirus, Pithovirus and Mollivirus. FEMS Microbiol. Rev. 39, 779–796. doi: 10.1093/femsre/fuv037
Andersen, K. H., Berge, T., Gonçalves, R. J., Hartvig, M., Heuschele, J., Hylander, S., et al. (2016). Characteristic sizes of life in the oceans, from bacteria to whales. Ann. Rev. Mar. Sci. 8, 218–241. doi: 10.1146/annurev-marine-122414-034144
Ankrah, N. Y. D., May, A. L., Middleton, J. L., Jones, D. R., Hadden, M. K., Gooding, J. R., et al. (2014). Phage infection of an environmentally relevant marine bacterium alters host metabolism and lysate composition. ISME J. 8, 1089–1100. doi: 10.1038/ismej.2013.216
Armstrong, R. A. (1999). Stable model structures for representing biogeochemical diversity and size spectra in plankton communities. J. Plankton Res. 21, 445–464. doi: 10.1093/plankt/21.3.445
Banse, K. (1976). Rates of growth, respiration and photosynthesis of unicellular algae as related to cell size - a review. J. Phycol. 12, 135–140.
Beretta, E., and Kuang, Y. (1998). Modeling and analysis of a marine bacteriophage infection. Math. Biosci. 149, 57–76.
Berg, H. C., and Purcell, E. M. (1977). Physics of chemoreception. Biophys. J. 20, 193–219. doi: 10.1016/S0006-3495(77)85544-6
Bergh, Ø., BØrsheim, K. Y., Bratbak, G., and Heldal, M. (1989). High abundance of viruses found in aquatic environments. Nature 340, 467–468.
Beveridge, O. S., Petchey, O. L., and Humphries, S. (2010). Mechanisms of temperature-dependent swimming: the importance of physics, physiology and body size in determining protist swimming speed. J. Exp. Biol. 213, 4223–4231. doi: 10.1242/jeb.045435
Bidle, K. D., and Vardi, A. (2011). A chemical arms race at sea mediates algal host-virus interactions. Curr. Opin. Microbiol. 14, 449–457. doi: 10.1016/j.mib.2011.07.013
Blackburn, N. (1997). Spatially explicit simulations of a microbial food web. Limnol. Oceanogr. 42, 613–622.
Blackburn, N., and Fenchel, T. (1999). Influence of bacteria, diffusion and shear on micro-scale nutrient patches, and implications for bacterial chemotaxis. Mar. Ecol. Prog. Ser. 189, 1–7.
Blackford, J., Allen, J., and Gilbert, F. (2004). Ecosystem dynamics at six contrasting sites: a generic modelling study. J. Mar. Syst. 52, 191–215. doi: 10.1016/j.jmarsys.2004.02.004
Breitbart, M. (2012). Marine viruses: truth or dare. Ann. Rev. Mar. Sci. 4, 425–448. doi: 10.1146/annurev-marine-120709-142805
Brose, U., Williams, R. J., and Martinez, N. D. (2006). Allometric scaling enhances stability in complex food webs. Ecol. Lett. 9, 1228–1236. doi: 10.1111/j.1461-0248.2006.00978.x
Bruggeman, J., and Kooijman, S. A. L. M. (2007). A biodiversity-inspired approach to aquatic ecosystem modeling. Limnol. Oceanogr. 52, 1533–1544. doi: 10.4319/lo.2007.52.4.1533
Brum, J., Schenck, R., and Sullivan, M. (2013). Global morphological analysis of marine viruses shows minimal regional variation and dominance of non-tailed viruses. ISME J. 7, 1738–1751. doi: 10.1038/ismej.2013.67
Brum, J. R., Hurwitz, B. L., Schofield, O., Ducklow, H. W., and Sullivan, M. B. (2015). Seasonal time bombs: dominant temperate viruses affect Southern Ocean microbial dynamics. ISME J. 2, 1–13. doi: 10.1038/ismej.2015.125
Brussaard, C. P. D. (2004). Viral control of phytoplankton populations - a review. J. Eukaryot. Microbiol. 51, 125–138. doi: 10.1111/j.1550-7408.2004.tb00537.x
Campbell, R. G., Sherr, E. B., Ashjian, C. J., Plourde, S., Sherr, B. F., Hill, V., et al. (2009). Mesozooplankton prey preference and grazing impact in the western Arctic Ocean. Deep. Res. Part II Top. Stud. Oceanogr. 56, 1274–1289. doi: 10.1016/j.dsr2.2008.10.027
Coles, V., Stukel, M., Brooks, M., Burd, A., Crump, B., Moran, M., et al. (2017). Ocean biogeochemistry modeled with emergent trait-based genomics. Science 358, 1149–1154. doi: 10.1126/science.aan5712
De Paepe, M., and Taddei, F. (2006). Viruses' life history: towards a mechanistic basis of a trade-off between survival and reproduction among phages. PLoS Biol. 4:e193. doi: 10.1371/journal.pbio.0040193
DeLong, J. P., Okie, J. G., Moses, M. E., Sibly, R. M., and Brown, J. H. (2010). Shifts in metabolic scaling, production, and efficiency across major evolutionary transitions of life. Proc. Natl. Acad. Sci. U.S.A. 107, 12941–12945. doi: 10.1073/pnas.1007783107
Durham, W. M., and Stocker, R. (2012). Thin phytoplankton layers: characteristics, mechanisms, and consequences. Ann. Rev. Mar. Sci. 4, 177–207. doi: 10.1146/annurev-marine-120710-100957
Dusenbery, D. B. (1997). Minimum size limit for useful locomotion by free-swimming microbes. Proc. Natl. Acad. Sci. U.S.A. 94, 10949–10954. doi: 10.1073/pnas.94.20.10949
Evans, G. T. (1989). The encounter speed of moving predator and prey. J. Plankton Res. 11, 415–417. doi: 10.1093/plankt/11.2.415
Felsenstein, J. (2017). Phylogenies and the comparative method. Am. Nat. 125, 1–15. doi: 10.1111/j.1558-5646.1985.tb00420.x
Fenchel, T. (1984). “Suspended marine bacteria as a food source,” in Flows of Energy and Materials in Marine Ecosystems, ed. M. Fasham (Berlin: Springer), 301–315.
Flores, C. O., Meyer, J. R., Valverde, S., Farr, L., and Weitz, J. S. (2011). Statistical structure of host-phage interactions. Proc. Natl. Acad. Sci. U.S.A. 108, 288–297. doi: 10.1073/pnas.1101595108
Follows, M. J., Dutkiewicz, S., Grant, S., and Chisholm, S. W. (2007). Emergent biogeography of microbial communities in a model ocean. Science 315, 1843–1846. doi: 10.1126/science.1138544
Fuhrman, J. A., and Noble, R. T. (1995). Viruses and protists cause similar bacterial mortality seawater. Liminology Oceanogr. 40, 1236–1242.
Gentleman, W., Leising, A., Frost, B., Strom, S., and Murray, J. (2003). Functional responses for zooplankton feeding on multiple resources: A review of assumptions and biological dynamics. Deep. Res. Part II Top. Stud. Oceanogr. 50, 2847–2875. doi: 10.1016/j.dsr2.2003.07.001
Gerritsen, J., and Strickler, J. (1977). Encounter probabilities and community structure in zooplankton: a mathematical model. J. Fish. Res. board Canada 34, 73–82.
Guidi, L., Chaffron, S., Bittner, L., Eveillard, D., Larhlimi, A., Roux, S., et al. (2015). Plankton networks driving carbon export in the oligotrophic ocean. Nature 532, 465–470. doi: 10.1038/nature16942
Hansen, B., Bjornsen, P. K., and Hansen, P. J. (1994). The size ratio between planktonic predators and their prey size. Limnol. Oceanogr. 39, 395–403.
Hansen, P., Bjornsen, P., and Hansen, B. (1997). Zooplankton grazing and growth: scaling within the 2-2,000-micrometer body size range. Limnol. Oceanogr. 42, 687–704. doi: 10.4319/lo.1997.42.4.0687
Huisman, J., Arrayás, M., Ebert, U., and Sommeijer, B. (2002). How do sinking phytoplankton species manage to persist? Am. Nat. 159, 245–254. doi: 10.1086/338511
Jover, L. F., Effler, T. C., Buchan, A., Wilhelm, S. W., and Weitz, J. S. (2014). The elemental composition of virus particles: implications for marine biogeochemical cycles. Nat. Rev. Microbiol. 12, 519–528. doi: 10.1038/nrmicro3289
Kiørboe, T. (2008). A Mechanistic Approach to Plankton Ecology (Princeton, NJ: Princeton University Press).
Kiørboe, T. (2011). How zooplankton feed: mechanisms, traits and trade-offs. Biol. Rev. 86, 311–339. doi: 10.1111/j.1469-185X.2010.00148.x
Labrie, S. J., Samson, J. E., and Moineau, S. (2010). Bacteriophage resistance mechanisms. Nat. Rev. Microbiol. 8, 317–327. doi: 10.1038/nrmicro2315
Landry, M. R., and Hassett, R. P. (1982). Estimating the grazing impact of marine micro-zooplancton. Mar. Biol. 67, 283–288. doi: 10.1007/BF00397668
Larsen, P. S., Madsen, C. V., and Riisgård, H. U. (2008). Effect of temperature and viscosity on swimming velocity of the copepod Acartia tonsa, brine shrimp Artemia salina and rotifer Brachionus plicatilis. Aquat. Biol. 4, 47–54. doi: 10.3354/ab00093
Lehman, J. T., and Scavia, D. (1982). Microscale patchiness of nutrients in plankton communities. Science 216, 729–731
Levandowsky, M., Klafter, J., and White, B. S. (1988). Feeding and swimming behavior in grazing microzooplankton. J. Protozool. 35, 243–246. doi: 10.1111/j.1550-7408.1988.tb04334.x
Lewis, D. M., and Pedley, T. J. (2001). The influence of turbulence on plankton predation strategies. J. Theor. Biol. 210, 347–365. doi: 10.1006/jtbi.2001.2310
Lindell, D., Jaffe, J. D., Johnson, Z., Church, G. M., and Chisholm, S. W. (2005). Photosynthesis genes in marine viruses yield proteins during host infection. Nature 438, 86–89. doi: 10.1038/nature04111
Margalef, R. (1978). Life-forms of phytoplankton as survival alternatives in an unstable environment. Oceanol. Acta 1, 493–509. doi: 10.1007/BF00202661
Marrase, C., Costello, J. H., Granata, T., and Strickler, J. R. (1990). Grazing in a turbulent environment: energy dissipation, encounter rates, and efficacy of feeding currents in Centropages hamatus. Proc. Natl. Acad. Sci. U.S.A. 87, 1653–1657. doi: 10.1073/pnas.87.5.1653
Martens, E. A., Wadhwa, N., Jacobsen, N. S., Lindemann, C., Andersen, K. H., and Visser, A. (2015). Size structures sensory hierarchy in ocean life. Proc. R. Soc. B Biol. Sci. 282, 1–9. doi: 10.1098/rspb.2015.1346
Mateus, M. (2017). Bridging the gap between knowing and modeling viruses in marine systems—an upcoming frontier. Front. Mar. Sci. 3:284. doi: 10.3389/fmars.2016.00284
Menden-Deuer, S., and Lessard, E. J. (2000). Carbon to volume relationships for dinoflagellates, diatoms, and other protist plankton. Limnol. Oceanogr. 45, 569–579. doi: 10.4319/lo.2000.45.3.0569
Moldovan, R., and Wu, X. L. (2007). On kinetics of phage adsorption. Biphysical J. 93, 303–315. doi: 10.1529/biophysj.106.102962
Murray, A. G., and Jackson, G. A. (1992). Viral dynamics: a model of the effects of size, shape, motion and abundance of single-celled planktonic organisms and other particles. Mar. Ecol. Prog. Ser. 89, 103–116. doi: 10.3354/meps089103
Noble, R., and Fuhrman, J. (1999). Breakdown and microbial uptake of marine viruses and other lysis products. Aquat. Microb. Ecol. 20, 1–11. doi: 10.3354/ame020001
Noble, R. T., and Fuhrman, J. A. (1997). Virus decay and its causes in coastal waters. Appl. Environ. Microbiol. 63, 77–83
Pecseli, H. L., Trulsen, J. K., and Fiksen, Ø. (2014). Predator – prey encounter and capture rates in turbulent environments. Limnol. Oceanogr. Fluids Environ. 4, 85–105. doi: 10.1215/21573689-2768717
Record, N. R., Talmy, D., and Vage, S. (2016). Quantifying tradeoffs for marine viruses. Front. Mar. Sci. 3, 1–27. doi: 10.3389/fmars.2016.00251
Rosenwasser, S., Ziv, C., Creveld, S. G. V., and Vardi, A. (2016). Virocell metabolism: metabolic innovations during host – virus interactions in the ocean. Trends Microbiol. 24, 821–832. doi: 10.1016/j.tim.2016.06.006
Rothschild, B. J., and Osborn, T. R. (1988). Small-scale turbulence and plankton contact rates. J. Plankton Res. 10, 465–474. doi: 10.1093/plankt/10.3.465
Seymour, J. R., Seuront, L., Doubell, M., Waters, R. L., and Mitchell, J. G. (2006). Microscale patchiness of virioplankton. J. Mar. Biol. Assoc. 86, 551–561. doi: 10.1017/S0025315406013464
Sharqawy, M. H., John, V. H. L., and Zubair, S. M. (2010). Thermophysical properties of seawater: a review of existing correlations and data. Desalin. Water Treat. 16, 354–380. doi: 10.5004/dwt.2010.1079
Shimeta, J. (1993). Diffusional encouter of submicrometer particles and small cells by suspension feeders. Limnol. Oceanogr. 38, 456–465.
Shimeta, J., and Jumars, P. (1991). Physical mechanisms and rates of particle capture by suspension feeders. Oceanogr. Mar. Biol. Annu. Rev. 29, 191–257. doi: 10.1016/j.jembe.2004.08.013
Simoncelli, S., Thackeray, S. J., and Wain, D. J. (2019). Effect of temperature on zooplankton vertical migration velocity. Hydrobiologia 829, 143–166. doi: 10.1007/s10750-018-3827-1
Smriga, S., Fernandez, V. I., Mitchell, J. G., and Stocker, R. (2016). Chemotaxis toward phytoplankton drives organic matter partitioning among marine bacteria. Proc. Natl. Acad. Sci. U.S.A. 113, 1576–1581. doi: 10.1073/pnas.1512307113
Steele, J. H., and Frost, B. W. (1977). The structure of plankton communities. Philos. Trans. R. Soc. Lond. B. Biol. Sci. 280, 485–534.
Stewart, F., and Levin, B. (1984). The population biology of bacterial viruses: why be temperate. Theor. Popul. Biol. 26, 93–117.
Stock, C. A., Dunne, J. P., and John, J. G. (2014). Global-scale carbon and energy flows through the marine planktonic food web: an analysis with a coupled physical-biological model. Prog. Oceanogr. 120, 1–28. doi: 10.1016/j.pocean.2013.07.001
Stocker, R. (2012). Marine microbes see a sea of gradients. Science 338, 628–633. doi: 10.1126/science.1208929
Sullivan, M. B., Lindell, D., Lee, J. A., Thompson, L. R., Bielawski, J. P., and Chisholm, S. W. (2006). Prevalence and evolution of core photosystem II genes in marine cyanobacterial viruses and their hosts. PLoS Biol. 4, 1344–1357. doi: 10.1371/journal.pbio.0040234
Sunagawa, S., Coelho, L. P., Chaffron, S., Kultima, J. R., Labadie, K., Salazar, G., et al. (2015). Structure and function of the global ocean microbiome. Science 348:1261359. doi: 10.1126/science.1261359
Suttle, C. A. (2007). Marine viruses–major players in the global ecosystem. Nat. Rev. Microbiol. 5, 801–812. doi: 10.1038/nrmicro1750
Taniguchi, D. A. A., Franks, P. J. S., and Poulin, F. J. (2014). Planktonic biomass size spectra: an emergent property of size-dependent physiological rates, food web dynamics, and nutrient regimes. Mar. Ecol. Prog. Ser. 514, 13–33. doi: 10.3354/meps10968
Thingstad, T. F. (2000). Elements of a theory for the mechanisms controlling abundance, diversity, and biogeochemical role of lytic bacterial viruses in aquatic systems. Limnol. Oceanogr. 45, 1320–1328. doi: 10.4319/lo.2000.45.6.1320
Thingstad, T. F., and Lignell, R. (1997). Theoretical models for the control of bacterial growth rate, abundance, diversity and carbon demand. Aquat. Microb. Ecol. 13, 19–27. doi: 10.3354/ame013019
Tokman, J. I., Kent, D. J., Wiedmann, M., and Denes, T. (2016). Temperature significantly affects the plaquing and adsorption efficiencies of listeria phages. Front. Mar. Sci. 7:631. doi: 10.3389/fmicb.2016.00631
Våge, S., Bratbak, G., Egge, J., Heldal, M., Larsen, A., Norland, S., et al. (2018). Simple models combining competition, defence and resource availability have broad implications in pelagic microbial food webs. Ecol. Lett. 21, 1440–1452. doi: 10.1111/ele.13122
Visser, A. W. (2001). Hydromechanical signals in the plankton. Mar. Ecol. Prog. Ser. 222, 1–24. doi: 10.3354/meps222001
Vos, M., Vet, L. E. M., Wäckers, F. L., Middelburg, J. J., Van Der Putten, W. H., Mooij, W. M., et al. (2006). Infochemicals structure marine, terrestrial and freshwater food webs: Implications for ecological informatics. Ecol. Inform. 1, 23–32. doi: 10.1016/j.ecoinf.2005.06.001
Ward, B. A., Dutkiewicz, S., Jahn, O., and Follows, M. J. (2012). A size-structured food-web model for the global ocean. Limnol. Oceanogr. 57, 1877–1891. doi: 10.4319/lo.2012.57.6.1877
Weinbauer, M., Wilhelm, S., Suttle, C., and Garza, D. (1997). Photoreactivation compensates for UV damage and restores infectivity to natural marine virus communities. Appl. Environ. Microbiol. 63, 2200–2205.
Weinbauer, M. G. (2004). Ecology of prokaryotic viruses. FEMS Microbiol. Rev. 28, 127–181. doi: 10.1016/j.femsre.2003.08.001
Weitz, J. (2015). Quantitative Viral Ecology: Dynamics of Viruses and Their Microbial Hosts. (Princeton, NY: Princeton University Press)
Weitz, J. S., and Levin, S. A. (2006). Size and scaling of predator-prey dynamics. Ecol. Lett. 9, 548–557. doi: 10.1111/j.1461-0248.2006.00900.x
Weitz, J. S., Poisot, T., Meyer, J. R., Flores, C. O., Valverde, S., Sullivan, M. B., et al. (2013). Phage-bacteria infection networks. Trends Microbiol. 21, 82–91. doi: 10.1016/j.tim.2012.11.003
Weitz, J. S., and Wilhelm, S. W. (2012). Ocean viruses and their effects on microbial communities and biogeochemical cycles. Biol. Rep. 4:17. doi: 10.3410/B4-17
Wilhelm, S., Weinbauer, M., Suttle, C., and Jeffrey, W. (1998). The role of sunlight in the removal and repair of viruses in the sea. Limnol. Oceanogr. 43, 586–592. doi: 10.4319/lo.1998.43.4.0586
Keywords: virus, microzooplankton, size, encounter, prey capture
Citation: Talmy D, Beckett SJ, Zhang AB, Taniguchi DAA, Weitz JS and Follows MJ (2019) Contrasting Controls on Microzooplankton Grazing and Viral Infection of Microbial Prey. Front. Mar. Sci. 6:182. doi: 10.3389/fmars.2019.00182
Received: 06 January 2019; Accepted: 21 March 2019;
Published: 16 April 2019.
Edited by:
Curtis A. Suttle, University of British Columbia, CanadaReviewed by:
Alexander Godfrey Murray, Marine Scotland, United KingdomMaureen Coleman, University of Chicago, United States
Tron Frede Thingstad, University of Bergen, Norway
Copyright © 2019 Talmy, Beckett, Zhang, Taniguchi, Weitz and Follows. This is an open-access article distributed under the terms of the Creative Commons Attribution License (CC BY). The use, distribution or reproduction in other forums is permitted, provided the original author(s) and the copyright owner(s) are credited and that the original publication in this journal is cited, in accordance with accepted academic practice. No use, distribution or reproduction is permitted which does not comply with these terms.
*Correspondence: David Talmy, dtalmy@utk.edu
Stephen J. Beckett, stephen.beckett@biology.gatech.edu