Evaluating Performance of Photographs for Marine Citizen Science Applications
 Katherine Newcomer
 Brianna M. Tracy
 Andrew L. Chang
 Gregory M. Ruiz
- 1Marine Invasions Laboratory, Smithsonian Environmental Research Center, Edgewater, MD, United States
- 2Marine Invasions Laboratory, Smithsonian Environmental Research Center, Tiburon, CA, United States
Long-term measurements are imperative to detect, understand, and predict changes in coastal biological communities, but can be both costly and difficult to implement. Here, we compare measurement methods used to document community structure and assess changes in marine systems, and explore potential applications in citizen science. The use of photographs for species identifications and monitoring has become a popular and useful data collection tool, but its use requires evaluation of its effectiveness in comparison to data collected from live examinations. We used settlement panels in San Francisco Bay, a well-studied and vital coastal ecosystem, to compare standardized measures of the invertebrate fouling community through examination of live organisms in the field and via photographs. Overall, our study found that live measurements were more accurate and better represented these marine communities, having higher richness, and diversity measurements than photographic measurements. However, photographic analyses accurately captured the relative abundances of some species and functional groups. We suggest that highly recognizable target taxa or broad scale comparisons of functional group composition are easily tracked through photographs and offer the best potential for research conducted by citizen scientists.
Introduction
Due to challenges presented by large-scale research efforts and the growing need to monitor our coastal communities for threats from climate change, pollution, and invasive species (Ruiz et al., 1997; Stachowicz et al., 2002; Thiel et al., 2014), scientists have begun to develop, and identify areas where collaborations with citizen scientists would be most helpful (Dickinson et al., 2010). Citizen science, or the involvement of the general public in collecting and analyzing scientific data, is an increasingly important and useful approach to research that also broadens public engagement in science. Though work of citizen scientists has historically been undervalued among academics (Delaney et al., 2008), recent advances in communication technologies have made engaging citizen scientists much easier, contributing to increased use (Bonney et al., 2014). Some past bias against citizen scientists may be attributed to under-reporting of their efforts in research (Silvertown, 2009), and resulting in a lack of evidence supporting the use of data generated (Cooper et al., 2014). However, citizen science has long been prevalent in the fields of ornithology (Dickinson et al., 2010) and agriculture, among others (Miller-Rushing et al., 2012). As the use of citizen science has risen in the past quarter century (Miller-Rushing et al., 2012), there is growing consensus that new citizen science projects should carefully design questions and perform detailed analyses of data accuracy (Darwall and Dulvy, 1996; Boudreau and Yan, 2004; Delaney et al., 2008; Fore et al., 2008; Silvertown, 2009; Dickinson et al., 2010).
In order to create a lasting engagement with citizen scientists, it is necessary to use a method that is both easily repeatable and quickly executed, such as the use of photographs to survey biological communities. Photographs of organisms have been successfully used as a reliable tool to track individuals over time (Frisch and Hobbs, 2007; Carpentier et al., 2016). Some photographic identification methods have become so advanced that computer-aided recognition methods allow for automated comparisons (e.g., Melancon et al., 2011) or have inspired web and smartphone applications to assist citizen scientists in identifying organisms in real-time (e.g., Kumar et al., 2012; iNaturalist, 2016). Not only could photographic comparisons give scientists the ability to identify species or trends without the time constraints inherent to examination of live organisms in situ, but such approaches would allow anyone with a camera and enough interest to participate and contribute.
Monitoring for non-native species in particular has been identified as a good venue for citizen scientists to make substantial contributions (Lodge et al., 2006; Cooper et al., 2014). Invasive species are a leading threat to ecosystems across the globe (Stachowicz et al., 1999; Bax et al., 2001); however, knowledge of the extent and effects of invasions in marine and coastal realms is still deficient (Ruiz et al., 1999, 2011, 2015). Monitoring programs for biological invasions often have one of two priorities: to be precise enough to detect arrivals of new species, which often initially appear in small numbers, or to be broad enough to show changes over time, while remaining straightforward in application and financial feasibility (Bax et al., 2001, 2003; Mangin, 2001; Mantelatto et al., 2013; United States Fish and Wildlife Service [USFWS], 2015).
The largest and most diverse component of marine introduced species is comprised of invertebrates (Ruiz et al., 2000), which, through local elimination of native species, are one of the significant threats to marine ecosystems (Ruiz et al., 1997, 2000; Stachowicz et al., 1999, 2002; Grosholz et al., 2000; Carlton, 2001; Blum et al., 2007). Citizen scientists have contributed to a broad range of published and unpublished aquatic invasive species research (Boudreau and Yan, 2004; Delaney et al., 2008; Crall et al., 2010; Azzurro et al., 2013; Zenetos et al., 2013; Scyphers et al., 2014; Maistrello et al., 2016), and photographic methods have proven successful for many larger taxa in both terrestrial and aquatic habitats (e.g., Darwall and Dulvy, 1996; Bray and Schramm, 2001; Fore et al., 2008). However, many studies of marine invertebrate communities have relied on photographic analyses without assessing the accuracy of this method compared to live examination or traditional measures. Notably, citizen science surveys of smaller marine invertebrate communities are rare, though studies on groups like Porifera and Tunicata do exist (Thiel et al., 2014). Many scientists have expressed skepticism of taxonomic identifications via photographs without examination of physical specimens (e.g., Ceríaco et al., 2016). Due to this uncertainty, further research on such performance and possible constraints is useful before launching a marine invertebrate-focused citizen science effort, to align objectives and results.
In this study, we assessed the use of photographs to accurately characterize marine invertebrate communities in order to design a citizen science program with the purpose of (1) detecting non-native species (i.e., new arrivals) and (2) documenting whole community response to change (species introduction, environmental disturbance, etc.). We tested the accuracy of photographs in comparison to live, field-based analyses and evaluated different research questions to determine which are best answered by volunteers without specific taxonomic expertise. We analyzed 5 years of data from live examinations of marine invertebrate fouling communities on settlement panels from San Francisco Bay and compared their performance to data gathered from photographs of the same panels for multiple common ecological measurements: species richness and diversity, functional group richness and diversity, relative abundance, and detection rates of known non-native species. Species and functional group diversity and richness were evaluated for both live and photographic methods, and the latter method was expected to be less comprehensive than live analyses, as well as skewed toward over-representation of large, conspicuous species. We expected functional group composition to be similar between methods but lower detection of target taxa for photographic vs. live analysis methods.
Materials and Methods
Study Area and Field Methods
Most marine invertebrate invasions occur in hard substrate habitats (Ruiz et al., 1999, 2011, 2015), and a common method for assessing the status of marine invasions is to use settlement panels that serve as standardized, passive sampling devices (e.g., Wisely, 1959; Sutherland and Karlson, 1977; Dean and Hurd, 1980; Osman and Whitlatch, 1995; Stachowicz et al., 1999). Settlement panels (hereafter “panels”) have been widely adopted in fouling community and biological invasion surveys (Sutherland, 1974; Bax et al., 2003; Blum et al., 2007; Tracy and Reyns, 2014; Marraffini and Geller, 2015; Newcomer et al., 2018) and are ideally suited for photographic analyses, as they offer a relatively small, standardized, and flat area that is easily photographed. Panels are also ideal for use by citizen scientists, since their deployment is both simple and repeatable with minimal prior experience.
We deployed replicate panels (n = 10) at ten sites (Supplementary Material) per year throughout San Francisco Bay, CA, United States (37°42′30″N, 122°16′49″W) over a 5-year timespan. Panels were cut from gray 0.5 cm thick polyvinyl chloride (PVC) sheets to 14 cm × 14 cm squares, lightly sanded, attached to bricks, and suspended horizontally (“face-down”) one-meter below floating docks during the season of high larval recruitment and biomass accumulation (June to September) each year from 2012 through 2016. Of the 100 panels deployed each year, we randomly chose 40 panels per year (n = 200, across all years), without regard to site, for comparison.
After 3 months in the water, panels were removed and photographed with a Canon® EOS Rebel T5 camera. Three measurement methods were compared on each of the 200 panels: live point counts, photo-based point counts, and an exhaustive live search. Species lists were therefore compiled from the three methods, which were conducted as follows.
Live in-Field Settlement Panel Point Count
Once photographed, each panel was examined live with a point count grid under a dissecting microscope. Individual organisms attached to the panel directly underneath grid intersections were morphologically identified to lowest taxonomic level, for a total 50 recorded points. Any sessile species under the point was recorded. Points with more than one organism settled atop of each other were recorded as two or more points, giving some panels >50 points.
Settlement Panel Photographic Analysis
To mimic the live point count protocol, photographs were cropped to contain just the panel and scaled so that all images were of equal dimensions and resolution. A “digital point count grid” consisting of uniform intersections that mirrored the physical point count grid was then overlaid on the panel photograph using image-processing program ImageJ 1.8.0 (Abràmoff et al., 2004). We identified organisms directly underneath grid intersections to lowest taxonomic level possible (i.e., species, genus, and family, etc.). When evident that one organism was settled atop of another under the point, both species were recorded as points, giving some panels >50 points.
Total Species List Verification
For each live panel, a researcher from our team of trained scientists (invertebrate parataxonomists) conducted an exhaustive search of the entire panel and identified and vouchered all discernable taxa. This search was verified by a second investigator. Vouchered samples were later re-verified by taxonomic experts. So-called “total observed” species lists were then compiled from these expert identifications and reflect the best possible identification for every sessile species identified on each panel, including species that were not observed during point counts.
Evaluating Potential Citizen Science Research Questions
Previous studies have noted that citizen science efforts to identify species might be better directed into functional groups based on multiple, easily recognized characteristics (Lodge et al., 2006; Thiel et al., 2014). Therefore, species were also classified into coarse functional groups (Supplementary Material). Functional groupings allowed researchers to compare within and between groups and calculate a conservative estimate for richness and diversity scores. Additionally, classifying identifications by functional group allowed researchers to compare the usefulness of group-level to species-specific scoring, as identifications generated by future citizen science projects are likely to be of lower resolution (less specific) than those collected by expert taxonomists.
We identified four non-native target taxa, or species of interest to scientists and policy-makers that are known to occur in San Francisco Bay and are spreading to other global regions. Previous studies completed by citizen scientists have used such targeted species search lists successfully (Darwall and Dulvy, 1996; Boudreau and Yan, 2004; Delaney et al., 2008). We chose target taxa that span four major functional groups and represent known species of interest: “Encrusting Bryozoa,” Watersipora subatra (Ortman, 1890); “Soft Bryozoa,” Amathia verticillata (delle Chiaje, 1822); “Solitary Tunicata,” Ciona spp. Fleming, 1822; and “Colonial Tunicata,” Botryllinae.
Data and Model Analysis
We compared common ecological measurements, including richness, diversity, abundance, and detection rate, which are often used in community surveys and citizen science-led research (Canning-Clode et al., 2008; Cooper et al., 2014; Thiel et al., 2014).
Statistical analyses were performed in the R statistical computing environment (R Core Team, 2015) with the lme4 package (Bates et al., 2014), MuMIn package (Bartoń, 2015), lsmeans package (Lenth, 2016), boot package (Davison and Hinkley, 1997; Canty and Ripley, 2017), and stats package (R Core Team, 2015). We performed analyses with the methods outlined below on identifications made to functional group-level, as well as the lowest possible level (usually species level). Shannon-Wiener diversity indices (Shannon and Weaver, 1948) and taxonomic richness were evaluated for each panel at both group level as well as the lowest possible level.
We evaluated species and group-level diversity indices for each panel as a function of the fixed effect measurement method and used linear mixed models in a normal distribution. We evaluated species richness and functional group richness with a generalized linear mixed model (GLMM) using a Poisson error distribution. Panel was included as a random factor in richness and diversity models to account for the “repeated” measurement, as richness and diversity scores of the same panel would predictably be more related than different panels. Panel was nested within Year, another random effect in the model. Diversity scores were calculated from photograph and live point count data, but cannot be obtained from total observed species lists, as species list data does not supply the relative abundance of species, which is needed to calculate the Shannon-Wiener diversity index. Therefore, while richness measurements are compared in the models between photographic, live, and total observed scores, diversity models only compare the two point count methods. We used the lsmeans package to conduct a three-way pairwise analysis on richness measurement types. Abundance was analyzed by functional group in a GLMM with a Poisson distribution, with each group’s field abundance evaluated against the fixed effect of photo abundance. Site and year were included as random factors. For all models, we calculated pseudo marginal and conditional r2 values with an adapted r-squared formula for GLMMs in R package MuMIn. Residuals were plotted to verify model fit. Models were compared by their Akaike information criterion (AIC) value (Sakamoto et al., 1986).
Tukey’s mean difference analyses, or Bland-Altman agreement analyses, were also used to assess the agreement and the strength of the relationship between our two point count methods (Bland and Altman, 1999, 2003; Giavarina, 2015). In the case of non-normally distributed differences, confidence intervals (95%) and the limits of agreement (1.97 × SD) were bootstrapped (DiCiccio and Efron, 1996). In order for the photo-based method to have been considered comparable to the live method, 90% of the sample needed to fall within the limit of agreement (LOA).
For each year, live, and photograph-based point count methods were compared using species accumulation curves. Estimated richness was calculated using the second-order jack-knife variant (Canning-Clode et al., 2008). Species accumulation curves were compared graphically in R statistical computing environment (R Core Team, 2015) using the vegan package (Oksanen et al., 2007).
Results
Species Richness and Diversity
Photo-based analyses produced lower richness counts than field-based analyses (Figure 1 and Table 1), and measurement type was responsible for 55% of differences in richness scores, according to best fit models (2919 AIC, -0.38 estimate, p < 0.01; Supplementary Material). Species richness was highest in total observed measurements, while live point count measurements detected 78% of distinct species across all years, and photos found 41%, significantly less in each case according to best fit models (Supplementary Material). Nearly two-thirds of richness measurements from photos counted only 40% of total species or fewer (Figure 2). When directly compared, photo-based richness scores were representative of live point count richness scores, though significantly different with an average of 2.5 species not counted in photos (94.5% within LOA; Supplementary Material). The performance of both point count methods declined as total richness increased (Figure 2).
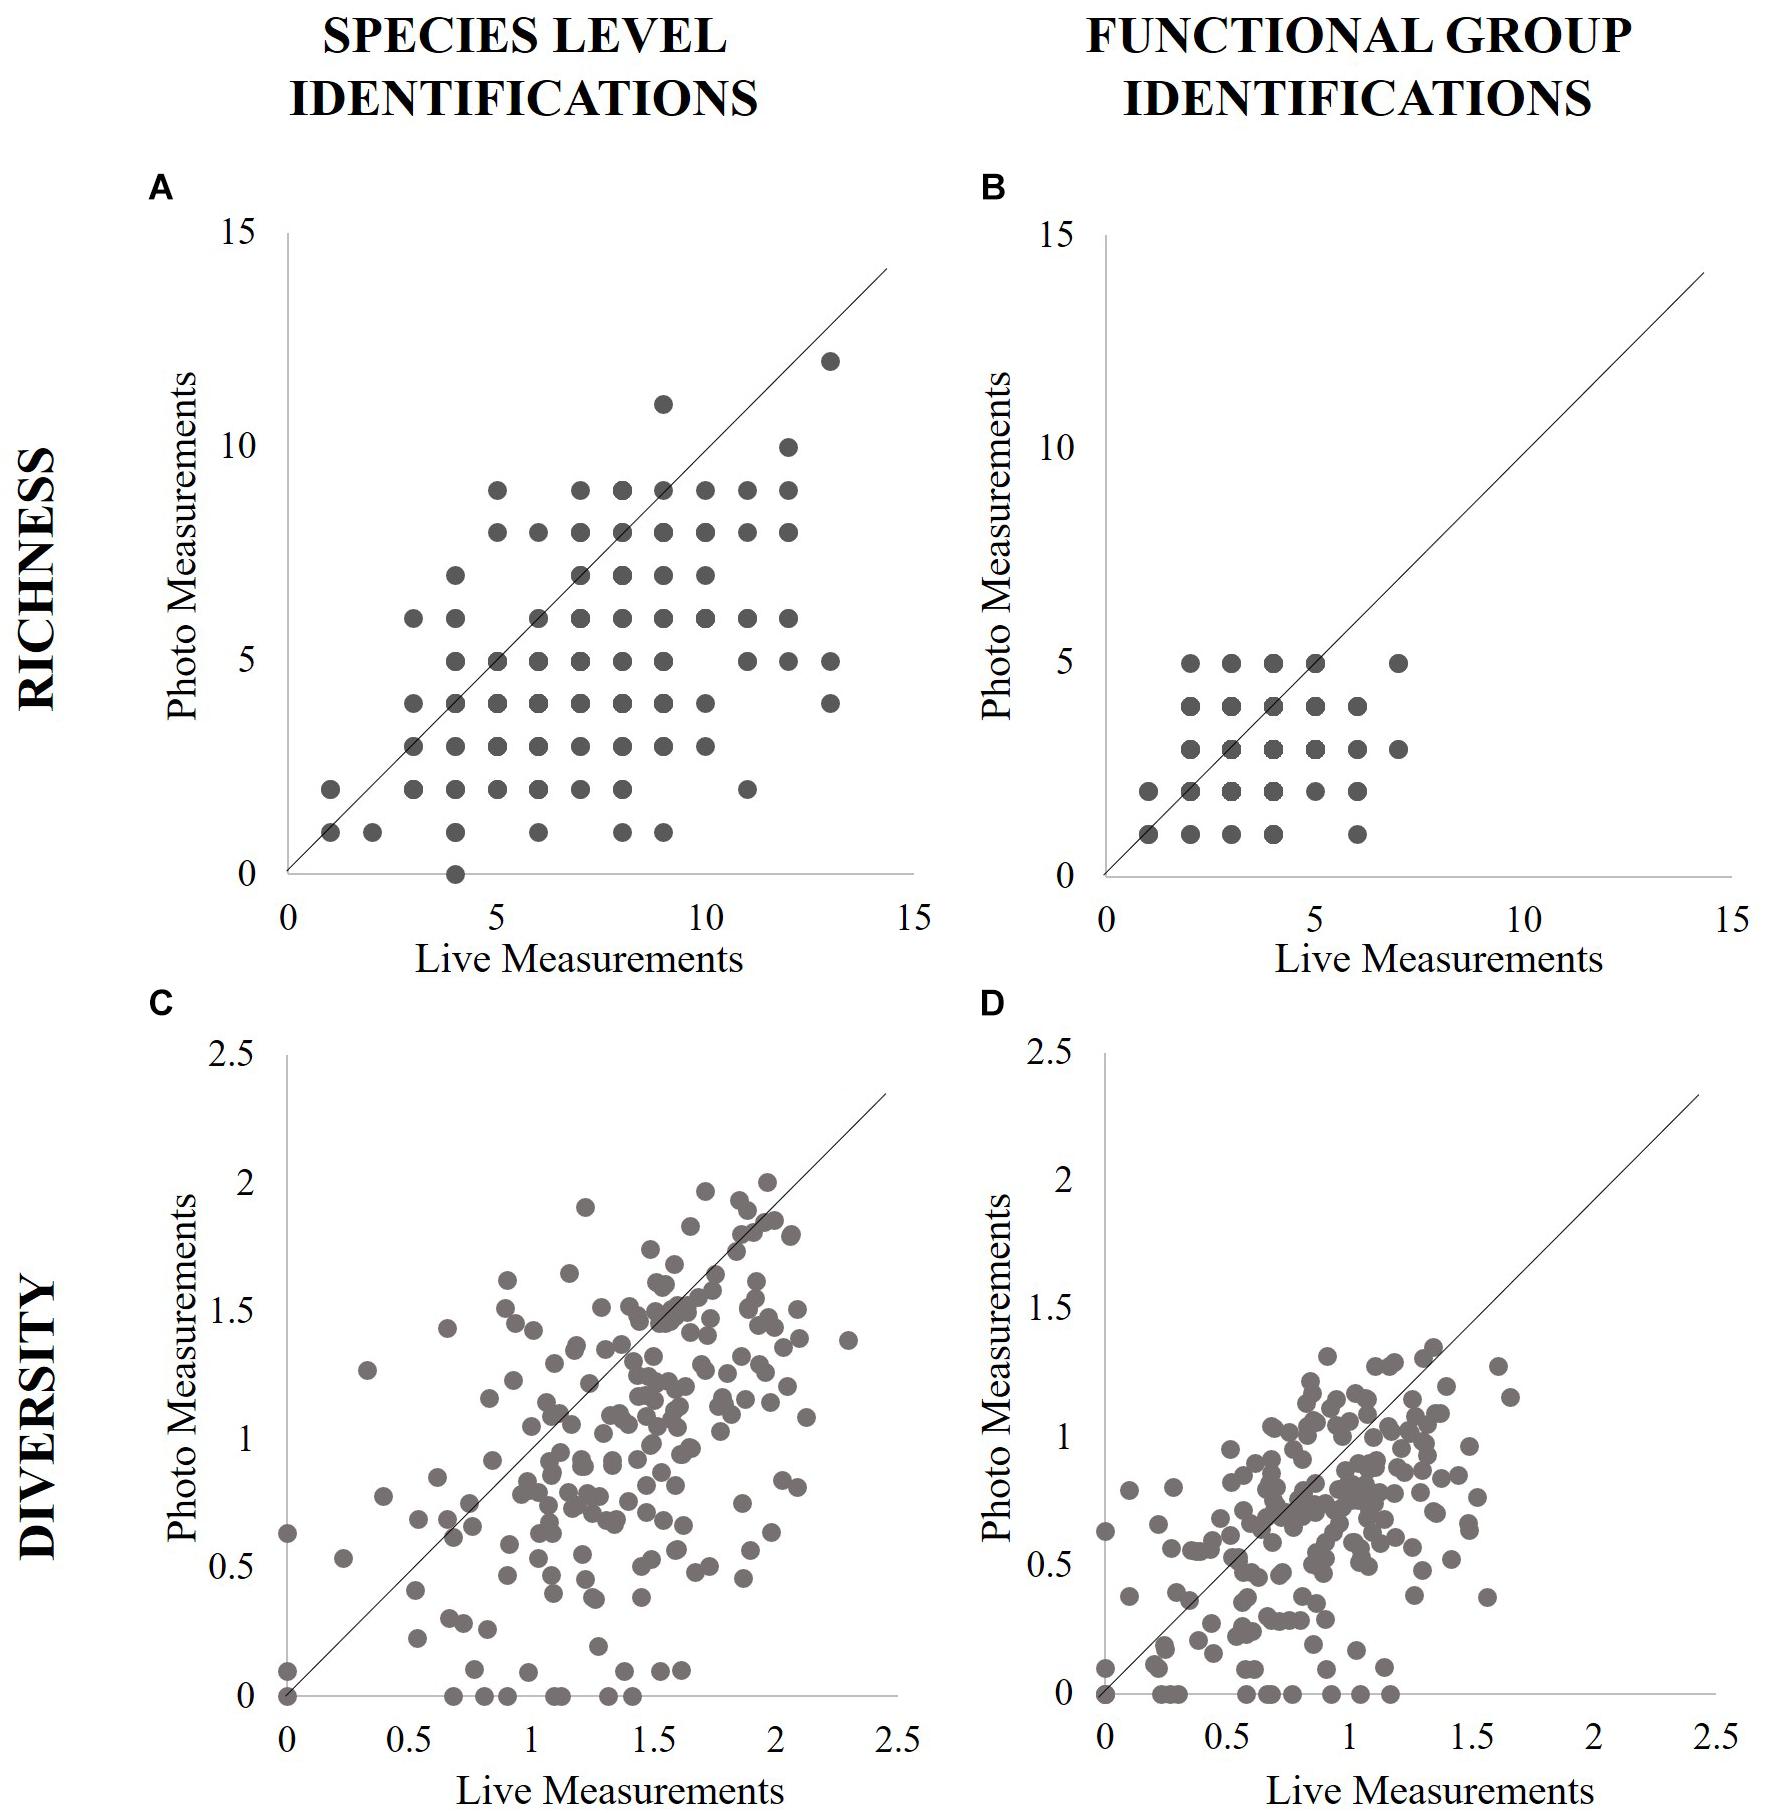
Figure 1. Comparison of the spread of richness scores found by species identification (A) and functional group identification (B) and diversity scores found by species (C) and functional group (D) from all panels for both point count methods.
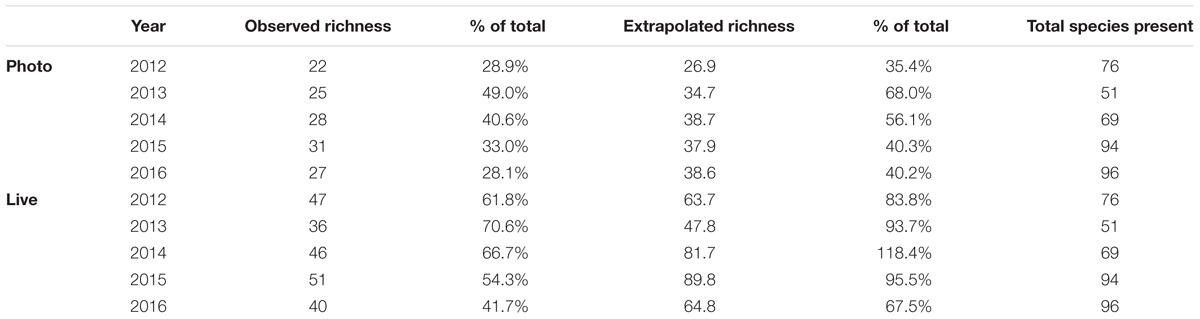
Table 1. Richness scores calculated per year for the two measured point count methods, along with the extrapolated richness scores for the point count methods, the respective percentage of the total observed species those measurements reflect, and the measured total species present.
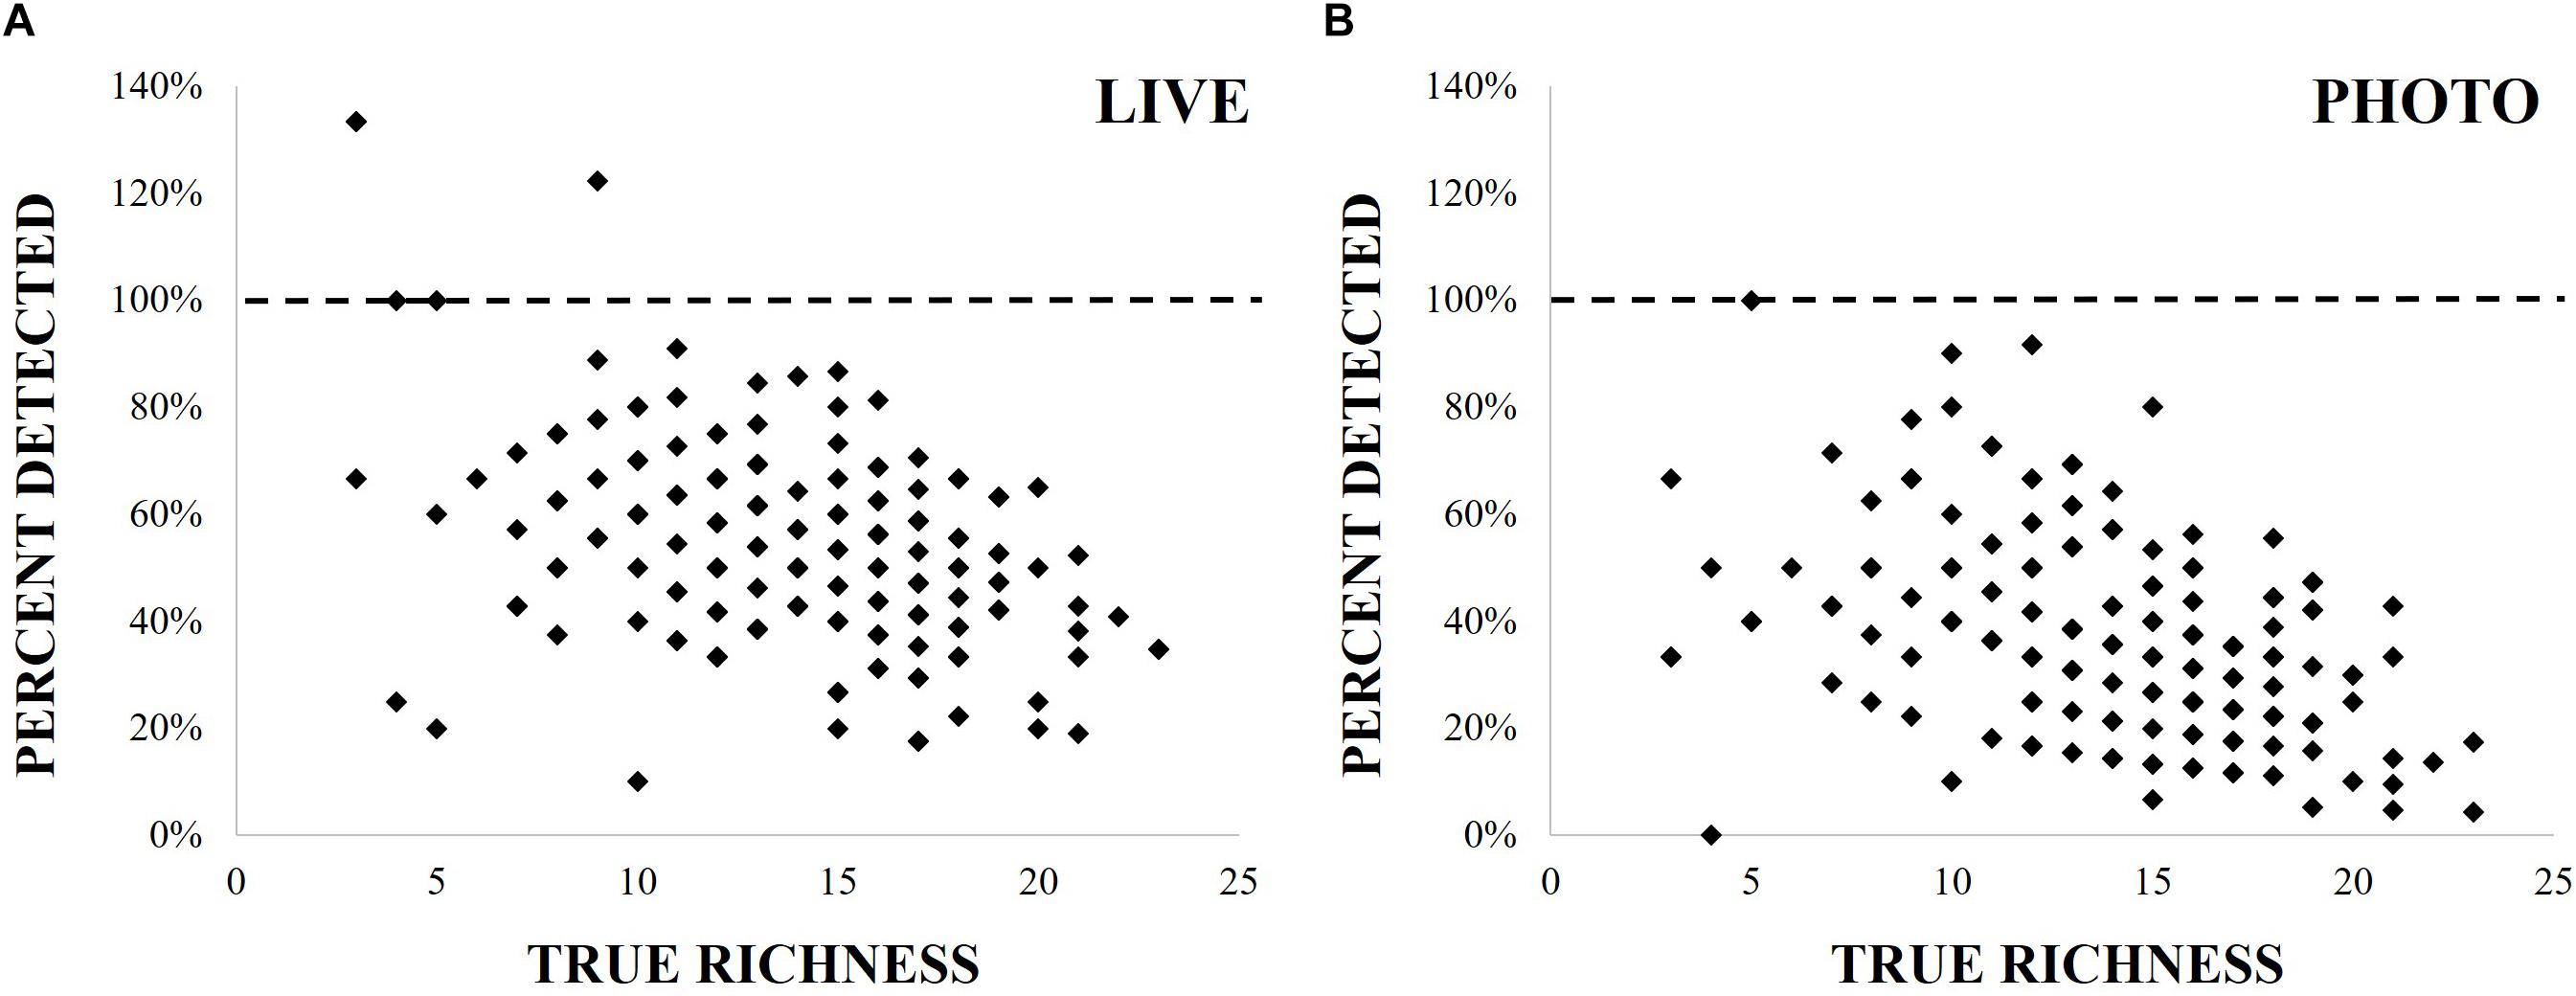
Figure 2. Comparison of richness scores from live (A) and photo (B) point count methods, represented as the percent of true richness found by either method, plotted against true richness.
Increased sampling effort (i.e., more panels) would likely not increase richness found via photographs to levels observed in live point counts (Figure 3). Live point count analyses can be used to accurately estimate total observed richness using extrapolation, as extrapolated richness from the live point counts were not statistically different from in situ richness, however, photo-based point count analyses cannot approximate true richness, as the extrapolated scores remained statistically different (Table 1; mean 29.8 ± CI 13.8, mean -4.4 ± CI 10.9).
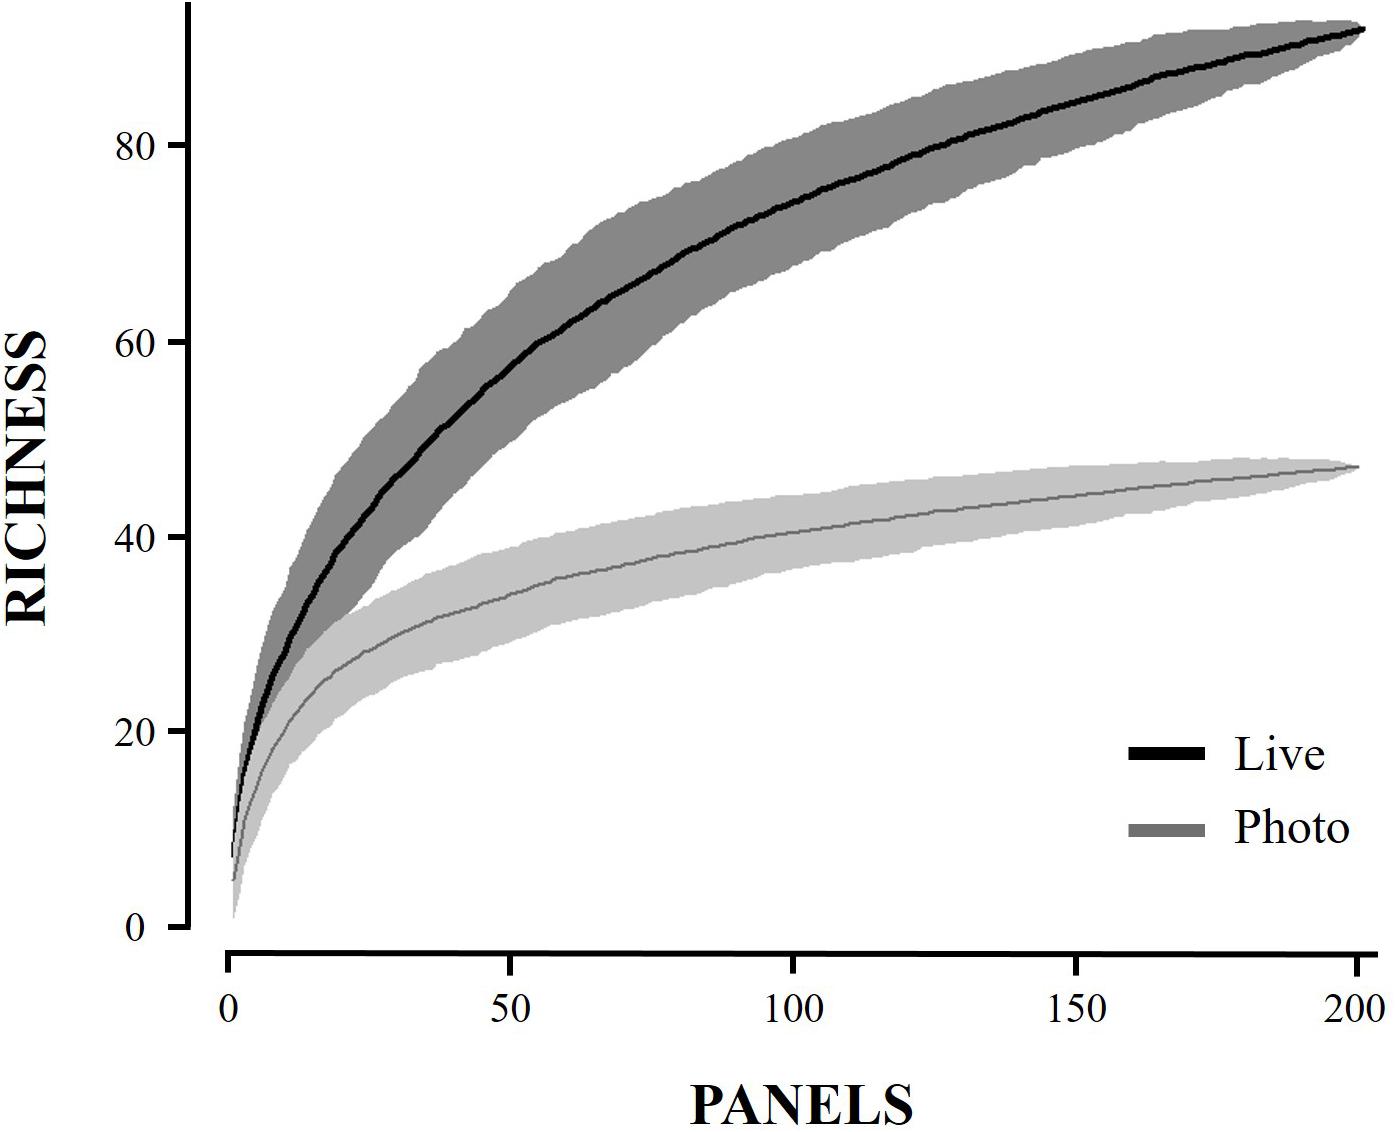
Figure 3. Species accumulation curve for the two point count methods.
Across all years analyzed, 31 species were observed in the field that were not identified in photographs (Supplementary Material). “Kamptozoa” were completely absent from photographic point counts. Furthermore, functional groups “Anthozoa,” “Cirripedia,” and “Hydrozoa,” as well as families Sabellidae, Serpulidae, Spirorbidae, and Terebellidae, could not be identified to lower taxonomic resolution via photographs, thus missing at least 20 distinct species that were identified from live point counts and total observed methods.
Diversity measurements from photographs were on average 0.36 times lower than live measurements (Figure 1 and Supplementary Material). Measurement type explained 13% of the difference in diversity scoring, according to best fit models (474 AIC, p < 0.01; Supplementary Material). The two point count based diversity scores were found to be statistically different, with only 75% of scores within the LOA, thus failing to meet the standard to consider photo-based diversity scoring as representative of live scores (Supplementary Material).
Functional Group Richness and Diversity
Photo-based measurements of functional group richness were significantly lower than live point count and total observed richness scores, and measurement type explained 33% of this difference between scores, according to best fit models (2214 AIC, p < 0.01; Supplementary Material). When directly compared, photo point count functional group richness scores were significantly different than live point count scores, but fell within the LOA (97%; Supplementary Material). Photographic functional group richness scores were 0.24 times lower on average than those taken in the field (Figure 1 and Supplementary Material).
Of the highly specious functional groups, identifications within “Branching Bryozoa,” “Encrusting Bryozoa,” and “Solitary Tunicata” noted similar numbers of unique species from both photo and live analyses. For these four groups, >90% of measurements fall within the LOA for the number of species within a functional group (Supplementary Material).
Functional group identification lists were similar for all years with the exception of “Soft Bryozoa,” “Anthozoa,” and “Hydrozoa,” which appeared in some years but were absent in others, and “Kamptozoa,” which never appeared in photos. Functional groups were sampled less frequently from photographs when compared to live point counts, except for “Branching Bryozoa” and “Soft Bryozoa,” which are oversampled in photographs due to their dominant presence (e.g., greater relative height and broad canopy). The abundances of functional groups, as well as associated presence detection rate, are comparable between live and photographic methods, with notable similarities in the most abundant categories in all years. “Branching Bryozoa,” “Soft Bryozoa,” “Solitary Tunicata,” “Colonial Tunicata,” and “Cnidaria” were all accurately captured from photos based on their limits of agreement (Supplementary Material). “Branching Bryozoa” and “Soft Bryozoa” abundances were not statistically different between point count methods (Supplementary Material). The two methods could not be evaluated for the remaining groups (“Bivalvia,” “Encrusting Bryozoa,” “Cirripedia,” “Hydrozoa,” “Polychaeta,” and “Porifera”), as the abundances of those groups did not meet assumptions of the mean difference tests, likely due to sparse abundance.
“Solitary Tunicata” (estimate = 0.03, r2 = 0.22, p < 0.01), “Colonial Tunicata” (0.04, r2 = 0.20, p < 0.01), and “Branching Bryozoa” (0.05, r2 = 0.19, p < 0.01) abundances were most correlated between methods, according to best fit models (Figure 4 and Supplementary Material). “Cnidaria” models for abundance did not improve upon the null. All other functional group abundances were not correlated (r2 < 0.10; Supplementary Material).
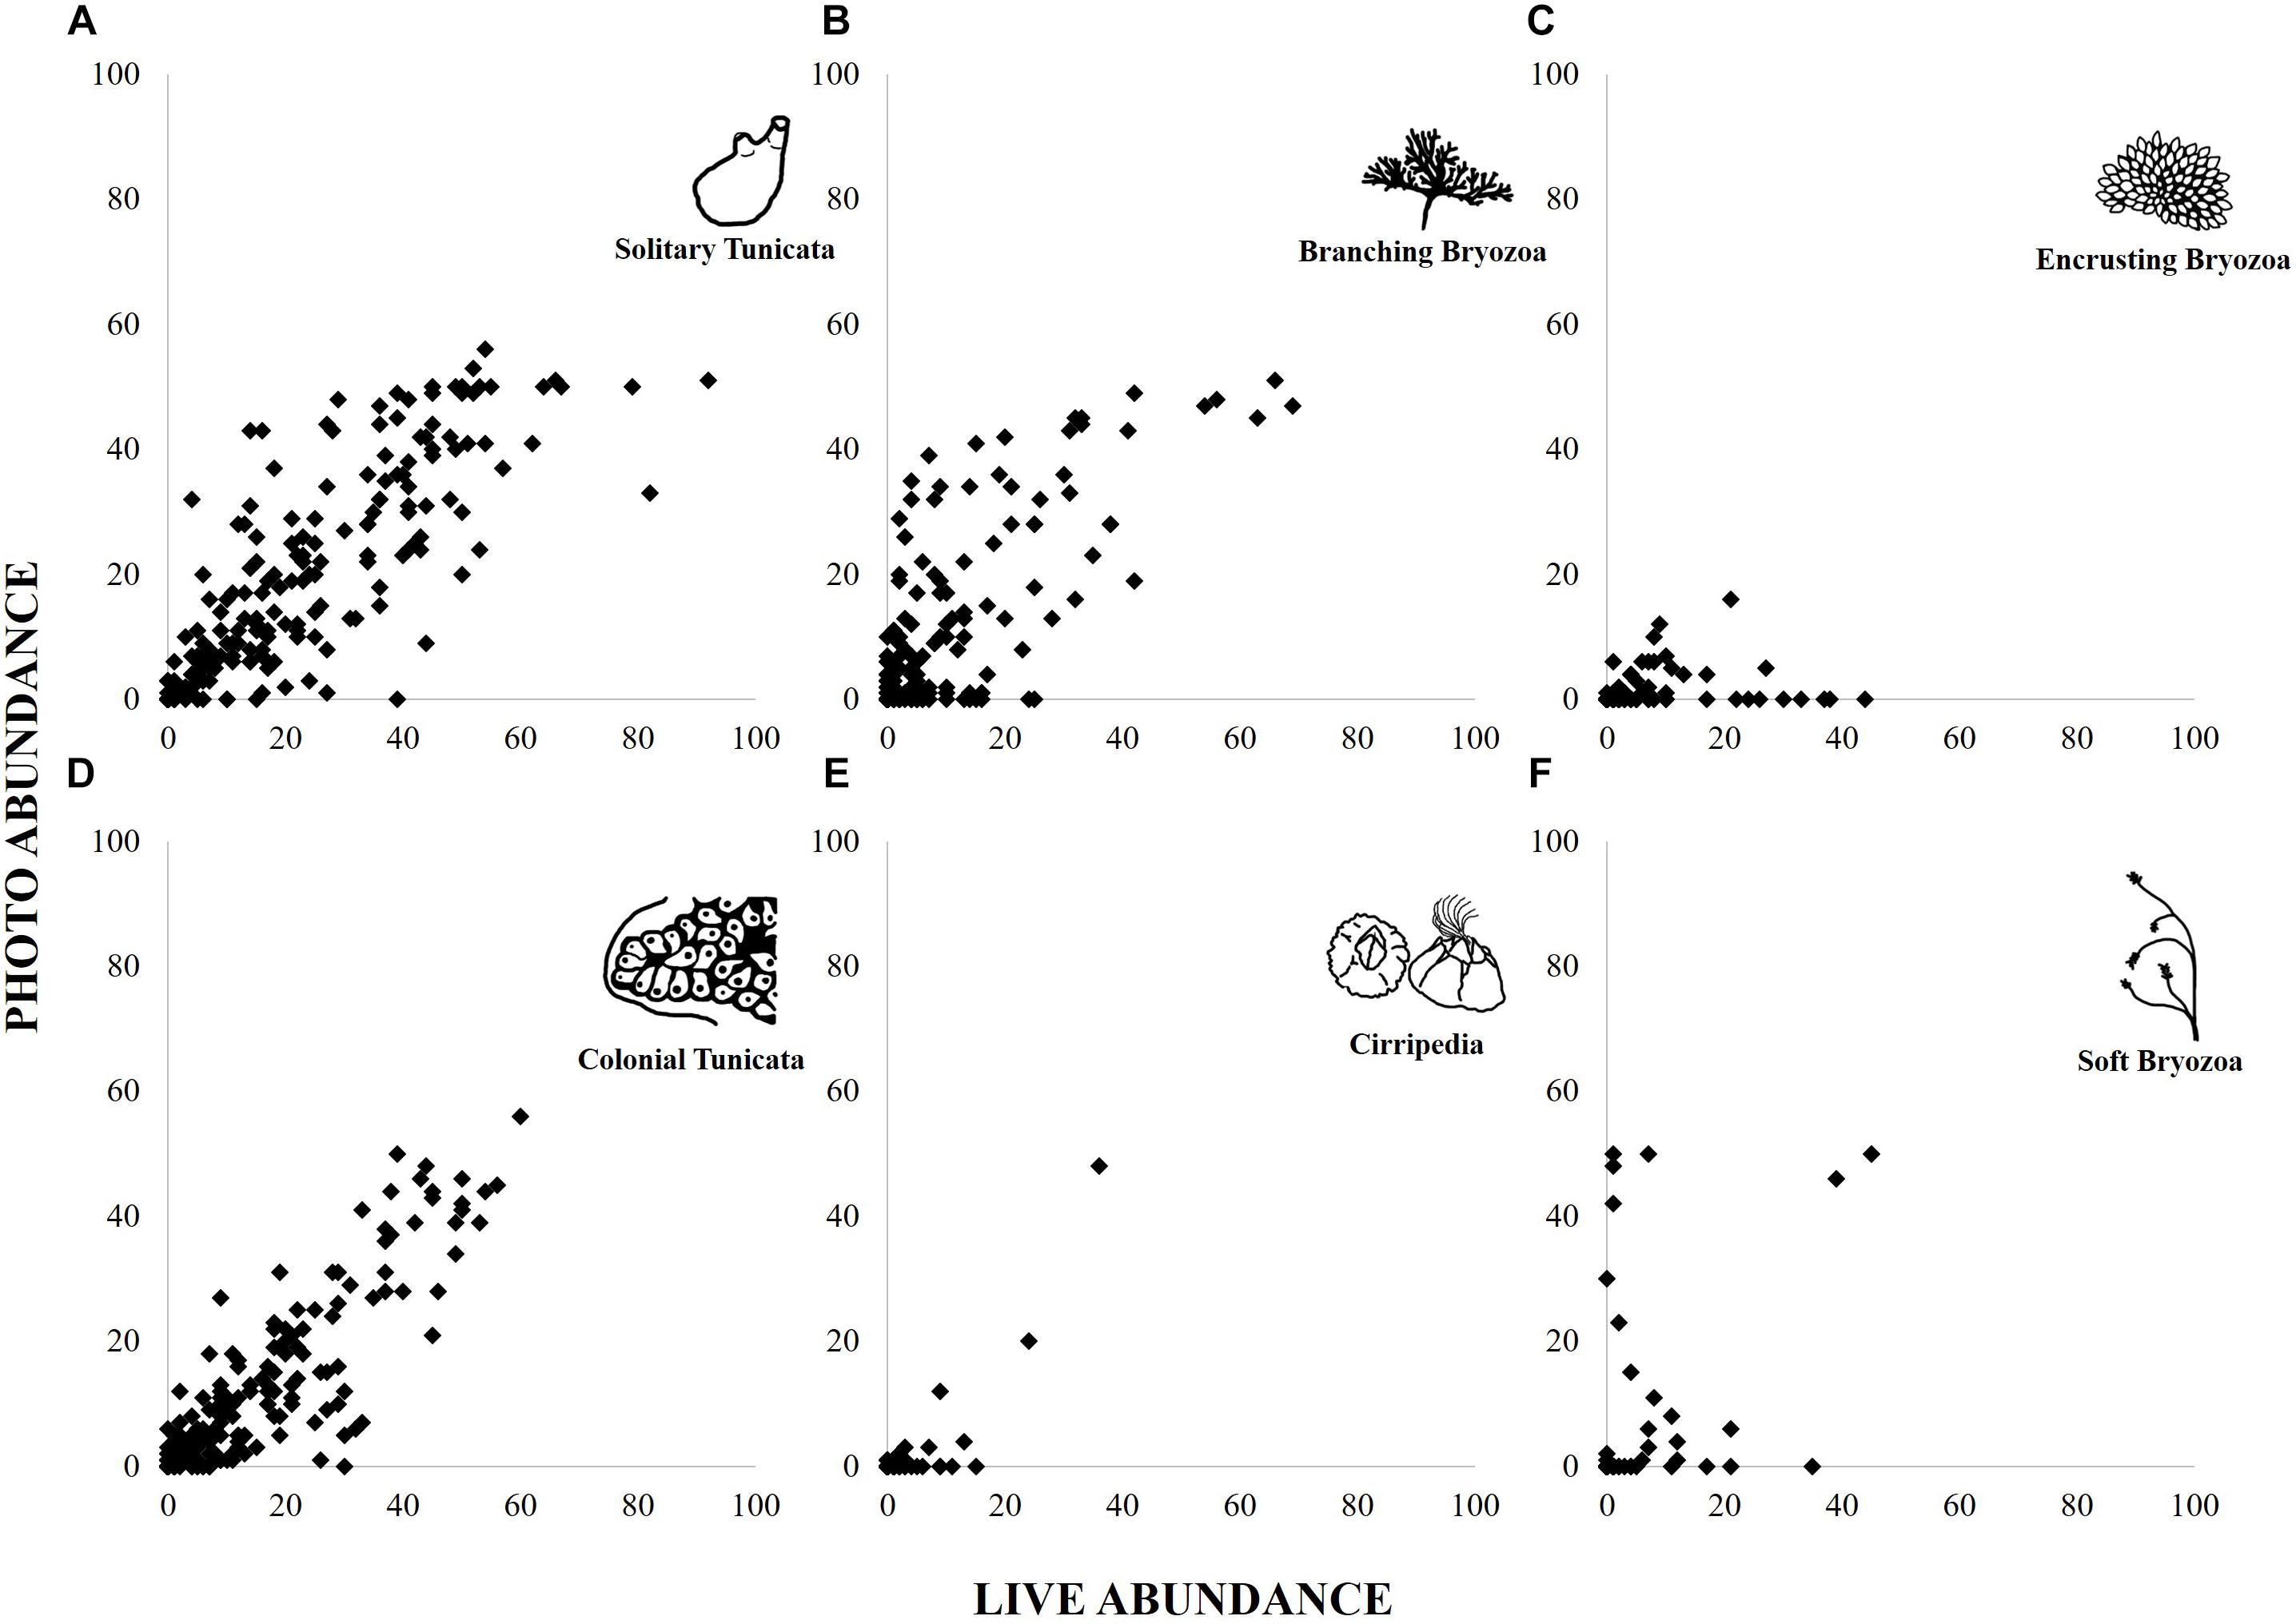
Figure 4. Abundance scores per panel found from live and photographed point counts for six functional groups: Solitary Tunicate (A), Branching Bryozoa (B), Encrusting Bryozoa (C), Colonial Tunicata (D), Cirripedia (E), and Soft Bryozoa (F).
Photo-based measurements of functional group diversity were 0.18 times lower on average than those gathered from live point counts (Figure 1 and Supplementary Material). Measurement type explained 6% of this difference in diversity score, according to best fit models (240 AIC, p < 0.01; Supplementary Material). Methods were found to be statistically different, though 94.5% of scores were within the limits of agreement (Supplementary Material).
Target Taxa
For every year of this study they appeared, all target taxa were found using all three methods. However, detection rates of Ciona spp. and A. verticillata were similar between point count methods, while photos captured significantly less W. subatra, and Botryllinae than live measures (Figure 5). The detection rate of Ciona spp. by either point count method most closely approximated its true frequency compared to any of the other target taxa in San Francisco (Figure 5).
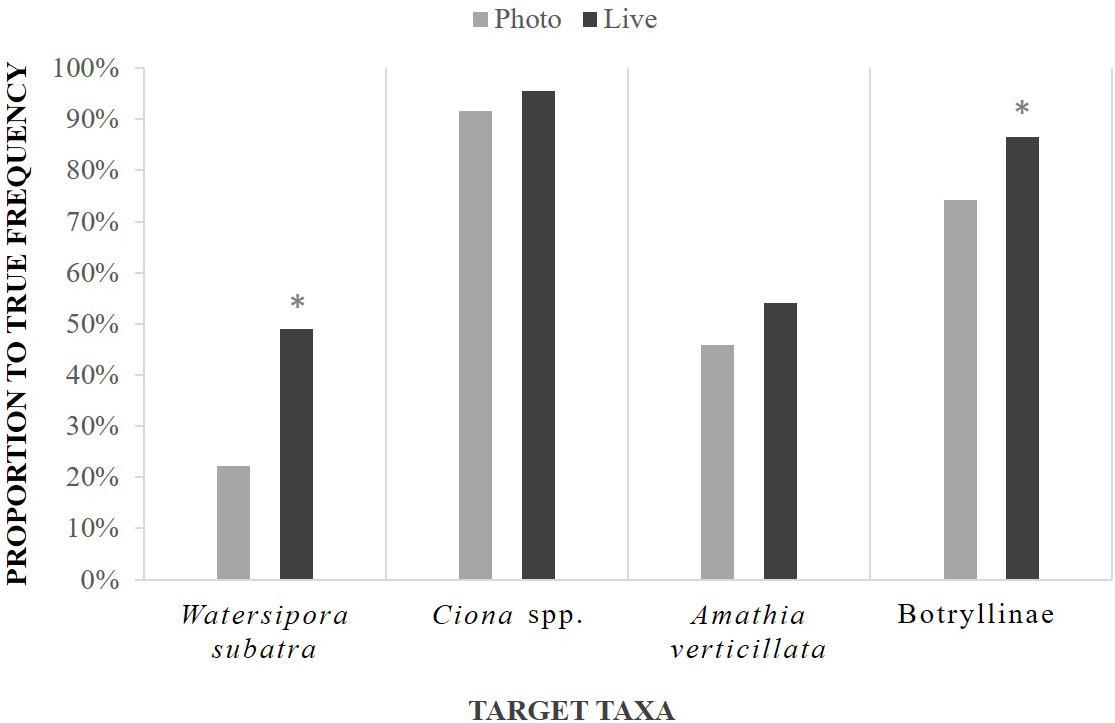
Figure 5. Target taxa detection rate, shown as frequency found per point count method compared to true frequency, with asterisks that denote statistical differences between method for each target taxa.
Non-native bryozoan W. subatra was found on an average of 47% of panels per year, according to the total observed species lists. Live point counts identified the bryozoan in 56% of these occurrences (SE 9%) and photo-based point counts 25% of the occurrences (SE 4%). Non-native tunicates Ciona spp. were found on an average of 77% of panels per year. Live point counts also identified the tunicates 96% of the time (SE 2%) and photo-based point counts 92% of the time (SE 5%). Botryllinae, a Tunicata subfamily and common known non-native species, were found on an average of 90% of panels per year. Live point counts also identified the tunicates 87% of the time (SE 3%) and photo-based point counts 74% of the time (SE 5%). The non-native bryozoan A. verticillata was found on an average of 30% of panels per year for the three years it appeared in San Francisco. Live point counts also identified the bryozoan 56% of the time (SE 9%) and photo-based point counts 43% of the time (SE 6%).
Discussion
Richness and Diversity
Our results indicate that richness and diversity scores recorded from photographs are not fully representative of the richness and diversity recorded by experts using microscopic examination of live samples. There was not a simple reduction in overall diversity that would allow researchers to use photographic analyses to consistently and accurately estimate the live diversity measured by microscopic examination. Although species richness was related between photo and live point count scores, photos were not representative of the in situ total measurements. The relationship of diversity and richness scores between live and photo analyses might be influenced by the functional groups that make up a sample. Some groups were systematically underrepresented in photographic point counts compared to live analyses, particularly those organisms that have inconspicuous or small mature individuals, like kamptozoans, while abundances of larger, easily discernable groups, like arborescent bryozoans and colonial and solitary tunicates, were well approximated.
Species Composition
Species lists amassed from photographic methods are likely to omit significant numbers of taxa. In our analysis, photograph-based point counts accurately captured just 41% of distinct species found from our total species analysis method. Critically, species accumulation curves constructed from photographic data did not predict more species discovery with continued effort. Live point counts were more representative of total richness, at 78% of total distinct species identified, but often overlooked rare organisms. An increase in effort for live point counts (more panels) might increase the number of species found closer to the total observed, though our analyses found that extrapolated richness estimates from live point counts already produced comparable estimates to the total observed richness. Some variation in the number of distinct species could be attributed to the individual bias of the observer. However, these results suggest that live point counts can be a useful tool for rapid surveys.
Photographic methods performed best with easily recognizable species, including many of interest to scientists and managers (e.g., colonial tunicates of the family Didemnidae; Valentine et al., 2009; McCann et al., 2013; Ojaveer et al., 2015). Target taxa examined in this study showed that presence/absence trends follow the same pattern between photos and live analyses, and every species was found in photographs, though each species was detected less frequently from photos than from live analyses. Taxa having the closest correlation between live and photograph abundances and detection rates were usually larger-bodied species, particularly tunicates and arborescent bryozoans. This high correlation could be due to their size, but could also be partially attributed to their ability to “stand out” from fouling community counterparts (e.g., distinct coloration and shape), making them easier to recognize, and capture in data from a photograph. For these reasons, we expect that detection of target taxa is generally most reliable among highly recognizable groups (“Solitary Tunicata,” “Colonial Tunicata,” and “Branching Bryozoa”).
Studies utilizing target taxa span a wide breadth of ecological purposes – from conserving endangered species (Greenemeier, 2017) to monitoring water quality (Carroll et al., 2009; Zuykov et al., 2013). Many sessile marine invertebrates preferentially inhabit very specific environmental conditions (Chiarelli and Roccheri, 2014; RAC/SPA - UNEP/MAP, 2015). If specific invertebrate species are identified as target taxa in a region, their use as bioindicators could help both scientists and managers to understand changes, or impending changes, in environmental conditions and ecosystem health (Ward and Larivière, 2004). Our results suggest selection of target taxa from highly conspicuous and recognizable function groups will serve to provide the most reliable data and enable engagement of citizen scientists.
More broadly, we recognize many areas where photographs are useful in ecological research by scientists with taxonomic training. Other studies have used photographs to study the succession and growth rate of species onto bare space, usually by monitoring individual colonies over time (e.g., Tracy and Reyns, 2014). Since these studies do not rely on photography for taxonomic identification (colonies are identified to species level using live microscopic examination at some point during the study), they are an example of the successful use of photographs for species-specific analyses. Other studies have successfully used multiple images stitched together to enhance resolution (e.g., Lindeyer and Gittenberger, 2011; Newcomer et al., 2018). Our study found that some organisms within well-photographed functional groups (e.g., “Branching Bryozoa” and “Solitary Tunicata”) can be reliably separated into species from photographs. Moreover, it is also important to note that we focused on an area where fouling communities have high three-dimensional growth, and locations with less upright growth may have different results. We expect that photograph-based studies could create more accurate species lists if the communities were younger (organisms are smaller, e.g., Valentine et al., 2009) or morphologically smaller (like in high latitudes) with very little physical overlap occurring between species, though smaller individuals would require high-resolution photographs, and would still lack microscopic examination of key species traits.
Large Scale Trends and Relative Abundance
Large abundance trends in functional groups were reliably captured by the photograph method. The best example of this in our data is the observed increase in abundance of “Solitary Tunicata,” specifically Ciona spp., in 2013 and an increase in “Soft Bryozoa,” specifically A. verticillata, in 2015 in San Francisco Bay. Both changes appear to represent an organismal response to a significant increase in salinity during a major drought (2013–2015; Swain, 2015). In this case, abundances for these species drastically affected the relative abundances of their functional groups in the respective years, allowing researchers to explore the change in community composition, identify the species responsible, and infer that the salinity shift was a potential cause (e.g., Chang et al., 2017). Future studies could profitably compare the classification of communities identified using photographic methods to those identified using live analyses. Such compositional analyses rely heavily on abundance information, which is one of the more reliable metrics that can be derived from photographs.
Applications for Citizen Scientists
Many citizen projects have adopted a high replicate model, finding that increased effort will compensate for less precise, and less accurate identifications, eventually leading to comparable results (Kosmala et al., 2016; Swanson et al., 2016). However, our results indicate that in the case of marine invertebrates, photographs will continue to miss many rare and small species, even with increased effort (Figure 3). Additionally, professional scientists (parataxonomists) were used in this study to calculate richness from photographs, which suggests that non-expert citizen scientists would likely identify fewer species, resulting in even lower richness scores (Fore et al., 2008; Kremen et al., 2011). Thus, in programs that intend analysis by citizen scientists, we recommend that projects focus on gathering information at the level of functional groups, on limited target species, or on species within well-sampled large, and conspicuous groups. Measures and experiments that rely on citizen scientists, or groups with variable taxonomic experience and training, must carefully design questions that do not rely on species-level community analyses.
Recommendations for Photograph Use by Citizen Scientists
Invasive Species Monitoring
(a) Surveys for a limited number of known target taxa within the highly recognizable functional groups (e.g., “Colonial Tunicata,” “Branching Bryozoa,” and “Solitary Tunicata”).
(b) Surveys for a limited number of known target taxa of any functional group when panels are <1-month-old, or have little overlapping growth.
Whole Community Surveys
(a) Surveys for species within one highly recognizable functional group (e.g., “Colonial Tunicata,” “Branching Bryozoa,” and “Solitary Tunicata”) when species are already known and readily described to volunteers.
(b) Surveys for functional group abundance excluding challenging groups (“Bivalvia,” “Encrusting Bryozoa,” “Cirripedia,” “Porifera,” “Kamptozoa,” “Hydrozoa,” “Anthozoa,” and “Polychaeta”).
The most reliable uses for photographic analyses identified by our study are the identification of specific target taxa, such as possible known invasive species, and the documentation of large shifts in community structure. We suggest that photographs could be used for identifying recognizable invasive species, or for monitoring large community shifts over time that may serve as indicators of drastic environmental change, as functional groups are easily identified from photos. These best uses also reduce the expectation of citizen scientists to learn many species, and reduce the amount of training needed for new volunteers.
Contribution to the Field
Citizen scientists have historically been undervalued as data collectors, however, rising interest and increased attention to data quality have shown that properly managed public programs can collect robust and trustworthy data. Citizen scientists offer a potential solution to the problem of finding new non-native species, as professional taxonomists cannot unremittingly watch the world’s coastline. Few studies have sought to verify whether marine invertebrates could be successfully monitored using public programs, such as photo-based surveys. This study took steps to identify potential future invasive species monitoring opportunities by ascertaining the best possible data collection opportunities from photographs and untrained taxonomists. Photography provides ample opportunity to extend monitoring programs to search for known invasive species and to survey communities for coastal ecosystem shifts. Our findings suggest citizen scientists can be employed to take and analyze photographs. Additionally, citizen scientists could be a potential resource to track target species and identify organisms to functional group. However, we report that species-specific measurement tools, like diversity and richness, cannot be approximated from photographs reliably for marine invertebrates.
Data Availability
The raw data supporting the conclusions of this manuscript will be made available by the authors, without undue reservation, to any qualified researcher.
Author Contributions
KN, BT, and AC contributed to the collection of data. KN and BT compiled and analyzed all the data, with suggestions and help from AC and GR and wrote the manuscript. AC and GR provided the financial support for the project and edited the manuscript. KN prepared for submission.
Funding
This work was supported by grants from the United States Coast Guard (Grant No. HSCG23-15-C-MM019) and from the California Department of Fish and Wildlife’s Marine Invasive Species Program (Grant No. P1675035).
Conflict of Interest Statement
The authors declare that the research was conducted in the absence of any commercial or financial relationships that could be construed as a potential conflict of interest.
Acknowledgments
We acknowledge M. Marraffini for her help in statistical analysis and A. Cawood for important information on Citizen Science research. We thank the staff and interns of the Fouling Project team of the Smithsonian Environmental Research Center’s Marine Invasions Laboratory for their help and guidance during the experiment, and their taxonomic expertise. We also thank our editor and two reviewers who contributed greatly to this manuscript.
Supplementary Material
The Supplementary Material for this article can be found online at: https://www.frontiersin.org/articles/10.3389/fmars.2019.00336/full#supplementary-material
References
Abràmoff, M. D., Magalhães, P. J., and Ram, S. J. (2004). Image processing with ImageJ. Biophotonics Int. 11, 36–42.
Azzurro, E., Broglio, E., Maynou, F., and Bariche, M. (2013). Citizen science detects the undetected: the case of Abudefduf saxatilis from the Mediterranean Sea. Manag. Biol. Invasion. 4, 167–170. doi: 10.3391/mbi.2013.4.2.10
Bates, D., Maechler, M., Bolker, B., and Walker, S. (2014). lme4: linear mixed-effects models using Eigen and S4. R Package Version 1.
Bax, N., Carlton, J., Mathews-Amos, A., Haedrich, R., Howarth, F., Purcell, J., et al. (2001). The control of biological invasions in the world’s oceans. Conservation Biol. 15, 1234–1246.
Bax, N., Williamson, A., Aguero, M., Gonzalez, E., and Geeves, W. (2003). Marine invasive alien species: a threat to global biodiversity. Mar. Policy 27, 313–323. doi: 10.1016/s0308-597x(03)00041-1
Bland, J. M., and Altman, D. G. (1999). Measuring agreement in method comparison studies. Stat. Methods Med. Res. 8, 135–160. doi: 10.1191/096228099673819272
Bland, J. M., and Altman, D. G. (2003). Applying the right statistics: analyses of measurement studies. Ultrasound Obstet. Gynecol. 22, 85–93. doi: 10.1002/uog.122
Blum, J. C., Chang, A. L., Liljesthröm, M., Schenk, M. E., Steinberg, M. K., and Ruiz, G. M. (2007). The non-native solitary ascidian Ciona intestinalis (L.) depresses species richness. J. Exp. Mar. Biol. Ecol. 342, 5–14. doi: 10.1016/j.jembe.2006.10.010
Bonney, R., Shirk, J. L., Phillips, T. B., Wiggins, A., Ballard, H. L., Miller-Rushing, A. J., et al. (2014). Next Steps for Citizen Science. Science 343, 1436–1437. doi: 10.1126/science.1251554
Boudreau, S. A., and Yan, N. D. (2004). Auditing the accuracy of a volunteer-based surveillance program for an aquatic invader Bythotrephes. Environ. Monit. Assess 91, 17–26. doi: 10.1023/b:emas.0000009228.09204.b7
Bray, G. S., and Schramm, H. L. (2001). Evaluation of a statewide volunteer angler diary program for use as a fishery assessment tool. N. Am. J. Fish. Manag. 21, 606–615. doi: 10.1577/1548-8675(2001)021<0606:eoasva>2.0.co;2
Canning-Clode, J., Valdivia, N., Molis, M., Thomason, J. C., and Wahl, M. (2008). Estimation of regional richness in marine benthic communities: quantifying the error. Limnol. Oceanogr. Methods 6, 580–590. doi: 10.4319/lom.2008.6.580
Carlton, J. (2001). Introduced Species in U.S. Coastal Waters: Environmental Impacts and Management Priorities. Arlington, VA: Pew Oceans Commission.
Carpentier, A. S., Jean, C., Barret, M., Chassagneux, A., and Ciccione, S. (2016). Stability of facial scale patterns on green sea turtles Chelonia mydas over time: a validation for the use of a photo-identification method. J. Exp. Mar. Biol. Ecol. 476, 15–21. doi: 10.1016/j.jembe.2015.12.003
Carroll, M. L., Johnson, B. J., Henkes, G. A., McMahon, K. W., Voronkov, A., Ambrose, W. G., et al. (2009). Bivalves as indicators of environmental variation and potential anthropogenic impacts in the southern Barents Sea. Mar. Pollut. Bull. 59, 193–206. doi: 10.1016/j.marpolbul.2009.02.022
Ceríaco, L. M., Gutierrez, E. E., and Dubois, A. (2016). Photography-based taxonomy is inadequate, unnecessary, and potentially harmful for biological sciences. Zootaxa 4196, 435–445.
Chang, A. L., Brown, C. W., Crooks, J. A., and Ruiz, G. R. (2017). Dry and wet periods drive rapid shifts in community assembly in an estuarine ecosystem. Glob. Change Biol. 24, e627–e642. doi: 10.1111/gcb.13972
Chiarelli, R., and Roccheri, M. C. (2014). Marine Invertebrates as Bioindicators of Heavy Metal Pollution. Open J. Met. 04, 93–106. doi: 10.4236/ojmetal.2014.44011
Cooper, C. B., Shirk, J., and Zuckerberg, B. (2014). The invisible prevalence of citizen science in global research: migratory birds and climate change. PloS One 9:e106508. doi: 10.1371/journal.pone.0106508
Crall, A. W., Newman, G. J., Jarnevich, C. S., Stohlgren, T. J., Waller, D. M., and Graham, J. (2010). Improving and integrating data on invasive species collected by citizen scientists. Biol. Invasion. 12, 3419–3428. doi: 10.1007/s10530-010-9740-9
Darwall, W. R., and Dulvy, N. K. (1996). An evaluation of the suitability of non-specialist volunteer researchers for coral reef fish surveys. Mafia Island, Tanzania—a case study. Biol. Conserv. 78, 223–231. doi: 10.1016/0006-3207(95)00147-6
Davison, A. C., and Hinkley, D. V. (1997). Bootstrap Methods and Their Applications. Cambridge: Cambridge University Press.
Dean, T., and Hurd, L. (1980). Development in an estuarine fouling community: the influence of early colonists on later arrivals. Oecologia 46, 295–301. doi: 10.1007/BF00346255
Delaney, D. G., Sperling, C. D., Adams, C. S., and Leung, B. (2008). Marine invasive species: validation of citizen science and implications for national monitoring networks. Biol. Invasion. 10, 117–128. doi: 10.1007/s10530-007-9114-0
Dickinson, J. L., Zuckerberg, B., and Bonter, D. N. (2010). Citizen science as an ecological research tool: challenges and benefits. Annu. Rev. Ecol., Evol. Syst. 41, 149–172. doi: 10.1146/annurev-ecolsys-102209-144636
Fore, L. S., Paulsen, K., and O’Laughlin, K. (2008). Assessing the performance of volunteers in monitoring streams. Freshwater Biol. 46, 109–123. doi: 10.1046/j.1365-2427.2001.00640.x
Frisch, A. J., and Hobbs, J.-P. A. (2007). Photographic identification based on unique, polymorphic colour patterns: a novel method for tracking a marine crustacean. J. Exp. Mar. Biol. Ecol. 351, 294–299. doi: 10.1016/j.jembe.2007.07.008
Giavarina, D. (2015). Understanding Bland Altman analysis. Biochem. Med. 25, 141–151. doi: 10.11613/bm.2015.015
Greenemeier, L. (2017). Zooniverse: Wildwatch Kenya. Scientific American. Available at https://www.scientificamerican.com/citizen-science/zooniverse-wildwatch-kenya/ (accessed April11,2019).
Grosholz, E., Ruiz, G., Dean, C., Shirley, K., Maron, J., and Connors, P. (2000). The impacts of a nonindigenous marine predator in a California bay. Ecology 81, 1206–1224. doi: 10.1890/0012-9658(2000)081%5B1206:tioanm%5D2.0.co;2
iNaturalist (2016). A Community for Naturalist. Available at http://www.inaturalist.org/ (accessed February 8, 2017).
Kosmala, M., Wiggins, A., Swanson, A., and Simmons, B. (2016). Assessing data quality in citizen science. Front. Ecol. Environ. 14, 551–560. doi: 10.1002/fee.1436
Kremen, C., Ullman, K. S., and Thorp, R. W. (2011). Evaluating the quality of citizen-scientist data on pollinator communities. Conservation Biol. 25, 607–617. doi: 10.1111/j.1523-1739.2011.01657.x
Kumar, N., Belhumeur, P. N., Biswas, A., Jacobs, D. W., Kress, W. J., Lopez, I. C., et al. (2012). “Leafsnap: A computer vision system for automatic plant species identification,” in Computer Vision – ECCV 2012. ECCV 2012. Lecture Notes in Computer Science, Vol. 7573, eds A. Fitzgibbon, S. Lazebnik, P. Perona, Y. Sato, and C. Schmid (Berlin: Springer).
Lindeyer, F., and Gittenberger, A. (2011). Ascidians in the succession of marine fouling communities. Aquat. Invasions 6, 421–434. doi: 10.1111/gcb.13856
Lodge, D. M., Williams, S., MacIsaac, H. J., Hayes, K. R., Leung, B., Reichard, S., et al. (2006). Biological invasions: recommendations for u.s. policy and management. Ecol. Appl. 16, 2035–2054.
Maistrello, L., Dioli, P., Bariselli, M., Mazzoli, G. L., and Giacalone-Forini, I. (2016). Citizen science and early detection of invasive species: phenology of first occurrences of Halyomorpha halys in Southern Europe. Biol. Invasions 18, 3109–3116. doi: 10.1007/s10530-016-1217-z
Mangin, S. (2001). The 100th Meridian Initiative: A Strategic Approach to Prevent the Westward Spread of Zebra Mussles and Other Aquatic Nuisance Species. Washington, DC: US Fish and Wildlife Service.
Mantelatto, M. C., Fleury, B. G., Menegola, C., and Creed, J. C. (2013). Cost–benefit of different methods for monitoring invasive corals on tropical rocky reefs in the southwest Atlantic. J. Exp. Mar. Biol. Ecol. 449, 129–134. doi: 10.1016/j.jembe.2013.09.009
Marraffini, M. L., and Geller, J. B. (2015). Species richness and interacting factors control invasibility of a marine community. Proc. R. Soc. B Biol. Sci. 282, 20150439. doi: 10.1098/rspb.2015.0439
McCann, L. D., Holzer, K. K., Davidson, I. C., Ashton, G. V., Chapman, M. D., and Ruiz, G. M. (2013). Promoting invasive species control and eradication in the sea: options for managing the tunicate invader Didemnum vexillum in Sitka, Alaska. Mar. Pollut. Bull. 77, 165–171. doi: 10.1016/j.marpolbul.2013.10.011
Melancon, R., Lane, S., Speakman, T., Hart, L., Sinclair, C., Adams, J., et al. (2011). Photo-Identification Field and Laboratory Protocols Utilizing FinBase v.2. Available at http://www.nmfs.noaa.gov/pr/species/finbase.htm (accessed October 18, 2016).
Miller-Rushing, A., Primack, R., and Bonney, R. (2012). The history of public participation in ecological research. Front. Ecol. Environ. 10, 285–290. doi: 10.1890/110278
Newcomer, K., Marraffini, M. L., and Chang, A. L. (2018). Distribution patterns of the introduced encrusting bryozoan Conopeum chesapeakensis (Osburn 1944; Banta et al. 1995) in an estuarine environment in upper San Francisco Bay. J. Exp. Mar. Biol. Ecol. 504, 20–31. doi: 10.1016/j.jembe.2018.04.001
Ojaveer, H., Galil, B. S., Campbell, M. L., Carlton, J. T., Canning-Clode, J., Cook, E. J., et al. (2015). Classification of non-indigenous species based on their impacts: considerations for application in marine management. PLoS Biol. 13:e1002130. doi: 10.1371/journal.pbio.1002130
Oksanen, J., Kindt, R., Legendre, P., O’Hara, B., Stevens, M. H. H., and Oksanen, M. J. (2007). The vegan package. Community Ecol. Package 10, 631–637.
Osman, R. W., and Whitlatch, R. B. (1995). The influence of resident adults on recruitment: a comparison to settlement. J. Exp. Mar. Biol. Ecol. 190, 169–198. doi: 10.1016/0022-0981(95)00035-p
R Core Team (2015). R: a language and environment for statistical computing. Vienna: R Foundation for Statistical Computing.
RAC/SPA - UNEP/MAP (2015). A guide on environmental monitoring of rocky seabeds in Mediterranean Marine Protected Areas and surrounding zones. Tunis: RAC/SPA.
Ruiz, G., Carlton, J., Grosholz, E., and Hines, A. (1997). Global invasions of marine and estuarine habitats by non-indigenous species: mechanisms, extent, and consequences. Am. Zool. 37, 621–632. doi: 10.1093/icb/37.6.621
Ruiz, G., Fofonoff, P., Carlton, J., Wonham, M., and Hines, A. (2000). Invasion of coastal marine communities in North America: apparent patterns, processes, and biases. Annu. Rev. Ecol. Syst. 31, 481–531. doi: 10.1146/annurev.ecolsys.31.1.481
Ruiz, G. M., Fofonoff, P., Hines, A. H., and Grosholz, E. D. (1999). Non-indigenous species as stressors in estuarine and marine communities: assessing invasion impacts and interactions. Limnol. Oceanogr. 44, 950–972. doi: 10.4319/lo.1999.44.3_part_2.0950
Ruiz, G. M., Fofonoff, P. W., Steves, B., Foss, S. F., and Shiba, S. N. (2011). Marine invasion history and vector analysis of California: a hotspot for western North America. Divers. Distrib. 17, 362–373. doi: 10.1111/j.1472-4642.2011.00742.x
Ruiz, G. M., Fofonoff, P. W., Steves, B. P., and Carlton, J. T. (2015). Invasion history and vector dynamics in coastal marine ecosystems: A North American perspective. Aquat. Ecosyst. Health Manag. 18, 299–311. doi: 10.1080/14634988.2015.1027534
Sakamoto, Y., Ishiguro, M., and Kitagawa, G. (1986). Akaike Information Criterion Statistics. Tokyo: KTK Scientific.
Scyphers, S. B., Powers, S. P., Akins, J. L., Drymon, J. M., Martin, C. W., Schobernd, Z. H., et al. (2014). The role of citizens in detecting and responding to a rapid marine invasion. Conserv. Lett. 8, 242–250. doi: 10.1111/conl.12127
Shannon, C., and Weaver, W. (1948). A mathematical theory of communication. Bell Syst. Tech. J. 27, 379–423&623–656.
Silvertown, J. (2009). A new dawn for citizen science. Trends Ecol. Evol. 24, 467–471. doi: 10.1016/j.tree.2009.03.017
Stachowicz, J., Terwin, J., Whitlatch, R., and Osman, R. (2002). Linking climate change and biological invasions: ocean warming facilitates nonindigenous species invasions. Proc. Natl. Acad. Sci. U.S.A. 99, 15497–15500. doi: 10.1073/pnas.242437499
Stachowicz, J. J., Whitlatch, R. B., and Osman, R. W. (1999). Species diversity and invasion resistance in a marine ecosystem. Science 286, 1577–1579. doi: 10.1126/science.286.5444.1577
Sutherland, J. P. (1974). Multiple stable points in natural communities. Am. Nat. 108, 859–873. doi: 10.1086/282961
Sutherland, J. P., and Karlson, R. H. (1977). Development and stability of the fouling community at Beaufort, North Carolina. Ecol. Monographs 47, 425–446. doi: 10.2307/1942176
Swain, D. L. (2015). A tale of two California droughts: lessons amidst record warmth and dryness in a region of complex physical and human geography. Geophys. Res. Lett. 42, 9999. doi: 10.1002/2015gl066628
Swanson, A., Kosmala, M., Lintott, C., and Packer, C. (2016). A generalized approach for producing, quantifying, and validating citizen science data from wildlife images. Conservation Biol. 30, 520–531. doi: 10.1111/cobi.12695
Thiel, M., Penna-Díaz, M. A., Luna-Jorquera, G., Salas, S., Sellanes, J., and Stotz, W. (2014). Citizen scientists and marine research: volunteer participants, their contributions, and projection for the future. Oceanogr. Mar. Biol. Annu. Rev. 52, 257–314. doi: 10.1201/b17143-6
Tracy, B. M., and Reyns, N. B. (2014). Spatial and temporal patterns of native and invasive ascidian assemblages in a Southern California embayment. Aquat. Invasion. 9, 441–455. doi: 10.3391/ai.2014.9.4.03
United States Fish and Wildlife Service [USFWS] (2015). Detection and Monitoring of Aquatic Nuisance Species. Available at https://www.fws.gov/fisheries/ans/ANSDetect.html (accessed February 21, 2017).
Valentine, P. C., Carman, M. R., Dijkstra, J., and Blackwood, D. S. (2009). Larval recruitment of the invasive colonial ascidian Didemnum vexillum, seasonal water temperatures in New England coastal and offshore waters, and implications for spread of the species. Aquat. Invasion 4, 153–168. doi: 10.3391/ai.2009.4.1.16
Ward, D. F., and Larivière, M. C. (2004). Terrestrial invertebrate surveys and rapid biodiversity assessment in New Zealand: lessons from Australia. N. Z. J. Ecol. 28, 151–159.
Wisely, B. (1959). Factors influencing the settling of the principal marine fouling organisms in Sydney Harbour. Mar. Freshwater Res. 10, 30–44.
Zenetos, A., Koutsogiannopoulos, D., Ovalis, P., and Poursanidis, D. (2013). The role played by citizen scientists in monitoring marine alien species in Greece. Cahiers de Biologie Mar. 54, 419–426.
Keywords: photographic methods, marine, invertebrates, non-native, citizen science, taxonomy
Citation: Newcomer K, Tracy BM, Chang AL and Ruiz GM (2019) Evaluating Performance of Photographs for Marine Citizen Science Applications. Front. Mar. Sci. 6:336. doi: 10.3389/fmars.2019.00336
Received: 28 February 2019; Accepted: 31 May 2019;
Published: 18 June 2019.
Edited by:
Xavier Pochon, Cawthron Institute, New ZealandReviewed by:
Leigh W. Tait, National Institute of Water and Atmospheric Research (NIWA), New ZealandFree Espinosa Torre, University of Seville, Spain
Copyright © 2019 Newcomer, Tracy, Chang and Ruiz. This is an open-access article distributed under the terms of the Creative Commons Attribution License (CC BY). The use, distribution or reproduction in other forums is permitted, provided the original author(s) and the copyright owner(s) are credited and that the original publication in this journal is cited, in accordance with accepted academic practice. No use, distribution or reproduction is permitted which does not comply with these terms.
*Correspondence: Katherine Newcomer, newcomerk@si.edu