On the Future of Argo: A Global, Full-Depth, Multi-Disciplinary Array
 Dean Roemmich1*†
  Matthew H. Alford1†
  Hervé Claustre2†
  Kenneth Johnson3†
  Brian King4†
  James Moum5†
  Peter Oke6† W. Brechner Owens7†
  Sylvie Pouliquen8†
  Sarah Purkey1†
  Megan Scanderbeg1†
  Toshio Suga9†
  Susan Wijffels7†
  Nathalie Zilberman1†
  Dorothee Bakker10
  Molly Baringer11
  Mathieu Belbeoch12
  Henry C. Bittig2
  Emmanuel Boss13
  Paulo Calil14
  Fiona Carse15
  Thierry Carval8 Fei Chai16 Diarmuid Ó. Conchubhair17
  Fabrizio d’Ortenzio2
  Giorgio Dall’Olmo18
  Damien Desbruyeres8
  Katja Fennel19
  Ilker Fer20
  Raffaele Ferrari21
  Gael Forget21
  Howard Freeland22
  Tetsuichi Fujiki23
  Marion Gehlen24
  Blair Greenan25 Robert Hallberg26
  Toshiyuki Hibiya27
  Shigeki Hosoda23
  Steven Jayne7
  Markus Jochum28 Gregory C. Johnson29
  KiRyong Kang30
  Nicolas Kolodziejczyk31
  Arne Körtzinger32
  Pierre-Yves Le Traon33
  Yueng-Djern Lenn34
  Guillaume Maze8
  Kjell Arne Mork35
  Tamaryn Morris36
  Takeyoshi Nagai37 Jonathan Nash5 Alberto Naveira Garabato4
  Are Olsen20 Rama Rao Pattabhi38
  Satya Prakash38 Stephen Riser39
  Catherine Schmechtig40 Claudia Schmid11
  Emily Shroyer5
  Andreas Sterl41
  Philip Sutton42
  Lynne Talley1
  Toste Tanhua32
  Virginie Thierry8
  Sandy Thomalla43 John Toole7
  Ariel Troisi44
  Thomas W. Trull6
  Jon Turton15
  Pedro Joaquin Velez-Belchi45
  Waldemar Walczowski46 Haili Wang47
  Rik Wanninkhof11
  Amy F. Waterhouse1
  Stephanie Waterman48 Andrew Watson49
  Cara Wilson50
  Annie P. S. Wong39 Jianping Xu16
  Ichiro Yasuda51
- 1Scripps Institution of Oceanography, La Jolla, CA, United States
- 2French National Center for Scientific Research, Villefranche Oceanographic Laboratory, Sorbonne Université, Villefranche-sur-Mer, France
- 3Monterey Bay Aquarium Research Institute, Moss Landing, CA, United States
- 4National Oceanography Centre, Southampton, United Kingdom
- 5College of Earth, Ocean, and Atmospheric Sciences, Oregon State University, Corvallis, OR, United States
- 6Commonwealth Scientific and Industrial Research Organisation, Hobart, TAS, Australia
- 7Woods Hole Oceanographic Institution, Woods Hole, MA, United States
- 8Institut Français de Recherche pour l’Exploitation de la Mer, Brest, France
- 9Department of Geophysics, Graduate School of Science, Tohoku University, Sendai, Japan
- 10School of Environmental Sciences, Centre for Ocean and Atmospheric Sciences, University of East Anglia, Norwich, United Kingdom
- 11Atlantic Oceanographic and Meteorological Laboratory, National Oceanic and Atmospheric Administration, Miami, FL, United States
- 12JCOMMOPS, Brest, France
- 13School of Marine Sciences, The University of Maine, Orono, ME, United States
- 14Institute of Coastal Research, Helmholtz-Zentrum Geesthacht, Geesthacht, Germany
- 15UK Met Office, Exeter, United Kingdom
- 16State Key Laboratory of Satellite Ocean Environment Dynamics, Second Institute of Oceanography, Ministry of Natural Resources, Hangzhou, China
- 17Irish Marine Institute, Galway, Ireland
- 18Plymouth Marine Laboratory, Plymouth, United Kingdom
- 19Department of Oceanography, Dalhousie University, Halifax, NS, Canada
- 20Physical Oceanography, Geophysical Institute, University of Bergen, Bergen, Norway
- 21Massachusetts Institute of Technology, Cambridge, MA, United States
- 22Fisheries and Oceans Canada, Sidney, BC, Canada
- 23Japan Agency for Marine-Earth Science and Technology, Yokosuka, Japan
- 24Laboratoire des Sciences du Climat et de l’Environnement/Institut Pierre Simon Laplace, Gif-sur-Yvette, France
- 25Bedford Institute of Oceanography and Fisheries and Oceans Canada, Dartmouth, NS, Canada
- 26National Oceanic and Atmospheric Administration, Geophysical Fluid Dynamics Laboratory, Princeton, NJ, United States
- 27Graduate School of Science, Department of Earth and Planetary Science, The University of Tokyo, Tokyo, Japan
- 28Neils Bohr Institute, Copenhagen, Denmark
- 29National Oceanic and Atmospheric Administration/Pacific Marine Environmental Laboratory, Seattle, WA, United States
- 30Korea Meteorological Administration, Seoul, South Korea
- 31CNRS-IRD-Ifremer, LOPS Laboratory, University of Brest, Brest, France
- 32Helmholtz-Zentrum für Ozeanforschung Kiel, Kiel, Germany
- 33Mercator-Ocean, Brest, France
- 34School of Ocean Sciences, Bangor University, Bangor, United Kingdom
- 35Institute of Marine Research, Bergen, Norway
- 36Marine Research Unit, South African Weather Service, Cape Town, South Africa
- 37Graduate School of Marine Science and Technology, Ocean Sciences, Tokyo University of Marine Science and Technology, Tokyo, Japan
- 38Indian National Centre for Ocean Information Services, Hyderabad, India
- 39School of Oceanography, College of the Environment, University of Washington, Seattle, WA, United States
- 40French National Center for Scientific Research, OSU Ecce Terra, Sorbonne Université, Paris, France
- 41Koninklijk Nederlands Meteorologisch Instituut, De Bilt, Netherlands
- 42National Institute of Water and Atmospheric Research, Auckland, New Zealand
- 43Southern Ocean Carbon & Climate Observatory, Cape Town, South Africa
- 44Servício de Hídrografia Naval, Buenos Aires, Argentina
- 45Instituto Espanol de Oceanografia, Canary Islands, Spain
- 46Institute of Oceanology Polish Academy of Sciences, Sopot, Poland
- 47State Key Laboratory of Marine Environmental Science, Xiamen University, Xiamen, China
- 48Department of Earth, Ocean and Atmospheric Sciences, The University of British Columbia, Vancouver, BC, Canada
- 49Earth System Science Group, College of Life and Environmental Science, University of Exeter, Exeter, United Kingdom
- 50National Oceanic and Atmospheric Administration – National Marine Fisheries Service, Pacific Grove, CA, United States
- 51Atmosphere and Ocean Research Institute, The University of Tokyo, Tokyo, Japan
The Argo Program has been implemented and sustained for almost two decades, as a global array of about 4000 profiling floats. Argo provides continuous observations of ocean temperature and salinity versus pressure, from the sea surface to 2000 dbar. The successful installation of the Argo array and its innovative data management system arose opportunistically from the combination of great scientific need and technological innovation. Through the data system, Argo provides fundamental physical observations with broad societally-valuable applications, built on the cost-efficient and robust technologies of autonomous profiling floats. Following recent advances in platform and sensor technologies, even greater opportunity exists now than 20 years ago to (i) improve Argo’s global coverage and value beyond the original design, (ii) extend Argo to span the full ocean depth, (iii) add biogeochemical sensors for improved understanding of oceanic cycles of carbon, nutrients, and ecosystems, and (iv) consider experimental sensors that might be included in the future, for example to document the spatial and temporal patterns of ocean mixing. For Core Argo and each of these enhancements, the past, present, and future progression along a path from experimental deployments to regional pilot arrays to global implementation is described. The objective is to create a fully global, top-to-bottom, dynamically complete, and multidisciplinary Argo Program that will integrate seamlessly with satellite and with other in situ elements of the Global Ocean Observing System (Legler et al., 2015). The integrated system will deliver operational reanalysis and forecasting capability, and assessment of the state and variability of the climate system with respect to physical, biogeochemical, and ecosystems parameters. It will enable basic research of unprecedented breadth and magnitude, and a wealth of ocean-education and outreach opportunities.
Introduction
The Argo Program is a major component of both the Global Ocean Observing System (GOOS) and the Global Climate Observing System (GCOS), providing near-real time data for ocean and atmospheric services and high quality data for climate research. The Argo Program began its implementation in 1999 and has provided global coverage of the upper 2000 m of the oceans since 2006. By November 2018, Argo had provided 2,000,000 profiles since the program began, and a comparable number of velocity drift estimates at 1000 m depth. Although originally designed to provide temperature and salinity profiles in the upper 2 km of the ice-free oceans, the array has been expanded into seasonal ice zones using floats equipped with ice avoidance algorithms. Argo profiling floats also are sampling in many marginal seas. In addition, ongoing regional pilot programs have demonstrated that Argo floats can now (1) measure biogeochemical parameters to address oceanic uptake of carbon, acidification and deoxygenation (Biogeochemical, BGC, Argo) and (2) make measurements throughout the water column to 6000 m depth (Deep Argo). Notification through the Argo Information Center (AIC), following Intergovernmental Oceanographic Commission (IOC) guidelines to protect the rights of Coastal States, has enabled global coverage. Presently the number of functioning Argo floats remains steady, with total float count around 4000. This has been possible, despite relatively flat funding, through a collaboration of international partners and significant technological innovation. The Argo Data System provides real-time data within 24 h of collection through the Global Telecommunications System (GTS) and via the internet for use at global prediction centers. The Argo Data Management Team (ADMT) also oversees delayed-mode quality control of the data and the availability of Argo data at the Argo Global Data Assembly Centers.
To meet future needs, Argo should (1) support continuing innovation in float technology, (2) enhance coverage in critical regions such as the equatorial band, where higher temporal resolution is needed and the western boundary regions where mesoscale ‘noise’ is high, (3) implement Deep Argo and Biogeochemical Argo in the global array, (4) assess the technical readiness and scientific value of experimental measurements for possible future inclusion in Argo, for example those used to estimate small scale mixing, and (5) collaborate with our end-user community to improve the use of Argo data in prediction systems and services. This review lays out the motivation, development, and present status of the Argo Program, and addresses the five issues mentioned above. It is important to note that Core Argo has reached and maintained full implementation through innovation and broad community support. Only a small fraction of the funding needed to support the ambitious community requests for an expanded Argo Program can be identified at present. It is important for Argo to meet its future challenges as a single integrated program. The present elements of Argo – Core, Deep, and BGC – and of its data management system are not separable, and any other future enhancements will similarly be considered as contributions to the unified effort.
Motivation, Development, Technology
Core Argo
During the 1990s, the World Ocean Circulation Experiment brought increased understanding of important oceanic roles in climate variability and change (Siedler et al., 2001). The need to observe the global subsurface ocean, together with a fit-for-purpose revolutionary autonomous technology (Davis et al., 2001), led to a multinational proposal for a global subsurface ocean observing system (Argo Steering Team, 1998). The proposed ‘Argo Program’ would be comprised of over 3000 profiling floats, obtaining a snapshot of the physical state of the ocean from 0 to 2000 m every 10 days. All data would be freely shared in near-real time (NRT, within 24 h) to support forecasting, and with a highly quality-controlled delayed-mode (DM) version delivered within 12 months for climate research and assessments. Argo floats were deployed in regional arrays beginning in 1999 and then globally from 2004 to the present. Argo has fulfilled its promise to complement and integrate across many satellite and in situ elements of the GOOS and across many regional observational networks (deYoung et al., 2019; Foltz et al., 2019; Hermes et al., 2019; Lee et al., 2019; Newman et al., 2019; Palazov et al., 2019; Smith et al., 2019; Todd et al., 2019).
A number of key elements that contributed to Argo’s success over the past 20 years are evident. The underpinning profiling float technology is simple, robust, and cost-effective. A strong international consensus on the high value of Argo, by agencies and the science community, contributed to Argo’s rapid roll-out. Once Argo was in place, a broad base of applications (see section “Core Argo” under the section “End User Engagement”) including basic research, assessment of the state of the Earth’s climate, tertiary and secondary education, and ocean modeling for reanalysis and operational prediction, drew strong community support. Effective partnerships developed between Argo teams and commercial suppliers, to exploit and improve float and sensor technologies. The IOC provided necessary protocols to facilitate the operation of Argo floats in national waters (Intergovernmental Oceanographic Commission [IOC], 1999), while the AIC1 supplied the mechanisms for tracking and reporting to coastal states (Pinardi et al., 2019).
Technology advances have continued throughout Argo’s 20-year history. New generation profiling floats are smaller, lighter, and more energy efficient. A profoundly important transition from unidirectional to faster bidirectional communication (Iridium) improves vertical resolution and shortens surface times from 12 h to 20 min, greatly reducing bio-fouling, array divergence due to surface drift, grounding, and other hazards. Ice-avoidance measures in float controllers (Klatt et al., 2007) have extended the range of Argo through the seasonal ice zones (Wong and Riser, 2011). Improved CTD sensors, as well as procedures for delayed-mode quality control (Owens and Wong, 2009) have increased the accuracy and consistency of the Argo dataset. Float lifetimes have increased, to 4–5 years for most Argo National Programs, reducing the cost per profile while extending reseeding intervals. All of these improvements are propagated across the Argo national programs through communication of Best Practices (Pearlman et al., 2019).
Argo’s systematic and regular observation of the global subsurface ocean has transformed ocean observing. Northern hemisphere, near-coastal, and seasonal sampling biases of earlier eras are removed. The global Argo array has been sustained and improved for more than a decade, providing data for over 3000 research publications and becoming a mainstay of global ocean data assimilation, modeling, and prediction applications. The notable convergence, in the Argo era, of diverse estimates of historical global ocean heat content changes (e.g., Johnson et al., 2016) has increased the confidence that can be placed on the reliability of national and international assessments of climate change. International partners in Argo merge their efforts to produce a seamless global array, providing standardized observations, and delivering near real-time and research quality data with public access. Argo has led the way among ocean observing networks with regard to international cooperation, operations planning, Data Availability, and metadata quality.
BGC-Argo
The Biogeochemical (BGC)-Argo program began with the deployment of optical (Bishop et al., 2002; Mitchell, 2003; Boss et al., 2008) and oxygen (Körtzinger et al., 2004; Riser and Johnson, 2008) sensors on profiling floats between 2000 and 2003. The success of these efforts was highlighted at the Autonomous Platforms and Sensors meeting (Rudnick and Perry, 2003), which was the founding meeting for this community. It was followed by the development of a global vision for biogeochemical data acquisition through the inclusion of oxygen sensors on Argo platforms (Gruber et al., 2007), and the launch the same year of a working group of the International Ocean-Color Coordinating Group, “Bio-optical sensors on Argo floats” (IOCCG, 2011). In the meantime, both the oxygen and optical communities were promoting their vision for developing a global network of profiling floats carrying oxygen and optical sensors as part of the OceanObs09 conference (Claustre et al., 2010; Gruber et al., 2010), following a meeting in Johnson et al. (2009) that addressed the development of a global observing system using both gliders and profiling floats.
In 2016, a meeting was held in Villefranche-sur-mer to develop an implementation plan for BGC-Argo. The subsequent report (Biogeochemical-Argo Planning Group, 2016) was the starting point of the BGC-Argo program. Observing system simulation experiments (OSSEs) performed for this meeting suggested that a 1000-float array would significantly constrain the processes that control global oxygen and carbon distributions, including air-sea fluxes and exports from the surface (Kamenkovich et al., 2017). Assuming a mean BGC float lifetime of 4 years, sustaining a 1000-float array requires 250 floats per year with an estimated annual cost near US$25-M. Each of the floats would carry sensors for six core ocean variables measured with targeted accuracies2 : chlorophyll fluorescence (Chla), particle backscatter, oxygen, nitrate, pH, and irradiance. The 1000-float array would provide observational data to transform ability to quantify: (i) air-sea carbon fluxes, (ii) ocean deoxygenation, oxygen minimum zones and related denitrification fluxes, (iii) ocean acidification, (iv) the biological carbon pump, and (v) phytoplankton communities. The observing system would improve management of living marine resources and carbon budget verification, both key societal goals. In 2017, a BGC-Argo Scientific Steering Committee was formed (under the Argo Steering Team), to guide the development of the network and the implementation of the program objectives, and to continue developing a vision for the future. In 2018, during the Executive Council of IOC, unanimous support from Member States was given to the proposal to incorporate the six biogeochemical measurements in the Argo array. Additionally the Executive Council approved a framework for the future addition of new parameters to Argo.
The first BGC-Argo deployments consisted of a few floats at a time. These have evolved to regional scale projects such as remOcean (North Atlantic sub-polar Gyre, 20 floats) and NAOS (Mediterranean Sea, 30 floats), and to basin-scale projects such as SOCCOM (Southern Ocean Carbon and Climate Observations and Modeling) with more than 100 floats deployed thus far, toward a target of 200. These pilots have showcased the potential of community-shared efforts to support better understanding of major biogeochemical processes at the global scale and to explore new research topics. The profiling float data sets have been vetted by research groups via publications approaching several 100 in total. BGC-Argo observations are open and free through the Argo data system both in NRT and DM.
These projects are transforming our understanding of variability in the ocean over time scales difficult to achieve with ship-based observations. A few of these achievements include characterization of ocean nitrate supply (Johnson et al., 2010; D’Ortenzio et al., 2014); observation of bloom dynamics beneath the surface (Boss and Behrenfeld, 2010; Mignot et al., 2018); novel carbon export mechanisms through a mixed-layer pump (Dall’Olmo and Mork, 2014; Dall’Olmo et al., 2016) or eddy subduction (Llort et al., 2018); oxygen minimum zone processes (Whitmire et al., 2009; Prakash et al., 2012; Stanev et al., 2018); ocean net community production over complete annual cycles throughout the ocean (Riser and Johnson, 2008; Bushinsky and Emerson, 2015; Hennon et al., 2016; Plant et al., 2016); ocean ventilation (Körtzinger et al., 2004; Wolf et al., 2018); air-sea exchanges of O2 (Bushinsky et al., 2017) and CO2 (Williams et al., 2017; Bittig et al., 2018; Gray et al., 2018); and mesoscale/sub-mesoscale processes (Sukigara et al., 2011; Kouketsu et al., 2016). In a major advance, the data are now being assimilated into biogeochemical models to enable greater understanding and improved predictions (Verdy and Mazloff, 2017).
The development of BGC-Argo floats has been based on the standard Argo Pressure/Temperature/Salinity (P/T/S) platforms, integrating new sensors when their readiness level appeared compatible with long-term, operational use. Today, the community is operating three main BGC-Argo platforms (Figure 1): PROVOR, Navis, and APEX floats. While each of these platforms is capable of carrying the six core sensors outlined in the BGC-Argo implementation plan, due to present hardware limitations and the objectives of funded research programs, few have yet been deployed with all six. Deployments of floats carrying the six core variables are highly desirable as well as harmonizing of mission parameters with those of Core Argo.
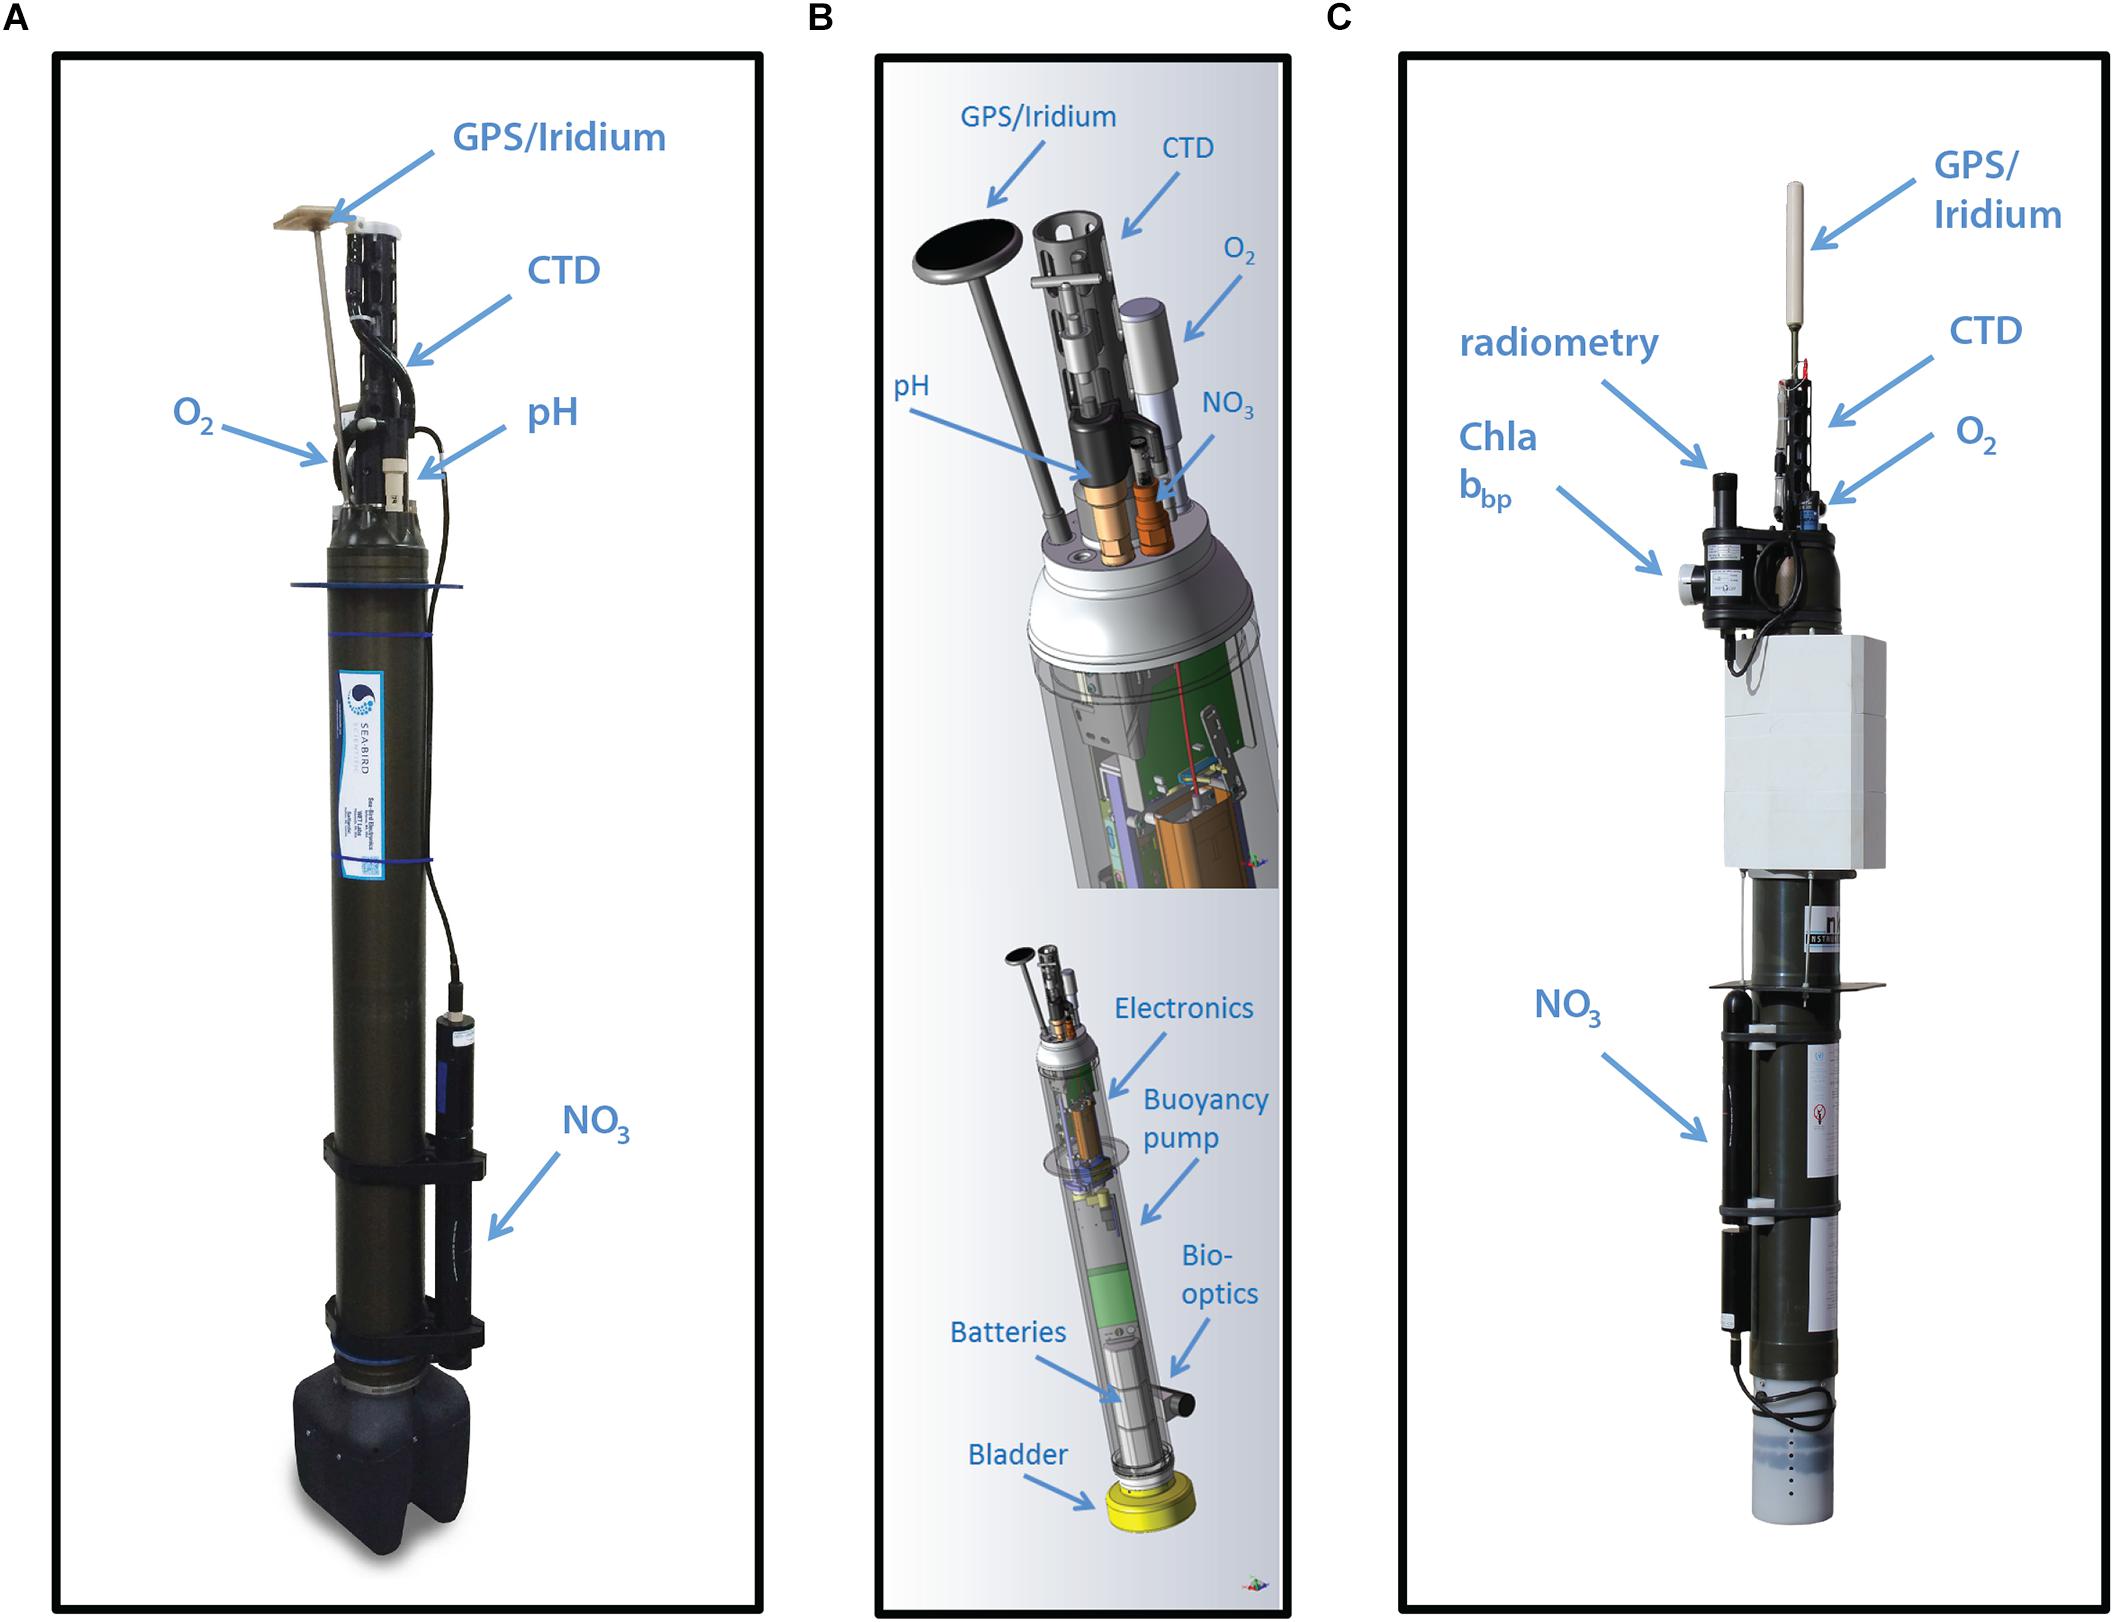
Figure 1. The three main models of BGC-Argo floats presently in use include (A) Navis, (B) APEX, and (C) PROVOR.
Deep Argo
Deep Argo is motivated by the substantial oceanographic variability found in the 50% of ocean volume that lies below the 2000-dbar profiling target for conventional Argo floats. Development of floats and CTDs capable of accurate measurements to 6000 dbar makes global full-depth Argo implementation feasible, including sampling of bottom-intensified ocean variability.
Antarctic Bottom Water, which fills much of the ocean below 2000 dbar (Johnson, 2008), has been warming and freshening during the past few decades, with these changes contributing to steric sea level rise (Purkey and Johnson, 2013). The rate of ocean heat-gain below 2000 dbar, of 0.065 ( ± 0.04) W m–2 from 1991 to 2010 (Desbruyères et al., 2016) is about 10% of the 0.61 ( ± 0.09) W m–2 from 2005 to 2015 in the upper 1800 dbar (Johnson et al., 2016). Deep ocean (>2000 dbar) heat content changes have been estimated over decadal intervals using a sparse network of repeat hydrographic sections that are sampled at quasi-decadal intervals (Talley et al., 2016), hence only decadal estimates are possible, and uncertainties due to the sparsity of observations are about 2/3 the size of the signal. In contrast, Core Argo data enables decadal estimation of ocean heat uptake shallower than 2000 dbar with uncertainties only about 1/7 the size of the signal. In addition, monthly global analyses of Core Argo data (Roemmich and Gilson, 20093) have provided a basis for investigation of seasonal-to-interannual variability (e.g., Johnson and Birnbaum, 2017). Deep Argo will similarly reduce the uncertainties in decadal deep ocean heat uptake estimates, while providing data for a broad range of scientific investigations of deep variability (Johnson et al., 2015). The fact that abyssal trends and diffusivities both seem to be insufficiently constrained in ocean state estimates is further evidence that deep Argo is needed (Wunsch and Heimbach, 2014; Forget et al., 2015).
North Atlantic Deep Water is also changing, with the meridional overturning circulation decreasing measurably between 2004–2008 and 2008–2012 (Smeed et al., 2018). Deep ocean circulation variations have primarily been observed using transoceanic moored arrays, which are costly to maintain, and hence regionally limited (Lozier et al., 2017; Meinen et al., 2017; Smeed et al., 2018). Repeat hydrographic section data are also used for this purpose despite their sparse temporal sampling (Bryden et al., 2005; Kouketsu et al., 2011). Deep Argo would provide velocity and density information, complementing both the moored arrays and repeat hydrography, as well as facilitating decadal climate predictions and constraining full-depth ocean data assimilation (Robson et al., 2012; Yeager et al., 2012; Carrassi et al., 2016).
The value and technical feasibility of a Deep Argo Program were recognized at OceanObs’09 (Roemmich et al., 2010). Successful deployments of prototype deep floats and CTDs in 2012–2014 led to a Deep Argo Implementation Workshop in May 2015 (Zilberman and Maze, 2015), where a plan for Deep Argo’s progression to a global 5° × 5° array was endorsed. Regional pilot arrays have been established in the South Pacific, South Indian, and North Atlantic oceans, further demonstrating the feasibility of a global Deep Argo array.
Argo Data Management
The Argo data system was designed in 2001 at the 1st Argo Data Management meeting in Brest, France and its main components remain in place and function well (Figure 2). The national Data Assembly Centres (DACs) receive data via satellite transmission, decode it, and apply quality control according to a set of agreed NRT tests. Erroneous data are corrected if possible, flagged accordingly and then sent to two Global Data Assembly Centres (GDACs) and the GTS. The GDACs collect the data from the 11 DACs, synchronize their databases daily and serve the data on FTP sites. The AIC monitors the status of the Argo Program, including data distribution, and meta data that incorporate float location, model, transmission system, owner, etc. In addition, the AIC gathers feedback on data quality from users and relays it to float owners and DACs. Argo’s delayed-mode data system for P/T/S variables relies on Argo data experts examining the data and reflagging where necessary, using a standard method (Owens and Wong, 2009) to estimate salinity drift, in addition to applying salinity thermal lag adjustments and pressure adjustments.
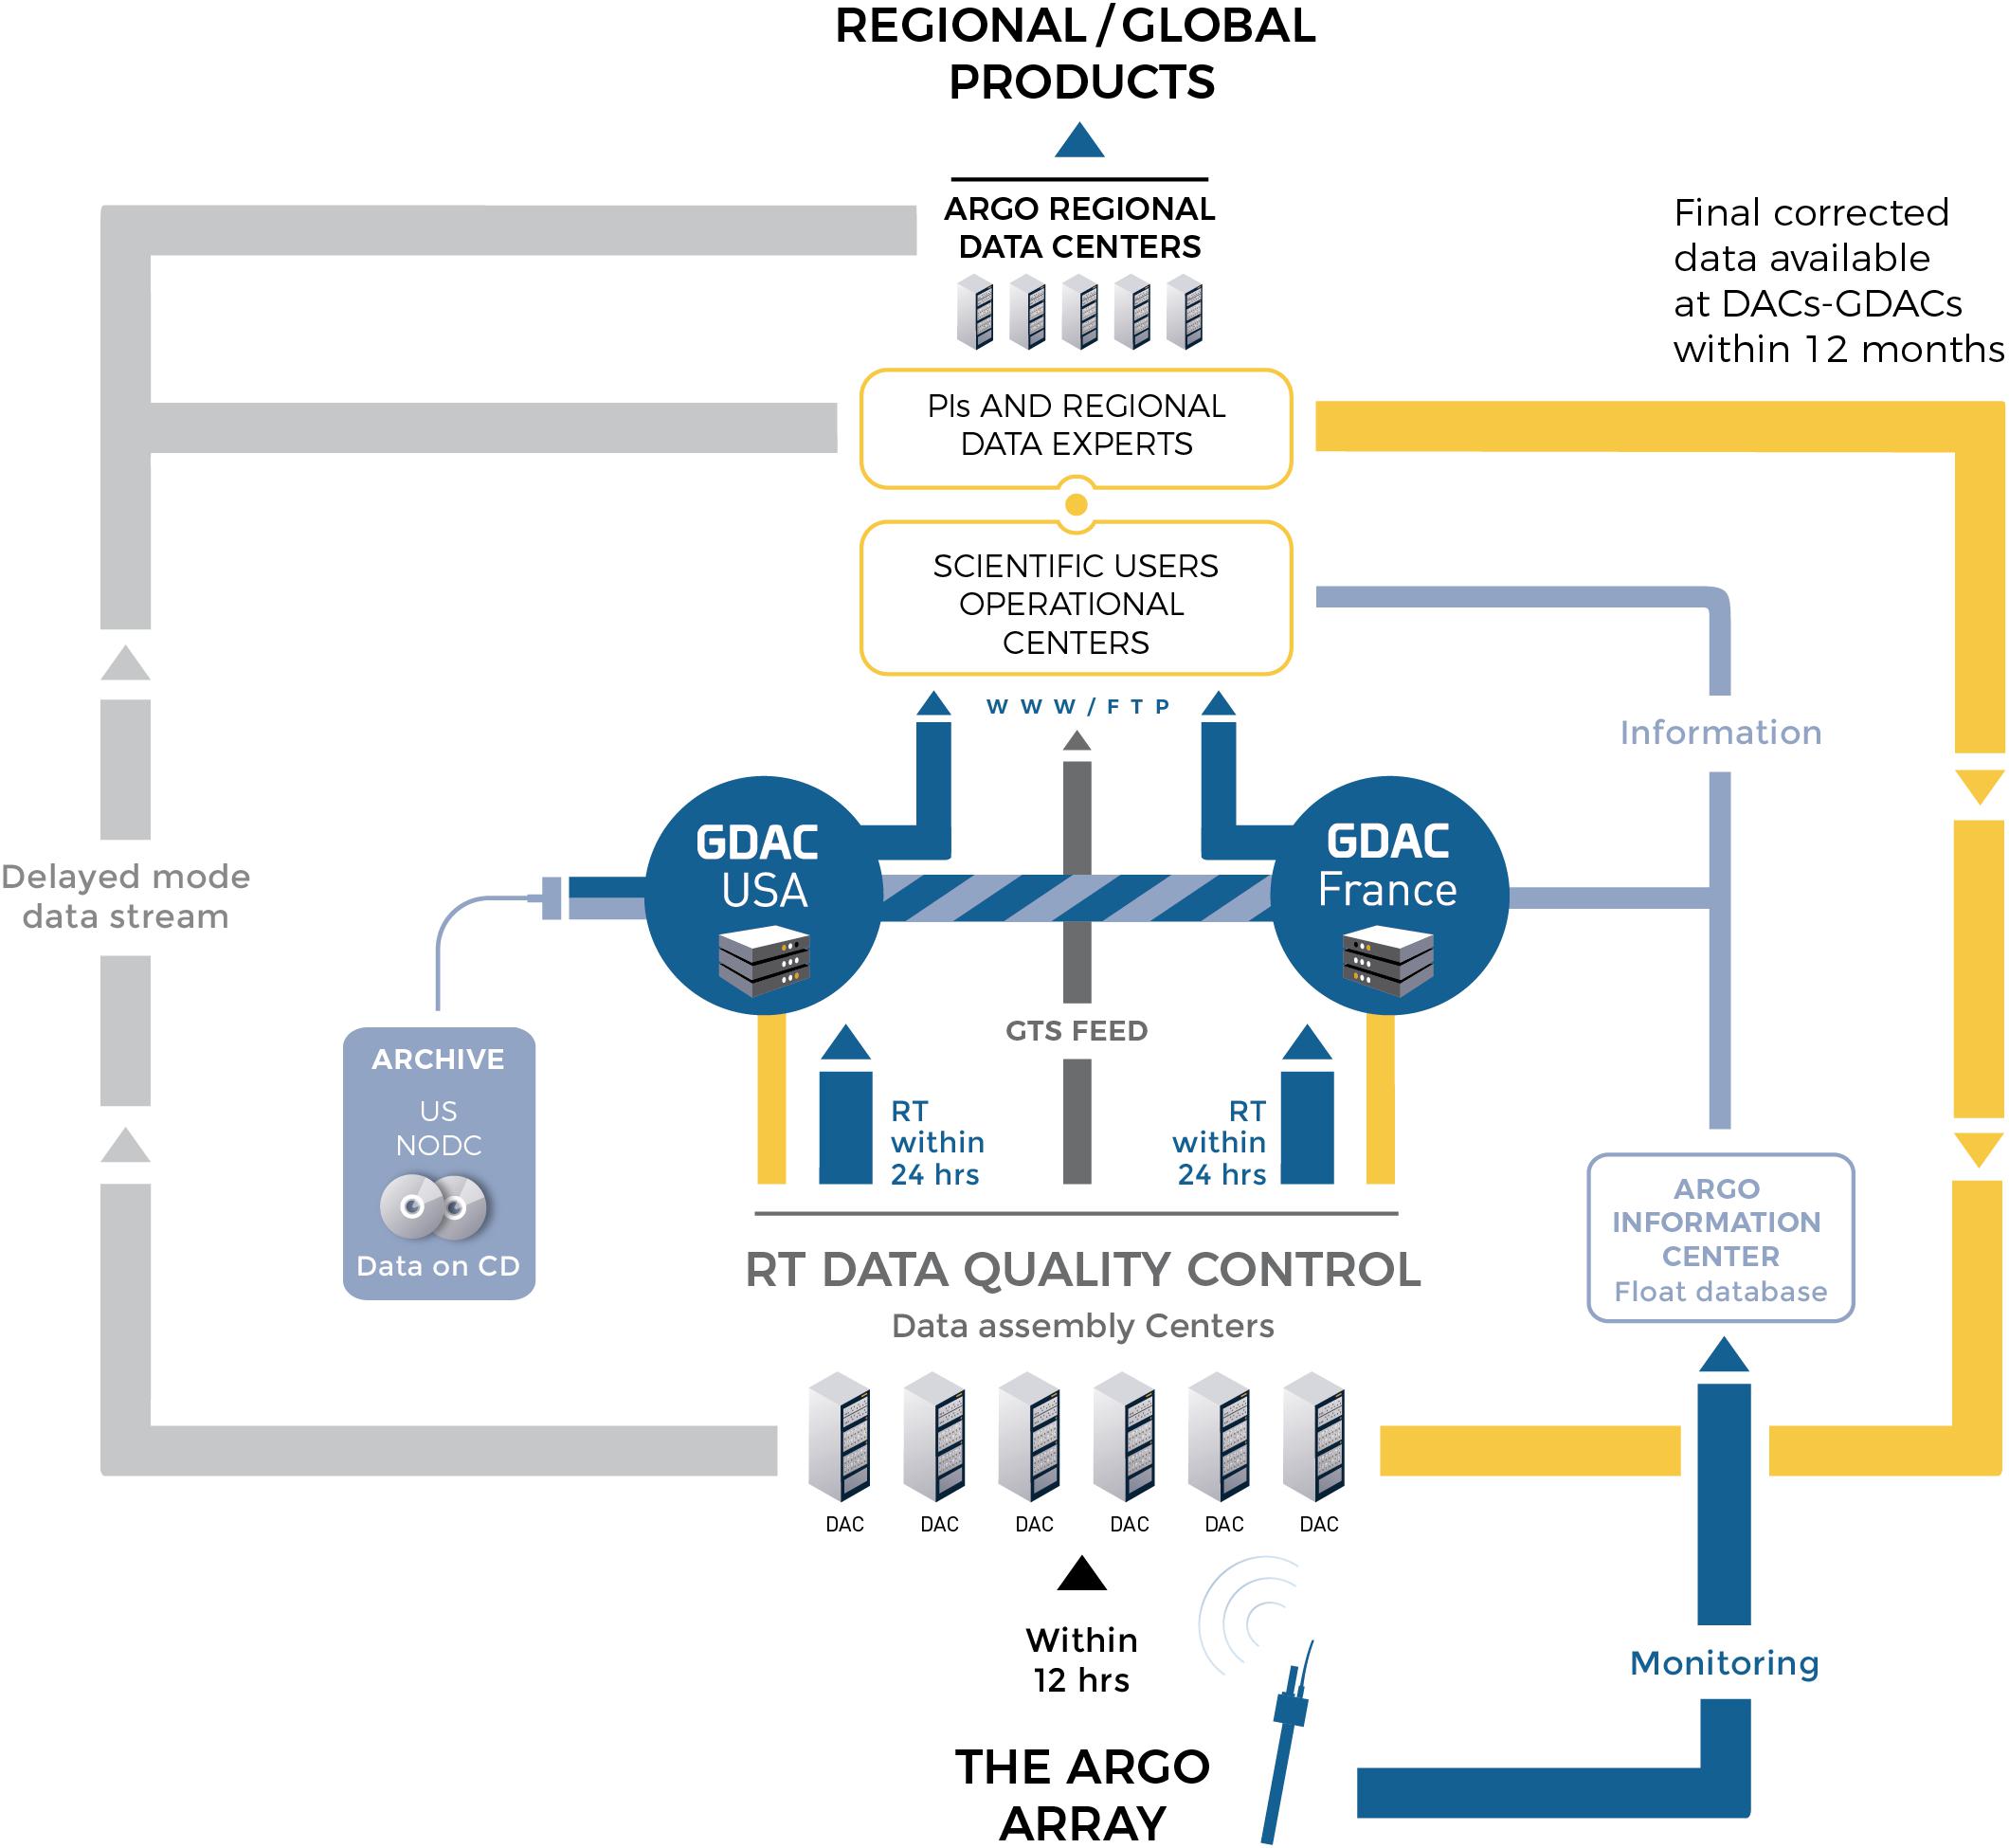
Figure 2. Pathways of Argo near-real time and delayed-mode data and meta data are illustrated, originating from the Argo array and being distributed to users via the GDACs. (Copyright: Euro-Argo ERIC, printed with permission).
To improve the quality of P/T/S variables between NRT and DM versions, a few tests have been developed to run on a regular basis (e.g., monthly, quarterly, etc.) on the GDAC data holdings. One of these is an objective analysis run monthly by Coriolis, where profiles that are inconsistent with neighbors are identified for further examination. Another is a quarterly comparison with satellite altimetry performed by CLS/France. When suspect profiles are identified, float owners and DACs are notified to make changes to data QC flags as needed.
The Argo Regional Centers (ARCs) perform a variety of tasks including coordinating float deployments, consistency checks on delayed mode quality control, finding additional reference data for delayed mode work, adopting floats for delayed mode quality control, and producing Argo data products.
While the complete data management chain (Figure 2) has been developed for the core mission (P/T/S, 0–2000 dbar), the extensions to Deep Argo and BGC Argo are under development to form an integrated Argo Data Management System.
ArgoMix
Here a new enhancement is suggested for possible future inclusion in Argo, consisting of direct shear and scalar microstructure (turbulence) measurements for both the upper and deep ocean. The rationale is provided by recent scientific and technical developments. Microstructure measurements are not presently part of Argo but are presented as an example of how new experimental measurements on profiling floats can progress toward inclusion in the global array. This process, begins with limited deployment outside of Argo to demonstrate value and capabilities.
Turbulent mixing in the ocean is important because (1) it contributes to the transport and distributions of heat, freshwater, dissolved gasses, and pollutants, (2) it impacts biological processes by determining the flow field for the smallest plankton and setting large-scale gradients of nutrient availability, and (3) societally-valuable predictions from numerical models of quantities such as temperature and sea level depend sensitively on the geography of ocean mixing rates. Despite its importance, observations of ocean turbulence are extremely sparse, particularly in the deep ocean. Imprints of turbulent transport processes on the large scale ocean state, as readily observed by Core Argo, allow for inversion of diffusivity maps but direct mixing measurements are needed to further constrain inverse estimates (Forget et al., 2015).
Ocean turbulence is of leading order importance in determining the variability of many of the 11 physics-based GCOS “essential ocean variables” (EOVs). For example, turbulence determines the divergence of surface buoyancy fluxes across the surface mixed layer. On larger scales the flux of constituents (e.g., heat or salt) enhanced by turbulence are critical to understanding weather and climate. At present, physics-based EOVs include the surface and subsurface values of ocean currents (u,v), temperature (T) and salinity (S). At any subsurface location, these three EOVs vary in accordance to the Navier-Stokes equations, but thermodynamically they vary solely with the vertical (or diapycnal) divergences of turbulence-enhanced fluxes of momentum, heat, and salt. The physics-based EOVs also include the fluxes of momentum (wind stress) and heat at the sea surface. These fluxes provide surface inputs but do not quantify internal redistributions and so cannot define changes in u or T. However, fluxes of heat and momentum can now be reliably assessed using direct shear and scalar microstructure turbulence measurements (Pujiana et al., 2018) as witnessed by flux measurements that asymptote to and vary with independently-measured surface values (Figure 3).
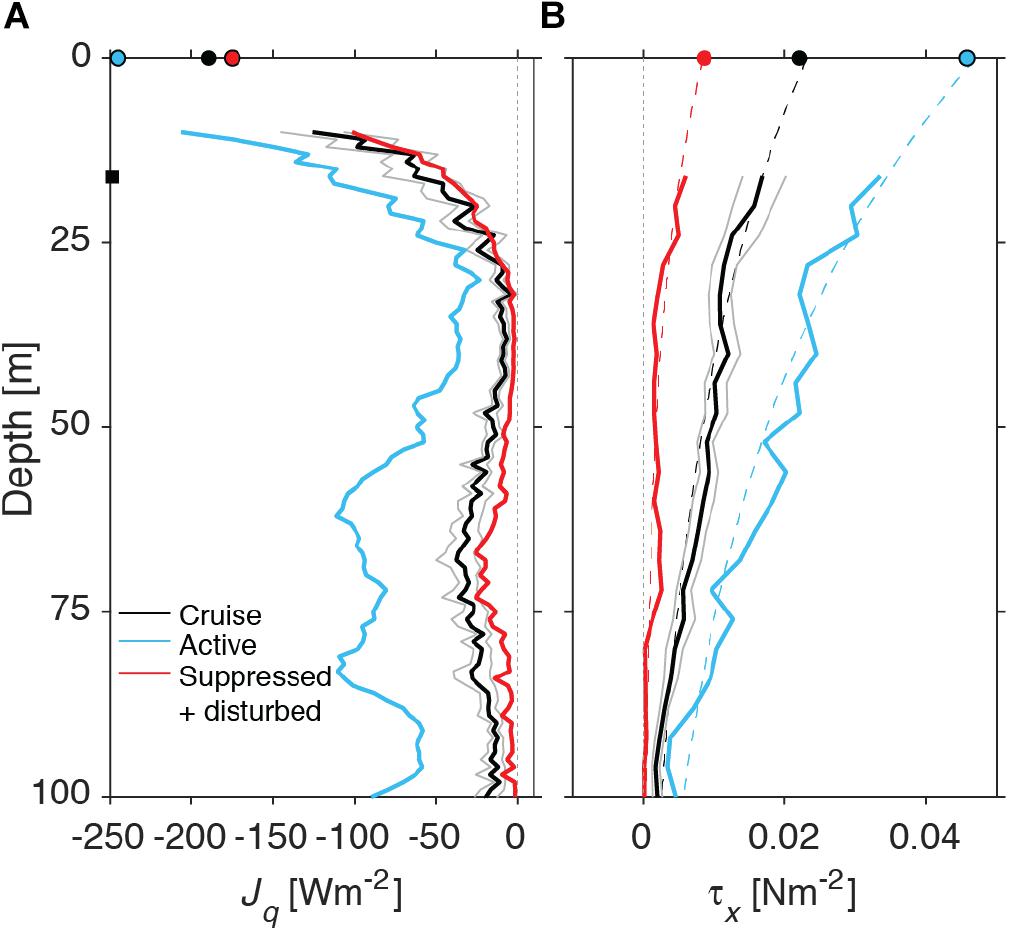
Figure 3. Quantitative demonstration of turbulence fluxes assessed from turbulence profiling. Vertical profiles of the turbulent fluxes of heat (A) and momentum (B) derived from turbulence profiling measurements akin to those proposed for ArgoMix. In the legend, “active” refers to strong surface forcing; “suppressed” to weak surface forcing. Surface values of the fluxes are indicated by the dots at depth = 0. Measurements are from the equatorial Indian Ocean before (red) and during (blue) the passage of westerly wind bursts of the MJO. Subsurface fluxes co-vary with the forcing and asymptote to surface values, as they must [Source: adapted from Pujiana et al., 2018, Copyright 2018 American Meteorological Society (AMS). Reprinted with permission].
Recent work suggests considerable temporal and spatial inhomogeneity in near-surface and deep-ocean mixing. Moored mixing time series in the upper few 100 m (Moum et al., 2009, 2013) have, for example, identified the importance of subsurface turbulence fluxes in setting the annual cycle of tropical sea surface temperature (SST), and shown variability on long time scales that include ENSO. Furthermore, mixing measurements in the deep ocean (Alford et al., 2011) show intense intermittency, indicating a need for sustained global measurements through the full water column.
The importance of small scale mixing to prediction of global scale circulation, including how this might be quantified, was a focus of the recent Climate Process Team on Ocean Mixing (MacKinnon et al., 2017). In particular, global distributions of mixing (Whalen et al., 2012, 2015; Waterhouse et al., 2014) based on indirect fine-scale parameterizations and internal wave models (Gregg, 1989; Olbers and Eden, 2013; Polzin et al., 2014; Pollman et al., 2017) represent a new paradigm against which to test theory and models, and to target new process experiments. However, the underlying assumptions of these methods are uncertain and may be most suspect where the inferred turbulence is greatest. While the fine-scale parameterizations tend to agree with direct measurements to within a factor of two in the ocean interior, a significantly higher standard is required to understand turbulent flux divergences that govern evolution of EOVs. The assumptions in these methods are known to be violated near boundaries, with differences between parameterizations and direct measurements of up to a factor of 10 (Waterman et al., 2014). In addition to the diapycnal fluxes, direct microstructure measurements can also allow assessment of isopycnal stirring and its underpinning dynamics (Ferrari and Polzin, 2005; Naveira Garabato et al., 2015).
Direct measurements on both Argo and Deep Argo floats are now feasible, owing to recent advances in turbulence sensing technology that have reduced the cost, communications bandwidth, and power requirements. Recent technological advances in inexpensive and low-power circuitry, increased battery capacity and data storage density have led to an ability to make long-term continuous measurements of mixing from oceanographic moorings (Moum and Nash, 2009) and profiling instruments (Sherman and Davis, 1995; Nagai et al., 2015; Goto et al., 2016, 2018; Lucas et al., 2016; Shroyer et al., 2016). These systems have been tested quantitatively via inter-platform comparisons (Perlin and Moum, 2012; Pujiana et al., 2018) and schemes to compress data for satellite transmission have been developed (Becherer and Moum, 2017). These are key technical ingredients for successful implementation of mixing measurements on the Argo fleet.
Roughly a dozen moored mixing measurements are now distributed around ocean basins, permitting important but highly limited geographic comparisons. While this effort has been an exciting development, these measurements cannot address problems associated with widespread geographical variations in mixing, deep thermocline and abyssal mixing, or variability away from the moorings. Existing monitoring efforts specifically do not address mixing variability at Argo resolution, as seen in sparse but highly variable deep microstructure observations (Figure 4; Waterhouse et al., 2014).
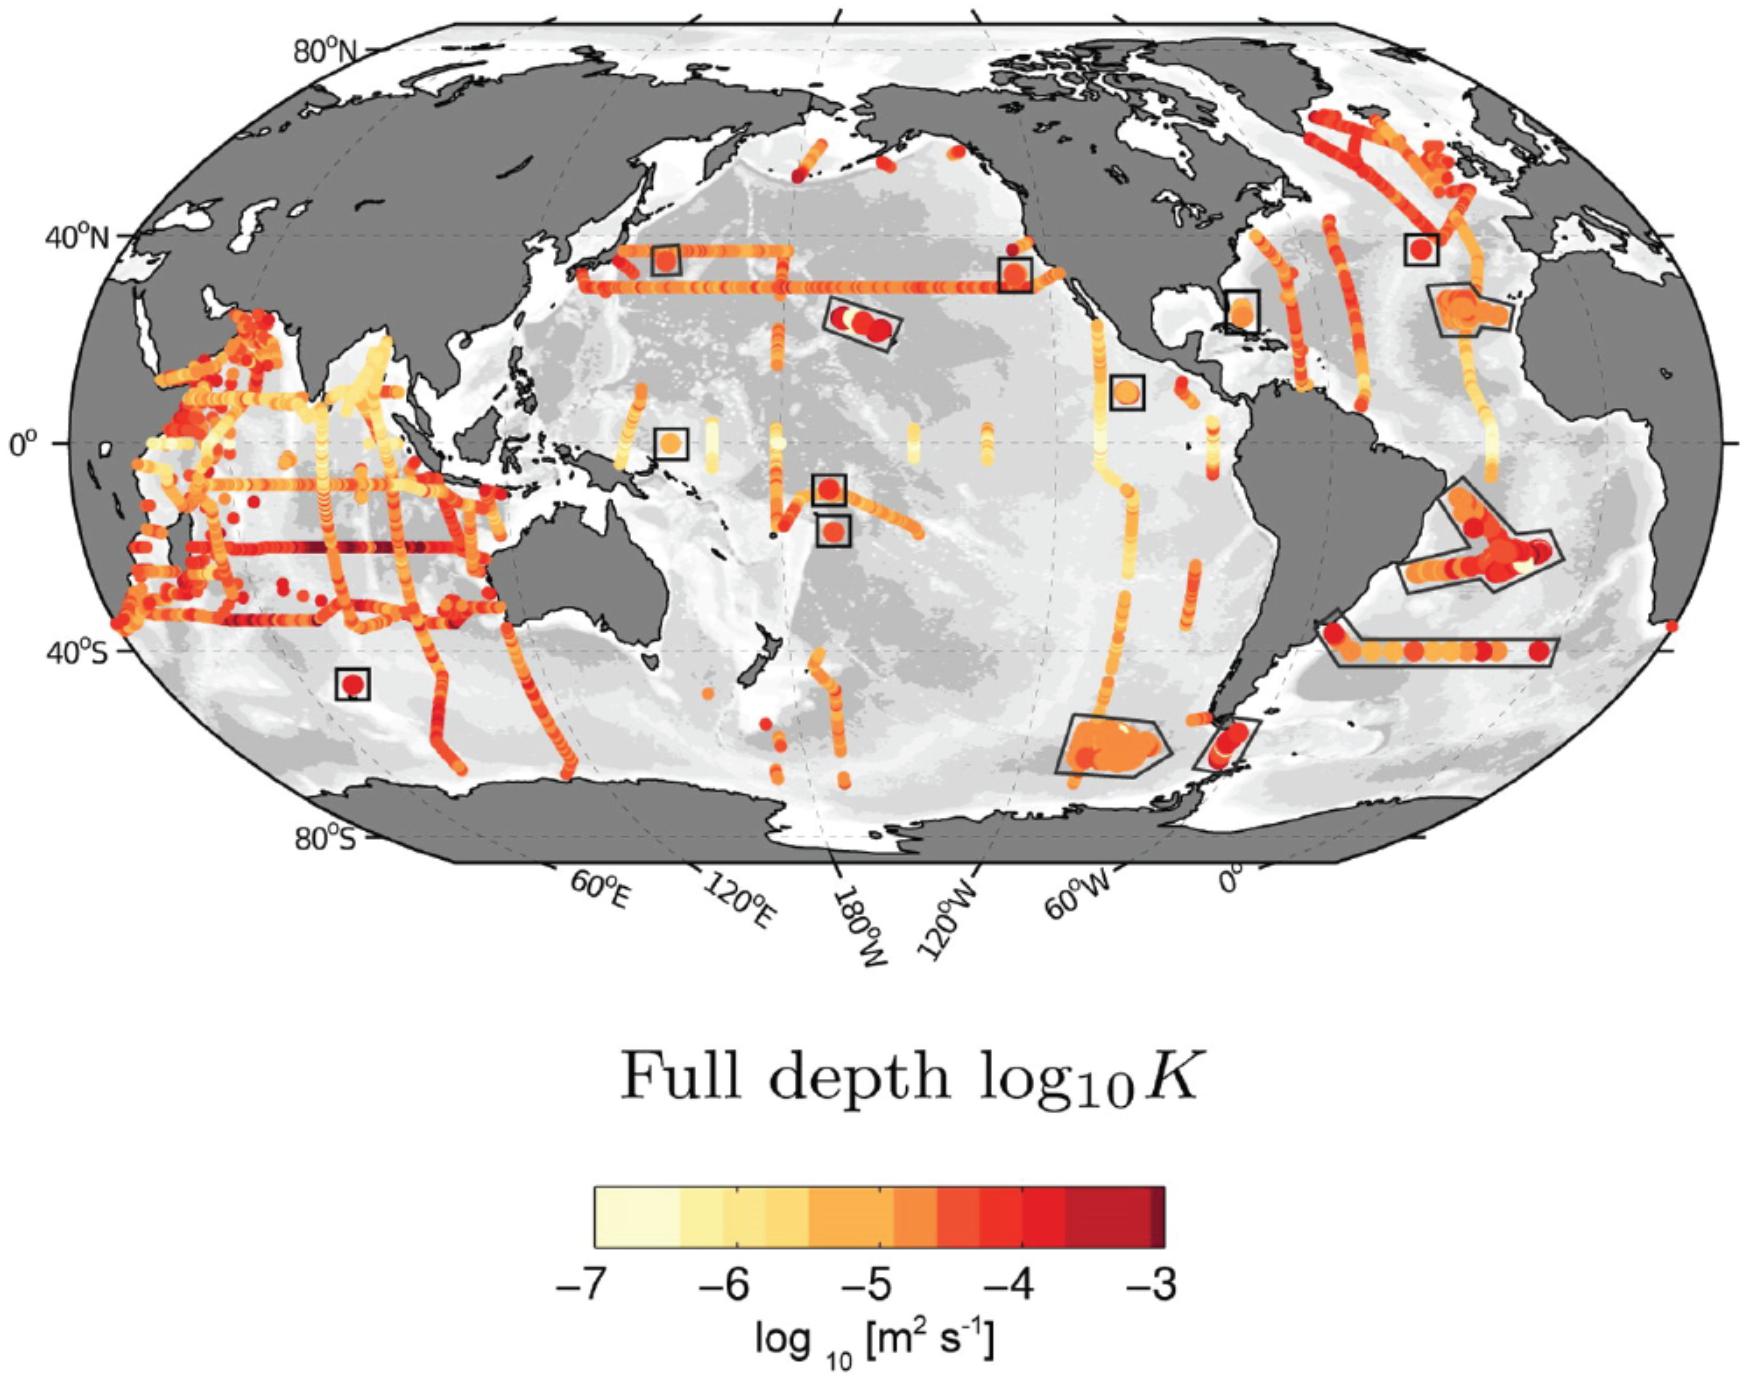
Figure 4. Depth-averaged diffusivity from the surface to the bottom from all existing full-depth microstructure observations as of Waterhouse et al. (2014). [Source: Waterhouse et al., 2014, Copyright 2014 American Meteorological Society (AMS). Reprinted with permission].
The Present Status, Problems, and Strengths
Core Argo
The number of floats reporting Core Argo parameters increased rapidly from 1999 until it reached 3000 during 2007, and has increased slowly over the last 10 years to its present number of 4000 (Figure 5). Recent increases reflect floats deployed in previously unsampled regions and regions of higher than standard sampling density. More than 90% of measurements made on Argo floats are available within Argo’s 24 h target (see section “Argo Data Management” under the section “The Present Status, Problems, and Strengths”), and all are freely distributed.
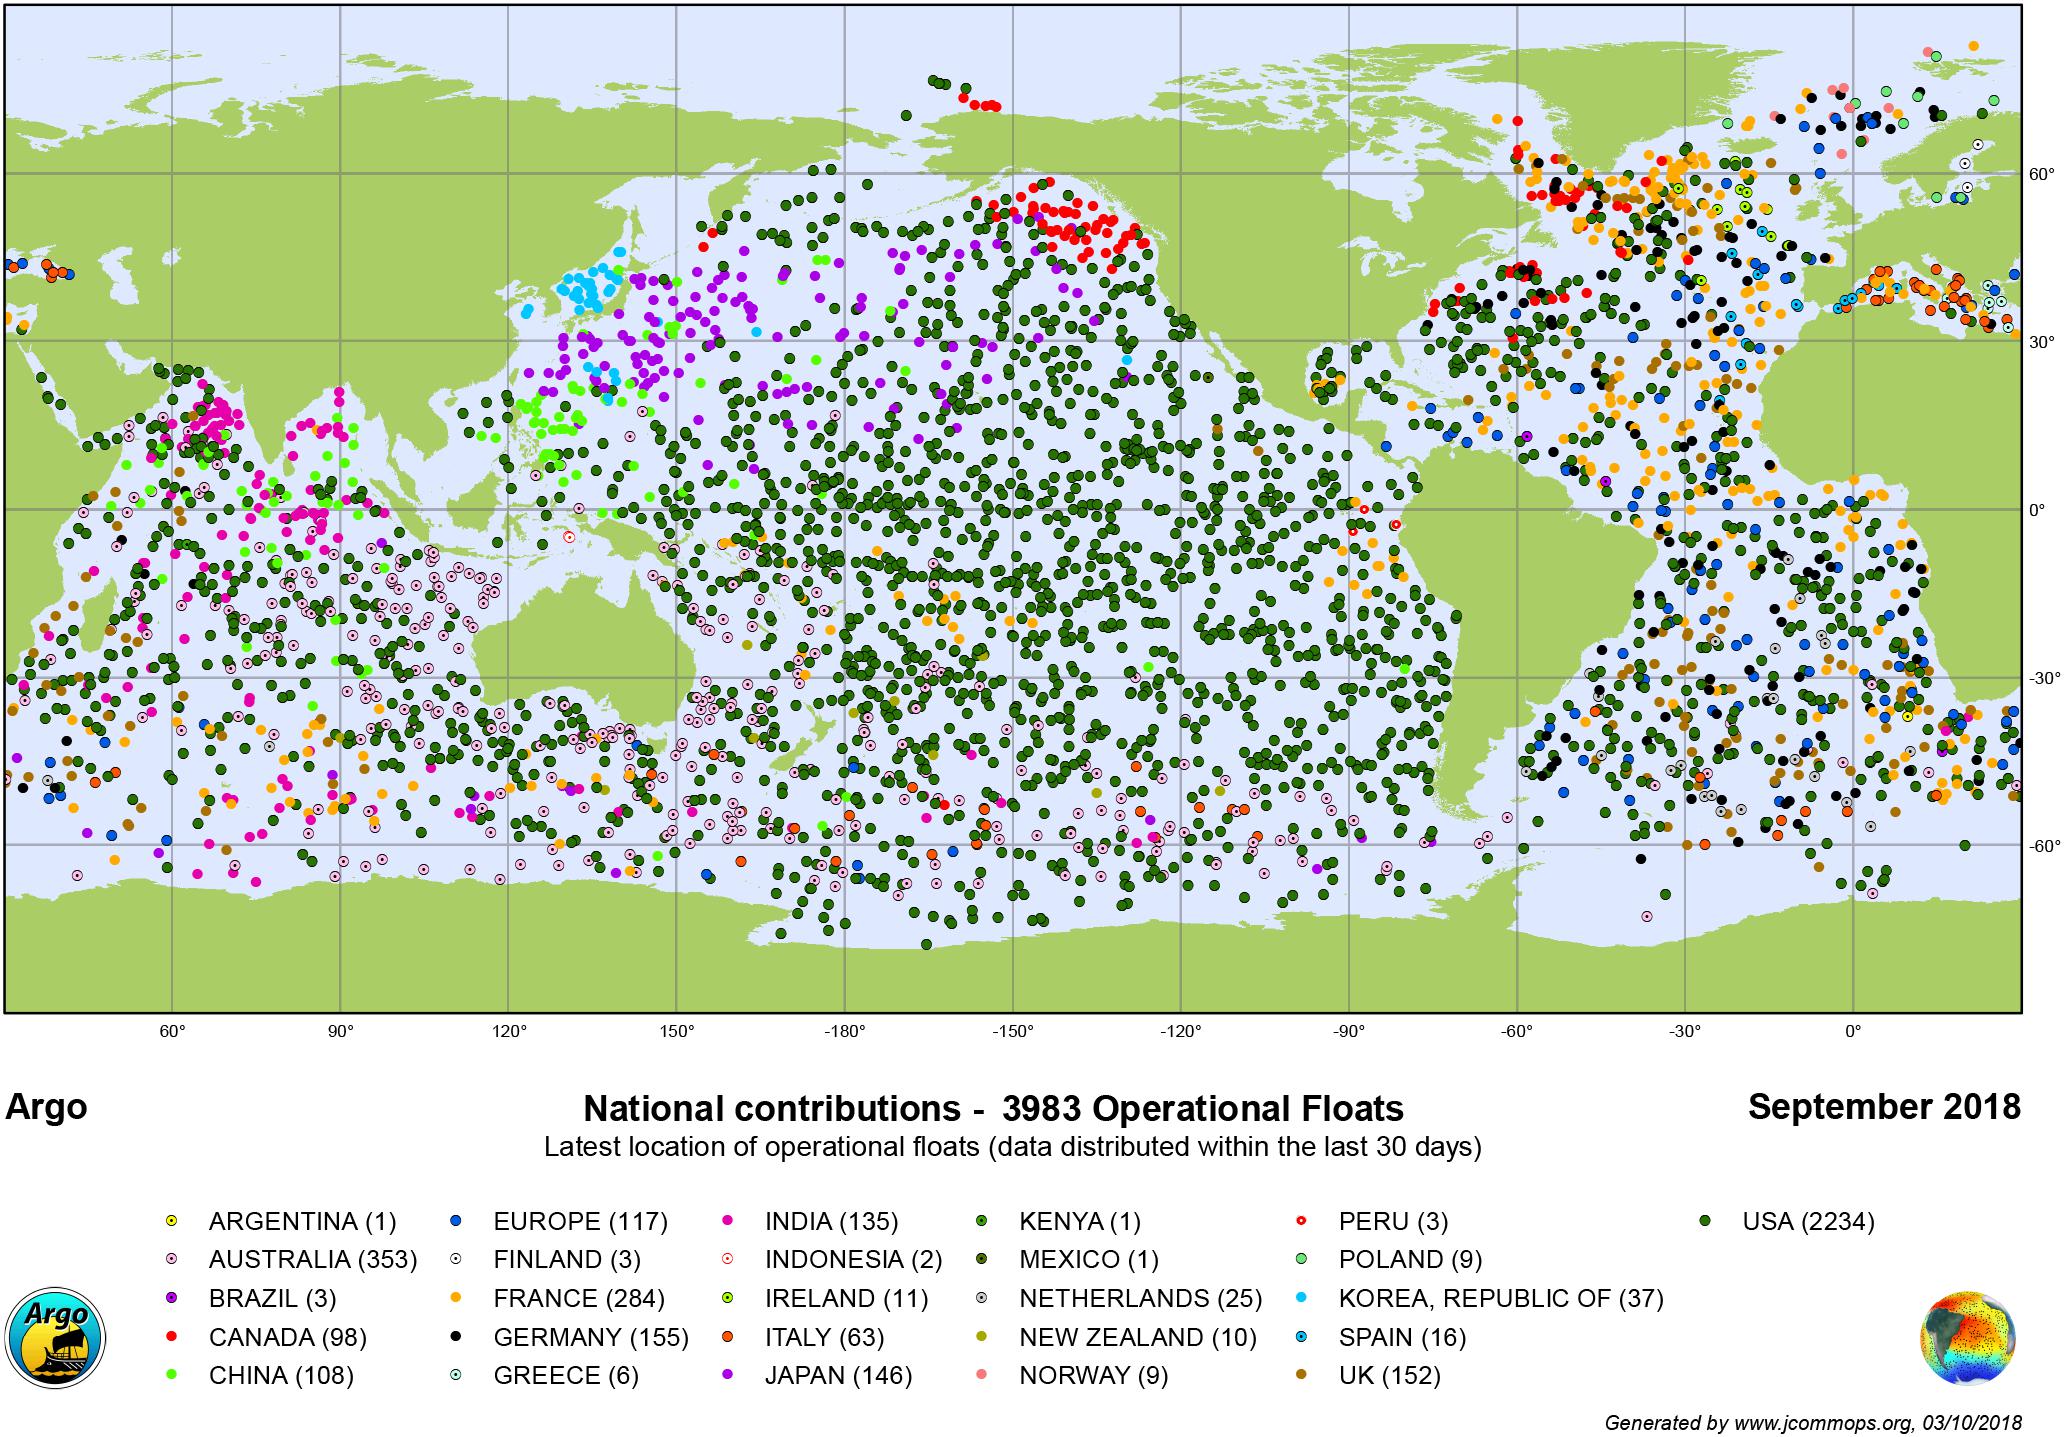
Figure 5. Global map of operational Core Argo floats, by nation, in September 2018 (Source: JCOMMOPS).
Core Argo has a mature leadership model, with Steering and Data Management Teams that meet annually in plenary, and with vigorous inter-sessional activity. These meetings are supplemented with workshops on technical aspects as required, such as hardware engineering, sensor development, and data quality control. Argo leadership has a strong corporate memory, which ensures the stability of the program. Argo regularly audits the performance of the array so that systematic problems can be identified before they seriously degrade the data.
Argo data acquisition is distributed across 25 national programs (Figure 5). The procedures for delivery of data in NRT and DM (see section “Argo Data Management” under the section “The Present Status, Problems, and Strengths”) are comprehensively described in public documents. This ensures a global dataset of consistent quality and uniform format ready for public use. Reliability of data does not depend on the originating national program or investigator.
Since 2013, Argo has undertaken a major revision of its data format in order to incorporate data from biogeochemical sensors and other auxiliary measurements. This includes improving the quality of meta data to enable more detailed array audits. This additional complexity (see section “Argo Data Management” under the section “The Present Status, Problems, and Strengths”), while essential, has placed a burden on the data system and has diverted effort from DMQC of the core physical parameters.
The greatest challenge facing Core Argo is simply to sustain the global array, especially in remote southern hemisphere regions, in the face of limited budgets. In order to maximize the number of active floats for a given rate of deployment, vigorous attention is being given to improving float and sensor lifetimes and identifying deployment opportunities. A float technical workshop in 2017 identified differences of float longevity between groups using the same hardware. Differences were noted in ‘acceptance testing’ when floats are delivered by manufacturers and ‘final pre-deployment testing’ at port of departure. Post-delivery test protocols are being devised to minimize the number of floats and sensors that fail before battery energy is fully utilized.
Technical issues presently under scrutiny include management of lithium batteries for efficient energy utilization, and stability of sensors, especially conductivity (and hence salinity) and pressure. Recent analysis has shown batches of floats in which the salinity reported by the float drifts toward higher than true values. The bias can exceed 0.03 in salinity. Salinity drift is estimated in DM by comparison with nearby measurements. The cause and mitigation of this new salinity drift is still under study. This issue highlights the need to exercise care in the use of NRT data, and the requirements for reference data from GO-SHIP and other programs, to ensure the long-term consistency of the Argo dataset.
While there have been many different designs of the hull and buoyancy engines on which sensors are deployed, Core Argo has depended almost exclusively on the SBE41 and SBE41CP CTDs by SeaBird Electronics (SBE). This has led to good consistency of data, and implementation of uniform procedures for data handling across the national programs, but exposes the program to the risk of single points of failure. Twice during Argo there has been a major problem with the supply of pressure sensors to SBE for use in float CTDs, resulting in lost deployment opportunities and impacting Argo coverage. To reduce this risk, the Steering Team welcomes initiatives to establish alternative sensor payloads. The Steering Team has set up a rigorous process of trial and evaluation to ensure that the Argo dataset remains of consistent quality if and when alternative CTD sensors are introduced.
BGC Argo
The BGC-Argo network presently relies on research-based projects operated by individuals or institutions. Globally, these regional pilot programs operate as a collective resource of 335 floats carrying BGC sensors that can be accessed through the Argo data system (Figure 6). With a goal of 1000 floats equipped with the six core BGC sensors, system status ranges from nearly 30% complete for oxygen to only 8% complete for pH and irradiance (Figure 6). About 10% of the floats in the BGC array carry 5 of the six core sensors, but few research programs have merged all six on one float. Moving from a 30% complete oxygen array to a 30% complete array with all six sensors will be a critical step in BGC-Argo development, as key synergies arise when all six core sensors are deployed on a single float.
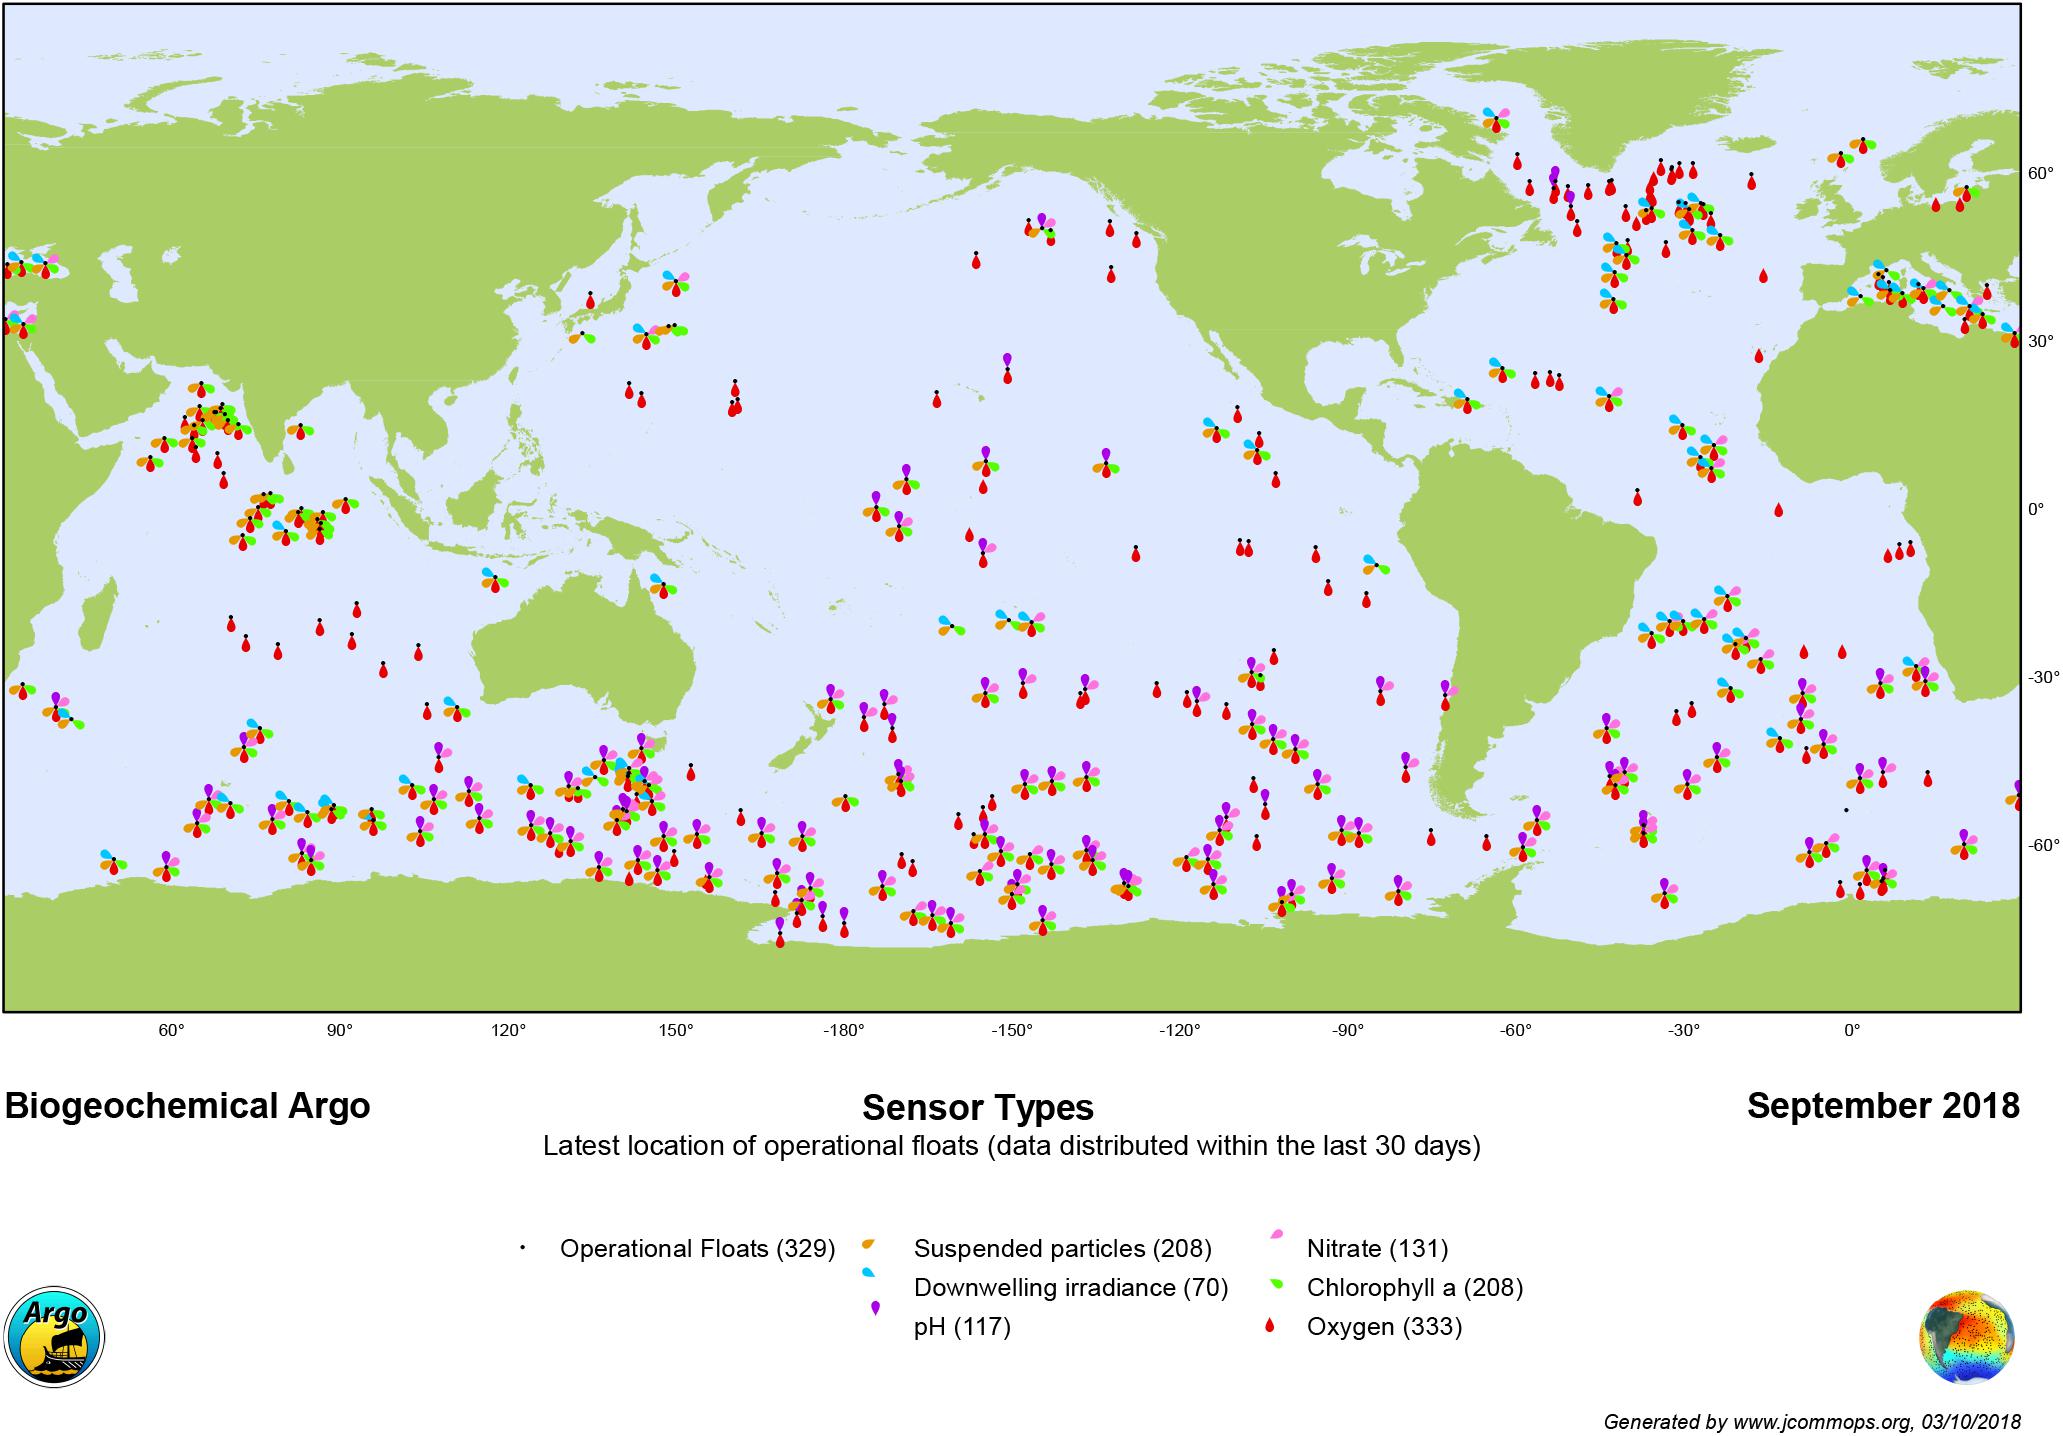
Figure 6. Global map of BGC-Argo floats, indicating sensor types on each float, as of September 2018 (Source: JCOMMOPS).
BGC-Argo is the first program with the capability to monitor biogeochemical processes globally, under seasonal sea-ice, throughout the year, and across all weather conditions. This allows BGC-Argo to access processes and timescales that cannot be observed from oceanographic cruises. It will revolutionize understanding of ocean biogeochemistry and marine resources, including fisheries, providing the foundation for informed ocean management. This strength results in particular from the cost-effectiveness of such robotic measurements, which lower the cost of a vertical profile by more than an order of magnitude compared to classical techniques of data acquisition. The consistency of the data collected and processed in this manner enable global assessments based on the entire data set. In some cases, analyses of these consistent datasets (Poteau et al., 2017) have identified sensor calibration issues at the manufacturer level (Barnard and Koegle, 2018). The accessibility of BGC-Argo global datasets has allowed the measurements of Chla (Roesler et al., 2017) and optical backscatter (Poteau et al., 2017) to be reprocessed, producing an even more valuable product.
Deep Argo
Four models of Deep Argo floats have been developed and are currently in use. The Deep Arvor (Le Reste et al., 2016) and the Deep NINJA (Kobayashi, 2013) floats measure P/T/S, from the surface to 4000 dbar. The Deep SOLO and the Deep APEX record P/T/S to 6000 dbar (Zilberman, 2017). Two CTD models developed by Sea-Bird, the 6000 dbar SBE-61 CTD and the 4000 dbar SBE-41 CTD, were implemented on Deep Argo floats, and a 6000 dbar CTD from RBR is currently being tested. In addition, dissolved oxygen (DO) sensors have been mounted on most 4000 dbar floats (Figure 7). All Deep Argo floats have the ability to provide NRT P/T/S measurements during the float ascent to the surface. Deep Argo floats were designed originally to achieve 180 cycles to 6000 dbar; the migration to hybrid lithium batteries increases the Deep SOLO battery lifetime substantially above 200 cycles.
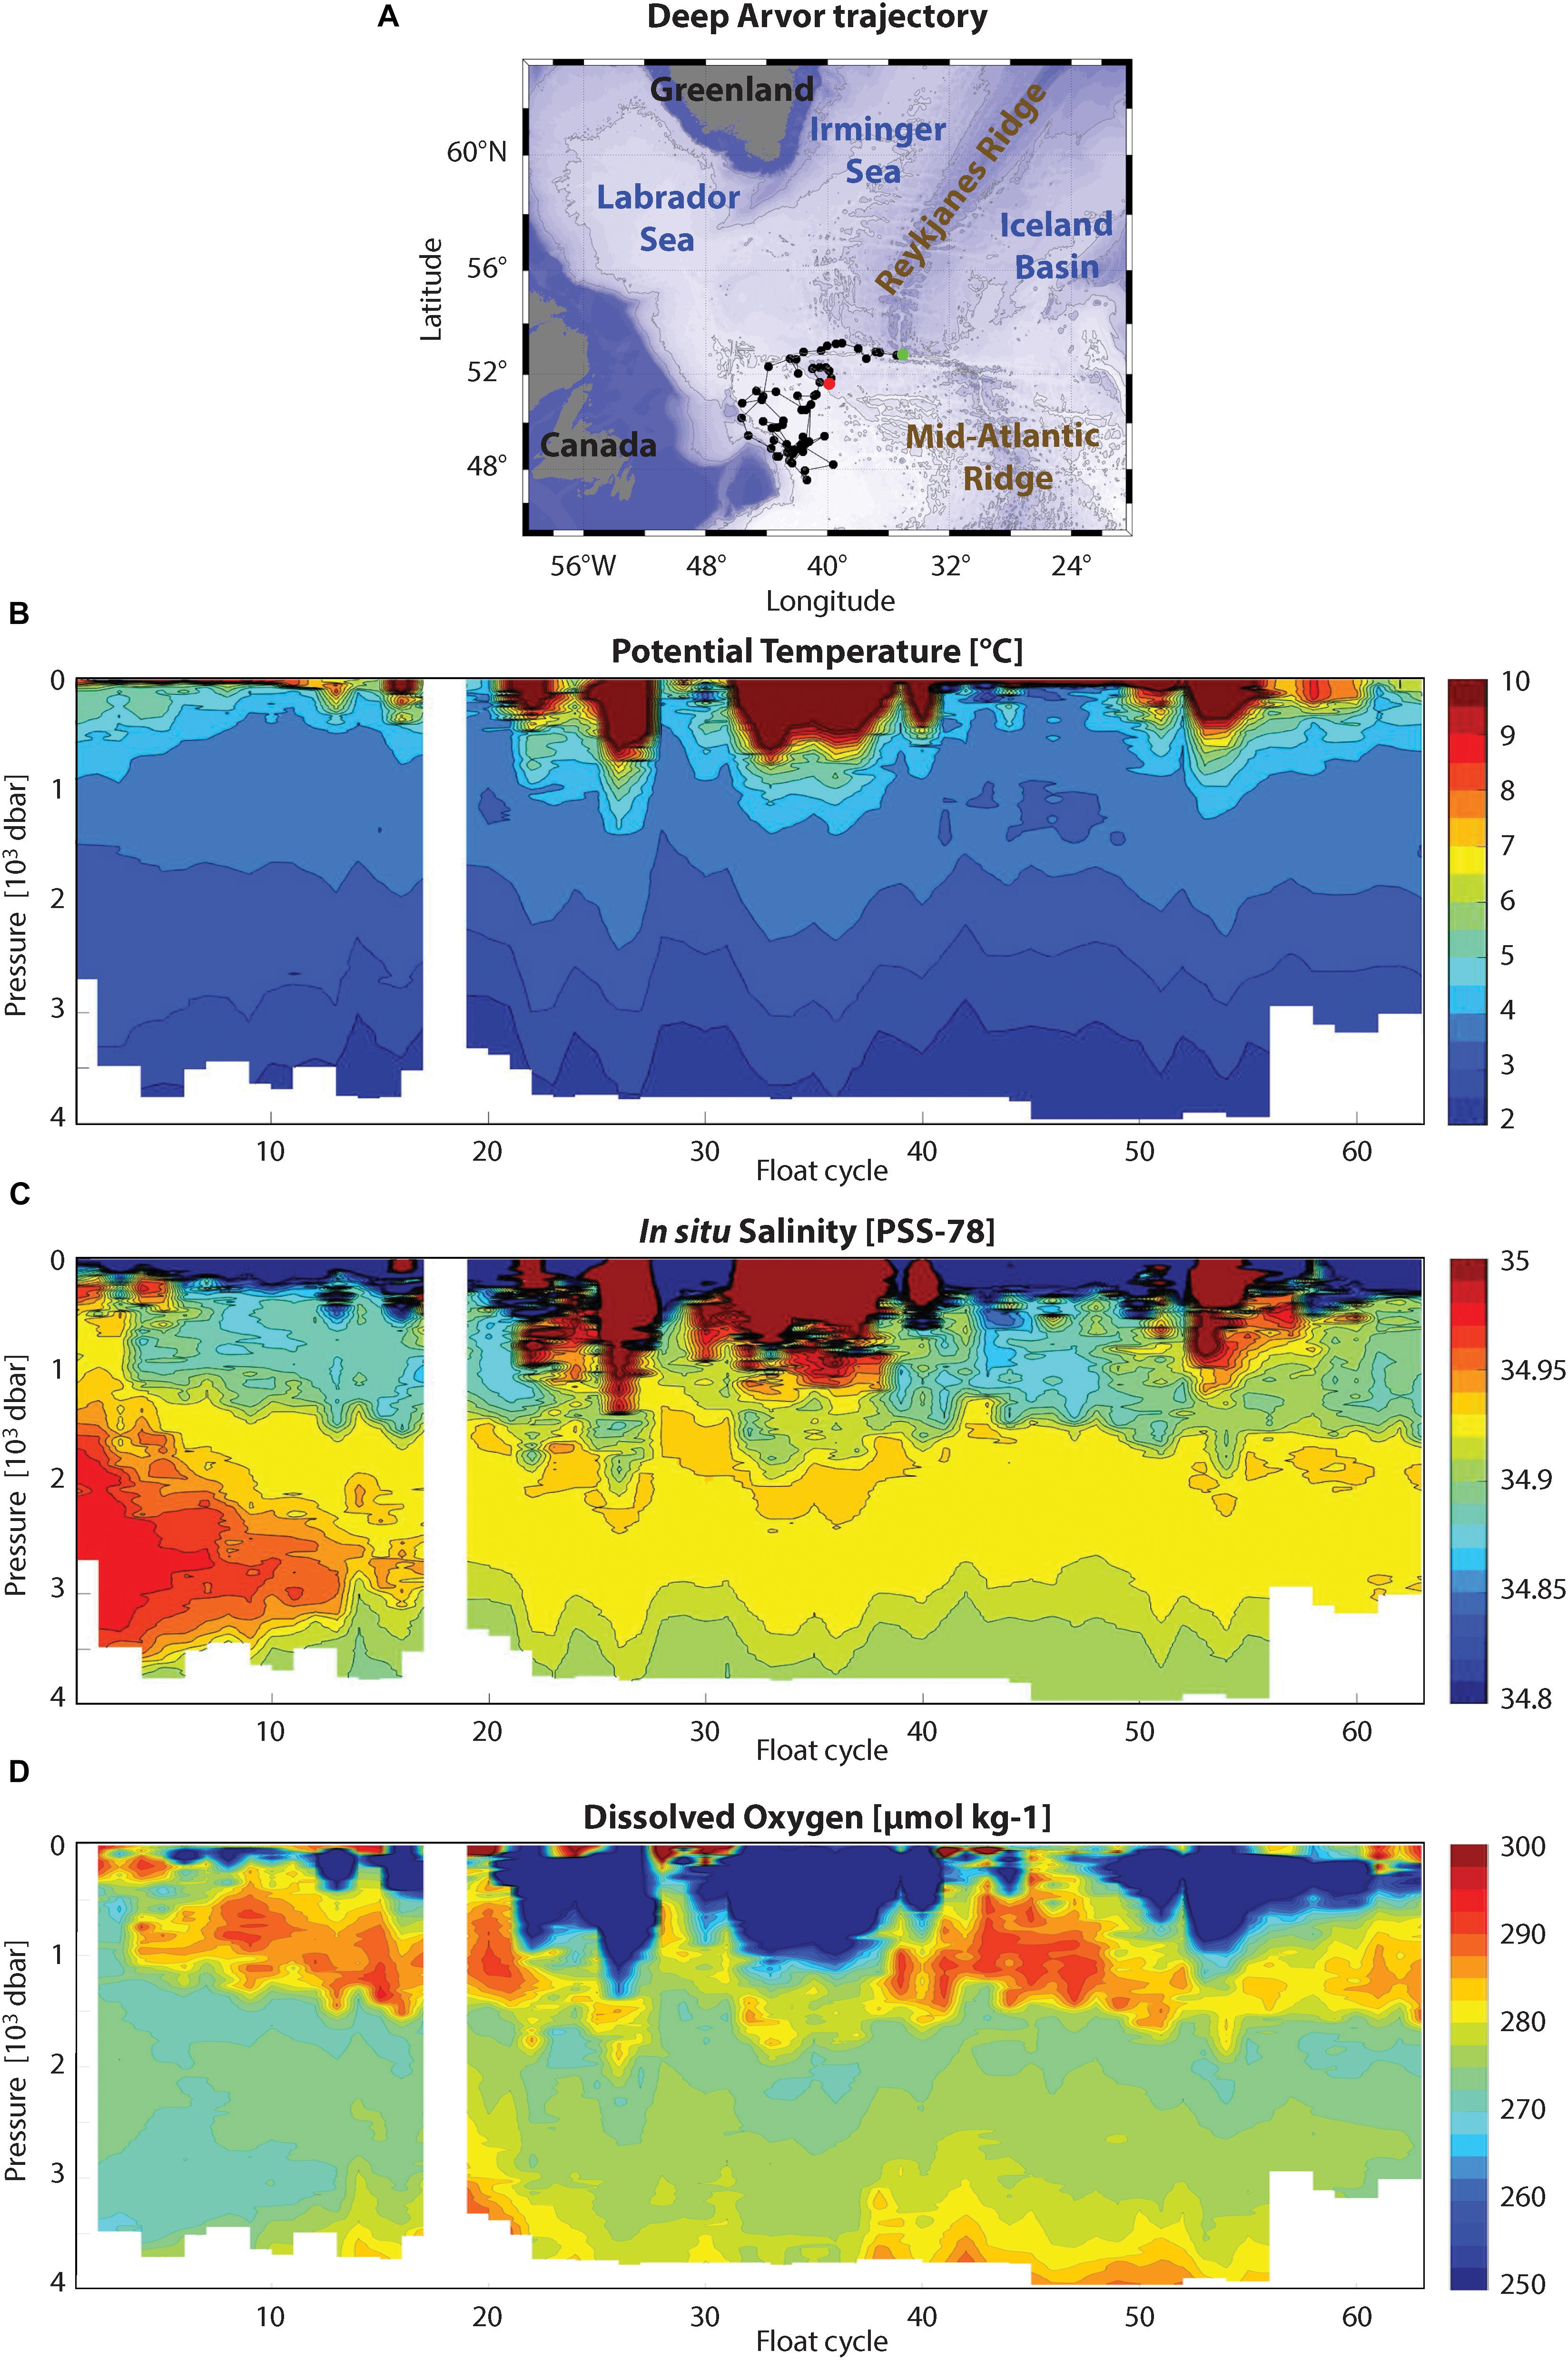
Figure 7. (A) Trajectory of a Deep Arvor float (WMO ID 6901758) deployed in the North Atlantic Basin between July 2015 and March 2017. Locations of float deployment (rounded green symbol) and last observation (rounded red symbol) are indicated. (B) Potential temperature, (C) In situ salinity, and (D) Dissolved oxygen (DO) measurements from the Deep Arvor float between July 2015 and March 2017.
The trajectory uncertainty at parking depth, resulting from the vertical shear during the float ascent and descent, is higher for Deep Argo dives than for Core Argo. As for Core Argo, the position uncertainty in Deep Argo float trajectories is highest in sea-ice covered areas, where estimated float positions are interpolated based on ice-free surface fixes that can be months apart.
Current challenges are to improve the accuracy and increase the long-term stability of the Deep Argo conductivity and pressure sensors. Target accuracies of Deep Argo P/T/S are ± 3 dbar, 0.001°C, and 0.002 PSS-78, similar to GO-SHIP standards (Hood et al., 2010). Comparisons of shipboard rosette-mounted SBE-61 CTDs with shipboard (SBE-911) CTD observations, show P/T/S uncertainties of ±4.5 dbar, ±0.001°C, and ±0.005 PSS-78. Observations from SBE-61 CTDs mounted on Deep SOLO floats show a similar spread in salinity when compared with reference data (Figure 8). Efforts will continue to improve the performance of the Deep Argo CTD models to the accuracy levels envisioned by the Deep Argo community. Float recovery can be used to achieve CTD recalibration in regions with limited reference data.
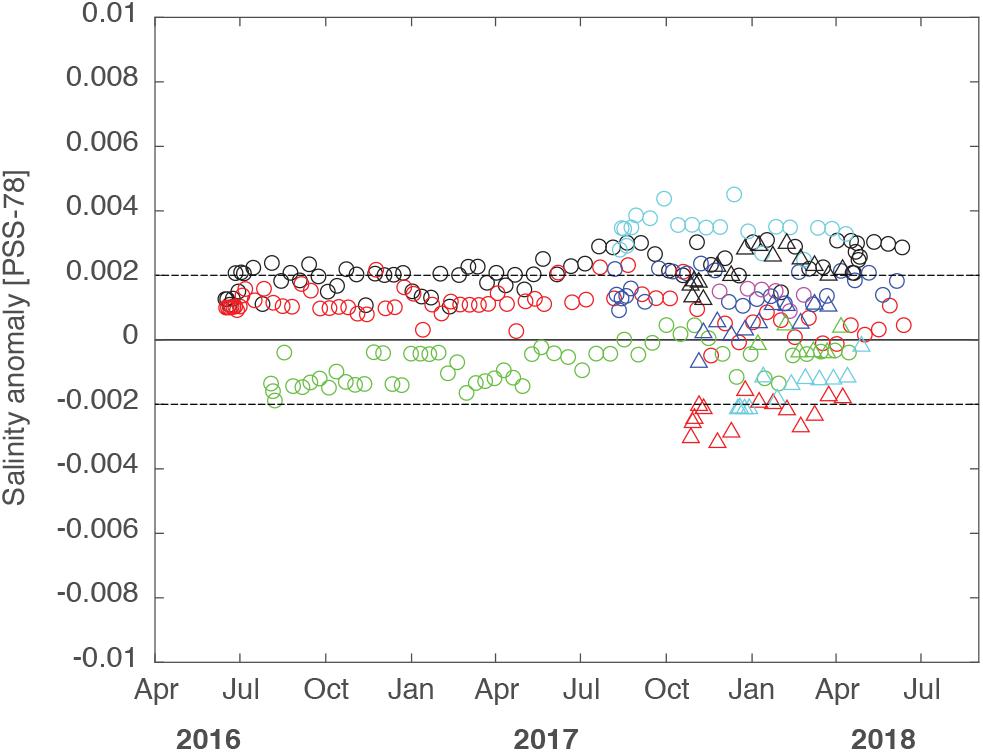
Figure 8. Salinity difference between Deep SOLO SBE-61 CTDs and ship-based hydrographic data interpolated at Deep SOLO float location, projected on 0.74°C potential temperature surface. CTD measurements are for 11 Deep SOLO floats deployed in the Southwest Pacific Basin (WMO ID numbers 5902456, 5902457, 5902478, 5902528, 5902529, 5905161, 5905162, 5905163, 5905164, 5905234, 5905235).
Regional Deep Argo pilot arrays have been established in deep areas of the South Pacific, South Indian, and North Atlantic Ocean, with plans underway for deployments in the South Atlantic, to demonstrate the technology readiness and scientific potential of the Deep Argo Program. There were 69 Deep Argo floats active as of September 2018 (Figure 9).
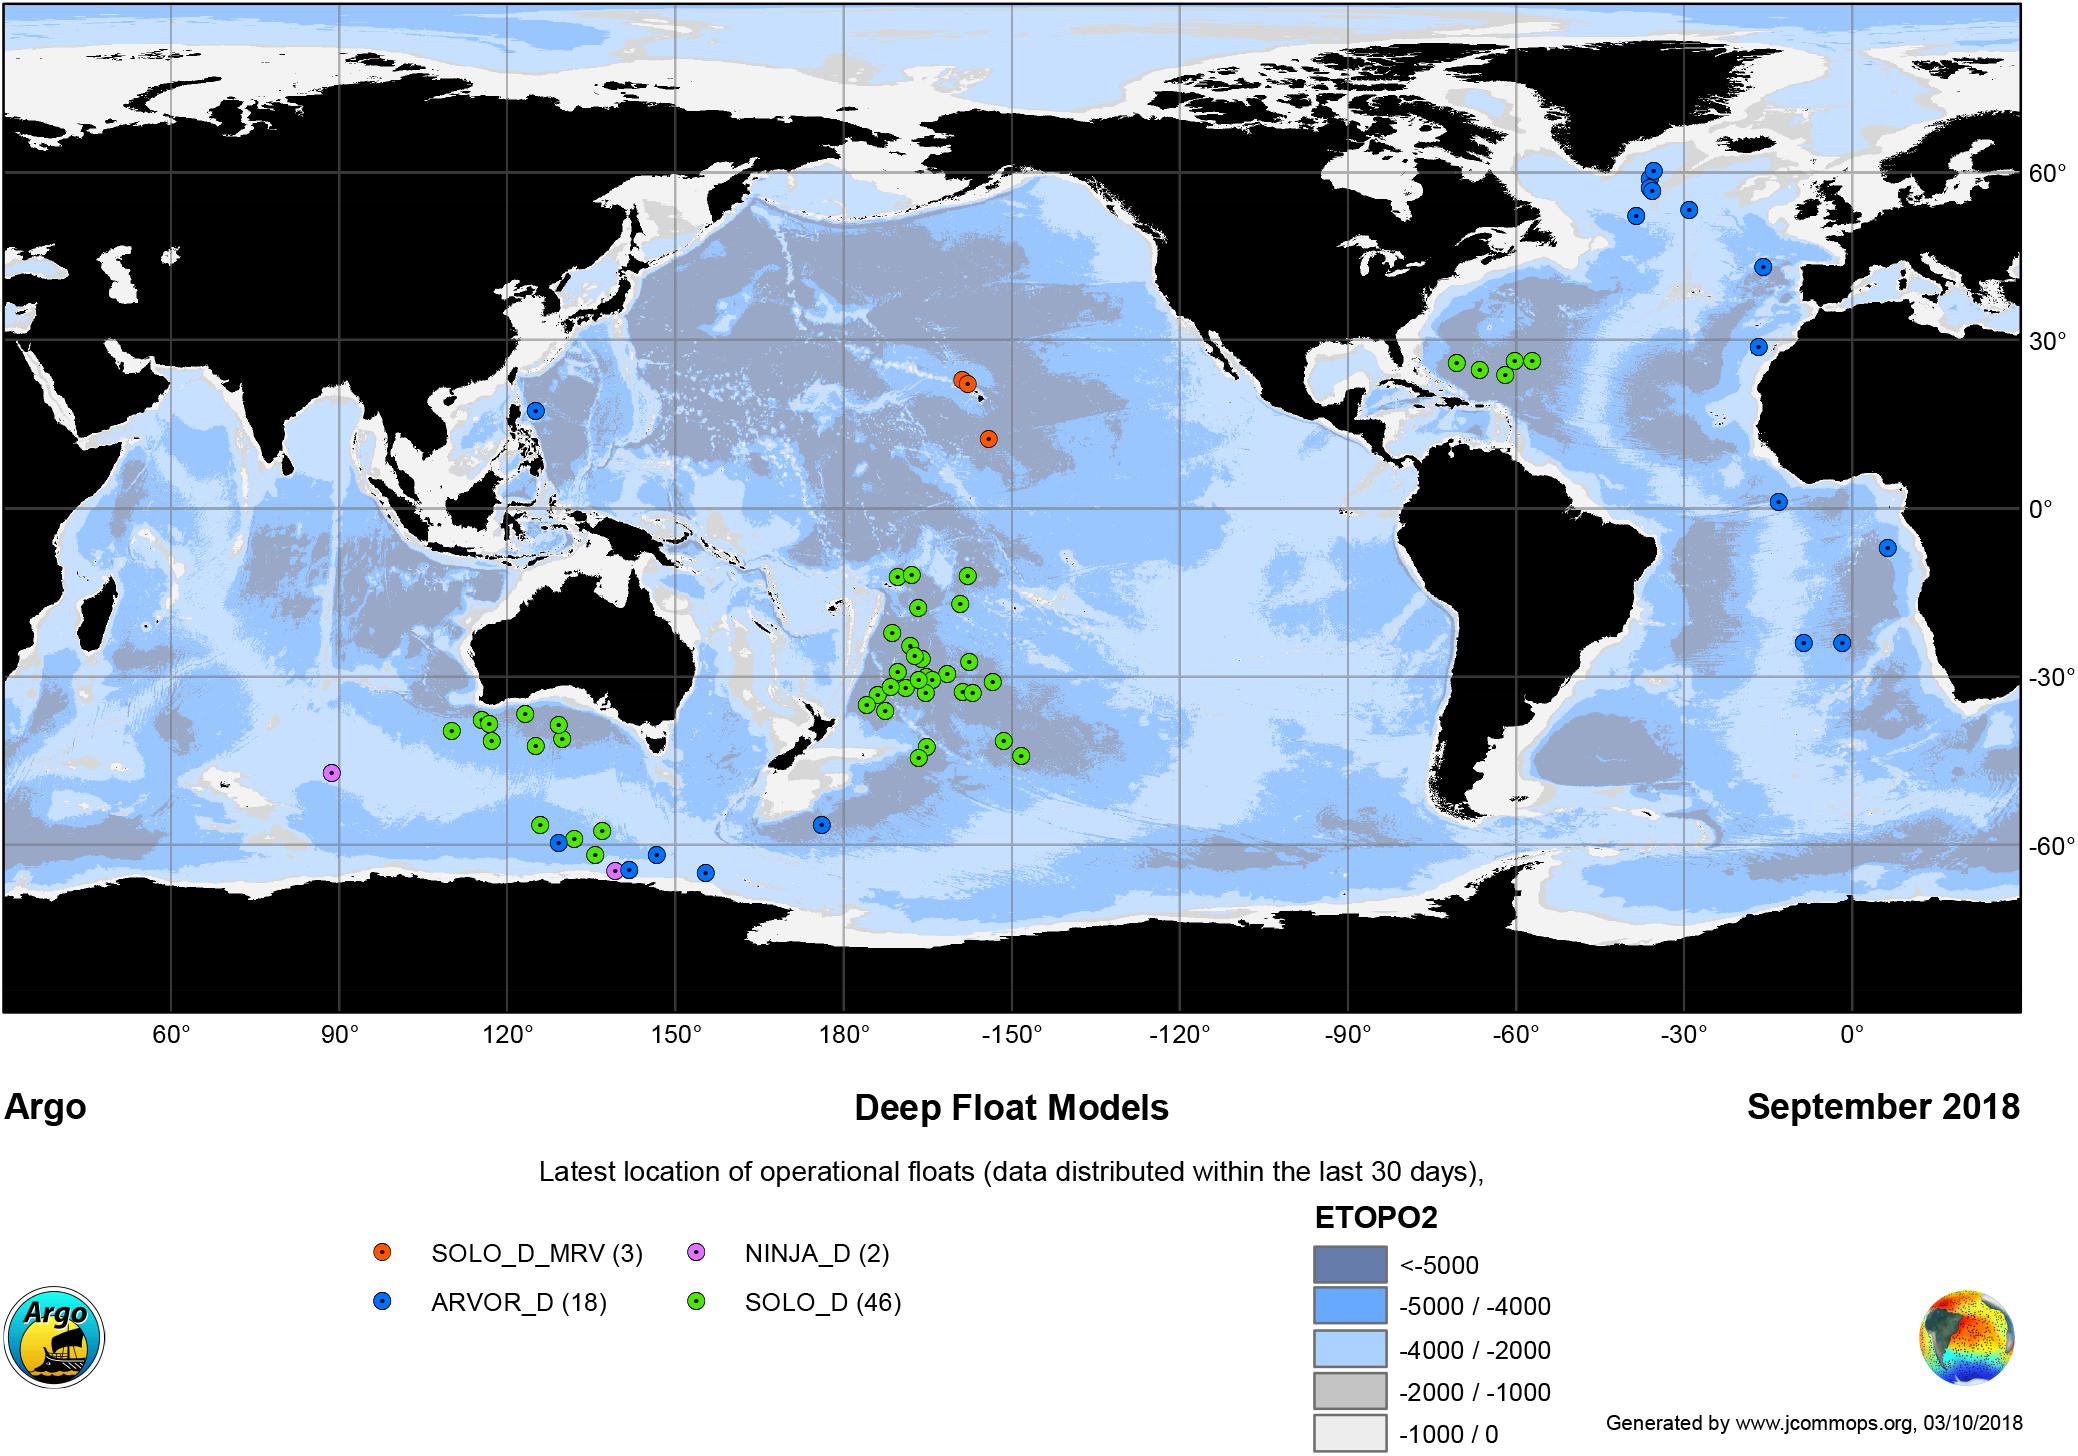
Figure 9. Map of 69 operational Deep Argo floats in September 2018 (rounded symbols), including 46 Deep SOLOs, 3 MRV Deep SOLOs, 18 Deep Arvors, and 2 Deep NINJA. The underlying color indicates bottom depth shallower than 1000 m (white), depth between 1000–2000 m (light gray), 2000–4000 m (light blue), 4000–5000 m (dark blue), and greater than 5000 m (dark gray) (Source: JCOMMOPS).
Argo Data Management
The real time Argo data stream is used extensively by operational users who need the best quality data within 24 h of profile completion. To this end, Argo has transitioned from sending only TESAC4 ASCII messages to BUFR5 onto the GTS which allows the inclusion of quality flags and additional profiles such as near-surface temperature and salinity as well as oxygen, and soon, other biogeochemical data. In 2017, Argo DACs delivered a monthly average of 12,328 TESAC messages, 93% of them within 24 h. The NRT quality control tests have remained the same for many years and with the majority of floats being deployed with two-way communications and returning high resolution data, it is timely to re-consider these tests. Specifically, Argo is exploring a test against gradient climatologies for better detection of anomalous profiles and better spike removal. In addition, over the past several years, RTQC tests for BGC parameters have been developed, some being more mature than others. All BGC RTQC tests are documented6 and the documentation is updated as tests mature and additional sensors are deployed.
The Argo data system underwent a major format change when all Argo file formats were transitioned to version 3 and higher. This format change was needed to manage mission changes due to two way communications via Iridium, to better accommodate non-core Argo profiles, to cope with different pressure sampling schemes for some parameters and to store more float metadata. It has been a multi-year process to convert legacy Argo files to the version 3 formats, but the majority of files have been updated. The additional meta data facilitates tracking the health of the array and identifying floats with potentially bad sensors. A large effort was put into homogenizing the meta data and technical files to simplify them and to make cross float model comparisons easier. The ability to store multiple profiles within one cycle has allowed the addition of BGC profiles and other non-Core Argo parameters. To minimize the impact of this change on Core Argo users, the Core Argo profile files kept their name and basic structure and do not contain any BGC parameters. There may be additional profiles in a Core Argo profile file, such as shallow near-surface CTD profiles. B-files were added to the Argo data stream containing the BGC parameters and all the intermediate variables measured and used to convert to the ocean state BGC parameters. Finally, to accommodate users whose research requires all parameters in one file, M-files are generated by the GDACs and contain both Core Argo and BGC profiles.
The transition into version 3 formats also allowed the development of GDAC File Checkers which check not only the format, but also the content of some variables. This has greatly increased the consistency and usability of Argo data. With all these changes, the GDACs today host over 2 million files comprising over 245 GB.
Argo DMQC of Core Argo variables occurs about 12 months after observation. The Owens and Wong (2009) method is the Argo standard, with local modifications depending on profile location. An ongoing challenge is ensuring that Argo DMQC is performed consistently across the program, with the best possible quality reference database for comparison. To this end, Argo is beginning to study the Argo DM dataset in a more robust manner. The North Atlantic ARC has analyzed a variety of floats from different DMQC operators in the North Atlantic to see if DMQC software is being applied properly and consistently (Cabanes et al., 2016). DMQC workshops continue to be held as needed to study the current status of DMQC data and to train new DMQC operators. To help with this, Argo is beginning to share source code more formally through Github, and with a Matlab version of the OW method that is publically available via https://github.com/ArgoDMQC/matlabow/.
The AIC has upgraded to an interactive dashboard interface that allows users to perform searches on different float samples, make plots, and display statistics of the float samples. This helps Argo PIs, users, and the public track Argo floats and monitor the health of the array on a real time basis.
Ensuring a timely and citable Argo dataset is a high priority. Over the past several years, the Argo GDACs have served the Argo data in a variety of ways. To facilitate research reproducibility, monthly snapshots of the GDACs are captured and are assigned digital object identifiers (DOIs)7. Through collaboration with the Research Data Alliance, Argo has moved ahead with issuing a DOI for its dataset with a monthly tag8 that can be added to the end of the DOI string to indicate from which month Argo data was used in scientific papers. As work in this field progresses, if DOIs are further adapted to data sets that change over time, Argo will follow the recommended changes to adhere to the current DOI framework.
The Argo Data Management System has been acknowledged as a model for other observing systems and widely copied. Nevertheless, there are substantial challenges for sustaining this success. With additional Argo sensors comes increasing complexity, and the extra burden on human resources in the data management system is considerable to maintain consistent meta and technical data for all sensors and float types. Even the P/T/S elements of the Argo dataset increase in complexity as multiple vertical axes are accommodated, and new requirements for meta and technical data are implemented. Another strain on the human resources comes from producing high quality, consistent DM files in a timely manner for increasingly complex profile and trajectory files. Finally, integration of Argo and other elements of GOOS generates a need for improvement of interoperability across the GOOS data systems.
ArgoMix
The quantification of fluxes through turbulence measurements and models based on turbulence theory (Osborn and Cox, 1972; Osborn, 1980) has developed over the past several decades. Robust testing constrained by physics (Figure 3 and tracer release experiments; e.g., Ledwell et al., 1993) demonstrates a mature technology. Mixing measurements consist of temperature microstructure measured from thermistors and/or shear measured from piezoelectric airfoil probes, measuring thermal and kinetic energy dissipation rates, χ and ε, respectively. Both types of measurements have been documented on profiling floats (Sherman and Davis, 1995; Nagai et al., 2015; Goto et al., 2016, 2018; Lucas et al., 2016; Shroyer et al., 2016) and also conducted but not published by groups at APL/UW and Scripps. These successful demonstrations show the possibilities of a more complete integration.
Shear probes and thermistors deployed on Argo floats would need to survive long immersion times (>5 years) and 100s of pressure cycles. Sensors on microstructure gliders (St. Laurent, Personal Communication) have lasted several 100 profiles over several weeks; it is not known whether reported failures originated from cycling or immersion. While we are not aware of any fundamental issues with fully-potted sensors remaining sensitive and waterproof for 100s of cycles over 5 years, their endurance and stability under Argo conditions will need to be demonstrated.
Typical power consumption of modern turbulence packages is ∼0.05 W, or about 1 kJ for a 2000 m profile (6 and 12% of the energy for APEX and SOLO profiles, respectively) and 3 kJ for a 6000-m profile (11% of the energy for a deep SOLO float). Using best practices for data compression and onboard processing (Becherer and Moum, 2017), only two variables (ε and χ) need be telemetered, at similar data rates to Argo’s normal T and S.
Plans for Evolution, Growth, and Technical Advances
Core Argo
Several enhancements to Argo’s original sampling design are being piloted, refined and recommended for implementation. Besides the major expansions into the deep ocean and biogeochemical parameters, the changes to the Core Argo array design involve either spatial expansion or regional increases in float density. The combined plan for spatial enhancements, along with Deep and BGC Argo, is termed the Argo2020 design, which will transform Argo into a truly global array with improved resolution in critical regions.
Seasonal Ice Zones
Due to a dearth of historical data (particularly in winter) and the fast rates of change in the polar oceans and cryosphere, there is strong demand to extend Argo into the seasonal ice zones (Lee et al., 2019; Newman et al., 2019). Pilots have demonstrated good float reliability in the sea-ice zone with a remaining challenge being accurately estimating location for under-ice profiles. Experience with ice-avoidance in the Arctic is less mature than for the Antarctic, but pilots are underway. Access to remote ice-covered oceans for float deployment remains a logistical challenge that will require a dedicated effort.
Marginal Seas
Operating a float array in enclosed seas has been shown to be feasible, especially for Iridium-equipped floats, with successful arrays in the Mediterranean and Asian marginal seas. Many of these floats carry biogeochemical sensors (Figure 6). Only a modest number of floats are required to cover all marginal seas at double Argo density (Table 1). However, implementation requires active and strong logistical and political support from coastal states.
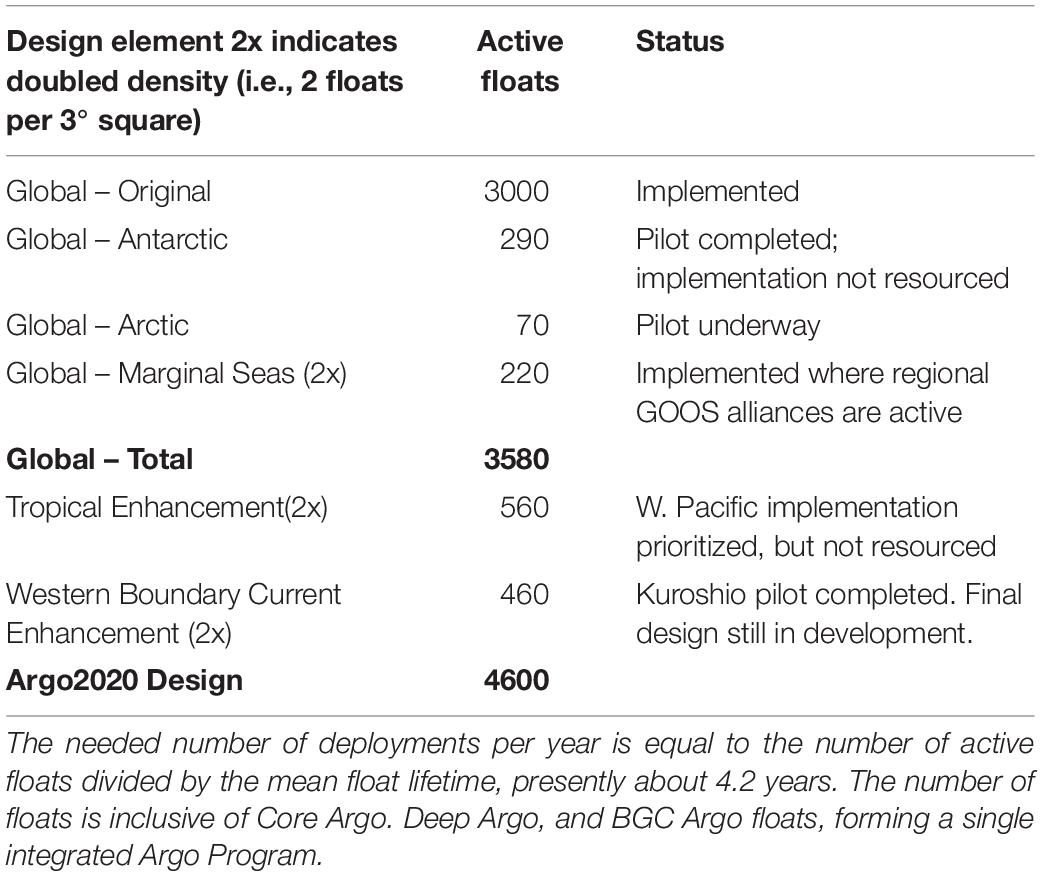
Table 1. Summary of the Argo2020 design, including the required number of active floats and the present status of elements.
Tropical Enhancements
Tropical Oceans have a large influence on global climate variability and weather. The increasing challenges of maintaining large-scale tropical moored arrays (TMAs), combined with Argo’s efficacy in measuring salinity and resolving narrow tropical thermoclines, have resulted in a recommendation to double the density of Argo sampling in the tropical Pacific. A similar increase is under consideration for the remaining basins (Foltz et al., 2019; Hermes et al., 2019; Smith et al., 2019).
Western Boundary Current Enhancements
With high levels of mesoscale variability, enhanced Argo sampling in WBC regions is needed to reduce noise in tracking the largescale temperature and salinity fields. A tentative design is to double the float density in regions of high eddy variability around western boundary currents.
The implementation of all of the above design changes would result in a 4600 float global array (Figure 10 and Table 1), roughly a 15% increase over present active float numbers, but also requiring a substantial redistribution of floats. Some of this might be achieved via efficiency, but full implementation will require additional resources and/or partners. Of the 4600 floats in the Argo2020 design, 1000 will be BGC-Argo (see section “BGC Argo” under the section “Plans for Evolution, Growth, and Technical Advances”) and 1250 will be Deep Argo floats (see section “Deep Argo” under the section “Plans for Evolution, Growth, and Technical Advances”).
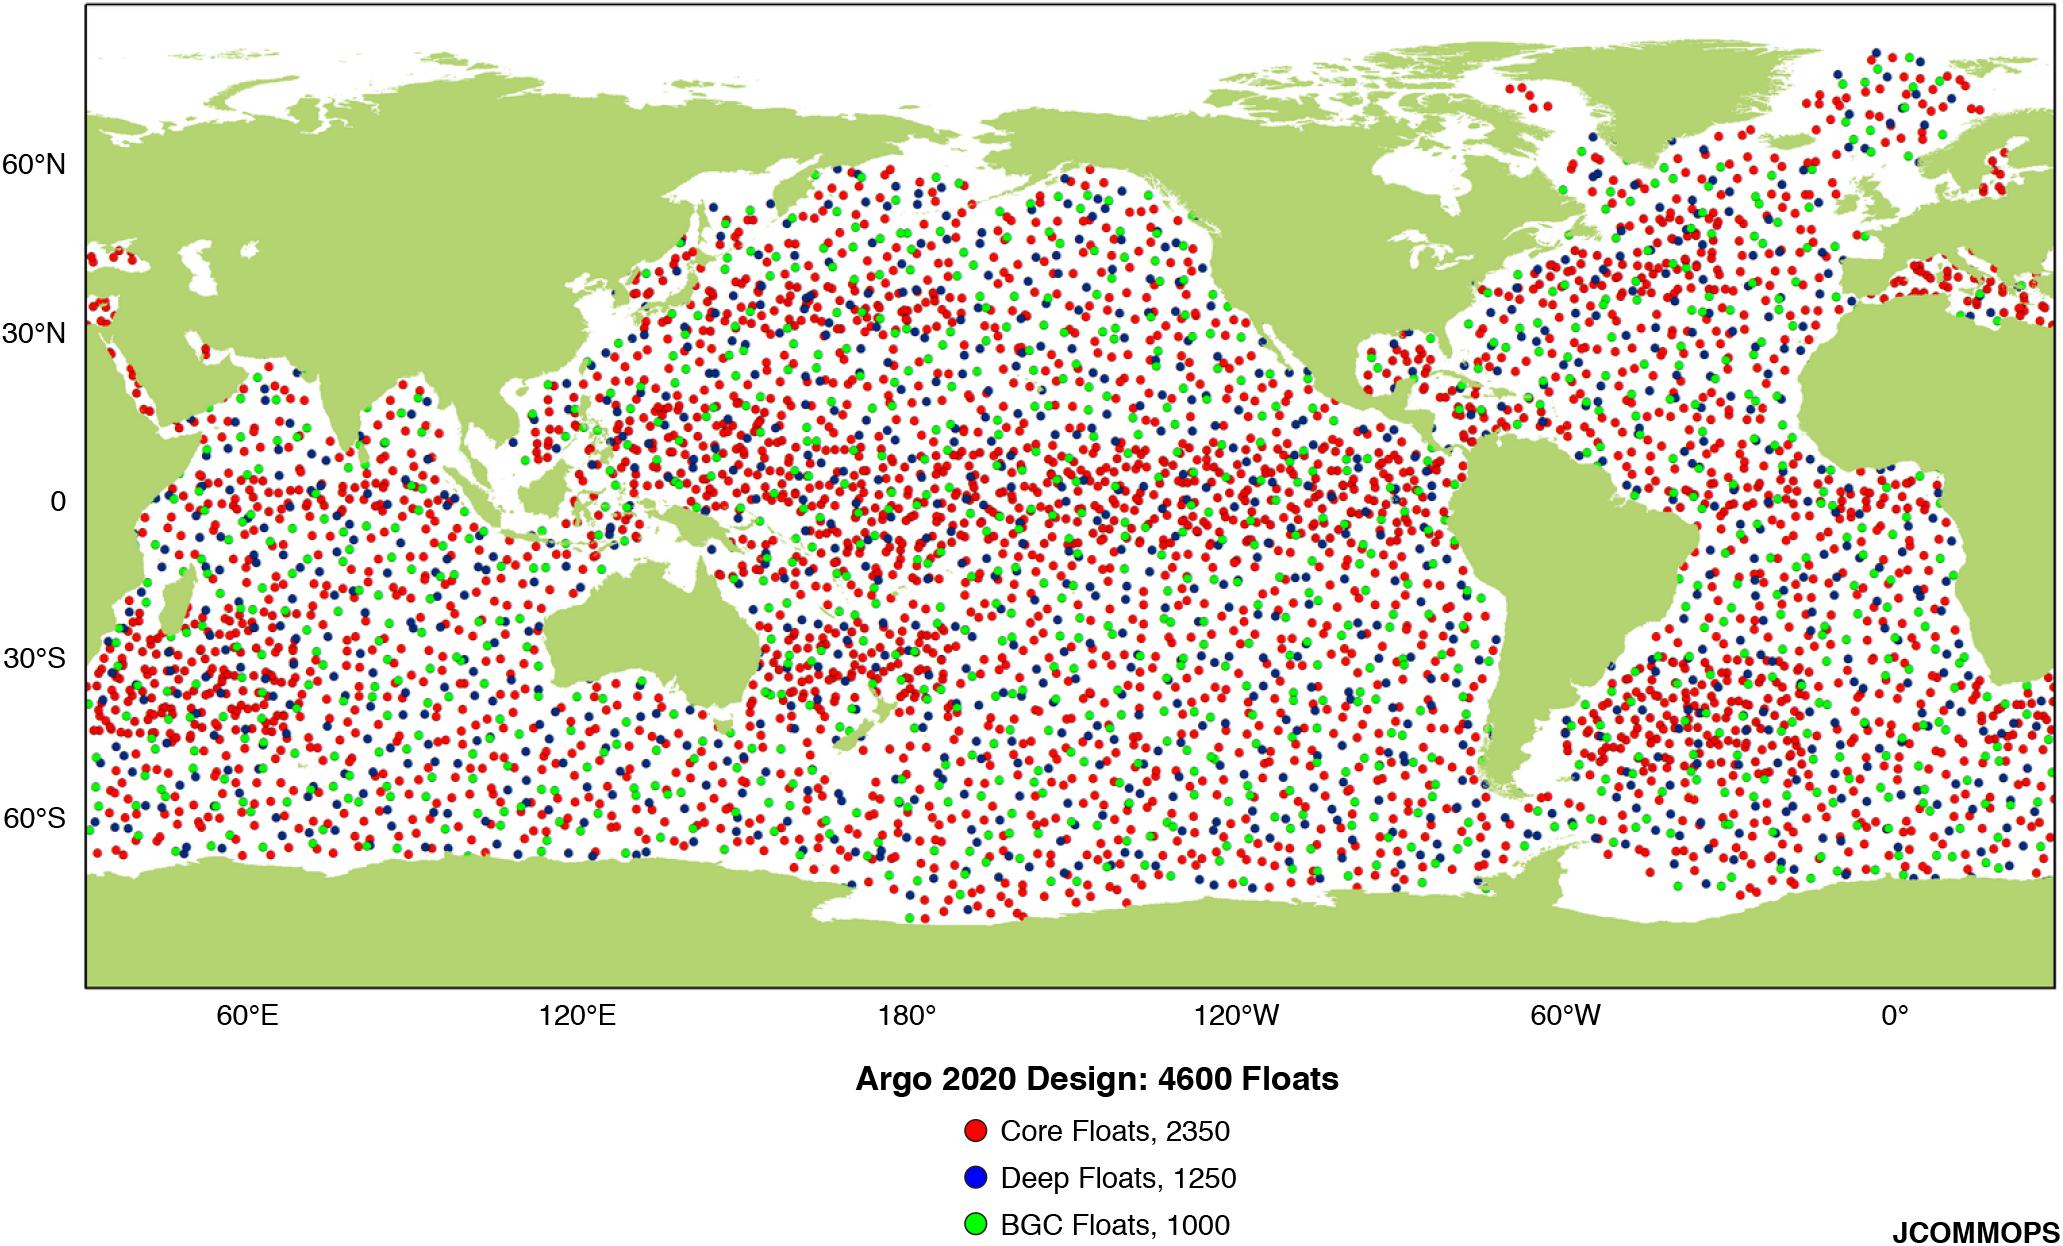
Figure 10. Schematic of the Argo2020 design indicating the density of a total of 4600 floats. including 2350 Core Argo floats (red dots), 1000 BGC-Argo floats (light blue), and 1250 Deep Argo floats (dark blue) floats as indicated in Table 1. Regions recommended for doubled density (i.e., 2 floats per 3° square) are noted in Table 1 (Source: JCOMMOPS).
Ongoing progress in extending float lifetimes (see section “Core Argo” under the section “ The present status, problems, and strengths”) will remain essential to Argo’s future. Argo’s ability to meet requirements for finer (∼10 cm) near-surface resolution is being piloted and may be extended across the Argo array. Longer term developments might also include using surface currents and/or a glide mode to keep floats apart, driving up the array sampling efficiency.
BGC Argo
The immediate goal for BGC-Argo is to obtain national commitments to the long-term implementation of BGC-Argo (contribution to the array and its data system) so that the 1000-float array can begin full-scale deployment within the next 5 years. Successfully achieving long-term sustainability relies on clear long-term commitments from national agencies. Recently announced contributors to BGC-Argo include the government of Canada and the European Research Infrastructure consortium ERIC Euro-Argo (Euro-Argo-Eric, 2017).
Beside high level commitments at national or supranational levels, a key step toward increased accessibility for developing nations that wish to contribute to BGC-Argo is to increase cost-effectiveness (Biogeochemical-Argo Planning Group, 2016). The price of BGC Argo floats could be lowered by developing a competitive market for biogeochemical sensors once there is a clear vision of the market size, with a view to decreasing sensor costs. Additionally, where feasible, float retrievals, and subsequent refitting (for ∼20% of their initial price) is a way to reduce the array cost.
Finally, long-term sustainability of BGC-Argo is dependent on data usage and satisfaction of the end-users, who are essential advocates for the BGC-Argo system. The continuous development of a large and diverse end-user community has to be a priority, in particular with the development of specific data products responding to user requirements. It will rely on the establishment of an evolving data management system that will combine (a) real-time data delivery for operational purposes, (b) delayed-mode quality-controlled data delivery for science purposes, and (c) new products supporting end-user requirements.
While the present BGC-Argo program target is to fulfill its objective of six core variables measured by 1000 operational floats, possible new extensions are being tested. These include passive acoustic listener (PAL) not only for wind and rain (Riser et al., 2008; Yang et al., 2015) but also for anthropogenic noise and mammals, miniaturized imaging sensors for resolving particle and plankton (size range from 100 μm to few mm), and hyperspectral radiometry (phytoplankton functional types). There are promising efforts to develop additional new chemical sensors, such as alkalinity (Briggs et al., 2017) and to adapt existing chemical sensors such as pCO2 (Fiedler et al., 2013).
Deep Argo
Plans for the next 10 years are to transition from the pilot phase to completed global implementation of the Deep Argo Program, including about 1250 Deep Argo floats at 5° × 5° spacing (Johnson et al., 2015). Elements of the Deep Argo deployment strategy are as follows. Existing pilot arrays should be maintained to demonstrate the scientific value of Deep Argo, and to refine the design of the Deep Argo array as well as of its floats and data management system. The deployments of 4000 and 6000 dbar Deep Argo floats will be coordinated to achieve areal coverage of top-to-bottom P/T/S profiles. New pilot arrays will be implemented in regions believed to have substantial decadal changes, seasonal cycles, or other variability, and that are close to deep-water and bottom-water formation sites. The choices of globally-uniform or basin-specific parking depth, and of preferred cycle time are still under discussion. As occurred with Core Argo, the global implementation of an evenly distributed Deep Argo float array will follow from the expansion of the regional pilots.
Deep Argo’s scientific objectives are to close the Earth’s budgets of heat and freshwater, to assess the steric contribution to sea level rise, to improve our understanding of full-depth ocean circulation and water-mass transformation in the ocean interior, and to reduce uncertainties in coupled atmosphere-ocean models, reanalyses, and predictions. The deployment of new sensors for BGC or mixing parameters could enhance the value of Deep Argo, expand the scope of the Deep Argo dataset, and promote the integration of Deep Argo with other observing system elements. Power usage of additional sensors should be compatible with Deep Argo array refresh-times of 5 years or longer. Sensor accuracy should be sufficient to resolve interannual to decadal climate signals. Enhanced hydrographic sampling of the bottom boundary layer is recommended for studies of deep-ocean dynamics, including dense overflows, energy dissipation near topography, and geothermal heating (de Lavergne et al., 2016). Deep Arvor floats equipped with altimeter and bottom-looking ADCP, will be tested in the Weddell Sea as part of the Water Mass Transformation and Pathways in the Weddell Sea (WAPITI) project, to draw deep P/T/S and oxygen measurements closer to the topography, and to improve velocity estimates near the bottom. Deep SOLO floats already sample to within a few meters of the bottom, closer than GO-SHIP cruises, which stop at about 10 m off the bottom.
Argo Data Management
Argo encourages technological developments in floats and sensors, but the introduction of new floats and sensors places a burden on the Argo data stream. Therefore, the Argo Steering Team (AST) and the ADMT have developed a framework for the definition of an Argo float, and have described a pathway for new sensors to become approved Argo sensors. Moving forward, there will be three categories of sensors: (1) accepted sensors that meet Argo’s accuracy and performance standards, (2) sensors approved for pilot arrays by the AST and ADMT, and (3) experimental sensors on floats equipped with an approved Argo CTD where the experimental sensor data will be available in the Argo auxiliary data stream.
If pilot sensors are shown to meet Argo’s accuracy and stability targets, the AST will accept these into the Argo data stream. This applies to Core Argo 2000 dbar CTDs, Deep Argo CTDs, and BGC-Argo sensors, and other prioritized parameters, and will involve coordination of the AST, ADMT, Deep Argo, BGC-Argo, and sensor manufacturers. The framework for incorporation into the Argo database explains what is required of float providers and articulates guidelines for the collection and distribution of all data collected by Argo floats. In summary, float providers must follow Argo governance rules for mandatory pre-deployment notification through the AIC and agree to timely data delivery of both NRT and DM data. In addition, float providers must have a plan for long term data ownership with a national Argo DAC. Floats that are to become part of the Core Argo Program should target the Core Argo profiling depth of 2000 dbar and the cycle time of 10 days.
Argo will also continue to develop more sophisticated code sharing among Argo DACs, PIs, and manufacturers to reduce the burden on DACs and PIs each time modifications are made to floats or sensors and to improve consistency across the Argo program. Code sharing may also help with turnover as scientists and DMQC operators within Argo retire and take some of their knowledge with them. Continuing to find interested and talented Argo data team members and train them appropriately in a timely manner will remain a challenge for the ADMT.
Quality control of Argo data involves a complex sequence of both automatic and manual tests to produce data of high scientific quality. With 400 profiles arriving daily, the burden on human resources dedicated to QC is large and Argo is considering whether machine learning can help ease the burden and improve the QC process.
Work still needs to be done on several BGC-Argo parameters to modify and develop DMQC procedures. In addition, the BGC Argo data community has developed BGC Argo products that co-locate all parameters on the same pressure levels and that perform additional QC tests.
As Deep Argo continues to grow, there will be a need to extend the Core Argo DMQC processes to data deeper than 2000 dbar and to understand how the CTDs, both the SBE-41 and the specially designed for Deep Argo SBE-61, behave over multi-year lifetimes.
Besides profile data, Argo also provides trajectory data which can be used to calculate the velocity of the ocean at the drift depth of 1000 dbar. To improve the accuracy of these velocity calculations, newer floats send back more timing information to populate additional timing variables in the new version 3 file format for trajectory files. Argo is developing a DM process for trajectory files. This will include correcting the P/T/S measurements made along the float’s trajectory, and performing quality control on the float positions and on the timing variables.
ArgoMix
Some engineering challenges remain in designing and implementing the best (most reliable, lowest power, and least expensive) float-deployed microstructure system. The next step, already underway, is for turbulence and float groups to work together to develop design criteria and test procedures that will lead to experimental deployments of O(2-5) floats, carrying temperature and shear microstructure sensors and having Argo-like missions. Once success is demonstrated in experimental deployments, and data management is harmonized with Argo, a plan for regional pilot deployment of O(30-100) floats, to allow patterns of mixing to be mapped on regional scales, would be presented to the Argo Steering Team for consideration. In parallel, several next-generation sensors are being pursued such as pitot tubes, faster thermistors, and refractometers for resolution of salinity microstructure. In time, we expect the hardware to be simplified, and the endurance of the probes demonstrated, to the point that these measurements can be efficiently incorporated as an integral part of the global Argo Program.
End User Engagement
Core Argo
The Argo Program began with a strong “user pull” that informed decisions relating to the original Argo design (Argo Steering Team, 1998). Key beneficiaries of the Argo Program, along with the scientific community, include climate sensitive industries (e.g., agriculture, aquaculture, tourism, and fisheries), and industries with a significant maritime presence (e.g., oil and gas, shipping, and emergency response). In most cases, the Argo Community’s end user engagement is maintained indirectly – either through the forecasting community, or through the scientific community.
The forecasting community (e.g., CLIVAR GSOP, GODAE OceanView) has impact through the provision of forecasts that are underpinned by GOOS – primarily through Argo and satellite observations. Such forecasts depend on the routine delivery of NRT Argo data. Public availability of NRT data has remained a core principle of the Argo community since its beginning. Forecasts are regularly exploited by the Blue Economy (Willis, 2015; Wenhai et al., 2019) to inform tactical and strategic decision-making. Adding value to seasonal forecasts to inform the agricultural industry has proved beneficial (e.g., Hochman et al., 2009). For example, inclusion of SST forecasts in crop models improves farmers’ ability to manage stocks and crops more efficiently. Short-range forecasts are often used to support emergency response to oil spills (e.g., Deepwater Horizon; Mariano et al., 2011), marine pollution (Potemra, 2012; Maximenko et al., 2019), and search and rescue (e.g., search for MH370; Griffin et al., 2017). The impact of Argo observations on forecast systems is well-documented (Davidson et al., 2019), and the complementary nature of information available from Argo observations and satellite observations (Ponte et al., 2019; Vinogradova et al., 2019), has been demonstrated many times (e.g., Oke and Schiller, 2007; Lea et al., 2014). An example of the impact of Argo data on FOAM – the 1/4°-resolution operational ocean forecast system run by the UKMet Office – is presented in Figure 11, showing the change of temperature at 110 m depth in the FOAM system after Argo data are withheld for just 1 month (Lea et al., 2014).
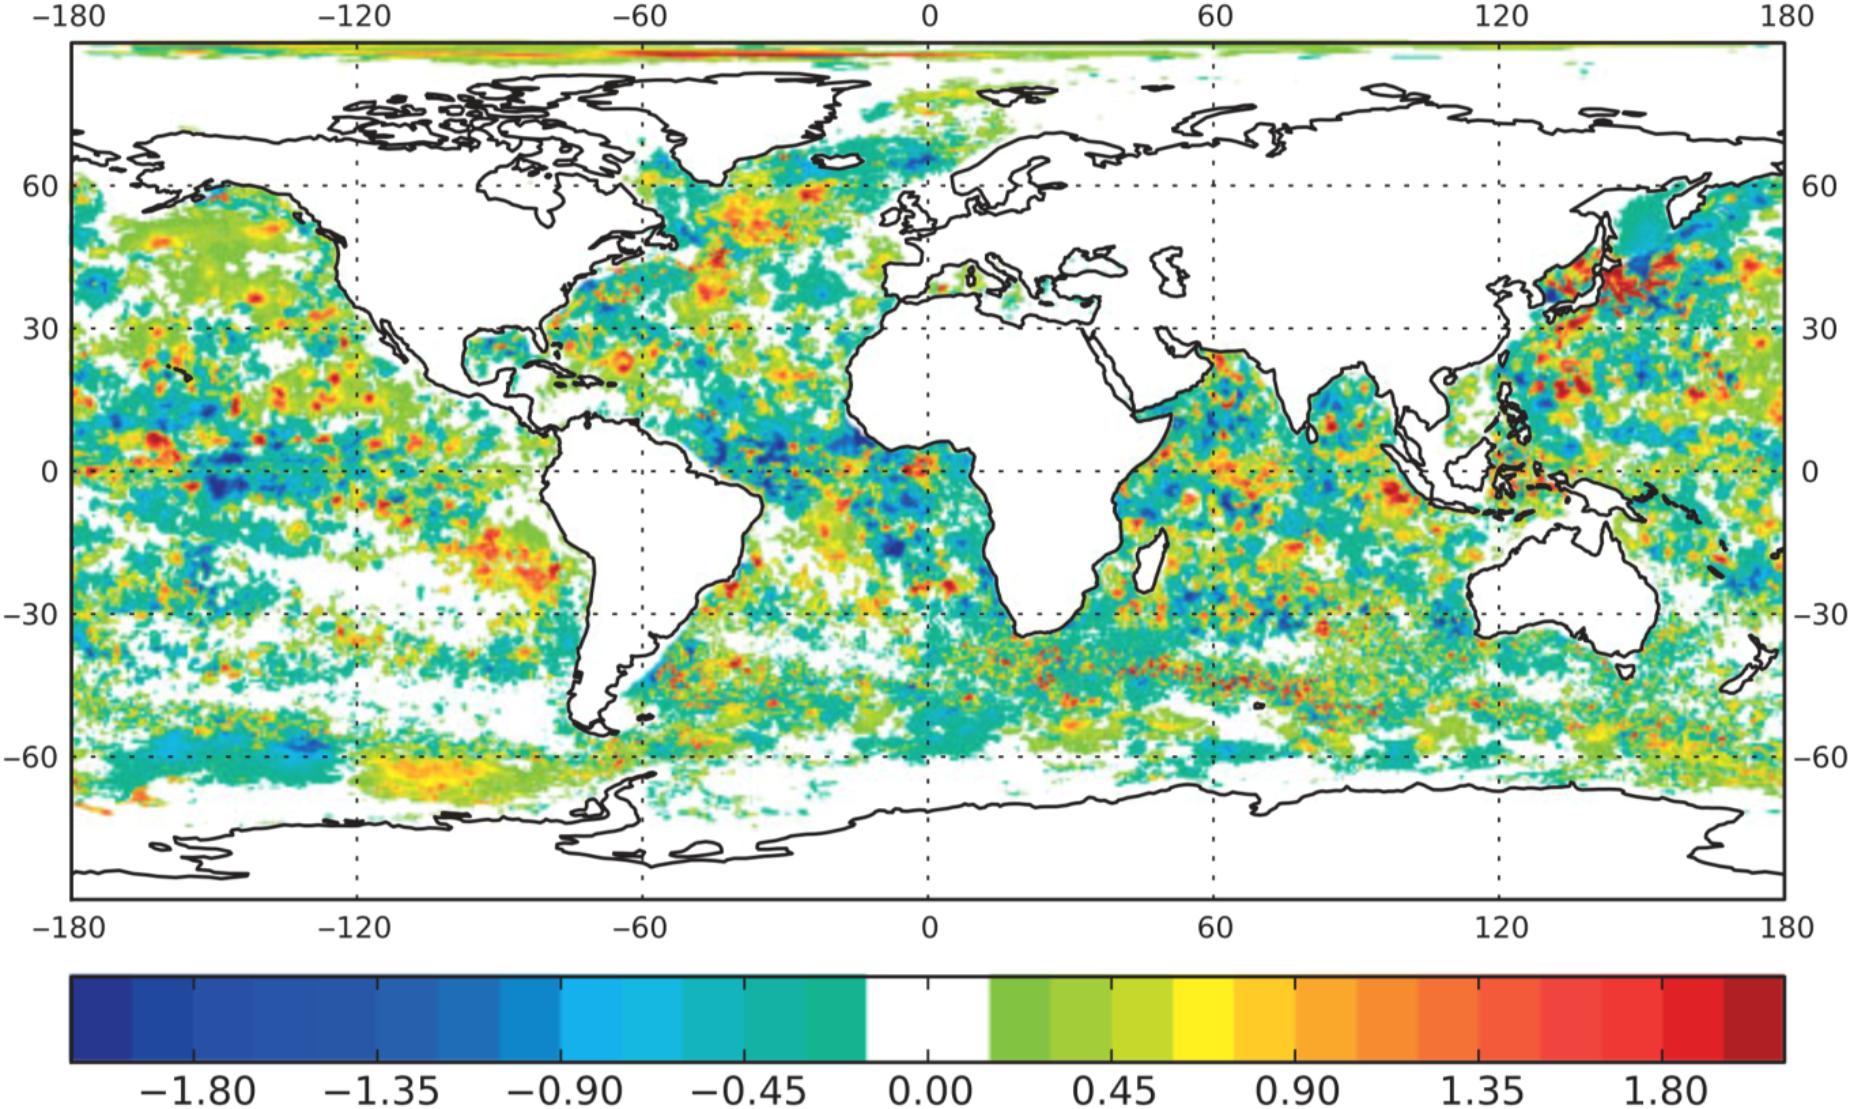
Figure 11. Map of the temperature difference (operational minus ‘no Argo’; °C) at 110 m depth, calculated from daily average fields from the last day of an Argo Observing System Experiment (31 July, 2011) [Source: adapted from Lea et al. (2014), Copyright Royal Meteorological Society, printed with permission].
The delayed-mode Argo dataset underpins many efforts in global ocean reanalysis on climate-scales (e.g., de Boisséson et al., 2018) and eddy-scales (e.g., Oke et al., 2013), providing products that are the foundation for much scientific research. In return, the ocean reanalysis community, coordinated by the Global Ocean Data Assimilation Experiment (GODAE) OceanView Observing System Evaluation Task Team (Fujii et al., 2019) and the CLIVAR Global Synthesis and Observation Panel (GSOP), regularly articulate the ongoing need and continued benefit/impact the Core Argo program delivers to their stakeholders (e.g., Oke et al., 2009; Davidson et al., 2019; Fujii et al., 2019; Penny et al., 2019).
Impacts via the scientific community typically include the identification of potential opportunities and/or vulnerabilities that are “publicized” through popular media and/or the published scientific literature. Most of the relevant scientific studies are built on the publicly-available DM data – spanning the entire Argo mission (1999-present) – that have been subject to the highest standards of quality control (e.g., Wong et al., 2003; Kobayashi and Minato, 2005; Owens and Wong, 2009). The Argo dataset facilitates assessment of the variability and trends in ocean heat content (Figure 12, also see Wijffels et al., 2016), freshwater distribution, steric sea level rise, and intermediate depth ocean circulation. This fundamental monitoring program for the world climate facilitates understanding of climate variability and change with increased certainty and more precise attribution (e.g., Chen et al., 2017). Core Argo and BGC Argo also underpin the assessments of ecosystem health (Canonico et al., 2019) increasingly delivering metrics relevant to marine biodiversity and ocean acidification (e.g., Bender et al., 2016; Watanabe and Kawamiya, 2017; Cross et al., 2019).
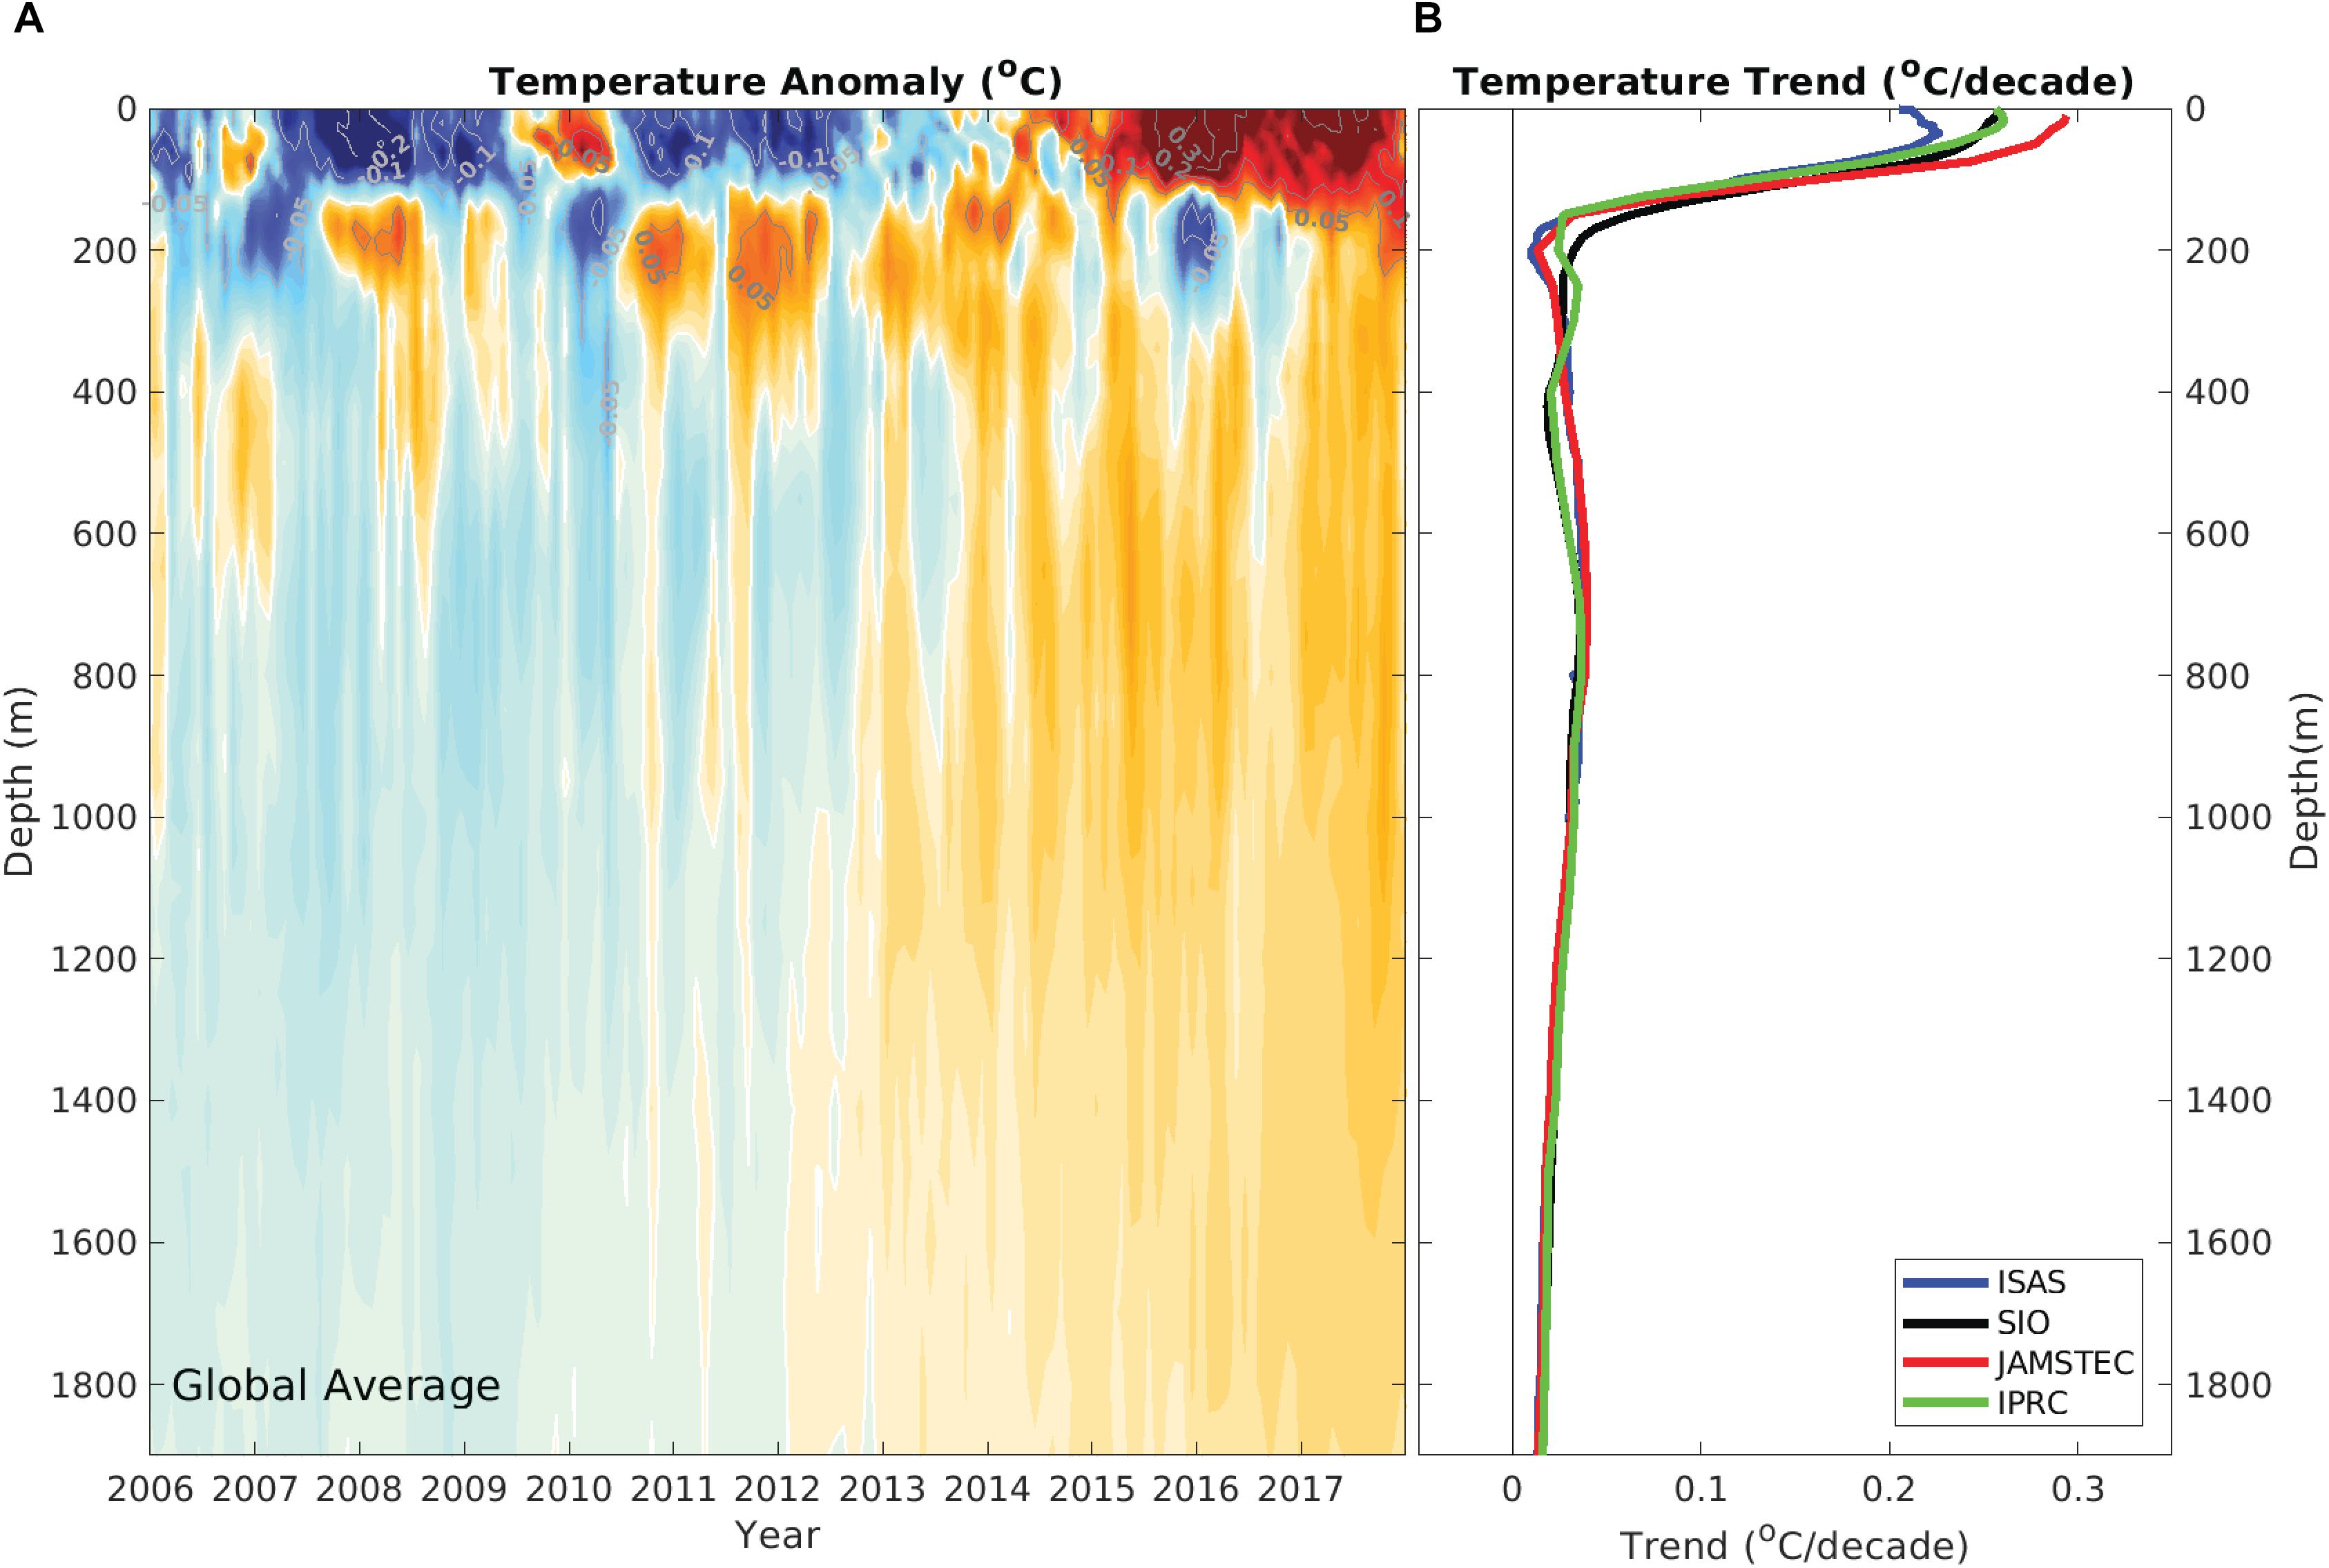
Figure 12. (A) Global averaged temperature anomaly (°C – from SIO) and (B) trend (°C/decade, 2006–2018) versus depth, based on gridded Argo data. Gridded product sources are: ISAS (Gaillard et al., 2016), SIO (Roemmich and Gilson, 2009); IPRC- from the Asia-Pacific Data Research Center (http://apdrc.soest.hawaii.edu/projects/Argo/data/gridded/On_standard_levels/index-1.html); JAMSTEC (Hosoda et al., 2008).
A key Argo user community is Education, including K-12, undergraduate, and graduate levels. Gridded versions of the Argo dataset have been developed, as well as data viewers, to serve the needs of education, research, and government agency users having widely varying backgrounds and levels of technical expertise. Education applications of Argo have included teaching units tailored to curricula as well as “after school enrichment” web-based activities9. At the graduate level, about 300 Ph.D. theses have used Argo data. Despite substantial achievements in Education, there remains more to be done. All modern students should be aware of the Argo Program and able to explore the global ocean from their desktop.
It’s important to the Argo Community that the Program remains relevant to the wider community and continues to deliver societal benefits. As new opportunities and vulnerabilities arise, and as requirements for ocean observing are better understood, the Argo design will continue to be refined to better meet ongoing societal needs (e.g., Jayne et al., 2017).
BGC Argo
Already supporting a growing community of scientific end-users, BGC-Argo has enormous potential to contribute to societal engagement through a wider group of stakeholders. In particular, these include end-users of ocean observation and modeling products and services that utilize BGC-Argo data. The BGC-Argo science and implementation plan has notably identified two topics of societal relevance in the context of “climate variability and change” and “ocean ecosystem health.”
With regard to the climate variability and change, better constraints on ocean carbon fluxes will reduce the present residual in global carbon budget estimates (Le Quéré et al., 2018) and improve quantification of air-sea CO2 fluxes (Gray et al., 2018). BGC-Argo floats measuring O2, salinity (to enable estimation of alkalinity) and pH, have the potential to provide complete annual cycles of pCO2 throughout the ocean (Williams et al., 2017). Direct measurement of pH and O2 would contribute information on ocean acidification as well as deoxygenation.
Furthermore, the BGC-Argo network will provide an important underpinning for the observation of changes occurring at the base of the food web, for the attribution of changes in higher trophic levels to environmental stressors, and for the development of predictive capabilities for marine living resources. The network would, for the first time, enable global monitoring of environmental conditions such as pH and O2 concentrations, which directly affect the physiology and fitness of marine fauna. In addition, it would enable improved estimates of primary productivity, which supports the entire marine food web, through direct observation of nitrate concentrations and plankton biomass.
Realizing the potential of BGC-Argo for societal benefits will require provision of easily accessible products (Figure 13) through partnerships with the operational oceanographic community such as GODAE. Several national service providers are actively pursuing the development of biogeochemical forecasts and re-analyses but remain severely data limited. Currently the primary NRT data source for assimilation into numerical models is ocean color from satellites. BGC-Argo will fundamentally advance biogeochemical data assimilation by extending observations below the surface and significantly expanding the suite of observable parameters.
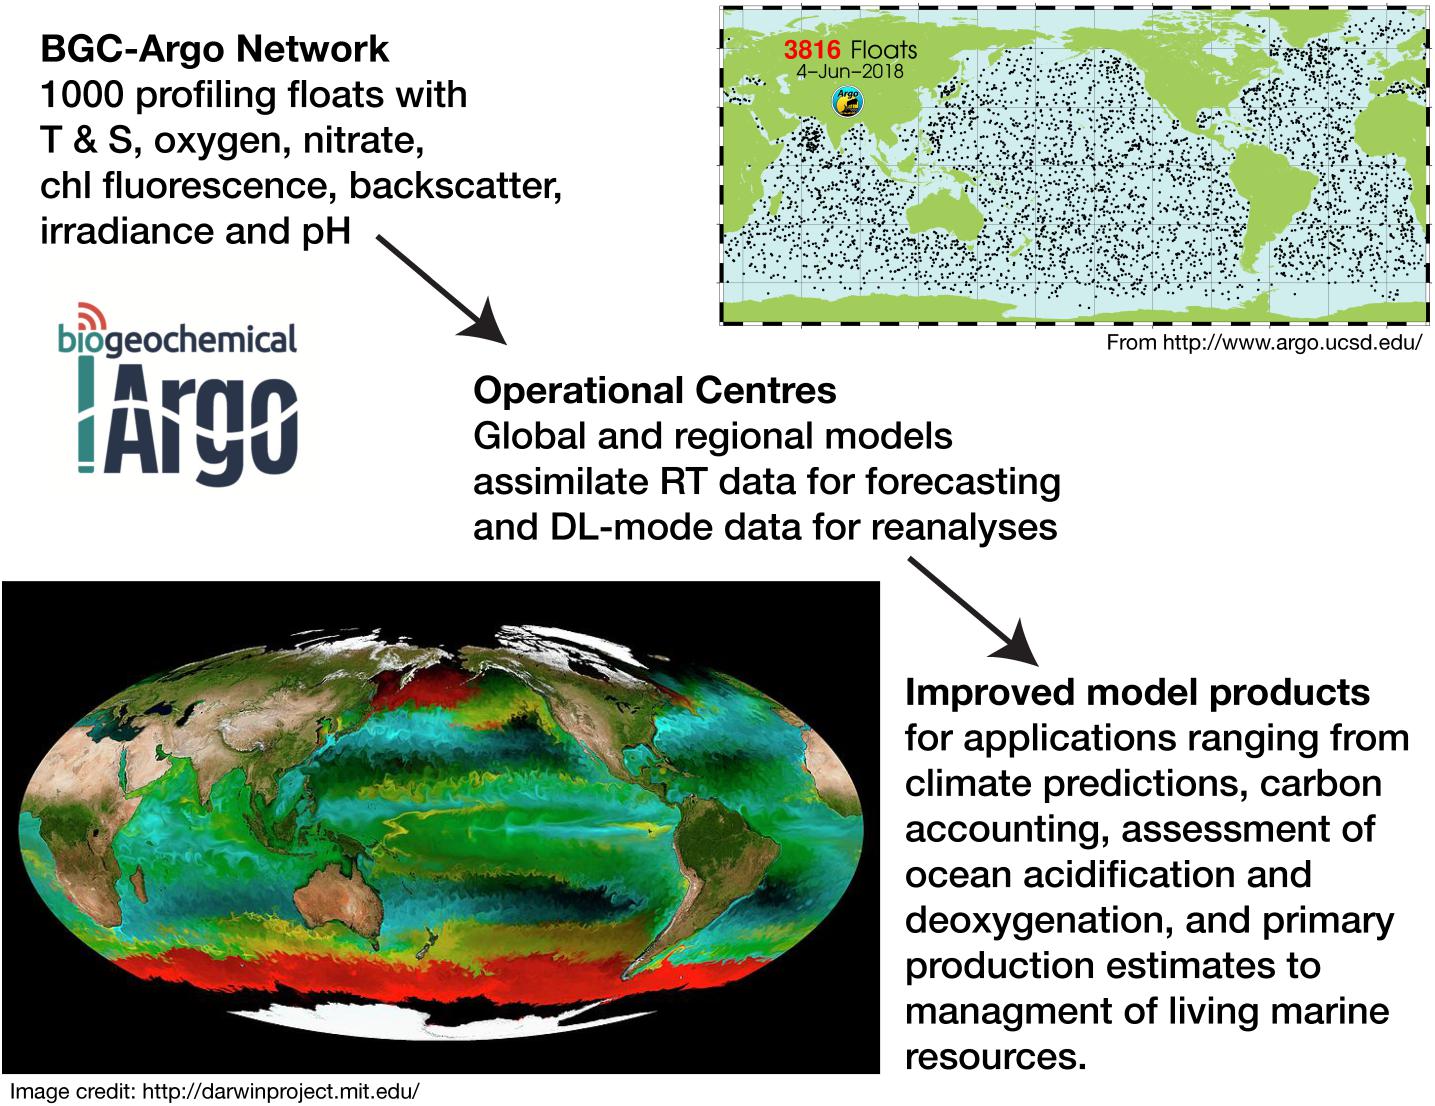
Figure 13. Easily accessible and appropriate-for-purpose data products derived from Argo are required to maximize the societal value of the Argo dataset.
Deep Argo
Deep Argo will substantially reduce the uncertainty in the rate of deep ocean warming, helping to constrain future projections of ocean heat uptake and sea level rise. Sources of uncertainties in projections of the ocean heat uptake include changes in the deep-water and bottom-water mass formation rates, and in the strength of the deep meridional overturning circulation (Masuda et al., 2010; Marshall and Zanna, 2014). GODAE, and its follow-on extensions have identified the need for deep ocean observations in data assimilation systems, to improve long-term predictions of atmosphere and ocean conditions (Bell et al., 2015). Deep Argo will help fill this need. A series of OSSEs has been performed to assess the impact of Deep Argo observations for ocean analysis and forecasting within the AtlantOS project (Visbeck et al., 2015; Gasparin et al., 2018). Early results show that the assimilation of full-depth temperature and salinity profiles using sampling density similar to the anticipated Deep Argo design (5° × 5° × 15-day), would reduce the root mean square errors of deep-ocean temperature and salinity by 20–40%.
Argo Data Management
Argo has developed an efficient data system that is used as a model for other operational observing systems, as it (1) serves both operational and research users, (2) works to standardize information in its files (scientific, meta, and technical data), (3) acts as a key player in data citation methodology in real time data systems (see section “Core Argo” under the section “End User Engagement”). These attributes illustrate the importance of identifying end user communities and developing data management systems that serve their needs. Argo did this from the outset, developing links with CLIVAR and GODAE beginning in 1998. Argo continues today to evolve the data management system to provide greater value to communities engaged in basic research, climate assessment, operational reanalysis and forecasting, and education.
ArgoMix
Numerical experimentation over the last decade has shown that key aspects of Earth’s climate depend on accurate representation of turbulent mixing in the ocean. In fact, the field has matured to a point where without better observational constraints on turbulent mixing it will be difficult to make further progress in understanding processes as diverse as abyssal circulation (Melet et al., 2016; MacKinnon et al., 2017), ice ages (Ferrari et al., 2016), tropical precipitation (Jochum et al., 2013), the sea-surface temperature cycle (Moum et al., 2013) or the extent of the oxygen minimum zones (Brandt et al., 2010). ArgoMix would provide the observational backbone needed to implement trustworthy parameterizations into climate models and achieve a deeper understanding of the Earth System.
Integration With Other Observing System Elements
Core Argo
From the outset, and explicitly with Argo’s naming, there has been an emphasis on the complementarity of the Argo float array and the Jason satellite altimeter missions (Argo Steering Team, 1998). Argo captures the subsurface temperature, salinity and thus density structure, with sufficient coverage and resolution to constrain the steric component of the altimetric signal, enabling interpretation of altimetric sea surface height variability. On the other hand, the satellite altimetry provides spatial/temporal context, such as in terms of mesoscale variability, to each Argo profile. Even though the Argo/altimetry complementarity is remarkable, it is only one part of the synergy between Argo and many other in situ and satellite observing system elements (Roemmich and The Argo Steering Team, 2009; Freeland et al., 2010; Riser et al., 2016; Wuldera et al., 2016).
Argo, as a broad scale array with temperature and salinity measurements to 2000 m, has remarkable synergies with repeat hydrography (Sloyan et al., 2019) and high resolution XBT (HRX) transects (Goni et al., 2019). These transect-oriented data provide estimates of geostrophic velocity and transport, and hence heat and freshwater transport into enclosed regions or across basin-spanning transects. Combining estimated transports with Argo assessments of the storage of heat and fresh water in the enclosed regions provide a powerful tool for analyzing ocean heat and freshwater budgets along with air-sea flux products (Meyssignac et al., 2019). Argo also provides spatial/temporal context for HRX lines, which capture the mesoscale and hence the eddy flux for boundary current/basin scale heat flux measurements, and for the repeat hydrography program, whose decadal repeat cycle lacks the seasonal-to-interannual temporal resolution supplied by Argo. Also, high-quality repeat hydrography is also essential for quality control of Argo data.
While an accurate sea level record by satellite altimetry is key to monitoring and understanding sea level change, Argo serves as an essential integrant of the comprehensive observing system for sea level and its contributing components (Ponte et al., 2019). Argo provides an estimate of the steric component, resolving the temperature and salinity contributions and their depth distribution. Combining satellite altimetry and Argo, along with satellite gravimetry capturing ocean mass change, provide the capability to close local and global sea level budgets. The tide gauge network provided by GLOSS and coordinated global shipboard CTD observations provided by GO-SHIP are also essential parts of the observing system for sea level, by ensuring the accuracy of satellite altimetry and Argo data, respectively. Furthermore, variability in the globally integrated ocean heat content monitored by Argo provides constraints and validations of the satellite estimates of Earth’s top-of-the-atmosphere radiative energy imbalance (Johnson et al., 2016).
Sea surface temperature and sea surface salinity (SSS) are provided by satellite remote sensing globally, but requires in situ measurements for calibration purposes and interpretation (Vinogradova et al., 2019). Argo plays an essential role in these requirements along with other in situ observing elements such as a voluntary observing ship (VOS) network, surface drifters and moorings. Argo’s capability in this domain is being greatly improved by extension of profiles to include the near-surface layer.
Since Argo is the only global subsurface network, it occupies a special role in the integrated GOOS consisting of satellite and in situ networks. Argo’s interdependency and mutual value-adding relationships with other elements of the systems have been comprehensively discussed in the context of many regional observing systems such as the Tropical Pacific Observing System (TPOS 2020) (deYoung et al., 2019; Foltz et al., 2019; Hermes et al., 2019; Lee et al., 2019; Newman et al., 2019; Palazov et al., 2019; Smith et al., 2019; Todd et al., 2019).
BGC Argo
The BGC-Argo network has significant synergy with other ocean observing programs. Its global, year-around presence will fill observational gaps for key biogeochemical variables. In the coming years it is essential to strengthen the relations and interactions with other components of the ocean observation system.
Argo
The interaction with the Core Argo Program and its extensions (deep, marginal seas, polar seas) is a natural interaction. BGC-Argo floats also provide Core Argo measurements that are seamlessly integrated into the Argo data system. This interaction allows a more cost-effective and efficient usage of a multidisciplinary array. Additional synergies related to science have already been described (e.g., physical – biogeochemical coupling, radiometry, and heating rate of the upper ocean).
OceanGliders
As the target of Argo is the open ocean it is highly complementary to glider observations conducted over the shelf-open ocean interface. BGC-Argo and OceanGliders share biogeochemical sensors used with similar mode of operations.
OceanSites
Fixed point observatories integrate a strong biogeochemical component. Synergies between BGC Argo and Eulerian observatories will be beneficial from both scientific and technical perspectives.
Ocean Color Remote Sensing
Chla and particle backscatter are quantities that are inferred from remote sensing of ocean color. BGC-Argo floats provide the vertical dimension to the global and synoptic measurements of the satellites, with a high degree of consistency (Haëntjens et al., 2017). The integration of both observation systems has to target the development of merged 3D/4D products (already prototyped, e.g., Sauzède et al., 2016). Additionally building on float arrays dedicated to satellite calibration (IOCCG, 2011; Gerbi et al., 2016; Leymarie et al., 2018), the progressive densification of an in situ database, with the addition of radiometry, is a way to validate remote sensing products and eventually to refine algorithm retrieval, including at regional scales. BGC-Argo can be used to validate space-based products (e.g., Haëntjens et al., 2017), fill in gaps in cloudy regions, during polar night, and under ice.
GO-SHIP/GLODAP
GO-SHIP is an essential partner to BGC-Argo. Its cruises take calibrated observations of most of the biogeochemical variables measured by floats, providing an important source of reference data. The GO-SHIP data set and the merged internally consistent product produced by the GLODAP project (Olsen et al., 2016) are essential for construction of the reference data set used to detect errors and make adjustments in BGC sensors (Johnson et al., 2017) in a similar manner to that used by Core Argo to detect salinity drift (Owens and Wong, 2009). Floats with chemical sensors (O2, pH, NO3) can then extend these accurate, but infrequent, GO-SHIP cruises in the time domain to seasonal and inter-annual scales over the entire ocean.
SOCONET and SOCAT
Floats with carbon system parameters, such as pH, would extend the surface pCO2 observations collected by the SOCONET ship of opportunity and mooring network and served from the SOCAT database. SOCAT (Bakker et al., 2016) produces a collated dataset with annual updates of in situ surface pCO2 measurements. However, the observations are infrequent, at high latitude, and biased to summer months. Merged products of ship, mooring-based and float-based estimates have the potential to improve our understanding of seasonal and interannual variability of ocean acidification and air-sea CO2 fluxes.
Deep Argo
At present, the deep ocean is primarily monitored by temporally-limited repeat hydrographic sections provided by GO-SHIP, and fixed-point time-series at the OceanSITES moorings (e.g., TAO/TRITON, PIRATA, and RAMA arrays; Send et al., 2010). Deep Argo will complement existing deep-ocean observations by increasing the top-to-bottom P/T/S sampling in the ocean interior. As in Core Argo, Deep Argo’s success will build upon collaboration and integration across elements of the GOOS. Comparison with highly accurate P/T/S and oxygen measurements from GO-SHIP is the basis for Deep Argo DMQC, to monitor CTD and oxygen sensor drift, and to provide scientific background for data analysis. The implementation of the Deep Argo array relies on partnerships with ship-based hydrography programs including GO-SHIP, the HRX network, Core Argo, and OceanSITES. Deep Argo sea-going operations will provide deployment opportunities for other observing system elements (e.g., the Global Drifter Program).
Deep Argo, will improve the integration of satellite remote sensing observations, including sea level, net top-of-the atmosphere energy flux, and ocean mass and land ice variability, with in situ ocean data. Changes below 2000 dbar account for about 8% of the steric sea level rise, and 10% of the ocean heat uptake since the 1990s (Purkey and Johnson, 2010; Desbruyères et al., 2016). Combining estimates of the deep-ocean thermal expansion derived from Deep Argo, with ocean mass observations from the Gravity Recovery and Climate Experiment (GRACE; Tapley et al., 2004), and sea surface height data from satellite altimetry, will advance current understanding of the partitioning of steric and mass contribution to sea level rise (Purkey et al., 2014). In addition, systematic observations of top-to-bottom ocean temperature from Deep Argo will improve the monitoring of year-to-year fluctuations in the net accumulation of anthropogenic heat in the Earth system. Increased deep ocean P/T/S sampling will provide in situ validation for variability in the Earth’s energy imbalance estimated from the satellite-based Clouds and the Earth’s radiant Energy System (CERES; Johnson et al., 2016).
Argo Data Management
Argo is already used by operational users and scientists together with other platform data and therefore enhancing the interoperability of Argo data with other data systems by implementing the FAIR10 principles is an important next step for Argo. Improving the FAIR-ness of the Argo data system may imply updates in data and metadata format as standards evolve or the addition of services to supplement existing services. As stated earlier, serving high quality data is a top priority for Argo and comparison with other observing systems will help each system with improving data quality and services (see section “Core Argo” under the section “Integration with Other Observing System Elements”).
ArgoMix
ArgoMix would greatly expand the number of direct observations of ocean turbulence, enabling improvement of fine-scale parameterizations made from existing P/T/S measurements (Gregg, 1989; Polzin et al., 1995; Whalen et al., 2012, 2015). Turbulence measurements from ArgoMix can validate and improve the underlying assumptions applied to convert P/T/S measurements from Core Argo, Chi-pods, and ship based hydrography data to fine-scale parameterizations of turbulence. Additionally, ArgoMix would bridge the gap between geographically isolated moorings and process studies and the global scale of ocean mixing. Global spatial coverage will provide the necessary context to link moorings and process studies, which may be located in special regions of enhanced mixing, to the large scales of water mass properties and circulation, and their variability.
Conclusion
Argo’s continuous, real-time, global coverage of P/T/S in the upper 2000 m of the ocean has revolutionized our ability to monitor, understand, and forecast ocean variability. Starting in the late 1990s, the oceanographic community recognized the need and opportunity for a major enhancement of subsurface measurements to complement recent advances in remote sensing and to better monitor the global oceans for climate variability and change. The community designed and implemented Argo as an autonomous profiling float array capable of sampling the interior global ocean in a temporally and spatially continuous way that revolutionized the existing GOOS (Argo Steering Team, 1998). Argo has been a tremendous success in terms of engineering advancements, data management, and data dissemination, accomplishing its initial goal of monitoring global change and its consequences, improving ocean forecasts, and providing data underpinning many scientific advances. By combining the successful groundwork of Core Argo with recent float and sensor technology developments, there is now the opportunity to expand Argo as a next-generation observational array with enhanced societal value. The expanded Argo array envisioned here is capable of documenting the regional and global heat and freshwater budgets, biogeochemistry, and circulation of the top-to-bottom and pole-to-pole ocean.
This report calls for the expansion of Argo by (1) supplementing Core Argo to cover marginal seas and seasonal ice zones, (2) increasing Core Argo float density in the tropics and western boundary current regions, (3) deploying a global BGC-Argo float array capable of measuring chlorophyll fluorescence, particle backscatter, oxygen, nitrate, pH, and irradiance, (4) deploying a global Deep Argo array to monitor ocean variability down to 6000 m, (5) validating and deploying new sensors, for example those capable of measuring ocean turbulence, (6) maintaining and advancing data management to keep up with growing data inflow and new requirements, and (7) continuing to engage with the end-user community to best maximize accessibility and utility of Argo data for the scientific, Blue Economy, and educational communities alike. The expanded design of the Argo Program, termed Argo2020, includes all of the elements described above while continuing as a single unified ocean observing system sharing platforms, logistics, data management, scientific objectives, and international governance, and with powerful synergies across its components and with other satellite and in situ observing systems.
The expanded Argo array will increase end user engagement through enabling basic research, climate assessment, education, and industry, the latter by means of improved long and short term ocean reanalysis and forecasting. Argo will better monitor climate variability and ecosystem health to allow for improved parameterization in models, and thus improved climate forecasting enabling better societal adaptation. In addition, real time assimilation of ocean heat, freshwater, and biogeochemistry will improve short-term forecasts vital for climate sensitive industries such as agriculture, aquaculture, fisheries, oil and gas. Finally, full-depth monitoring of ocean heat content will allow for synthesis with satellite observations for better closure of the global sea level rise and energy budgets. The Argo2020 design (Figure 10 and Table 1) describes the next-generation Argo Program that includes enhancements to Core Argo as well as BGC-Argo and Deep Argo elements, all fully integrated in their spatial distributions and through the comprehensive Argo Data Management System.
In the face of increasing anthropogenic forcing and accelerating global and regional trends in sea level, heat content, ocean acidification and deoxygenation, there is urgent need to continuously monitor the physical and biogeochemical variability of the global ocean with sufficient spatial and temporal resolution. The Argo in situ profiling array is a crucial piece of GOOS, and essential for meeting this challenge. Here, we have outlined a practical and scientifically compelling plan to expand Argo into a global full-depth physical and biogeochemical observational array.
Author Contributions
Lead authors, designated by the symbol “†” and listed first in the list of authors, had primary responsibility for writing entire sections of the manuscript as follows: Abstract – SPu and DR; Introduction – WBO and DR; Core Argo subsections – DR, BK, SWi, PO, and TS; BGC Argo subsections – KJ, HC, and EB; Deep Argo subsections – NZ; Argo Data Management subsections – MS and SPo; ArgoMix subsections – MA and JM; Conclusion – SPu and DR; DR compiled the manuscript and edited it for consistency. Co-authors (DB, MBa, MBe, HB, EB, PC, FCa, TC, FCh, DC, FD, GD, DD, KF, IF, RF, GF, HF, TF, MG, BG, RH, TH, SH, SJ, MJ, GCJ, KK, NK, AK, TM, TN, JN, AG, AO, RP, SPr, SR, CSchmechtig, CSchmid, ES, AS, PS, LT, TTa, VT, ST, JTo, AT, TTr, JTu, PV, WW, HW, RW, AW, SWa, AWa, CW, AWo, JX, P-YT, Y-DL, GM, KM, and IY) wrote the passages, as coordinated and assembled by the lead authors, and edited the manuscript for completeness, clarity, and accuracy.
Funding
DR, MS, and NZ were supported by the US Argo Program through the NOAA Grant NA15OAR4320071 (CIMEC). WO, SJ, and SWi were supported by the US Argo Program through the NOAA Grant NA14OAR4320158 (CINAR). EuroArgo scientists were supported by the two grants: (1) AtlantOS funding by the European Union’s Horizon 2020 Research and Innovation Programme under the Grant Agreement No. 633211 and (2) Monitoring the Oceans and Climate Change with Argo (MOCCA) Co-funded by the European Maritime and Fisheries Fund (EMFF) Project No. SI2.709624. This manuscript represents a contribution to the following research projects for HC, CaS, and FD: remOcean (funded by the European Research Council, grant 246777), NAOS (funded by the Agence Nationale de la Recherche in the frame of the French “Equipement d’avenir” program, grant ANR J11R107-F), AtlantOS (funded by the European Union’s Horizon 2020 Research and Innovation Programme, grant 2014-633211), and the BGC-Argo project funded by the CNES. DB was funded by the EU RINGO project (730944 H2020-INFRADEV-2016-1). RF was supported by the AGS-1835576. GCJ was supported by the Global Ocean Monitoring and Observing Program, National Oceanic and Atmospheric Administration (NOAA), U.S., and the Department of Commerce and NOAA Research. LT was funded under the SOCCOM Grant No. NSF PLR-1425989. VT’s contribution was supported by the French National Research Agency (ANR) through the EQUIPEX NAOS (Novel Argo Observing System) under the reference ANR-10-EQPX-40 and by the European H2020 Research and Innovation Programme through the AtlantOS project under the reference 633211. WW was supported by the Argo Poland program through the Ministry of Sciences and Higher Education Grant No. DIR/WK/2016/12. AmW was funded by the NSF-OCE1434722. K-RK is funded by the National Institute of Meteorological Sciences’ Research and Development Program “Development of Marine Meteorology Monitoring and Next-generation Ocean Forecasting System” under the grant KMA2018-00421. CSchmid is funded by NOAA/AOML and the US Argo Program through NOAA/OOMD. MBa is funded by NOAA/AOML.
Conflict of Interest Statement
The authors declare that the research was conducted in the absence of any commercial or financial relationships that could be construed as a potential conflict of interest.
Acknowledgments
Argo data were collected and made freely available by the International Argo Project and the national programs that contribute to it (http://www.argo.ucsd.edu, http://argo.jcommops.org, http://doi.org/10.17882/42182). The authors gratefully acknowledge support from their respective Argo National Programs and/or national agencies. This is the PMEL Contribution Number 4863. The Surface Ocean CO2 Atlas (SOCAT) is an international effort by numerous researchers and funding agencies to deliver a uniformly quality-controlled surface ocean CO2 database. BGC Argo data were collected and made freely available by the Southern Ocean Carbon and Climate Observations and Modeling (SOCCOM) Project funded by the NationalScience Foundation, Division of Polar Programs (NSF PLR -1425989), supplemented by both the NOAA and NASA. The authors would also like to thank the US Ocean Carbon and Biogeochemistry (US-OCB) for their support to BGC Argo in the United States.
Footnotes
- ^ http://argo.jcommops.org/
- ^ http://biogeochemical-argo.org/measured-variables-general-context.php
- ^ http://sio-argo.ucsd.edu/RG_Climatology.html
- ^ TEmperature, Salinity, and Current.
- ^ Binary Universal Form for the Representation of meteorological data.
- ^ http://dx.doi.org/10.13155/40879
- ^ http://doi.org/10.17882/42182
- ^ http://www.argodatamgt.org/Access-to-data/Argo-DOI-Digital-Object-Identifier
- ^ http://www.argo.ucsd.edu/Educational_use.html
- ^ FAIR: Findable Accessible Interoperable Re-Usable.
References
Alford, M. H., Lukas, R., Howe, B., Pickering, A., and Santiago-Mandujano, F. (2011). Moored observations of episodic abyssal flow and mixing at station ALOHA. Geophys. Res. Lett. 38:L15606. doi: 10.1029/2011GL048075
Argo Steering Team (1998). On the Design and Implementation of Argo - an Initial Plan for the Global Array of Profiling Floats. The Hague: International CLIVAR Project Office, 32.
Bakker, D. C. E., Pfeil, B., Landa, C. S., Metzl, N., O’Brien, K. M., Olsen, A., et al. (2016). A multi-decade record of high-quality fCO2 data in version 3 of the Surface Ocean CO2 Atlas (SOCAT). Earth Syst. Sci. Data 8, 383–413. doi: 10.5194/essd-8-383-2016
Barnard, A. H., and Koegle, J. (2018). Comment on “Particulate concentration and seasonal dynamics in the mesopelagic ocean based on the backscattering coefficient measured with Biogeochemical-Argo floats” by Poteau, A., Boss, E., and H. Claustre. Geophys. Res. Lett. 44, 6933–6939. doi: 10.1002/2017gl073949
Becherer, J., and Moum, J. N. (2017). An efficient scheme for onboard reduction of moored χpod data. J. Atmos. Ocean. Technol. 34, 2533–2546. doi: 10.1175/JTECH-D-17-0118.1
Bell, M. J., Schiller, A., Le Traon, P. Y., Smith, N. R., Dombrowsky, E., and Wilmer-Becker, K. (2015). An introduction to GODAE OceanView. J. Operat. Oceanogr. 8, s2–s11. doi: 10.1080/1755876X.2015.1022041
Bender, M. L., Tilbrook, B., Cassar, N., Jonsson, B., Poisson, A., and Trull, T. W. (2016). Ocean productivity south of Australia during spring and summer. Deep Sea Res. Part I Oceanogr. Res. Pap. 112, 68–78. doi: 10.1016/j.dsr.2016.02.018
Biogeochemical-Argo Planning Group (2016). “Biogeochemical-argo science and implementation plan,” in The Scientific Rationale, Design and Implementation Plan for a Biogeochemical-Argo Float Array, eds K. Johnson and H. Claustre (France: IFREMER), 58. Available at: https://archimer.ifremer.fr/doc/00355/46601/46508.pdf (accessed November 03, 2016).
Bishop, J. K. B., Davis, R. E., and Sherman, J. T. (2002). Robotic observations of dust storm enhancement of carbon biomass in the north pacific. Science 298, 817–821. doi: 10.1126/science.1074961
Bittig, H. C., Steinhoff, T., Claustre, H., Fiedler, B., Williams, N. L., Sauzède, R., et al. (2018). An alternative to static climatologies: robust estimation of open ocean CO2 variables and nutrient concentrations from T, S, and O2 data using bayesian neural networks. Front. Mar. Sci. 5:328. doi: 10.3389/fmars.2018.00328
Boss, E., and Behrenfeld, M. (2010). In situ evaluation of the initiation of the North Atlantic phytoplankton bloom. Geophys. Res. Lett. 37:L18603. doi: 10.1029/2010GL044174
Boss, E., Swift, D., Taylor, L., Brickley, P., Zaneveld, R., Riser, S., et al. (2008). Observations of pigment and particle distributions in the western North Atlantic from an autonomous float and ocean color satellite. Limnol. Oceanogr. 53, 2112–2122. doi: 10.4319/lo.2008.53.5_part_2.2112
Brandt, P., Hormann, V., Kortzinger, A., Visbeck, M., Krahmann, G., Stramma, L., et al. (2010). Changes in the ventilation of the oxygen minimum zone of the tropical North Atlantic. J. Phys. Oceanogr. 40, 1784–1801. doi: 10.1175/2010JPO4301.1
Briggs, E. M., Sandoval, S., Erten, A., Takeshita, Y., Kummel, A. C., and Martz, T. R. (2017). Solid state sensor for simultaneous measurement of total alkalinity and pH of seawater. ACS Sens. 2, 1302–1309. doi: 10.1021/acssensors.7b00305
Bryden, H. L., Longworth, H. R., and Cunningham, S. A. (2005). Slowing of the Atlantic meridional overturning circulation at 25°N. Nature 438, 655–657. doi: 10.1038/nature04385
Bushinsky, S. M., and Emerson, S. (2015). Marine biological production from in situ oxygen measurements on a profiling float in the subarctic Pacific Ocean. Glob. Biogeochem. Cycles 29, 2050–2060. doi: 10.1002/2015GB005251
Bushinsky, S. M., Gray, A. R., Johnson, K. S., and Sarmiento, J. L. (2017). Oxygen in the Southern Ocean from Argo floats: determination of processes driving air-sea fluxes. J. Geophys. Res. Oceans 122, 8661–8682. doi: 10.1002/2017JC012923
Cabanes, C., Thierry, V., and Lagadec, C. (2016). Improvement of bias detection in Argo float conductivity sensors and its application in the North Atlantic. Deep Sea Res. Part I Oceanogr. Res. Pap. 114, 128–136. doi: 10.1016/j.dsr.2016.05.007
Canonico, G., Buttigieg, P. L., Montes, E., Stepien, C. A., Wright, D., Benson, A., et al. (2019). Global observational needs and resources for marine biodiversity. Front. Mar. Sci. (in press). doi: 10.3389/fmars.2019.00367
Carrassi, A., Guemas, V., Doblas-Reyes, F. J., Volpi, D., and Asif, M. (2016). Sources of skill in near-term climate prediction: generating initial conditions. Clim. Dyn. 47, 3693–3712. doi: 10.1007/s00382-016-3036-4
Chen, X., Zhang, X., Church, J. A., Watson, C. S., King, M. A., Monselesan, D., et al. (2017). The increasing rate of global mean sea-level rise during 1993-2014. Nat. Clim. Change 7, 492–495. doi: 10.1038/nclimate3325
Claustre, H., Bishop, J., Boss, E., Stewart, B., Berthon, F. J., Coatanoan, C., et al. (2010). “Bio-optical profiling floats as new observational tools for biogeochemical and ecosystem studies: potential synergies with ocean color remote sensing,” in Proceedings of OceanObs’09: Sustained Ocean Observations and Information for Society, eds J. Hall, D. E. Harrison, and D. Stammer (Venice: ESA Publication). doi: 10.5270/OceanObs09.cwp.17
Cross, J. N., Turner, J. A., Cooley, S. R., Newton, J. A., Azetsu-Scott, K., Chambers, R. C., et al. (2019). Building the knowledge-to-action pipeline in North America: connecting ocean acidification research and actionable decision support. Front. Mar. Sci. 6:356. doi: 10.3389/fmars.2019.00356
Dall’Olmo, G., Dingle, J., Polimene, L. R., Brewin, J. W., and Claustre, H. (2016). Substantial energy input to the mesopelagic ecosystem from the seasonal mixed-layer pump. Nat. Geosci. 9, 820–823. doi: 10.1038/ngeo2818
Dall’Olmo, G., and Mork, K. A. (2014). Carbon export by small particles in the Norwegian Sea. Geophys. Res. Lett. 41, 2921–2927. doi: 10.1002/2014GL059244
Davidson, F. J., Chassignet, E., Vinayachandran, P. N., Lu, Y., Smith, G. C., Zhu, X., et al. (2019). Synergies in operational oceanography: the intrinsic need for sustained ocean observations. Front. Mar. Sci. (in press). doi: 10.3389/fmars.2019.00450
Davis, R. E., Sherman, J. T., and Dufour, J. (2001). Profiling ALACEs and other advances in autonomous subsurface floats. J. Atmos. Ocean. Technol. 18, 982–993. doi: 10.1175/1520-0426(2001)018<0982:paaoai>2.0.co;2
de Boisséson, E., Balmaseda, M. A., and Mayer, M. (2018). Ocean heat content variability in an ensemble of twentieth century ocean reanalyses. Clim. Dyn. 50, 3783–3798. doi: 10.1007/s00382-017-3845-0
de Lavergne, C., Madec, G., Capet, X., Maze, G., and Roquet, F. (2016). Getting to the bottom of the ocean. Nat. Geosci. 9, 857–858. doi: 10.1038/ngeo2850
Desbruyères, D. G., Purkey, S. G., McDonagh, E. L., Johnson, G. C., and King, B. A. (2016). Deep and abyssal ocean warming from 35 years of repeat hydrography. Geophys. Res. Lett. 43, 10,356–10,365. doi: 10.1002/2016GL070413
deYoung, B., Visbeck, M., Araujo Filho, M. C., Baringer, M. O., Buch, E., Canonico, G., et al. (2019). Atlantic observing system. Front. Mar. Sci. (in press). doi: 10.3389/fmars.2019.00428
D’Ortenzio, F., Lavigne, H., Besson, F., Claustre, H., Coppola, L., Garcia, N., et al. (2014). Observing mixed layer depth, nitrate and chlorophyll concentrations in the northwestern Mediterranean: a combined satellite and NO3 profiling floats experiment. Geophys. Res. Lett. 41, 6443–6451. doi: 10.1002/2014GL061020
Euro-Argo-Eric (2017). Strategy for Evolution of Argo in Europe, EA-2016-ERIC-STRAT. V3.2. doi: 10.13155/48526 (accessed June 07, 2017).
Ferrari, R., Mashayek, A., McDougall, T. J., Nikurashin, M., and Campin, M. J. (2016). Turning ocean mixing upside down. J. Phys. Oceanogr. 46, 2239–2261. doi: 10.1175/JPO-D-15-0244.1
Ferrari, R., and Polzin, K. L. (2005). Finescale structure of the T–S relation in the eastern North Atlantic. J. Phys. Oceanogr. 35, 1437–1454. doi: 10.1175/JPO2763.1
Fiedler, B., Fietzek, P., Vieira, N., Silva, P., Bittig, H. C., and Körtzinger, A. (2013). In situ CO2 and O2 measurements on a profiling float. J. Atmos. Ocean. Technol. 30, 112–126. doi: 10.1175/JTECH-D-12-00043.1
Foltz, G. R., Brandt, P., Richter, I., Rodríguez-Fonseca, B., Hernandez, F., Dengler, M., et al. (2019). The tropical atlantic observing system. Front. Mar. Sci. 6:206. doi: 10.3389/fmars.2019.00206
Forget, G., Ferreira, D., and Liang, X. (2015). On the observability of turbulent transport rates by Argo: supporting evidence from an inversion experiment. Ocean Sci. 11, 839–853. doi: 10.5194/os-11-839-2015
Freeland, H. J., Roemmich, D., Garzoli, S. L., Le Traon, P. Y., Ravichandran, M., Riser, S., et al. (2010). “Argo - a decade of progress,” in Proceedings of OceanObs’09: Sustained Ocean Observations and Information for Society, eds J. Hall, D. E. Harrison, and D. Stammer (Mangere: ESA Publications). doi: 10.5270/OceanObs09.cwp.32
Fujii, Y., Remy, E., Zuo, H., Oke, P. R., Halliwell, G. R., Gasparin, F., et al. (2019). Observing system evaluation based on Ocean Data Assimilation and Prediction Systems: on-going challenges and future vision for designing/supporting ocean observational networks. Front. Mar. Sci. (in press). doi: 10.3389/fmars.2019.00417
Gaillard, F., Reynaud, T., Thierry, V., Kolodziejczyk, N., and Von Schuckmann, K. (2016). In-situ based reanalysis of the global ocean temperature and salinity with ISAS: variability of the heat content and steric height. J. Clim. 29, 1305–1323. doi: 10.1175/jcli-d-15-0028.1
Gasparin, F., Greiner, E., Lellouche, M. J., Legalloudec, O., Garric, G., Drillet, Y., et al. (2018). A large-scale view of oceanic variability from 2007 to 2015 in the global high resolution monitoring and forecasting system at Mercator Océan. J. Mar. Syst. 187, 260–276. doi: 10.1016/j.jmarsys.2018.06.015
Gerbi, G. P., Boss, E., Werdell, P. J., Proctor, C. W., Haëntjens, N., Lewis, M. R., et al. (2016). Validation of ocean color remote sensing reflectance using autonomous floats. J. Atmos. Ocean. Technol. 33, 2331–2352. doi: 10.1175/JTECH-D-16-0067.1
Goni, G. J., Sprintall, J., Bringas, F., Cheng, L., Cirano, M., Dong, S., et al. (2019). More than 50 years of successful continuous temperature section measurements by the global eXpendable BathyThermograph (XBT) network, its integrability, future and impact on societal benefits, and future. Front. Mar. Sci. (in press). doi: 10.3389/fmars.2019.00452
Goto, Y., Yasuda, I., and Nagasawa, M. (2016). Turbulence estimation using fast-response thermistors attached to a free-fall vertical microstructure profiler. J. Atmos. Ocean. Technol. 33, 2065–2078. doi: 10.1175/JTECH-D-15-0220.1
Goto, Y., Yasuda, I., and Nagasawa, M. (2018). Comparison of turbulence intensity from CTD-attached and free-fall microstructure profilers. J. Atmos. Ocean. Technol. 35, 147–162. doi: 10.1175/JTECH-D-17-0069.1
Gray, A. R., Johnson, K. S., Bushinsky, S., Riser, S. C., Russell, J. L., Talley, L., et al. (2018). Autonomous biogeochemical floats detect significant carbon dioxide outgassing in the high-latitude Southern Ocean. Geophys. Res. Lett. 45, 9049–9057. doi: 10.1029/2018gl078013
Gregg, M. C. (1989). Scaling turbulent dissipation in the thermocline. J. Geophys. Res. Oceans 94, 9686–9698. doi: 10.1029/JC094iC07p09686
Griffin, D. A., Oke, P. R., and Jones, E. (2017). The Search for MH370 and Ocean Surface Drift - Part II. CSIRO Report Number EP172633. doi: 10.4225/08/58fba83e73f2b (accessed April 13, 2017).
Gruber, N., Doney, S., Emerson, S., Gilbert, D., Kobayashi, T., Körtzinger, A., et al. (2007). The Argo-Oxygen Program: A White Paper to Promote the Addition of Oxygen Sensors to the International Argo Float Program. Available at: http://www-argo.ucsd.edu/o2_white_paper_web.pdf (accessed April 4, 2007).
Gruber, N., Doney, S., Emerson, S. R., Gilbert, D., Kobayashi, T., Kortzinger, A., et al. (2010). “Addition oxygen to Argo: developing a global in situ observatory for ocean deoxygenation and biogeochemistry,” in Proceedings of Oceanobs’09: Sustained Ocean Observations and Information for Society, eds J. Hall, D. E. Harrison, and D. Stammer (Venice: ESA Publication). doi: 10.5270/OceanObs09.cwp.39
Haëntjens, N., Boss, E., and Talley, L. D. (2017). Revisiting Ocean Color algorithms for chlorophyll a and particulate organic carbon in the Southern Ocean using biogeochemical floats. J. Geophys. Res. Oceans 122, 6583–6593. doi: 10.1002/2017JC012844
Hennon, T. D., Riser, S. C., and Mecking, S. (2016). Profiling float-based observations of net respiration beneath the mixed layer. Glob. Biogeochem. Cycles 30, 920–932. doi: 10.1002/2016GB005380
Hermes, J. C., Masumoto, Y., Beal, L. M., Roxy, M. K., Vialard, J., Andres, M., et al. (2019). A sustained ocean observing system in the Indian Ocean for climate related scientific knowledge and societal needs. Front. Mar. Sci. 6:355. doi: 10.3389/fmars.2019.00355
Hochman, Z., van Rees, H., Carberry, P. S., Hunt, J. R., McCown, R. L., Gartmann, A., et al. (2009). Re-inventing model-based decision support with Australian dryland farmers. 4. Yield Prophet (R) helps farmers monitor and manage crops in a variable climate. Crop Pasture Sci. 60, 1057–1070. doi: 10.1071/CP09020
Hood, E. M., Sabine, C. L., and Sloyan, B. M. (2010). The GO-SHIP Repeat Hydrography Manual: A Collection of Expert Reports and Guidelines. Available at: http://www.go-ship.org/HydroMan.html (accessed May 3, 2013).
Hosoda, S., Ohira, T., and Nakamura, T. (2008). A monthly mean dataset of global oceanic temperature and salinity derived from Argo float observations. JAMSTEC Rep. Res. Dev. 8, 47–59. doi: 10.5918/jamstecr.8.47
Intergovernmental Oceanographic Commission [IOC] (1999). Resolution XX-6, “Reports of Governing and Major Subsidiary Bodies, Twentieth Session of the Assembly”. Paris: Intergovernmental Oceanographic Commission.
IOCCG (2011). “Bio-optical sensors on Argo floats,” in Reports of the International Ocean Colour Coordinating Group, N°11, ed. H. Claustre (Dartmouth: IOCCG).
Jayne, S. R., Roemmich, D., Zilberman, N. V., Riser, S. C., Johnson, K. S., Johnson, G. C., et al. (2017). The Argo program: present and future. Oceanography 30, 18–28. doi: 10.5670/oceanog.2017.213
Jochum, M., Briegleb, B. P., Danabasoglu, G., Large, W. G., Norton, N. J., Jayne, S. R., et al. (2013). The impact of oceanic near-inertial waves on climate. J. Clim. 26, 2833–2844. doi: 10.1175/JCLI-D-12-00181.1
Johnson, G. C. (2008). Quantifying antarctic bottom water and North Atlantic deep water volumes. J. Geophys. Res. Oceans 113:C05027. doi: 10.1029/2007JC004477
Johnson, G. C., and Birnbaum, A. N. (2017). As El Niño builds, Pacific Warm Pool expands, ocean gains more heat. Geophys. Res. Lett. 44, 438–445. doi: 10.1002/2016GL071767
Johnson, G. C., Lyman, J. M., and Loeb, N. G. (2016). Improving estimates of Earth’s energy imbalance. Nat. Clim. Change 6, 639–640. doi: 10.1038/nclimate3043
Johnson, G. C., Lyman, J. M., and Purkey, S. G. (2015). Informing deep Argo array design using Argo and full-depth hydrographic section data. J. Atmos. Ocean. Technol. 32, 2187–2198. doi: 10.1175/JTECH-D-15-0139.1
Johnson, K. S., Berelson, W. M., Boss, E. S., Chase, Z., Claustre, H., Emerson, S. R., et al. (2009). Observing biogeochemical cycles at global scales with profiling floats and gliders prospects for a global array. Oceanography 22, 216–225. doi: 10.5670/oceanog.2009.81
Johnson, K. S., Plant, J. N., Coletti, L. J., Jannasch, H. W., Sakamoto, C. M., Riser, S. C., et al. (2017). Biogeochemical sensor performance in the SOCCOM profiling float array. J. Geophys. Res. Oceans 122, 6416–6436. doi: 10.1002/2017JC012838
Johnson, K. S., Riser, S. C., and Karl, D. M. (2010). Nitrate supply from deep to near-surface waters of the North Pacific subtropical gyre. Nature 465, 1062–1065. doi: 10.1038/nature09170
Kamenkovich, I., Haza, A., Gray, A. R., Dufour, C. O., and Garraffo, Z. (2017). Observing System Simulation Experiments for an array of autonomous biogeochemical profiling floats in the Southern Ocean. J. Geophys. Res. Oceans 122, 7595–7611. doi: 10.1002/2017JC012819
Klatt, O., Boebel, O., and Fahrbach, E. (2007). A profiling float’s sense of ice. J. Atmos. Ocean. Technol. 24, 1301–1308. doi: 10.1175/JTECH2026.1
Kobayashi, T., and Minato, S. (2005). Importance of reference dataset improvements for Argo delayed-mode quality control. J. Oceanogr. 61, 995–1009. doi: 10.1007/s10872-006-0016-z
Körtzinger, A., Schimanski, J., Send, U., and Wallace, D. (2004). The ocean takes a deep breath. Science 306, 1337–1337. doi: 10.1126/science.1102557
Kouketsu, S., Doi, T., Kawano, T., Masuda, S., Sugiura, N., Sasaki, Y., et al. (2011). Deep ocean heat content changes estimated from observation and reanalysis product and their influence on sea level change. J. Geophys. Res. Oceans 116:C03012. doi: 10.1029/2010JC006464
Kouketsu, S., Inoue, R., and Suga, T. (2016). Western North Pacific integrated physical-biogeochemical ocean observation experiment (INBOX): part 3. Mesoscale variability of dissolved oxygen concentrations observed by multiple floats during S1-INBOX. J. Mar. Res. 74, 101–131. doi: 10.1357/002224016819257326
Le Quéré, C., Andrew, R. M., Friedlingstein, P., Sitch, S., Pongratz, J., Manning, A. C., et al. (2018). Global carbon budget 2017. Earth Syst. Sci. Data 10, 405–448. doi: 10.5194/essd-10-405-2018
Le Reste, S., Dutreuil, V., André, X., Thierry, V., Renaut, C., Traon, P. Y. L., et al. (2016). “Deep-Arvor”: a new profiling float to extend the Argo observations down to 4000-m depth. J. Atmos. Ocean. Technol. 33, 1039–1055. doi: 10.1175/JTECH-D-15-0214.1
Lea, D. J., Martin, M. J., and Oke, P. R. (2014). Demonstrating the complementarity of observations in an operational ocean forecasting system. Q. J. R. Meteorol. Soc. 140, 2037–2049. doi: 10.1002/qj.2281
Ledwell, J. R., Watson, A. J., and Law, C. S. (1993). Evidence for slow mixing across the pycnocline from an open-ocean tracer-release experiment. Nature 364, 701–703. doi: 10.1038/364701a0
Lee, C. M., Starkweather, S., Eicken, H., Timmermans, M.-L., Wilkinson, J., Sandven, S., et al. (2019). A framework for the development, design and implementation of a sustained artic ocean observing system. Front. Mar. Sci. (in press). doi: 10.3389/fmars.2019.00451
Legler, D. M., Freeland, H. J., Lumpkin, R., Ball, G., McPhaden, M. J., North, S., et al. (2015). The current status of the real-time in situ Global Ocean Observing System for operational oceanography. J. Operat. Oceanogr. 8, s189–s200. doi: 10.1080/1755876X.2015.1049883
Leymarie, E., Penkerc’h, C., Vellucci, V., Lerebourg, C., Antoine, D., Boss, E., et al. (2018). ProVal: a new autonomous profiling float for high quality radiometric measurements. Front. Mar. Sci. 5:437. doi: 10.3389/fmars.2018.00437
Llort, J., Langlais, C., Matear, R., Moreau, S., Lenton, A., and Strutton, P. G. (2018). Evaluating southern ocean carbon eddy-pump from biogeochemical-Argo floats. J. Geophys. Res. Oceans 123, 971–984. doi: 10.1002/2017JC012861
Lozier, M. S., Bacon, S., Bower, A. S., Cunningham, S. A., Jong, M. F. D., Steur, L. D., et al. (2017). Overturning in the subpolar North Atlantic program: a new international ocean observing system. Bull. Am. Meteorol. Soc. 98, 737–752. doi: 10.1175/bams-d-16-0057.1
Lucas, A. J., Nash, J. D., Pinkel, R., MacKinnon, J., Tandon, A., Mahadevan, A., et al. (2016). Adrift upon a salinity-stratified sea: a view of upper-ocean processes in the bay of Bengal during the southwest monsoon. Oceanography 29, 134–145. doi: 10.5670/oceanog.2016.46
MacKinnon, J. A., Zhao, Z., Whalen, C. B., Waterhouse, A. F., Trossman, D. S., Sun, O. M., et al. (2017). Climate process team on internal wave–driven ocean mixing. Bull. Am. Meteorol. Soc. 98, 2429–2454. doi: 10.1175/BAMS-D-16-0030.1
Mariano, A. J., Kourafalou, V. H., Srinivasan, A., Kang, H., Halliwell, G. R., Ryan, E. H., et al. (2011). On the modeling of the 2010 Gulf of Mexico Oil Spill. Dyn. Atmos. Oceans 52, 322–340. doi: 10.1016/j.dynatmoce.2011.06.001
Marshall, D. P., and Zanna, L. (2014). A conceptual model of ocean heat uptake under climate change. J. Clim. 27, 8444–8465. doi: 10.1175/JCLI-D-13-00344.1
Masuda, S., Awaji, T., Sugiura, N., Matthews, J. P., Toyoda, T., Kawai, Y., et al. (2010). Simulated rapid warming of abyssal north pacific waters. Science 329, 319–322. doi: 10.1126/science.1188703
Maximenko, N., Corradi, P., Law, K. L., Van Sebille, E., Garaba, S. P., Lampitt, R. S., et al. (2019). Towards the integrated marine debris observing system. Front. Mar. Sci. (in press). doi: 10.3389/fmars.2019.00447
Meinen, C. S., Garzoli, S. L., Perez, R. C., Campos, E., Piola, A. R., Chidichimo, M. P., et al. (2017). Characteristics and causes of Deep Western Boundary Current transport variability at 34.5° S during 2009–2014. Ocean Sci. 13, 175–194. doi: 10.5194/os-13-175-2017
Melet, A., Legg, S., and Hallberg, R. (2016). Climatic impacts of parameterized local and remote tidal mixing. J. Clim. 29, 3473–3500. doi: 10.1175/JCLI-D-15-0153.1
Meyssignac, B., Boyer, T., Zhao, Z., Hakuba, M. Z., Landerer, F. W., Stammer, D., et al. (2019). Measuring global Ocean Heat Content to estimate the Earth Energy Imbalance. Front. Mar. Sci. (in press). doi: 10.3389/fmars.2019.00432
Mignot, A., Ferrari, R., and Claustre, H. (2018). Floats with bio-optical sensors reveal what processes trigger the North Atlantic bloom. Nat. Commun. 9:190. doi: 10.1038/s41467-017-02143-6
Mitchell, B. G. (2003). “Resolving spring bloom dynamics in the sea of Japan,” in ALPS: Autonomous and Lagrangian Platforms and Sensors, Workshop Report, eds D. L. Rudnick and M. J. Perry (La Jolla, CA: ALPS), 26–27.
Moum, J. N., Lien, R. C., Perlin, A., Nash, J. D., Gregg, M. C., and Wiles, P. J. (2009). Sea surface cooling at the Equator by subsurface mixing in tropical instability waves. Nat. Geosci. 2, 761–765. doi: 10.1038/ngeo657
Moum, J. N., and Nash, J. D. (2009). Mixing measurements on an equatorial ocean mooring. J. Atmos. Ocean. Technol. 26, 317–336. doi: 10.1175/2008JTECHO617.1
Moum, J. N., Perlin, A., Nash, J. D., and McPhaden, M. J. (2013). Seasonal sea surface cooling in the equatorial Pacific cold tongue controlled by ocean mixing. Nature 500, 64–67. doi: 10.1038/nature12363
Nagai, T., Inoue, R., Tandon, A., and Yamazaki, H. (2015). Evidence of enhanced double-diffusive convection below the main stream of the Kuroshio Extension. J. Geophys. Res. Oceans 120, 8402–8421. doi: 10.1002/2015JC011288
Naveira Garabato, A. C., Polzin, K. L., Ferrari, R., Zika, J. D., and Forryan, A. (2015). A microscale view of mixing and overturning across the Antarctic circumpolar current. J. Phys. Oceanogr. 46, 233–254. doi: 10.1175/JPO-D-15-0025.1
Newman, L., Heil, P., Trebilco, R., Katsumata, K., Constable, A. J., van Wijk, E., et al. (2019). Delivering sustained, coordinated and integrated observations of the Southern Ocean for global impact. Front. Mar. Sci. (in press). doi: 10.3389/fmars.2019.00433
Oke, P. R., Balmaseda, M. A., Benkiran, M., Cummings, J. A., Dombrowsky, E., Fujii, Y., et al. (2009). Observing system evaluations using godae systems. Oceanography 22, 144–153. doi: 10.5670/oceanog.2009.72
Oke, P. R., Sakov, P., Cahill, M. L., Dunn, J. R., Fiedler, R., Griffin, D. A., et al. (2013). Towards a dynamically balanced eddy-resolving ocean reanalysis: BRAN3. Ocean Model. 67, 52–70. doi: 10.1016/j.ocemod.2013.03.008
Oke, P. R., and Schiller, A. (2007). Impact of Argo, SST, and altimeter data on an eddy-resolving ocean reanalysis. Geophys. Res. Lett. 34:L19601. doi: 10.1029/2007gl031549
Olbers, D., and Eden, C. (2013). A global model for the diapycnal diffusivity induced by internal gravity waves. J. Phys. Oceanogr. 43, 1759–1779. doi: 10.1175/JPO-D-12-0207.1
Olsen, A., Key, R. M., van Heuven, S., Lauvset, S. K., Velo, A., Lin, X., et al. (2016). The global ocean data analysis project version 2 (GLODAPv2) – an internally consistent data product for the world ocean. Earth Syst. Sci. Data 8, 297–323. doi: 10.5194/essd-8-297-2016
Osborn, T. R. (1980). Estimates of the local rate of vertical diffusion from dissipation measurements. J. Phys. Oceanogr. 10, 83–89. doi: 10.1175/1520-0485(1980)010<0083:eotlro>2.0.co;2
Osborn, T. R., and Cox, C. S. (1972). Oceanic fine structure. Geophys. Fluid Dyn. 3, 321–345. doi: 10.1080/03091927208236085
Owens, W. B., and Wong, A. P. S. (2009). An improved calibration method for the drift of the conductivity sensor on autonomous CTD profiling floats by theta-S climatology. Deep Sea Res. Part I Oceanogr. Res. Pap. 56, 450–457. doi: 10.1016/j.dsr.2008.09.008
Palazov, A., Ciliberti, S., Peneva, E., Gregoire, M., Staneva, J., Lemieux-Dudon, B., et al. (2019). Black sea observing system. Front. Mar. Sci. 6:315. doi: 10.3389/fmars.2019.00315
Pearlman, J., Bushnell, M., Coppola, L., Karstensen, J., Buttigieg, P. L., Pearlman, F., et al. (2019). Evolving and sustaining ocean best practices and standards for the next decade. Front. Mar. Sci. 6:277. doi: 10.3389/fmars.2019.00277
Penny, S. G., Akella, S., Balmaseda, M. A., Browne, P., Carto, J. A., Chevallier, M., et al. (2019). Observational needs for improving ocean and coupled reanalysis, S2S prediction, and decadal prediction. Front. Mar. Sci. 6:391. doi: 10.3389/fmars.2019.00391
Perlin, A., and Moum, J. N. (2012). Comparison of thermal variance dissipation rates from moored and profiling instruments at the equator. J. Atmos. Ocean. Technol. 29, 1347–1362. doi: 10.1175/JTECH-D-12-00019.1
Pinardi, N., Stander, J., Legler, D., O’Brien, K., Boyer, T., Cuff, T., et al. (2019). The Joint IOC (of UNESCO) and WMO collaborative effort for met-ocean services. Front. Mar. Sci. (in press). doi: 10.3389/fmars.2019.00410
Plant, J. N., Johnson, K. S., Sakamoto, C. M., Jannasch, H. W., Coletti, L. J., Riser, S. C., et al. (2016). Net community production at Ocean Station Papa observed with nitrate and oxygen sensors on profiling floats. Glob. Biogeochem. Cycles 30, 859–879. doi: 10.1002/2015GB005349
Pollman, F., Eden, C., and Olbers, D. (2017). Evaluating the global internal wave model IDEMIX using finestructure methods. J. Phys. Oceanogr. 47, 2267–2289. doi: 10.1175/JPO-D-16-0204.1
Polzin, K. L., Naveira Garabato, A. C., Huussen, T. N., Sloyan, B. M., and Waterman, S. (2014). Finescale parameterizations of turbulent dissipation. J. Geophys. Res. Oceans 119, 1383–1419. doi: 10.1002/2013JC008979
Polzin, K. L., Toole, J. M., and Schmitt, R. W. (1995). Finescale parameterizations of turbulent dissipation. J. Phys. Oceanogr. 25, 306–328. doi: 10.1038/s41598-018-28554-z
Ponte, R. M., Carson, M., Cirano, M., Domingues, C., Jevrejeva, S., Marcos, M., et al. (2019). Towards comprehensive observing and modeling systems for monitoring and predicting regional to coastal sea level. Front. Mar. Sci. (in press). doi: 10.3389/fmars.2019.00437
Poteau, A., Boss, E., and Claustre, H. (2017). Particulate concentration and seasonal dynamics in the mesopelagic ocean based on the backscattering coefficient measured with Biogeochemical-Argo floats. Geophys. Res. Lett. 44, 6933–6939. doi: 10.1002/2017GL073949
Potemra, J. T. (2012). Numerical modeling with application to tracking marine debris. Mar. Pollut. Bull. 65, 42–50. doi: 10.1016/j.marpolbul.2011.06.026
Prakash, S. T., Balakrishnan Naira, T. M., daya Bhaskara, T. V. S. U., Prakasha, P., and Gilbert, D. (2012). Oxycline variability in the central Arabian Sea: an Argo-oxygen study. J. Sea Res. 71, 1–8. doi: 10.1016/j.seares.2012.03.003
Pujiana, K., Moum, J. N., and Smyth, W. D. (2018). The role of turbulence in redistributing upper-ocean heat, freshwater, and momentum in response to the MJO in the equatorial Indian ocean. J. Phys. Oceanogr. 48, 197–220. doi: 10.1175/JPO-D-17-0146.1
Purkey, S. G., and Johnson, G. C. (2010). Warming of global abyssal and deep southern ocean waters between the 1990s and 2000s: contributions to global heat and sea level rise budgets. J. Clim. 23, 6336–6351. doi: 10.1175/2010JCLI3682.1
Purkey, S. G., and Johnson, G. C. (2013). Antarctic bottom water warming and freshening: contributions to sea level rise, ocean freshwater budgets, and global heat gain. J. Clim. 26, 6105–6122. doi: 10.1175/JCLI-D-12-00834.1
Purkey, S. G., Johnson, G. C., and Chambers, D. P. (2014). Relative contributions of ocean mass and deep steric changes to sea level rise between 1993 and 2013. J. Geophys. Res. Oceans 119, 7509–7522. doi: 10.1002/2014JC010180
Riser, S. C., Freeland, H. J., Roemmich, D., Wijffels, S., Troisi, A., Belbeoch, M., et al. (2016). Fifteen years of ocean observations with the global Argo array. Nat. Clim. Change 6, 145–153. doi: 10.1038/nclimate2872
Riser, S. C., and Johnson, K. S. (2008). Net production of oxygen in the subtropical ocean. Nature 451, 323–325. doi: 10.1038/nature06441
Riser, S. C., Nystuen, J., and Rogers, A. (2008). Monsoon effects in the Bay of Bengal inferred from profiling float-based measurements of wind speed and rainfall. Limnol. Oceanogr. 53, 2080–2093. doi: 10.4319/lo.2008.53.5_part_2.2080
Robson, J. I., Sutton, R. T., and Smith, D. M. (2012). Initialized decadal predictions of the rapid warming of the North Atlantic Ocean in the mid 1990s. Geophys. Res. Lett. 39:L19713. doi: 10.1029/2012GL053370
Roemmich, D., Boehme, L., Claustre, H., Freeland, H., Fukasawa, M., Goni, G., et al. (2010). “Integrating the ocean observing system: mobile platforms,” in Proceedings of OceanObs’09: Sustained Ocean Observations and Information for Society, eds J. Hall, D. E. Harrison, and D. Stammer (Venice: ESA Publication). doi: 10.5270/OceanObs09.pp.33
Roemmich, D., and Gilson, J. (2009). The 2004-2008 mean and annual cycle of temperature, salinity, and steric height in the global ocean from the Argo Program. Prog. Oceanogr. 82, 81–100. doi: 10.1016/j.pocean.2009.03.004
Roemmich, D., The Argo Steering Team (2009). Argo: the challenge of continuing 10 years of progress. Oceanography 22, 46–55. doi: 10.5670/oceanog.2009.65
Roesler, C., Uitz, J., Claustre, H., Boss, E., Xing, X., Organelli, E., et al. (2017). Recommendations for obtaining unbiased chlorophyll estimates from in situ chlorophyll fluorometers: a global analysis of WET Labs ECO sensors. Limnol. Oceanogr. Methods 15, 572–585. doi: 10.1002/lom3.10185
Rudnick, D. L., and Perry, M. J. (2003). ALPS: Autonomous and Lagrangian Platforms and Sensors Workshop Report. Available at: https://www.geo-prose.com/pdfs/alps_report.pdf (accessed August 25, 2014).
Sauzède, R., Claustre, H., Uitz, J., Jamet, C., Dall’Olmo, G., D’Ortenzio, F., et al. (2016). A neural network-based method for merging ocean color and Argo data to extend surface bio-optical properties to depth: retrieval of the particulate backscattering coefficient. J. Geophys. Res. Oceans 121, 2552–2571. doi: 10.1002/2015JC011408
Send, U., Weller, R. A., Wallace, D., Chavez, F., Lampitt, R., Dickey, T., et al. (2010). “OceanSITES,” in Proceedings of the OceanObs’09: Sustained Ocean Observations and Information for Society, eds J. Hall, D. E. Harrison, and D. Stammer (Venice: ESA Publication). doi: 10.5270/OceanObs09.cwp.79
Sherman, J. T., and Davis, R. E. (1995). Observations of temperature microstructure in NATRE. J. Phys. Oceanogr. 25, 1913–1929. doi: 10.1175/1520-0485(1995)025<1913:ootmin>2.0.co;2
Shroyer, E., Rudnick, D. L., Farrar, J. T., Lim, B., Venayagamoorthy, K., St Laurent, L. C., et al. (2016). Modification of upper-ocean temperature structure by subsurface mixing in the presence of strong salinity stratification. Oceanography 29, 62–71. doi: 10.5670/oceanog.2016.39
Siedler, G., Church, J., and Gould, J. (eds). (2001). Ocean Circulation and Climate: Observing and Modeling the Global Ocean. London: Academic Press.
Sloyan, B. M., Wanninkhof, R., Kramp, M., Johnson, G. C., Talley, L., Tanhua, T., et al. (2019). The Global Ocean Ship-Base Hydrographic Investigations Program (GO-SHIP): a platform for integrated multidisciplinary ocean science. Front. Mar. Sci. (in press). doi: 10.3389/fmars.2019.00445
Smeed, D. A., Josey, S. A., Beaulieu, C., Johns, W. E., Moat, B. I., Frajka-Williams, E., et al. (2018). The North Atlantic ocean is in a state of reduced overturning. Geophys. Res. Lett. 45, 1527–1533. doi: 10.1002/2017GL076350
Smith, N., Kessler, W. S., Cravatte, S., Sprintall, J., Wijffels, S., Cronin, M. F., et al. (2019). Tropical pacific observing system. Front. Mar. Sci. 6:31. doi: 10.3389/fmars.2019.00031
Stanev, E. V., Poulain, P. M., Grayek, S., Johnson, K. S., Claustre, H., and Murray, J. W. (2018). Understanding the dynamics of the oxic-anoxic interface in the black sea. Geophys. Res. Lett. 45, 864–871. doi: 10.1002/2017GL076206
Sukigara, C., Suga, T., Saino, T., Toyama, K., Yanagimoto, D., Hanawa, K., et al. (2011). Biogeochemical evidence of large diapycnal diffusivity associated with the subtropical mode water of the North Pacific. J. Oceanogr. 67, 77–85. doi: 10.1007/s10872-011-0008-5
Talley, L. D., Feely, R. A., Sloyan, B. M., Wanninkhof, R., Baringer, M. O., Bullister, J. L., et al. (2016). Changes in ocean heat, carbon content, and ventilation: a review of the first decade of GO-SHIP global repeat hydrography. Annu. Rev. Mar. Sci. 8, 185–215. doi: 10.1146/annurev-marine-052915-100829
Tapley, B. D., Bettadpur, S., Watkins, M., and Reigber, C. (2004). The gravity recovery and climate experiment: mission overview and early results. Geophys. Res. Lett. 31:L09607. doi: 10.1029/2004GL019920
Todd, R. E., Chavez, F. P., Clayton, S., Cravatte, S. E., Goes, M. P., Graco, M. I., et al. (2019). Global perspectives on observing ocean boundary current systems. Front. Mar. Sci. (in press). doi: 10.3389/fmars.2019.00423
Verdy, A., and Mazloff, M. R. (2017). A data assimilating model for estimating Southern Ocean biogeochemistry. J. Geophys. Res. Oceans 122, 6968–6988. doi: 10.1002/2016JC012650
Vinogradova, N., Lee, T., Boutin, J., Drushka, K., Fournier, S., Sabia, R., et al. (2019). Satellite salinity observing system: recent discoveries and the way forward. Front. Mar. Sci. 6:243. doi: 10.3389/fmars.2019.00243
Visbeck, M., Araujo, M., Boetius, A., Buch, E., Claustre, H., Dabrowski, T., et al. (2015). More integrated and more sustainable Atlantic ocean observing (AtlantOS). CLIVAR Exchanges 67, 18–20.
Watanabe, M., and Kawamiya, M. (2017). Remote effects of mixed layer development on ocean acidification in the subsurface layers of the North Pacific. J. Oceanogr. 73, 771–784. doi: 10.1007/s10872-017-0431-3
Waterhouse, A. F., MacKinnon, J. A., Nash, J. D., Alford, M. H., Kunze, E., Simmons, H. L., et al. (2014). Global patterns of diapycnal mixing from measurements of the turbulent dissipation rate. J. Phys. Oceanogr. 44, 1854–1872. doi: 10.1175/JPO-D-13-0104.1
Waterman, S., Polzin, K. L. A., Garabato, C. N., Sheen, K. L., and Forryan, A. (2014). Suppression of internal wave breaking in the Antarctic circumpolar current near topography. J. Phys. Oceanogr. 44, 1466–1492. doi: 10.1175/JPO-D-12-0154.1
Wenhai, L., Cusack, C., Baker, M., Tao, W., Mingbao, C., Paige, K., et al. (2019). Successful blue economy examples with an emphasis on international perspectives. Front. Mar. Sci. 6:261. doi: 10.3389/fmars.2019.00261
Whalen, C. B., MacKinnon, J. A., Talley, L. D., and Waterhouse, A. F. (2015). Estimating the mean diapycnal mixing using a Finescale strain parameterization. J. Phys. Oceanogr. 45, 1174–1188. doi: 10.1175/JPO-D-14-0167.1
Whalen, C. B., Talley, L. D., and MacKinnon, J. A. (2012). Spatial and temporal variability of global ocean mixing inferred from Argo profiles. Geophys. Res. Lett. 39:L18612. doi: 10.1029/2012GL053196
Whitmire, A. L., Letelier, R. M., Villagrán, V., and Ulloa, O. (2009). Autonomous observations of in vivo fluorescence and particle backscattering in an oceanic oxygen minimum zone. Opt. Express 17, 21992–22004. doi: 10.1364/OE.17.021992
Wijffels, S., Roemmich, D., Monselesan, D., Church, J., and Gilson, J. (2016). Ocean temperatures chronicle the ongoing warming of Earth. Nat. Clim. Change 6, 116–118. doi: 10.1038/nclimate2924
Williams, N. L., Juranek, L. W., Feely, R. A., Johnson, K. S., Sarmiento, J. L., Talley, L. D., et al. (2017). Calculating surface ocean pCO2 from biogeochemical Argo floats equipped with pH: an uncertainty analysis. Glob. Biogeochem. Cycles 31, 591–604. doi: 10.1002/2016GB005541
Willis, Z. (2015). “Chapter 2 - national ocean observing systems in a global context,” in Coastal Ocean Observing Systems, eds Y. Liu, H. Kerkering, and R. H. Weisberg (Cambridge, MA: Academic Press), 11–25. doi: 10.1016/b978-0-12-802022-7.00002-x
Wolf, M. K., Hamme, R. C., Gilbert, D., Yashayaev, I., and Thierry, V. (2018). Oxygen saturation surrounding deep water formation events in the Labrador sea from Argo-O2 data. Glob. Biogeochem. Cycles 32, 635–653. doi: 10.1002/2017GB005829
Wong, A. P. S., Johnson, G. C., and Owens, W. B. (2003). Delayed-mode calibration of autonomous CTD profiling float salinity data by theta-S climatology. J. Atmos. Ocean. Technol. 20, 308–318. doi: 10.1175/1520-0426(2003)020<0308:dmcoac>2.0.co;2
Wong, A. P. S., and Riser, S. C. (2011). Profiling float observations of the upper ocean under sea ice off the Wilkes land coast of Antarctica. J. Phys. Oceanogr. 41, 1102–1115. doi: 10.1175/2011JPO4516.1
Wuldera, M. A., White, J. C., Loveland, T. R., Woodcock, C. E., Belward, A., and Cohen, W. B. (2016). The Global Observing System for Climate: Implementation Needs. GCOS Implementation Plan 2016, GCOS-200 (GOOS-214). Available at: https://unfccc.int/sites/default/files/gcos_ip_10oct2016.pdf doi: 10.1175/2011jpo4516.1 (accessed October 10, 2016).
Wunsch, C., and Heimbach, P. (2014). Bidecadal thermal changes in the abyssal ocean. J. Phys. Oceanogr. 44, 2013–2030. doi: 10.1175/JPO-D-13-096.1
Yang, J., Riser, S. C., Nystuen, J. A., Asher, W. E., and Jessup, A. T. (2015). Regional rainfall measurements using the Passive Aquatic Listener during the SPURS field campaign. Oceanography 28, 124–133. doi: 10.5670/oceanog.2015.10
Yeager, S., Karspeck, A., Danabasoglu, G., Tribbia, J., and Teng, H. (2012). A decadal prediction case study: late twentieth-century North Atlantic ocean heat content. J. Clim. 25, 5173–5189. doi: 10.1175/JCLI-D-11-00595.1
Zilberman, N., and Maze, G. (2015). Report on the Deep Argo Implementation Workshop. Available at: http://www.argo.ucsd.edu/DAIW1report.pdf (accessed October 9, 2015).
Keywords: Argo, floats, global, ocean, warming, circulation, temperature, salinity
Citation: Roemmich D, Alford MH, Claustre H, Johnson K, King B, Moum J, Oke P, Owens WB, Pouliquen S, Purkey S, Scanderbeg M, Suga T, Wijffels S, Zilberman N, Bakker D, Baringer M, Belbeoch M, Bittig HC, Boss E, Calil P, Carse F, Carval T, Chai F, Conchubhair DÓ, d’Ortenzio F, Dall’Olmo G, Desbruyeres D, Fennel K, Fer I, Ferrari R, Forget G, Freeland H, Fujiki T, Gehlen M, Greenan B, Hallberg R, Hibiya T, Hosoda S, Jayne S, Jochum M, Johnson GC, Kang K, Kolodziejczyk N, Körtzinger A, Le Traon P-Y, Lenn Y-D, Maze G, Mork KA, Morris T, Nagai T, Nash J, Naveira Garabato A, Olsen A, Pattabhi RR, Prakash S, Riser S, Schmechtig C, Schmid C, Shroyer E, Sterl A, Sutton P, Talley L, Tanhua T, Thierry V, Thomalla S, Toole J, Troisi A, Trull TW, Turton J, Velez-Belchi PJ, Walczowski W, Wang H, Wanninkhof R, Waterhouse AF, Waterman S, Watson A, Wilson C, Wong APS, Xu J and Yasuda I (2019) On the Future of Argo: A Global, Full-Depth, Multi-Disciplinary Array. Front. Mar. Sci. 6:439. doi: 10.3389/fmars.2019.00439
Received: 15 November 2018; Accepted: 05 July 2019;
Published: 02 August 2019.
Edited by:
Amos Tiereyangn Kabo-Bah, University of Energy and Natural Resources, GhanaReviewed by:
Maxime M. Grand, Moss Landing Marine Laboratories, United StatesPaul James Durack, Lawrence Livermore National Laboratory (DOE), United States
Copyright © 2019 Roemmich, Alford, Claustre, Johnson, King, Moum, Oke, Owens, Pouliquen, Purkey, Scanderbeg, Suga, Wijffels, Zilberman, Bakker, Baringer, Belbeoch, Bittig, Boss, Calil, Carse, Carval, Chai, Conchubhair, d’Ortenzio, Dall’Olmo, Desbruyeres, Fennel, Fer, Ferrari, Forget, Freeland, Fujiki, Gehlen, Greenan, Hallberg, Hibiya, Hosoda, Jayne, Jochum, Johnson, Kang, Kolodziejczyk, Körtzinger, Le Traon, Lenn, Maze, Mork, Morris, Nagai, Nash, Naveira Garabato, Olsen, Pattabhi, Prakash, Riser, Schmechtig, Schmid, Shroyer, Sterl, Sutton, Talley, Tanhua, Thierry, Thomalla, Toole, Troisi, Trull, Turton, Velez-Belchi, Walczowski, Wang, Wanninkhof, Waterhouse, Waterman, Watson, Wilson, Wong, Xu and Yasuda. This is an open-access article distributed under the terms of the Creative Commons Attribution License (CC BY). The use, distribution or reproduction in other forums is permitted, provided the original author(s) and the copyright owner(s) are credited and that the original publication in this journal is cited, in accordance with accepted academic practice. No use, distribution or reproduction is permitted which does not comply with these terms.
*Correspondence: Dean Roemmich, droemmich@ucsd.edu
†Lead authors