Insights on Bloom Forming Jellyfish (Class: Scyphozoa) in the Gulf of Mexico: Environmental Tolerance Ranges and Limits Suggest Differences in Habitat Preference and Resistance to Climate Change Among Congeners
 Alexandra Frolova
 Maria Pia Miglietta
- Department of Marine Biology, Texas A&M University at Galveston, Galveston, TX, United States
Jellyfish are important components of marine food webs and form problematic blooms that negatively impact human enterprise. Jellyfish of the genus Aurelia (Class Scyphozoa) are common bloom-formers in the Gulf of Mexico (GoM). Aurelia have a multi-modal life cycle where the perennial polyp produces seasonal medusae. Abiotic tolerance ranges and limits strongly influence the distribution of marine species but are unknown for most jellyfish species. Tolerance limits for survival are crucial to understanding present polyp distribution and how distribution may change in climate change scenarios. We sampled and barcoded two Aurelia species from the GoM, namely Aurelia sp. 9 and a possible new species found offshore (Aurelia sp. new). Planulae obtained from one medusa of Aurelia sp. new, and five medusae of Aurelia sp. 9 were used to establish laboratory cultures. Polyps of Aurelia coerulea, a species native to Japan but introduced in North America, Australia, and Europe, were obtained from a local aquarium, barcoded, and used to establish laboratory cultures. Using controlled laboratory experiments, we determined the temperature and salinity limits for polyp survival of the two GoM species and A. coerulea. We find that A. sp. 9 and A. coerulea were tolerant of a broad range of temperatures and salinities, but differed in tolerance limits, suggesting potential differences in habitat and resistance to climate change. A. sp. 9 was most tolerant of high temperatures and low salinities, such as those found in the estuaries of the GoM. Summer high temperatures in the coastal GoM exceed the upper thermal tolerance limit of A. sp. new and A. coerulea, suggesting that A. sp. new is an offshore species and that the coastal GoM waters may not be a suitable environment for A. coerulea. Based on the upper thermal limits identified in this study, the 4°C ocean temperature increase projected for the GoM by the next century may negatively impact Aurelia sp. 9 and Aurelia sp. new populations and is expected to deter A. coerulea from invading the GoM. This is the first account of Aurelia sp. new and the first report of temperature and salinity ranges and tolerance limits for Aurelia species.
Introduction
Jellyfish are important components of marine food webs. They feed on zooplankton and fish larvae (Möller, 1984; Purcell and Sturdevant, 2000; Riascos et al., 2014) and are food for a variety of marine animals such as penguins, turtles, and tuna (Hays et al., 2018). Large aggregations of jellyfish, also known as “blooms,” are associated with numerous negative socio-economic impacts. Jellyfish clog fishing nets (Nagata et al., 2009), reduce catch quality (Quiñones et al., 2013), obstruct power plant cooling intakes (Abdul Azis et al., 2000), and sting beachgoers (De Donno et al., 2014). Blooms also cause problems for aquaculture by fouling net pens and jellyfish nematocyst-rich mucus is responsible for fish gill disorders (Purcell et al., 2013).
In the Gulf of Mexico (GoM), problematic jellyfish blooms in coastal areas are often caused by medusae of the Class Scyphozoa, Phylum Cnidaria. Scyphozoan jellyfish have a multi-modal life cycle (Ceh et al., 2015) where the perennial benthic polyp produces seasonal jellyfish. Young medusae (ephyrae) are produced by polyps via an asexual transverse fission process called “strobilation.” In the GoM, there are 20 reported species of Scyphozoa, representing three orders and eleven families (Segura-Puertas et al., 2009). The predominant bloom-forming jellyfish genera in coastal and shelf ecosystems are Aurelia, Chrysaora, and Stomolophus (Larson, 1991), which bloom mostly in the summer months (Graham, 2001; Robinson and Graham, 2013).
Polyps have a key role in maintaining and expanding Scyphozoan populations (Lucas et al., 2012). Each polyp releases multiple medusae per strobilation event. Medusae production is controlled by the number of strobilating polyps and the rate and duration of jellyfish release (Lucas et al., 2012), therefore the size of jellyfish blooms is in part determined by the size of the polyp population. Polyps also reproduce asexually, increasing their benthic population size and thus contributing to the magnitude of jellyfish blooms (Lucas et al., 2012).
Current knowledge on the location, size, and dynamics of natural polyps in the GoM is lacking. Polyps are tiny, and found in sheltered, poorly visible places, making detection difficult. Polyps are known to inhabit hard substrates including biofouling benthic organisms, floating platforms and manmade structures (Duarte et al., 2013). Most of the GoM has a soft sandy or muddy bottom, so settlement surfaces are likely limited. However, despite the conspicuous blooms, polyps of even the most common Scyphozoan species have not been found in the GoM. The inability to locate polyp populations in nature hinders the study of jellyfish population dynamics and blooms. For example, triggers of strobilation and jellyfish production cannot be studied in situ, and the geographic origins of jellyfish blooms are unknown. Moreover, without knowledge of the current geographical ranges of polyp populations, it is difficult to predict how jellyfish will respond to climate change.
Scyphozoans’ response to climate change is not well understood. Medusae presence and abundance in ecosystems is generally highly variable. The timing, location, and number of individuals observed can vary significantly within and between years and locations (Purcell, 2005; Heim-Ballew and Olsen, 2019). The variability in the frequency and magnitude of jellyfish blooms is due in part to global multi-decadal climate oscillations (Condon et al., 2014). However, evidence from some ecosystems suggests that anthropogenic perturbations to ecosystems may facilitate bloom-formation (Purcell et al., 2007; Purcell, 2011). Jellyfish have been shown to increase in abundance in heavily fished ecosystems (Lynam et al., 2006) in areas with benthic hypoxia (Shoji et al., 2010; Miller and Graham, 2012) and in areas experiencing eutrophication (Purcell et al., 1999a; Haraldsson et al., 2012).
In the GoM, climate change is expected to affect temperatures, precipitation patterns, tropical storm activity, and sea levels (Biasutti et al., 2012). Bottom temperature increase may impact benthic polyps, their survival capabilities and their strobilation rates, thus influencing bloom magnitude and frequency. Bottom-water temperatures have increased 2°C over a 30 year period on the northern GoM continental shelf (Turner et al., 2017), which is 1.9 times faster than the local increase in air temperatures during the summer months and 6.4 times faster than the global annual sea temperature increase (Turner et al., 2017). Also, the average temperature of GoM water is projected to increase by 4°C by the end of the century (Muhling et al., 2011; Biasutti et al., 2012). How this increase in temperature will affect Scyphozoan populations and bloom frequency is unclear. It has been shown that temperature affects growth rate, asexual reproduction, and strobilation of polyps of Aurelia spp. (Purcell, 2007; Willcox et al., 2007; Hubot et al., 2017). Thermal tolerance limits constrain the biogeographical range where Scyphozoan species can survive. The ability to tolerate regional or local thermal conditions may also impact the potential for a species to become an exotic invader. The invasive Scyphozoan Aurelia coerulea, for example, has so far become established in habitats that possess similar seasonal maxima and minima to its native latitudinal range of 30°N to 45°N (Dawson et al., 2005; Scorrano et al., 2017).
Salinity is another important environmental factor that can impact the development and survival of Scyphozoan jellyfish polyps (Rippingale and Kelly, 1995; Purcell et al., 1999b, 2009; Pitt and Kingsford, 2003). Jellyfish outbreaks frequently occur in coastal environments that experience variable salinity, such as bays, estuaries and partially enclosed marine waters worldwide (Purcell et al., 1999b). Furthermore, changes in precipitation are predicted to alter the salinity of coastal areas, including the GoM (Biasutti et al., 2012), motivating studies on the salinity preferences and limits of jellyfish species. Only a few natural polyp habitats of Aurelia spp. have been studied (Gröndahl, 1988; Purcell et al., 2009; Malej et al., 2012; Marques et al., 2015, 2019; Hoèvar et al., 2018), thus information on the diversity of salinity tolerances within the genus is limited. Many past studies were also confounded by the presence of multiple cryptic species within the Aurelia genus (Dawson and Martin, 2001; Scorrano et al., 2017). Field and laboratory studies demonstrate Aurelia congeners to have differing responses to salinity variation (Spangenberg, 1964; Purcell et al., 2009; Marques et al., 2019). The size of wild populations of A. coerulea polyps appeared to be negatively impacted by high salinities especially in combination with high temperatures (Marques et al., 2019). Low salinity retarded growth of wild A. labiata (Purcell et al., 2009), while varying the salinity within the range of local environmental fluctuation was found to have no significant effect on polyp growth in Aurelia sp. from Tasmania (Willcox et al., 2007).
Temperature and salinity tolerance ranges, limits, and capacity for acclimatization strongly influence the distribution of marine species (Pörtner, 2002; Stillman, 2003; Somero, 2005, 2010), but are unknown for most jellyfish species. Yet, tolerance limits are crucial to understanding present jellyfish polyp distribution in the GoM and how distribution may change in climate change scenarios. In this study, using laboratory experiments, we assessed the temperature and salinity tolerance of the polyps of two species of Aurelia collected from the GoM and an invasive Aurelia species native to the South and East China Seas (Dawson et al., 2005). Namely, we focus on Aurelia sp. 9 and a new Aurelia species reported for the first time in this paper and found offshore in the GoM, as well as Aurelia coerulea, a species native to Japan that has invaded the Pacific coast of the United States and other locations around the world (Dawson et al., 2005; Scorrano et al., 2017). Our aims are to 1) determine the range and limits of temperatures that each species can likely tolerate in nature, 2) investigate whether the three species have the same or different upper thermal limits and 3) resolve the salinity tolerance ranges and limits for each species. This study aims to identify the temperature and salinity tolerance limits of three Aurelia species, predict their biogeographical distribution in the GoM, and to provide insight into how jellyfish populations may fare as ocean temperatures increase.
Materials and Methods
Organism Sources and Culture Establishment
Five female medusae of Aurelia sp. 9 were collected in Galveston Bay in October 2017. Medusae were carrying planulae. Soon after collection of the specimens, planulae were isolated and placed into 700 ml containers with filtered sea water of ambient bay salinity. Planulae were transported to the Texas A&M University at Galveston Sea Life Facility, where they were pooled into a single culture and allowed to metamorphose into polyps. Approximately 50 polyps belonging to the species A. coerulea were provided by the Moody Gardens Aquarium and used to start cultures. A single live adult female Aurelia jellyfish carrying planulae was collected by dip net on July 1, 2017 during a research cruise aboard the R/V Pelican. Collection took place approximately 80 miles south of the coast of Louisiana in the GoM (28° 0′ 0″N, –89° 4′ 8″W). Instruments onboard the research vessel measured water parameters to be 37 ppt salinity and 28.8°C. Tissue from the medusa was preserved in 100% ethanol. The planulae were collected from the medusa and transported to the Texas A&M University at Galveston where they settled into polyps. Polyps of all three species were maintained at the Sea Life Facility at Texas A&M University at Galveston in aerated aquaria at a salinity of 33–35 ppt, ambient temperature of 15–23°C, minimal lighting and were fed once or twice a week with a combination of freshly hatched Artemia salina nauplii and algae-enriched rotifers. Seawater of appropriate salinity was made by adding Instant Ocean aquarium salt to filtered seawater of ambient bay salinity until the target salinity was reached. Water in aquaria was changed once a week. A second partial Aurelia medusa was collected on July 3rd, 2017 in a neuston net and preserved in 100% ethanol. Both medusae specimens were used for molecular analyses.
Molecular Barcoding for Species Identification
Total genomic DNA was purified from individual polyps taken from the established polyp cultures of each species and from the tissues of two ethanol-preserved medusae samples collected aboard the R/V Pelican. Mitochondrial cytochrome c oxidase subunit I (COI) and nuclear internal transcribed spacer 1 (ITS1) were used for species-level characterization. COI was amplified using the primers LCOjf (Dawson et al., 2005) and HCO2198 (Folmer et al., 1994) using the thermal cycling protocol described by Piraino et al. (2014). ITS1 was amplified using the primers KMBN-8 and KMBN-84 from Chiaverano et al. (2016), using the thermal cycling protocol described by the authors. All polymerase chain reactions (PCR) were performed in a BioRad thermocycler. To check the quality and size of amplicons, PCR products were visualized on a 1.5% agarose gel stained with SYBR Safe. PCR products were purified using ExoSAP-ITTM (Applied Biosystems) or GeneJET Gel Extraction Kit (Thermo Scientific). COI amplicons were bi-directionally sequenced by the Texas A&M University Corpus Christi Genomics Core Lab using the PCR primers. Sequences were viewed and assembled in Geneious 9.1.8. To identify species, each consensus sequence was queried, using the BLASTn search algorithm, against the nucleotide collection (nr/nt) database of the National Center for Biotechnology (NCBI, http://www.ncbi.nlm.nih.gov).
Thermal Tolerance Ranges and Limits
We assessed temperature tolerances using two different approaches, the Chronic Lethal Thermal Method (CLM) and the Critical Thermal Method (CTM). Both methods utilize a dynamic approach to thermal tolerance determination where temperature is gradually changed until a predefined endpoint is reached. However, the methods differ in the rate of temperature change and the endpoint used (Beitinger et al., 2000) and therefore evaluate different aspects of thermal tolerance. Maximum and minimum limits in both the CTM and the CLM are determined by calculating the arithmetic mean of the endpoint temperatures among biological replicates (Vinagre et al., 2018).
The CLM utilizes a rate of temperature change that is slow enough to allow organisms to reacclimate at each new temperature and uses death as the endpoint (Beitinger et al., 2000). Temperature change rates are usually set at 1°C/day or slower (Beitinger et al., 2000; Eme and Bennett, 2009). By incorporating acclimation, the CLM has the advantage over the CTM of producing a more accurate estimate of a species’ actual thermal limits in nature (Beitinger et al., 2000). We used the CLM approach to estimate the maximum and minimum temperatures that each Aurelia species can tolerate in the wild, in the forms of the Chronic Lethal Thermal Maximum (CLMax) and Chronic Lethal Thermal Minimum (CLMin) for each species. In order to acquire a more detailed understanding of how each species responds to temperature change, we monitored polyps for signs of stress at regular intervals during temperature increase and decrease during the CLM trials. We used tentacle morphology and polyp response to tactile stimuli (prodding with a metal probe) to monitor stress, and created a ranking system, that we termed “response score” (Table 1). This score is based on observations that under standard culture conditions, polyps respond to external stimuli with immediate muscle contractions and maintain tentacles in an extended position ready to feed. The response score was used to track each species’ ability to acclimate to thermal increase or decrease and to track the onset of thermal stress leading to death.
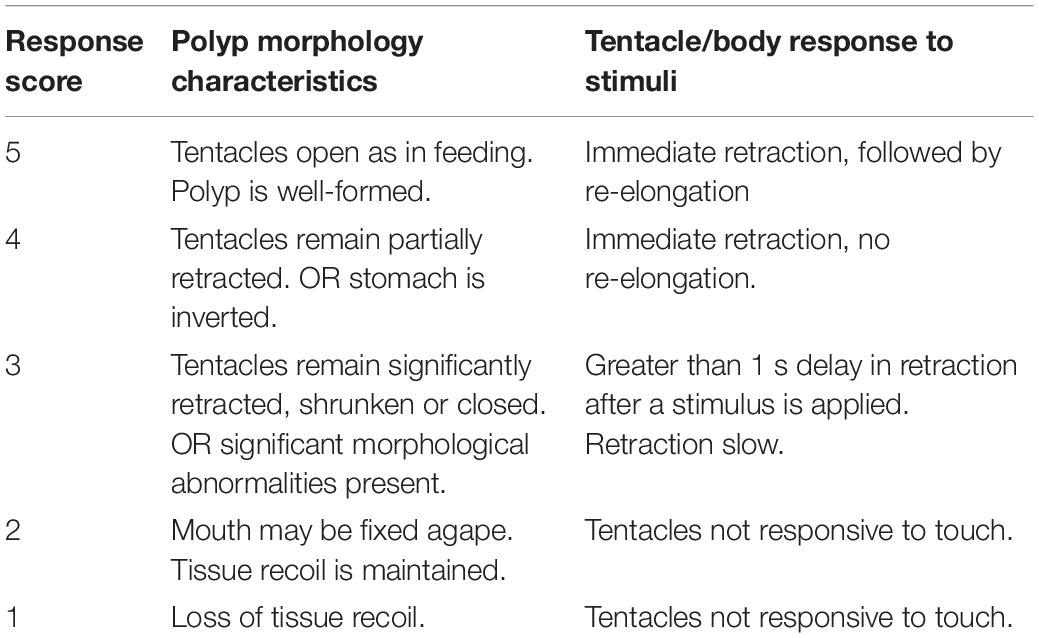
Table 1. Response scores with corresponding polyp morphology and degree of tentacle and body response.
The CTM is a common method for defining species’ thermal tolerance limits (Bennett et al., 2018) that has also been used to evaluate invertebrate response to climate change (Madeira et al., 2012; Vinagre et al., 2016, 2018, 2019). CTM is particularly useful for more precisely distinguishing tolerances between species (Beitinger et al., 2000) and was used in this study to resolve differences in upper thermal tolerance limits between Aurelia congeners. In the CTM, temperature is changed at a constant rate until a predefined sublethal critical endpoint is reached. The critical endpoint is generally specified as a non-lethal but incapacitating point (Lutterschmidt and Hutchison, 1997). CTM rates of temperature change are set fast enough so that acclimation does not occur, but slow enough for temperature to be tracked and should be standardized to allow comparison between species (Eme and Bennett, 2009; Bennett et al., 2018). We used the commonly chosen rate of temperature change of 1°C/15 min (Bennett et al., 2018; Vinagre et al., 2018, 2019).
To estimate the salinities that Aurelia polyps can tolerate in the wild, we used a chronic salinity change approach similar in concept to the CLM, which we call the Chronic Lethal Salinity Method (CLSM). We tracked individual polyps over gradual increase or decrease in salinity and monitored their apparent stress level at regular intervals using response scores, until the endpoint. The response score data was used to track each species’ ability to acclimate to salinity change and to track the onset of salinity stress leading to death. Death was designated as the endpoint. Slow rates of change in environmental variables allow polyps to physiologically acclimate, such that tolerance limits approximate what species would tolerate in the wild. We selected a rate of salinity change of 1 ppt per day to maximize acclimation time within practical limits for the investigators. Using this approach, salinity limits were calculated by taking the arithmetic mean of the lethal endpoint salinities among biological replicates (CLSMin and CLSMax).
Chronic Thermal Acclimation Range and CLM
For each Aurelia species, three non-asexually reproducing polyps were placed and allowed to settle in each well of a 12-well culture plate with 7 ml of seawater at a salinity of 33 ppt. Polyps were selected from random locations within the parent culture in an effort to maximize genetic diversity and prevent selection of polyps belonging to the same clonal line. After 3 days, polyps were checked for attachment, and one healthy, attached polyp was retained in the dish; all others were removed. Three replicate culture plates were used for each species for a total of 36 biological replicates (polyps) per species. The experimental culture plates were placed in an incubator with the lights off. Temperature was gradually increased starting from 21°C and increasing at 1°C per day. 21°C was the average temperature of the culture conditions in the facility where long-term cultures were kept. This acclimation temperature was selected to minimize baseline physiological stress of the polyps prior to the start of chronic temperature acclimation experiments. One 12-well culture plate populated with 12 polyps/species was used as the control and maintained in an incubator at 21°C with the lights off for the duration of the experiment. Polyps were fed approximately 10 A. salina nauplii and 15 rotifers per well every third morning (every 2°C increase) for 2–3 h. Complete water changes were performed after feeding. Water for all cultures was made using natural filtered seawater adjusted to the target salinity of 33 ppt using Instant Ocean sea salt. Water was pre-warmed in the incubators to the target temperatures before each water change. Water parameters were checked with a YSI to maintain accuracy. Temperature inside the incubators was logged using HOBO Onset temperature and light loggers. Polyps were observed under a Leica dissecting microscope every 2°C increment until their response scores reached 3, then they were observed at every 1°C increment. Polyps were scored for signs of stress according to a 5-point scale based on their tentacle morphology and response to stimuli (Table 1). A metal probe or plastic pipette tip was touched to the tentacles and body of each polyp to evaluate response to stimuli (Figure 1). The temperature, response score of each polyp, and number of polyps in each well was recorded. Any independent child polyps or free-swimming ephyra were removed. Polyps were considered to have reached the lethal endpoint when they lost tissue integrity at a response score of 1, which was defined as the absence of recoil by the tissue upon prodding the polyp body with a probe. The experiment was then repeated, but with decreasing temperature. Temperature was gradually decreased starting from 21°C at 1°C per day. Polyps were cultured, fed, and monitored in the manner described for increasing temperature.
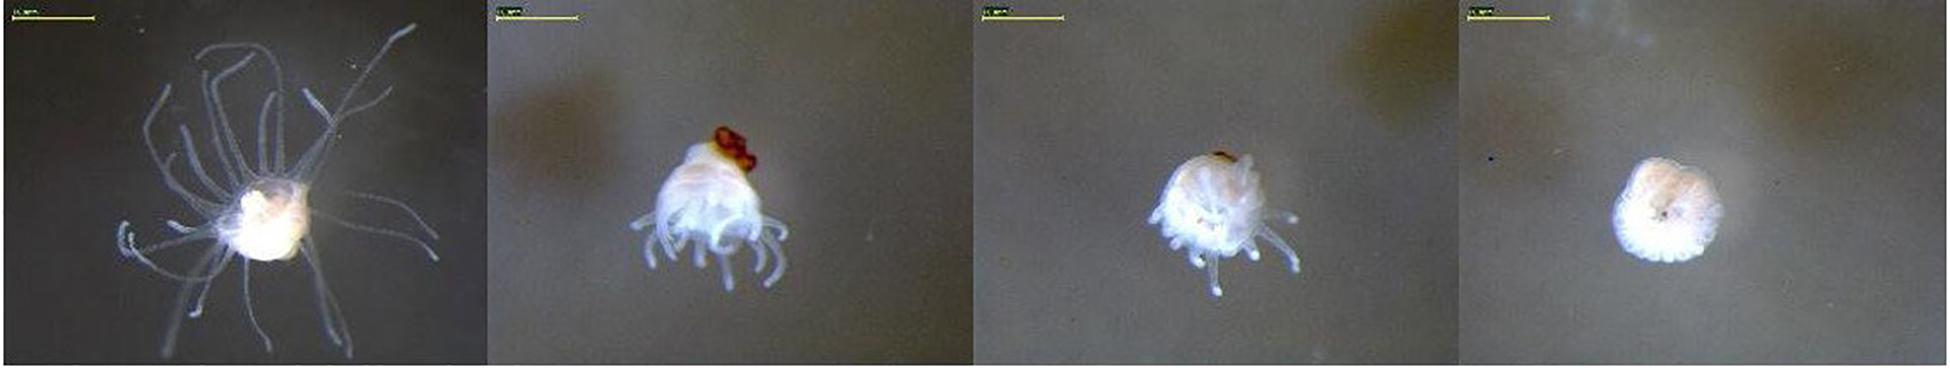
Figure 1. Examples of response scores of Aurelia sp.1 polyps. Response to stimuli is in decreasing order from left to right 5-1. A response score of 5 indicates optimal polyp response; a response score of 1 indicates compromised tissue integrity (refer to Table 1 for a complete definition of response scores).
Calculating Chronic Lethal Thermal Limits (CLMax and CLMin)
The CLMax for each species was determined by averaging the temperatures at which each polyp reached the lethal endpoint using the equation:
Where Tendpoint is the temperature at which polyps had a response score of 1 during the CLMax trials, and n is the sample size. The CLMin for each species was calculated using the same equation but using data from the CLMin trials.
Critical Thermal Maximum (CTMax)
Fifty to one hundred healthy polyps of each Aurelia species were transferred from different locations in the master cultures to 700 ml containers with 33 ppt water and aeration. Each species was placed in an incubator and kept at 21°C for 2 weeks for acclimation. 21°C was used as the acclimation temperature to approximate the average winter sea temperature along the shelf of the northern GoM (Boyer et al., 2011) where natural polyp populations may be located. Polyps were fed ad libitum with newly hatched A. salina nauplii twice a week for 24 h. Lights were off in the incubator. Water was changed in the containers on the day following feeding. Polyps were starved for 24 h before CTMax experiments. 5 polyps per well and 10 polyps per species were placed into 24.1 mm diameter propylene wells with 420 μm mesh bottoms (TedPella). Wells were inserted into foam so that they would float and placed into a thermostable water bath with vigorous aeration. Salinity and temperature parameters were maintained the same as during acclimation. Polyps were allowed to settle for 24 h at 21°C. Temperature was increased at a rate of 1°C/15 min. Each polyp’s response to stimuli was evaluated at every 1°C by touching the tentacles with a metal probe. If no response was observed, the polyp body was touched with the metal probe. Response to stimuli was observed under a Leica dissecting microscope due to polyps’ small size. Water bath temperature was measured using a digital thermometer immediately prior to removing the polyps from the water bath for observation. Individual wells were carefully scooped with the surrounding water from the water bath using a plastic container and placed under the microscope. When no response to the stimuli from either tentacles or polyp body was observed, the polyp was considered to have reached its endpoint and the temperature of the water bath was recorded as the thermal maximum of the polyp. Salinity was maintained at 33 ppt for the duration of the experiment, while dissolved oxygen concentration and pH were both monitored to ensure consistent levels.
Calculating Critical Thermal Maximum (CTMax)
The CTMax for each species was calculated by averaging the temperatures at which polyps lost response to stimuli using the equation:
Where Tendpoint is the temperature where polyps lost response to stimuli and n is the sample size. Intraspecific variability of the CTMax was determined by calculating the coefficient of variation given as a percentage for each species, using the equation: (standard deviation/mean)∗100.
Chronic Salinity Acclimation Range and CLSMin
For each Aurelia species, three non-asexually reproducing polyps were placed in each well of a 12-well culture plate with 7 ml of seawater at a salinity of 33 ppt and allowed to attach. After three days, polyps were checked for attachment. One healthy attached polyp was retained in the dish, while the others were removed. Two replicate culture plates were used for each species, with a total of 24 polyps per species. Culture plates were placed in incubators at 19°C, which is the winter average ocean temperature of the northern GoM coast (Boyer et al., 2011). The specific temperature approximates winter thermal conditions of estuaries, bays, and the coastline of the region, where potential habitats for coastal polyps are likely located. Lights were off in the incubators. Salinity was increased by 1 ppt a day, by completing a water change with water of the appropriate salinity. Eight polyps of each species were used for the control and maintained in an incubator at 19°C and salinity of 33 ppt. Water for all cultures was made using natural filtered seawater adjusted to the target salinities using Instant Ocean sea salt. Water was pre-warmed in the incubator to 19°C and water parameters were verified with a YSI prior to water changes. Temperature inside the incubator was logged using HOBO Onset temperature and light loggers. Polyps were fed approximately 10 A. salina nauplii and 15 rotifers per well once a week for 2–3 h. Complete water changes were performed after feeding. Polyps were observed for data collection under a Leica dissecting microscope at every 2 ppt increment until their response scores reached 3, then they were observed at every 1 ppt increment. Polyps were scored for visible stress level according to the 5-point response score scale defined above (Table 1). A metal probe or plastic pipette tip was used to touch tentacles and body of each polyp to evaluate response to stimuli. The salinity, response score of each polyp, and number of polyps in each well were recorded. Any independent child polyps or free-swimming ephyra were removed. Polyps were considered deceased when they lost tissue integrity, defined as the absence of recoil by the tissue upon prodding the polyp body with a probe, at a response score of 1. The experiment continued until all polyps reached a response score of 1. The experiment was then repeated, but with decreasing salinity. Salinity was gradually decreased by 1 ppt per day starting from 33 ppt. Water of target salinity was made by adjusting natural filtered seawater to target salinities using deionized water. Water quality monitoring, feedings and data collection were performed as described for increasing salinity.
Calculating Chronic Lethal Salinity Limits (CLSMin)
The CLSMax could not be determined because polyps’ tolerance exceeded the range of the YSI (42 ppt). The CLSMin for each species was calculated by averaging the lethal endpoint salinities for each species from the decreasing salinity trial using the equation:
Where Sendpoint is the salinity where polyps lost tissue integrity at a response score of 1, and n is the sample size.
Results
Identification Through Molecular Barcoding
Cytochrome c oxidase subunit I sequences were approximately 650 bp in length, which is a standard length for Aurelia COI. ITS1 sequences were around 600 bp. Polyps from coastal medusae collected in Galveston Bay were confirmed to be Aurelia sp. 9 according to COI with a Percent Identity of 99.83% and an E-value of 0. Polyps that had been provided by the Moody Gardens Aquarium belonged to A. coerulea based on COI with a Percent Identity of 100% and E-value of 0. For the offshore Aurelia species, top BLASTn matches for mitochondrial COI were to A. relicta (Accession number KX691571), with a Percent Identity of 91.33% and an E-value of 0. The top match for nuclear ITS1 was Aurelia sp. Incheon with a Percent Identity of 84.70% and E-value of 1e-158. Aurelia sp.5 (A. relicta) was also among the top 5 database matches and had a higher Percent Identity of 88.65% and an E-value of 5e-122. Since we are unable to identify the offshore Aurelia to any known Aurelia species, we refer to this strain as Aurelia sp. new. A multigene phylogenetic analysis to clarify the phylogenetic position of A. sp. new within the genus is in progress, but outside the scope of this paper.
Chronic Thermal Acclimation Limits (CLMin and CLMax)
Polyps of A. coerulea maintained an average response score of 5 from 8°C to 27°C. At temperatures above 27°C, the response scores decreased from 5 to 1 over a span of 3°C. Below 8°C, the response scores of A. coerulea polyps decreased to 3 at 5°C. A. coerulea polyps did not show visible changes in stress level from 5°C down to 0°C, but response scores fell from 3 to 1 when temperatures decreased from 0°C to –2°C. Loss of response to stimuli occurred at about –1°C (Figure 2). For A. coerulea polyps, the CLMax was 30.9°C and the CLMin was –2°C; all polyps of this species reached the endpoint at the same temperature during the experiment with decreasing temperature (Table 2). The thermal range for A. coerulea spanned 32.9°C.
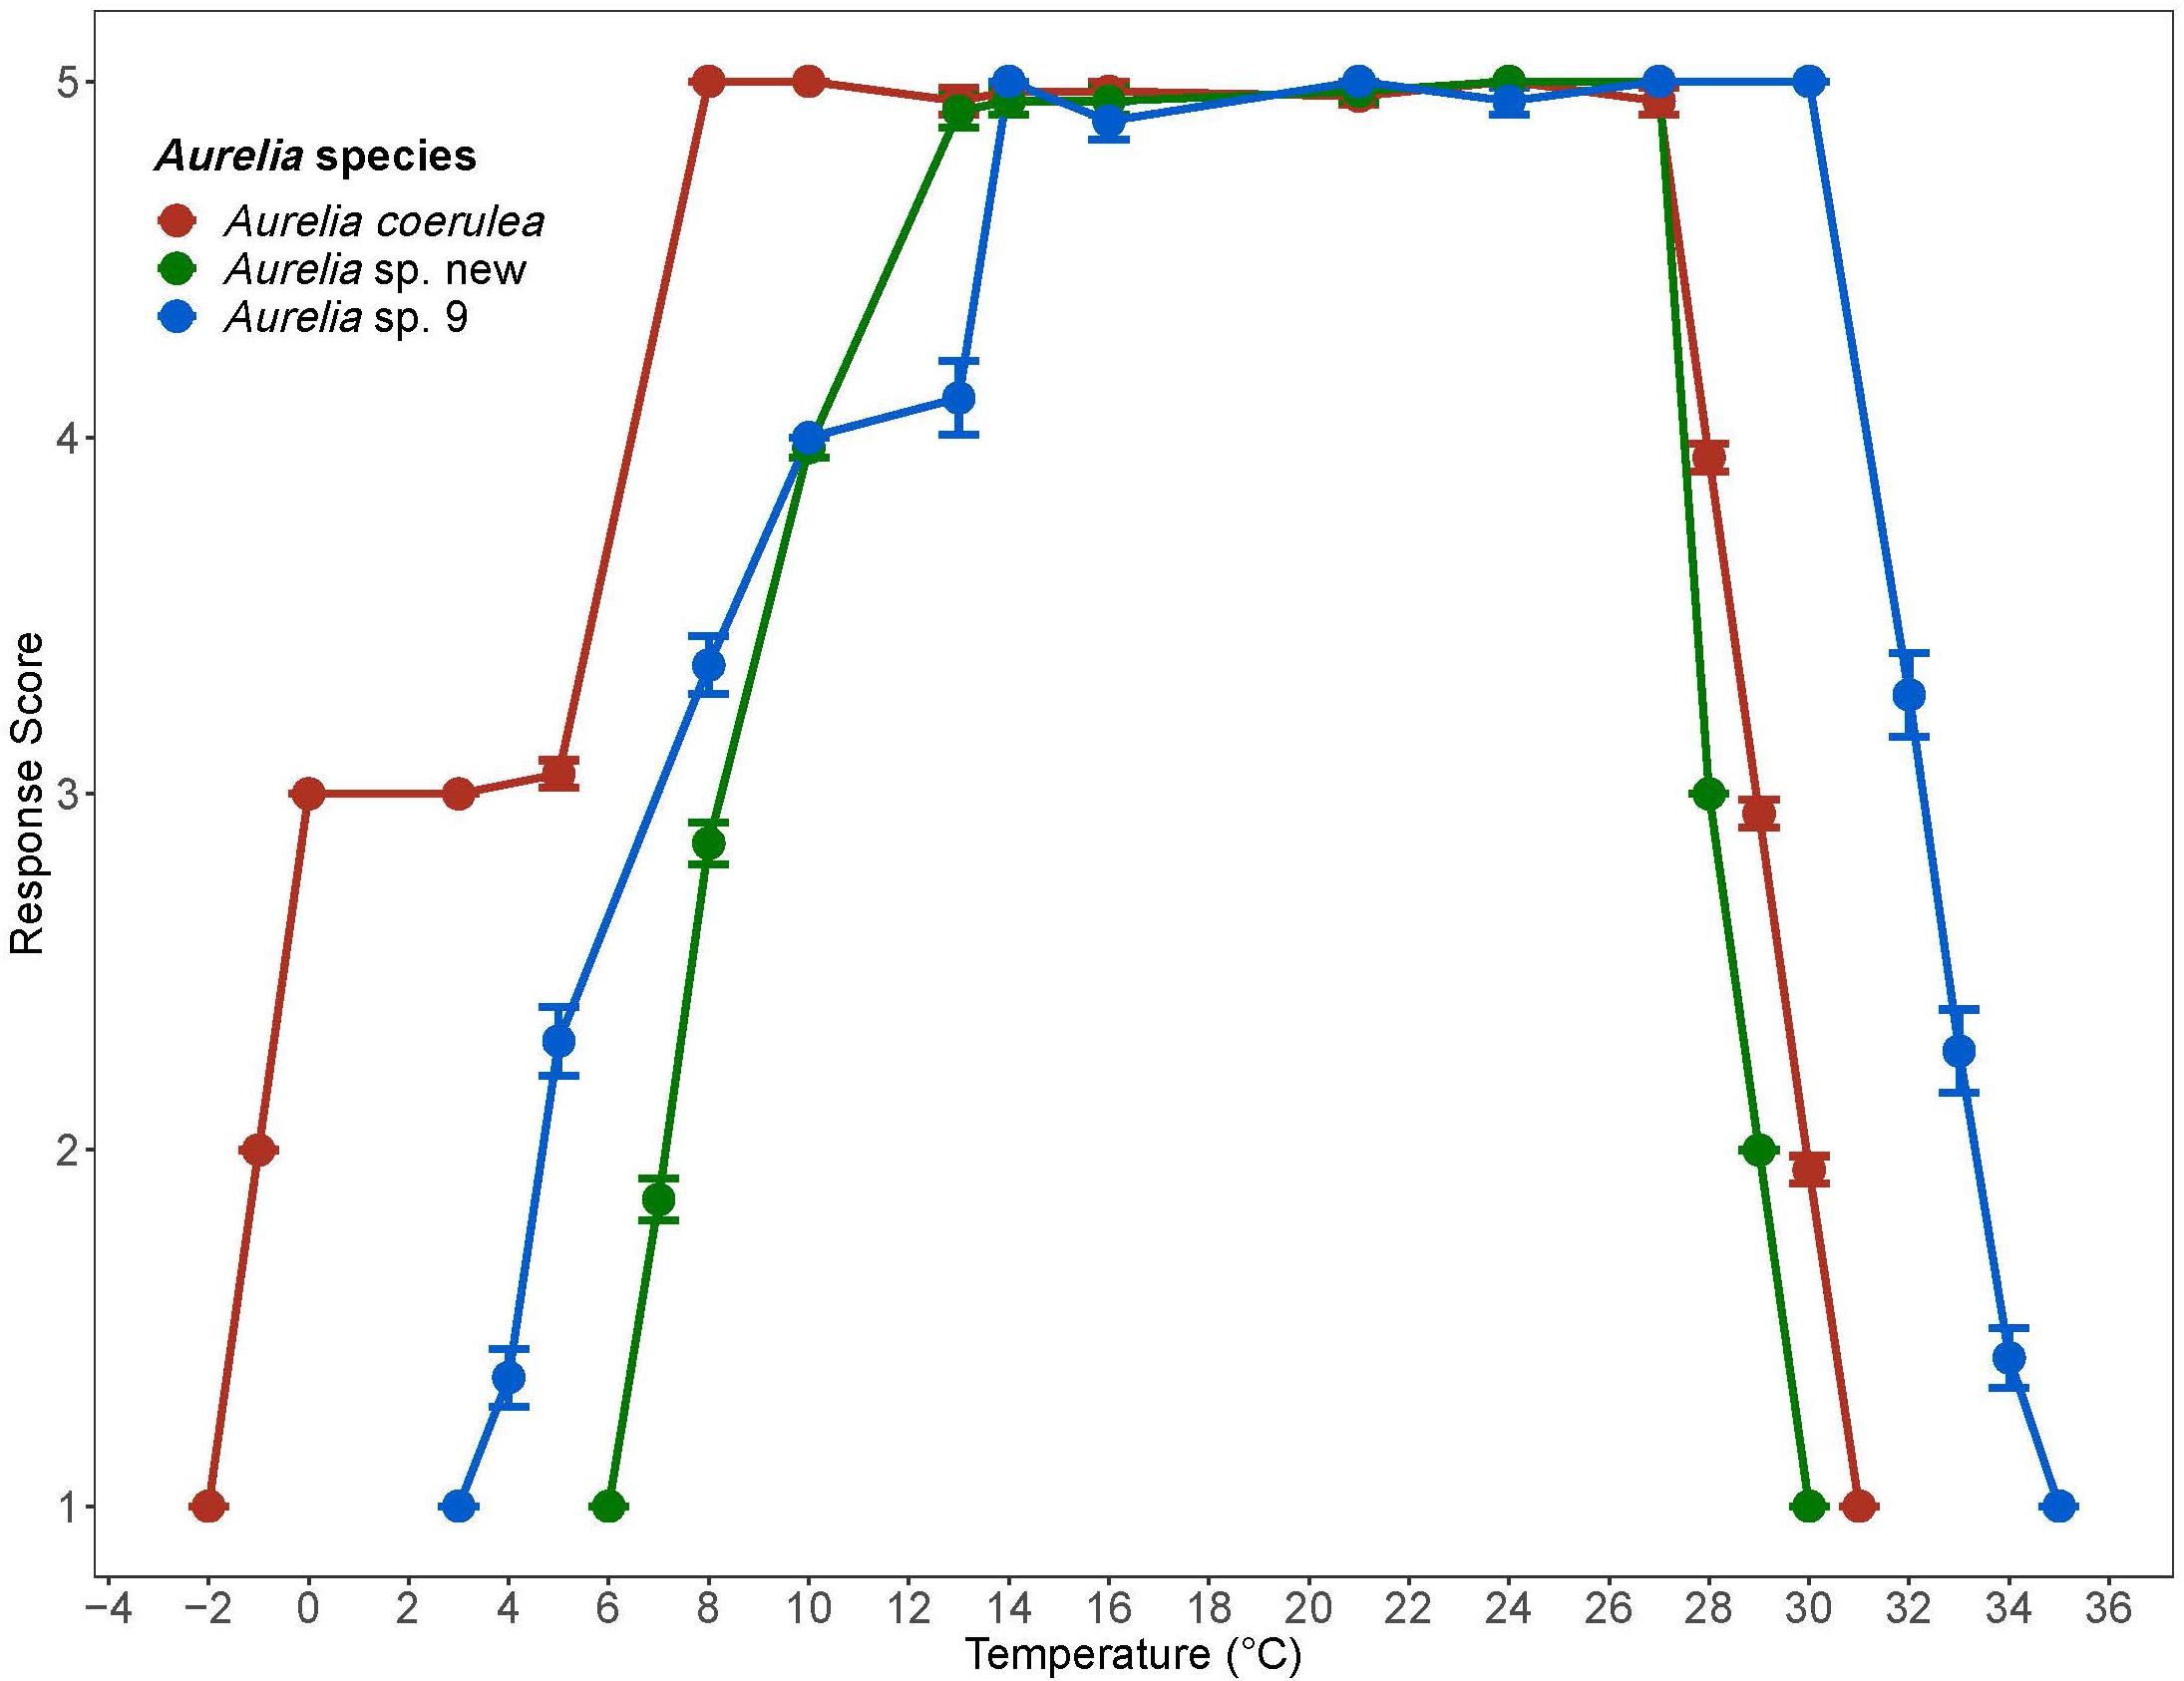
Figure 2. Response scores of Aurelia species during 1°C/day temperature change. Response scores 1-5 are described in Table 1. Temperature is in degrees Celsius (°C). Error bars display standard error. Colors correspond to Aurelia species: red is Aurelia coerulea, green is A. sp. new, and blue is A. sp. 9.
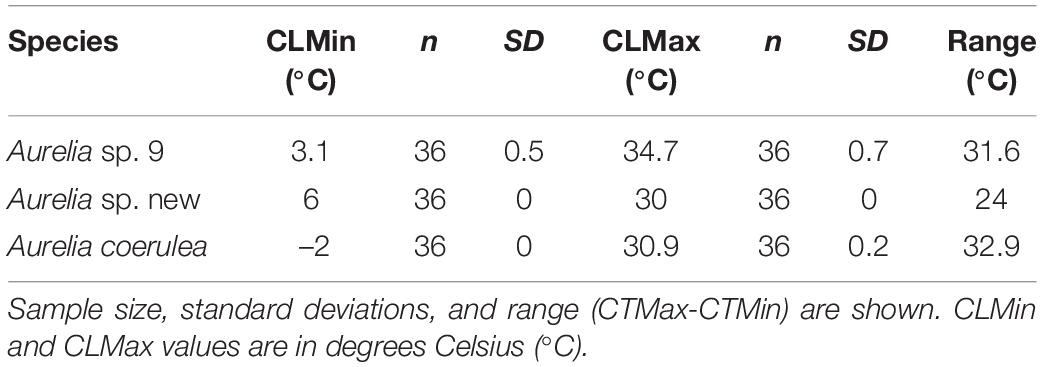
Table 2. Chronic lethal temperature limits for three Aurelia species: Chronic Lethal Minimum (CLMin) and Chronic Lethal Maximum (CLMax).
Polyps of Aurelia sp. new maintained an average response score of 5 from 13°C to 27°C. At temperatures above 27°C, the response scores decreased from 5 to 1 over a span of 2°C. Below 13°C, response scores decreased to 4 by 10°C, and steadily to 1 at 6°C. Loss of response to stimuli occurred at about 7°C (Figure 2). For Aurelia sp. new polyps, the CLMax was 30°C and the CLMin was 6°C; all polyps of this species were observed to reach their endpoints at the same temperatures (Table 2). The thermal range for A. sp. new spanned 24°C.
Polyps of Aurelia sp. 9 maintained an average response score of 5 from 14°C to 30°C. At temperatures above 14°C, polyps’ response scores decreased from 5 to 1 over a span of 5°C. Below 14°C, response scores decreased to 4 by 10°C, and to 1 at 3°C. Loss of response to stimuli occurred at about 5°C (Figure 2). For Aurelia sp. 9 polyps, the CLMax was 34.7°C and the CLMin was 3.1°C (Table 2). The thermal range for A. sp. 9 spanned 31.6°C.
Polyps in the control groups maintained response scores of 4 or above throughout the experiment. Results for the control polyps can be found in Supplementary Material S1.
Critical Thermal Maximum (CTMax)
Polyps of Aurelia sp. 9 had the highest thermal tolerance with a CTMax of 37.2°C. The first polyp lost response to stimuli at 34°C, but most polyps lost their response to stimuli above 37°C with the most tolerant polyps retaining response until 38.4°C. Intraspecific variation for Aurelia sp. 9 was 4.0%. Aurelia sp. new polyps had a CTMax of 32.1°C with 0% intraspecific variation (all lost response to stimuli at the same time and at the same temperature). A. coerulea polyps were the least tolerant to high temperatures with a CTMax of 29.6°C. The first polyps lost response to stimuli at 28.7°C. One polyp tolerated temperatures up to 31.8°C. Intraspecific variability for A. coerulea was 4.1%. Results for CTMax experiments are summarized in Table 3.
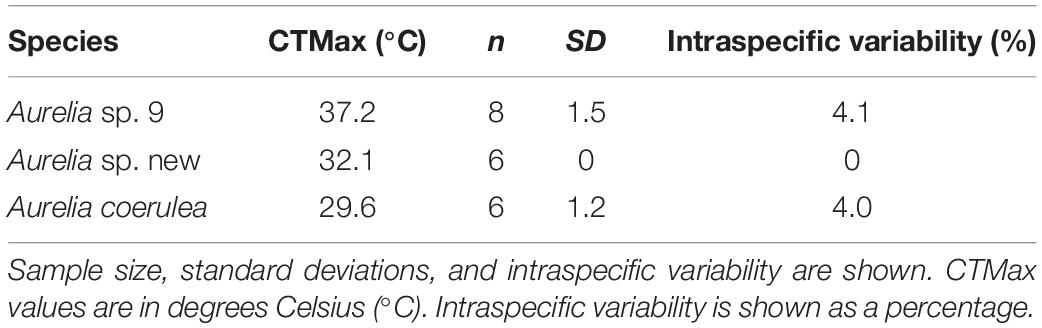
Table 3. Critical Thermal Maximum (CTMax) values for three Aurelia species.
Salinity Acclimation Range and CLSMin
Aurelia coerulea polyps maintained an average response score of 5 down to about 12 ppt, with response scores falling below 4 at approximately 11 ppt. Polyps lost response to stimuli at about 7 ppt and tissue integrity at 6 ppt. CLSMin for A. coerulea was 6.2 ppt. Aurelia sp. new maintained response scores of 5, with no signs of visible stress, down to a salinity of 18 ppt, and response scores of 4 or above to 15 ppt. Polyps lost response to stimuli at about 12 ppt and tissue integrity at 10 ppt. The CLSMin for Aurelia sp. new was 10 ppt. Aurelia sp. 9 polyps maintained response scores of 5 at 10 ppt, and response scores of 4 or above to approximately 7 ppt. Polyps lost response to stimuli at about 4 ppt and lost tissue integrity at 2 ppt. The CLSMin for Aurelia sp. 9 was 2.2 ppt. CLSMin values are summarized in Table 4. In the chronic salinity acclimation experiment with increasing salinities, polyps of all three species maintained optimal response scores to a salinity of 42 ppt, which was the measurement limit for the YSI salinity meter. The upper acclimation limit for salinity and the CLSMax could not be determined but exceeds ecologically relevant values for the GoM. Polyps in the control groups maintained average response scores of 4 or above for the duration of the experiment. Results for the control polyps can be found in Supplementary Material S1.
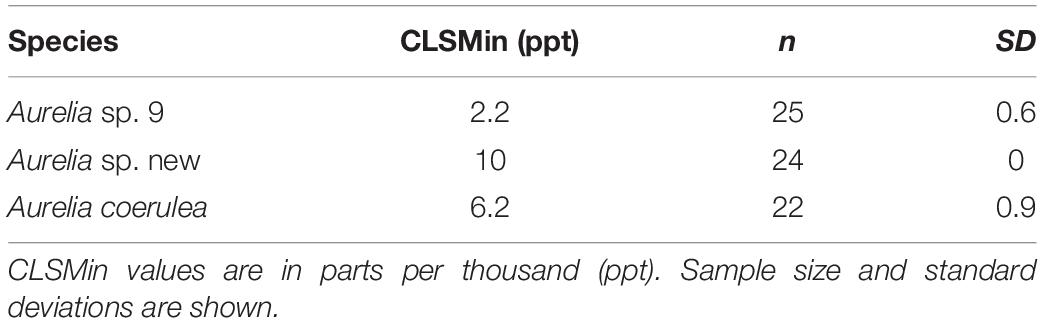
Table 4. Chronic Lethal Salinity Minimum (CLSMin) for three Aurelia species.
Discussion
Environmental changes associated with climate change drive species range shifts. General trends across the globe reveal that species respond to warming ocean temperatures by shifting pole-ward (Thomas, 2010). However, in the GoM, the North American continent forms a physical barrier limiting species’ northward movement. Due to their complex life cycle, the success of jellyfish species depends on the ability of the polyp, ephyra, and jellyfish life-stages to tolerate future conditions. Since it is the polyp stage that is responsible for maintaining and expanding jellyfish populations between seasons and years, species’ success is influenced by the ability of the polyp to tolerate temperature increases.
The offshore Aurelia species may be a new species as it was not represented among GenBank COI or ITS1 sequences. Additional molecular and morphological analyses are required to confirm the identity of Aurelia sp. new as a distinct species. Only two Aurelia species have been previously reported in the GoM: A. sp. 9 and A. c.f. sp. 2 (Chiaverano et al., 2016).
Aurelia coerulea, Aurelia sp. new, and Aurelia sp. 9 possess distinct thermal tolerance ranges and thermal limits (Table 2). More specifically, the thermal ranges of the invasive species A. coerulea and Aurelia sp. 9 are of similar size, differing only by 1.3°C based on lethal limits. The response scores of both species show a similar trend, as both maintained response scores of 5 over a 21°C span (Figure 2). However, A. coerulea has a lower thermal tolerance with its experimental thermal tolerance range shifted by about 4°C relative to that of Aurelia sp. 9, suggesting a preference for cooler temperature. This is also reflected in the climate of its native geographical origin in the South and East China Seas. The thermal range of Aurelia sp. new is approximately 8°C narrower than that of A. coerulea and A. sp. 9 (Figure 2), suggesting that polyps of this species may prefer thermally stable conditions. CLMax values and visible stress as measured by response scores suggest that A. coerulea and A. sp. new may have similar upper thermal limits. Control polyps that were kept at a constant temperature but otherwise treated in an identical manner, maintained high response scores for the duration of trials, indicating that the observed lethal limits were due to thermal stress.
Unlike Aurelia sp. 9 and sp. new, polyps of A. coerulea have been found in the wild (Ishii and Katsukoshi, 2010; Marques et al., 2019). Interestingly, the experimentally resolved temperature range where polyps of A. coerulea maintained minimal signs of stress (response scores of 4 or above) determined in this study align well with published reports of the habitat temperatures for this species derived from field surveys of wild populations. According to our experiments, A. coerulea polyps experienced minimal stress from 6.5°C to 27°C, whereas natural polyp habitats in the Thau Lagoon (northwestern Mediterranean) range from 7.6°C to 25.8°C (Marques et al., 2019), 6°C to 30°C for polyps in Lake Verano, Italy (Belmonte et al., 2011), and 9°C to 29°C for A. coerulea in Tokyo Bay, Japan (Ishii and Katsukoshi, 2010). These are the minimum and maximum recorded water temperatures of wild populations surveyed over the span of approximately 1 year (Ishii and Katsukoshi, 2010; Marques et al., 2019).
The thermal range of A. coerulea suggests that it is unlikely to develop a resident population within the coastal GoM. Winter low temperatures along the northwestern and northeastern coasts of the GoM average 13–20°C (averaged from https://www.nodc.noaa.gov/dsdt/cwtg/all_meanT.html), which is well above the lower thermal tolerance limit of –2°C (CLMin) for A. coerulea. However, with a CLMax of 30.9°C, this species may be restricted by the summer water temperatures along parts of the northwestern and northeastern GoM coasts, which average 28–31°C (averaged from https://www.nodc.noaa.gov/dsdt/cwtg/all_meanT.html). Summer average temperatures in the coastal GoM are thus likely to be lethal to A. coerulea whose response scores indicated damaging levels of thermal stress at temperatures above 27°C.
Aurelia sp. 9, the common-bloom forming Aurelia species in the GoM, had a thermal tolerance range of 3.1°C to 34.7°C based on lethal limits and displayed minimal signs of stress between 10°C and 31°C. Monthly annual averages for coastal western and eastern GoM range from 13°C to 31°C suggesting that, from a thermal perspective, the conditions of bays, marinas, and coastlines are suitable habitats for Aurelia sp. 9 polyps. Out of the three species evaluated, Aurelia sp. 9 was tolerant of temperatures at least 3°C higher than the other two species. Aurelia sp. new had the narrowest thermal range of 24°C, and displayed signs of stress outside of the range of 10°C to 27°C. The upper lethal thermal limit of Aurelia sp. new (CLMax = 30°C) suggests that it may also not be able to tolerate the summer high temperatures observed along the northern GoM coast. However, the temperatures in the deeper waters along the continental shelf in the GoM where the medusa of this species was collected, are generally lower than the coastal summer averages, so it is possible that Aurelia sp. new is restricted to offshore areas.
We used the CTM to identify CTMax for each species to resolve the relative upper thermal limits of the Aurelia congeners (Table 3). CTMax values confirm that Aurelia sp. 9 is more tolerant of high temperatures than both A. coerulea and Aurelia sp. new. A. coerulea had the lowest CTMax among the congeners, indicating this species to be the least tolerant of high temperatures, which is reasonable considering the generally lower temperatures of its native range as compared to the GoM. Fast rates of warming, such as the 1°C/15 min rate used in this study to determine CTMax, may overestimate the actual upper thermal tolerance limits of organisms in nature (Peck et al., 2009). CTMax values are usually greater than CLMax values, because slower rates of warming in the chronic experiment allow more time at each temperature for lethal physiological effects to accumulate and set in. This relationship was observed for Aurelia sp. 9 and Aurelia sp. new, where CTMax values were about 2°C greater than CLMax values, but not for A. coerulea, where the CTMax was approximately 1°C lower than the CLMax (Figure 4). The lower CTMax may indicate that A. coerulea polyps are sensitive to rapid temperature changes.
Chronic salinity experiments show that polyps of all three species are generally able to withstand a wide range of salinities and are not sensitive to hypersaline conditions (Figure 3). Of the three species, Aurelia sp. 9, had the lowest CLSMin value of 2.2 ppt. Additionally, polyps of this species had no visible signs of stress during the 1 ppt/day salinity decrease until salinity dropped below 10 ppt, suggesting that A. sp. 9 polyps are tolerant of low salinities and salinity change. When considered together with the high thermal tolerance of this species, salinity tolerance results suggest that coastal areas of the GoM as well as some bays and estuaries in this region, are suitable habitats for polyps of A. sp. 9. A. coerulea polyps had a CLSMin of 6.2 ppt with no visible signs of stress until salinity decreased below 14 ppt. Most wild populations of A. coerulea have been recorded at salinities above 20 ppt (Belmonte et al., 2011; Marques et al., 2019). Aurelia sp. new had a CLSMin of 10 ppt and was therefore the least tolerant of low salinities among the three species. Visible signs of stress were observed for polyps of this species at salinities below 18 ppt, suggesting possible low resilience to salinity change (Table 4). Compared to the two coastal species, Aurelia sp. new has a considerably more limited ability to withstand both temperature and salinity change, indicating that A. sp. new is an offshore species in the GoM.
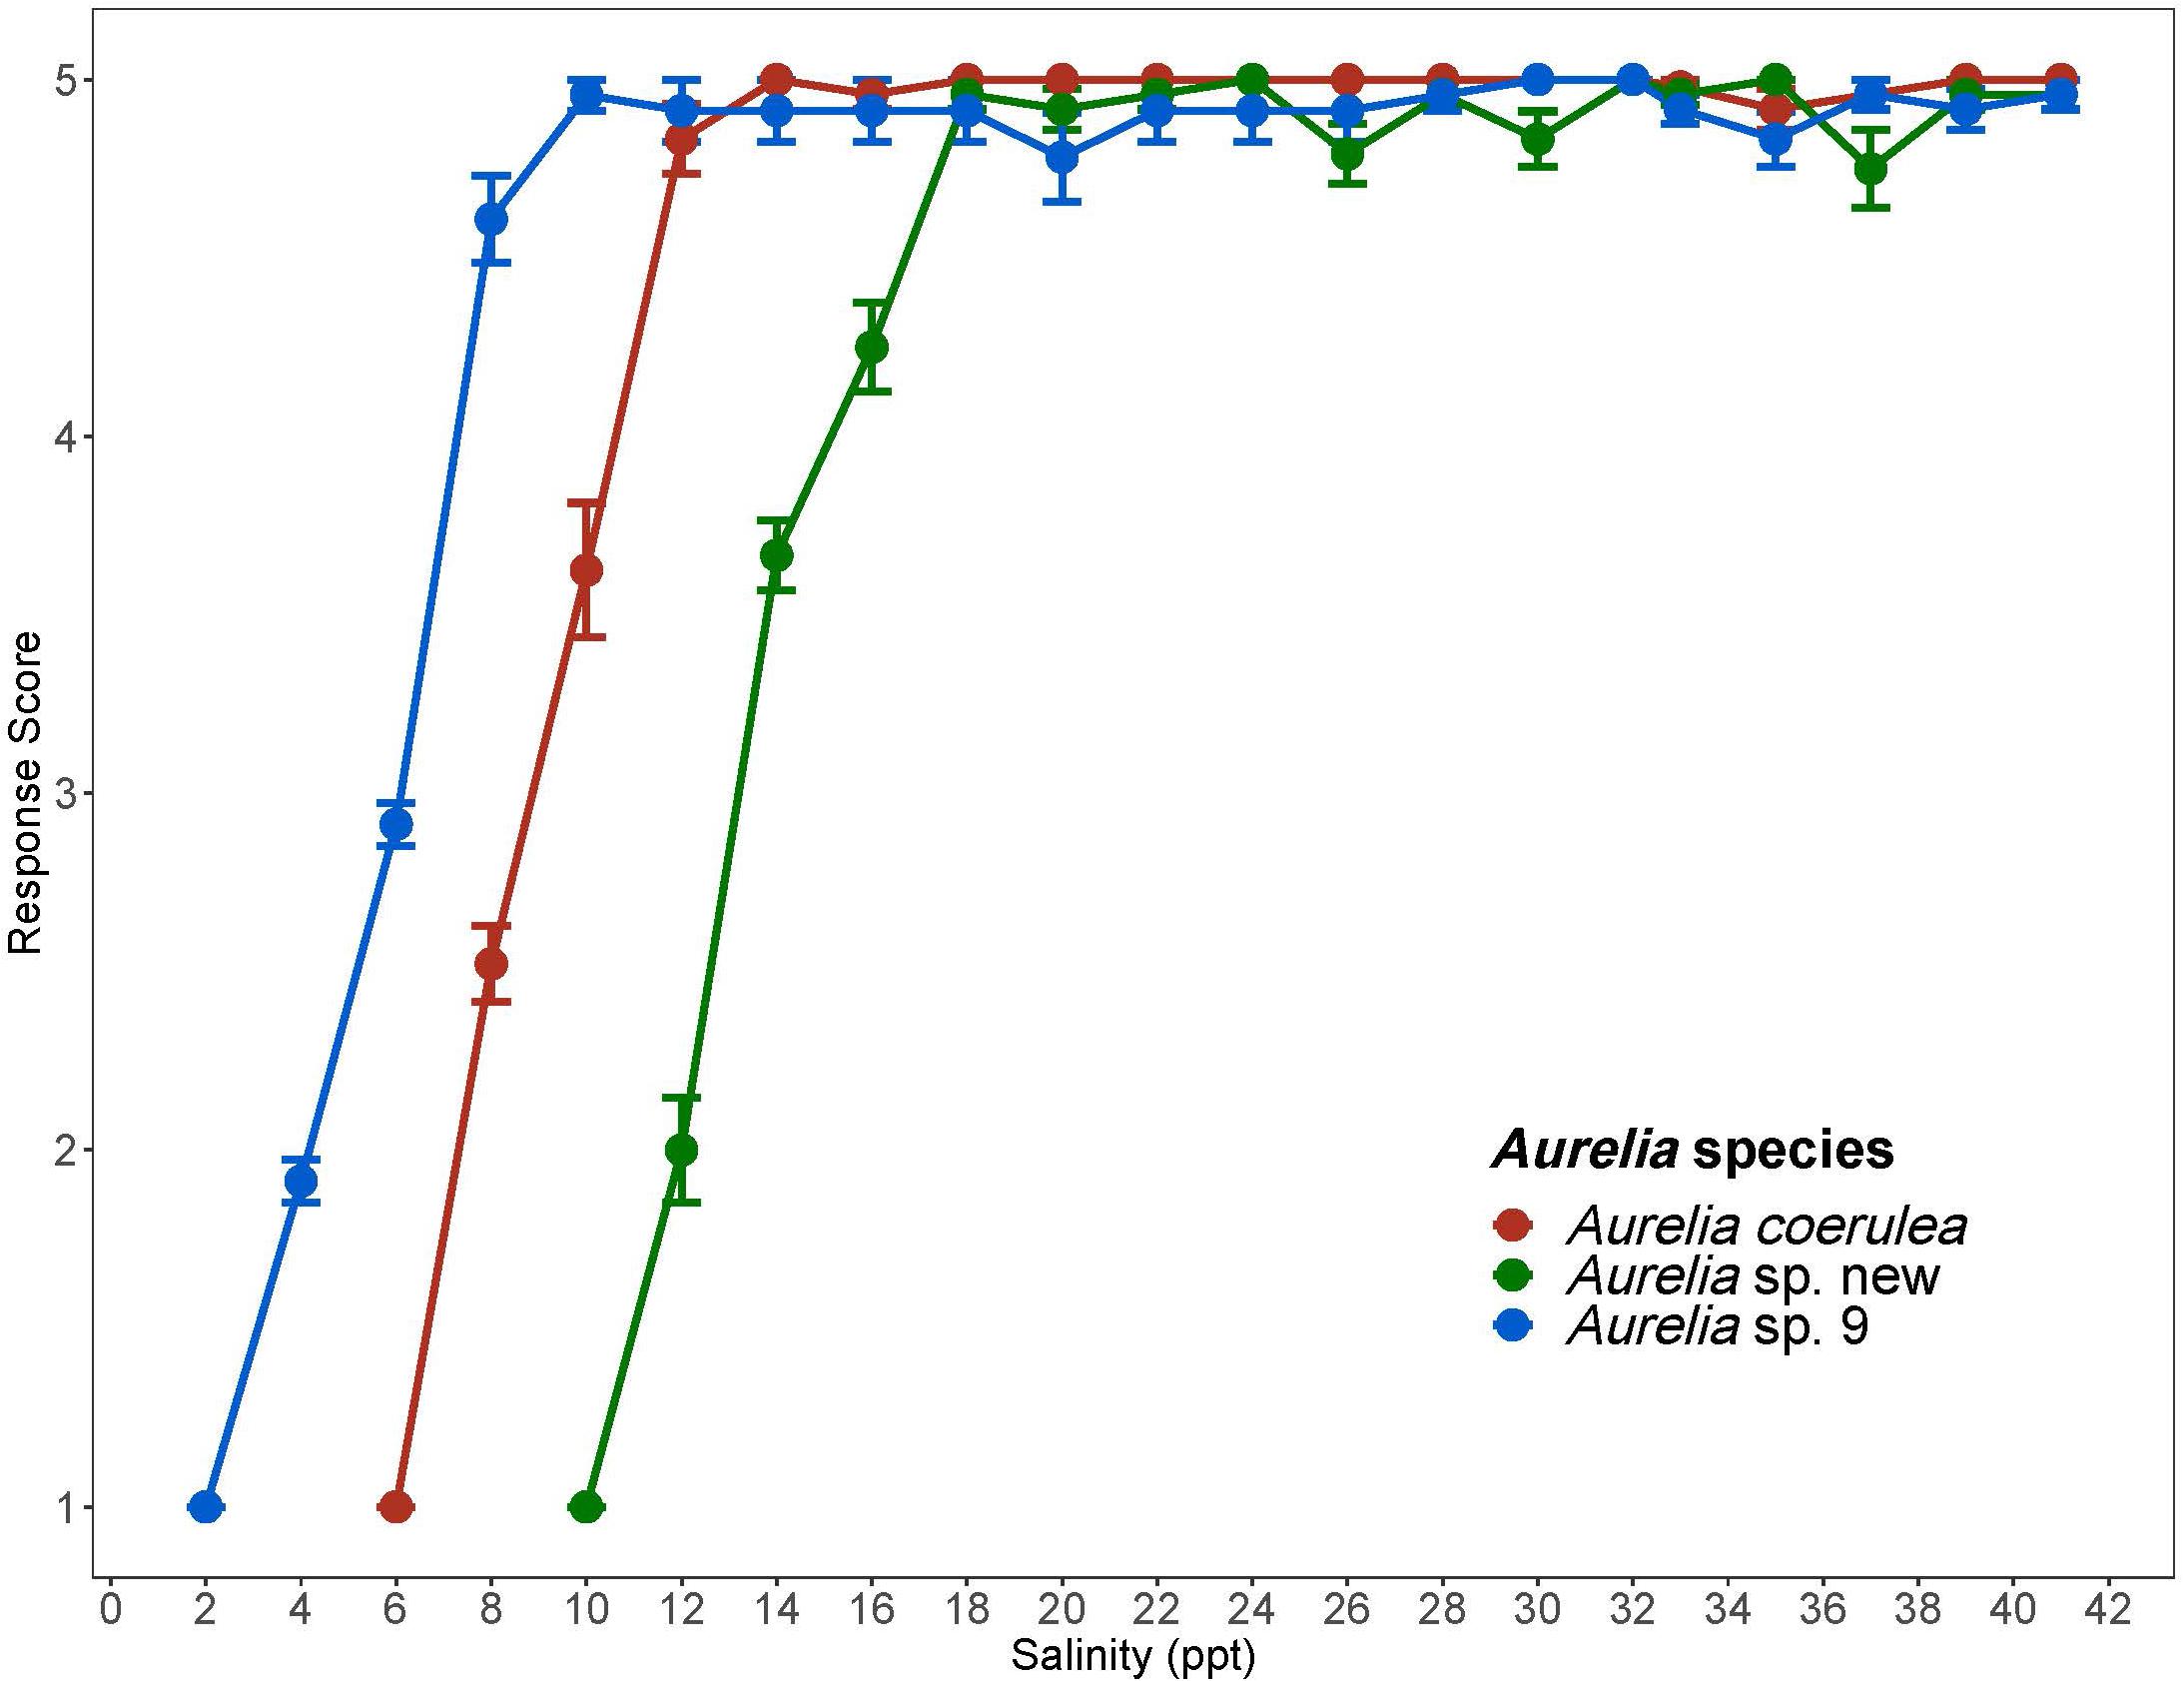
Figure 3. Response scores of Aurelia species in response to 1 ppt/day salinity change. Response scores 1-5 are described in Table 1. Salinity is in parts per thousand (ppt). Error bars display standard error. Colors correspond to Aurelia species: red is Aurelia coerulea, green is A. sp. new, and blue is A. sp. 9.
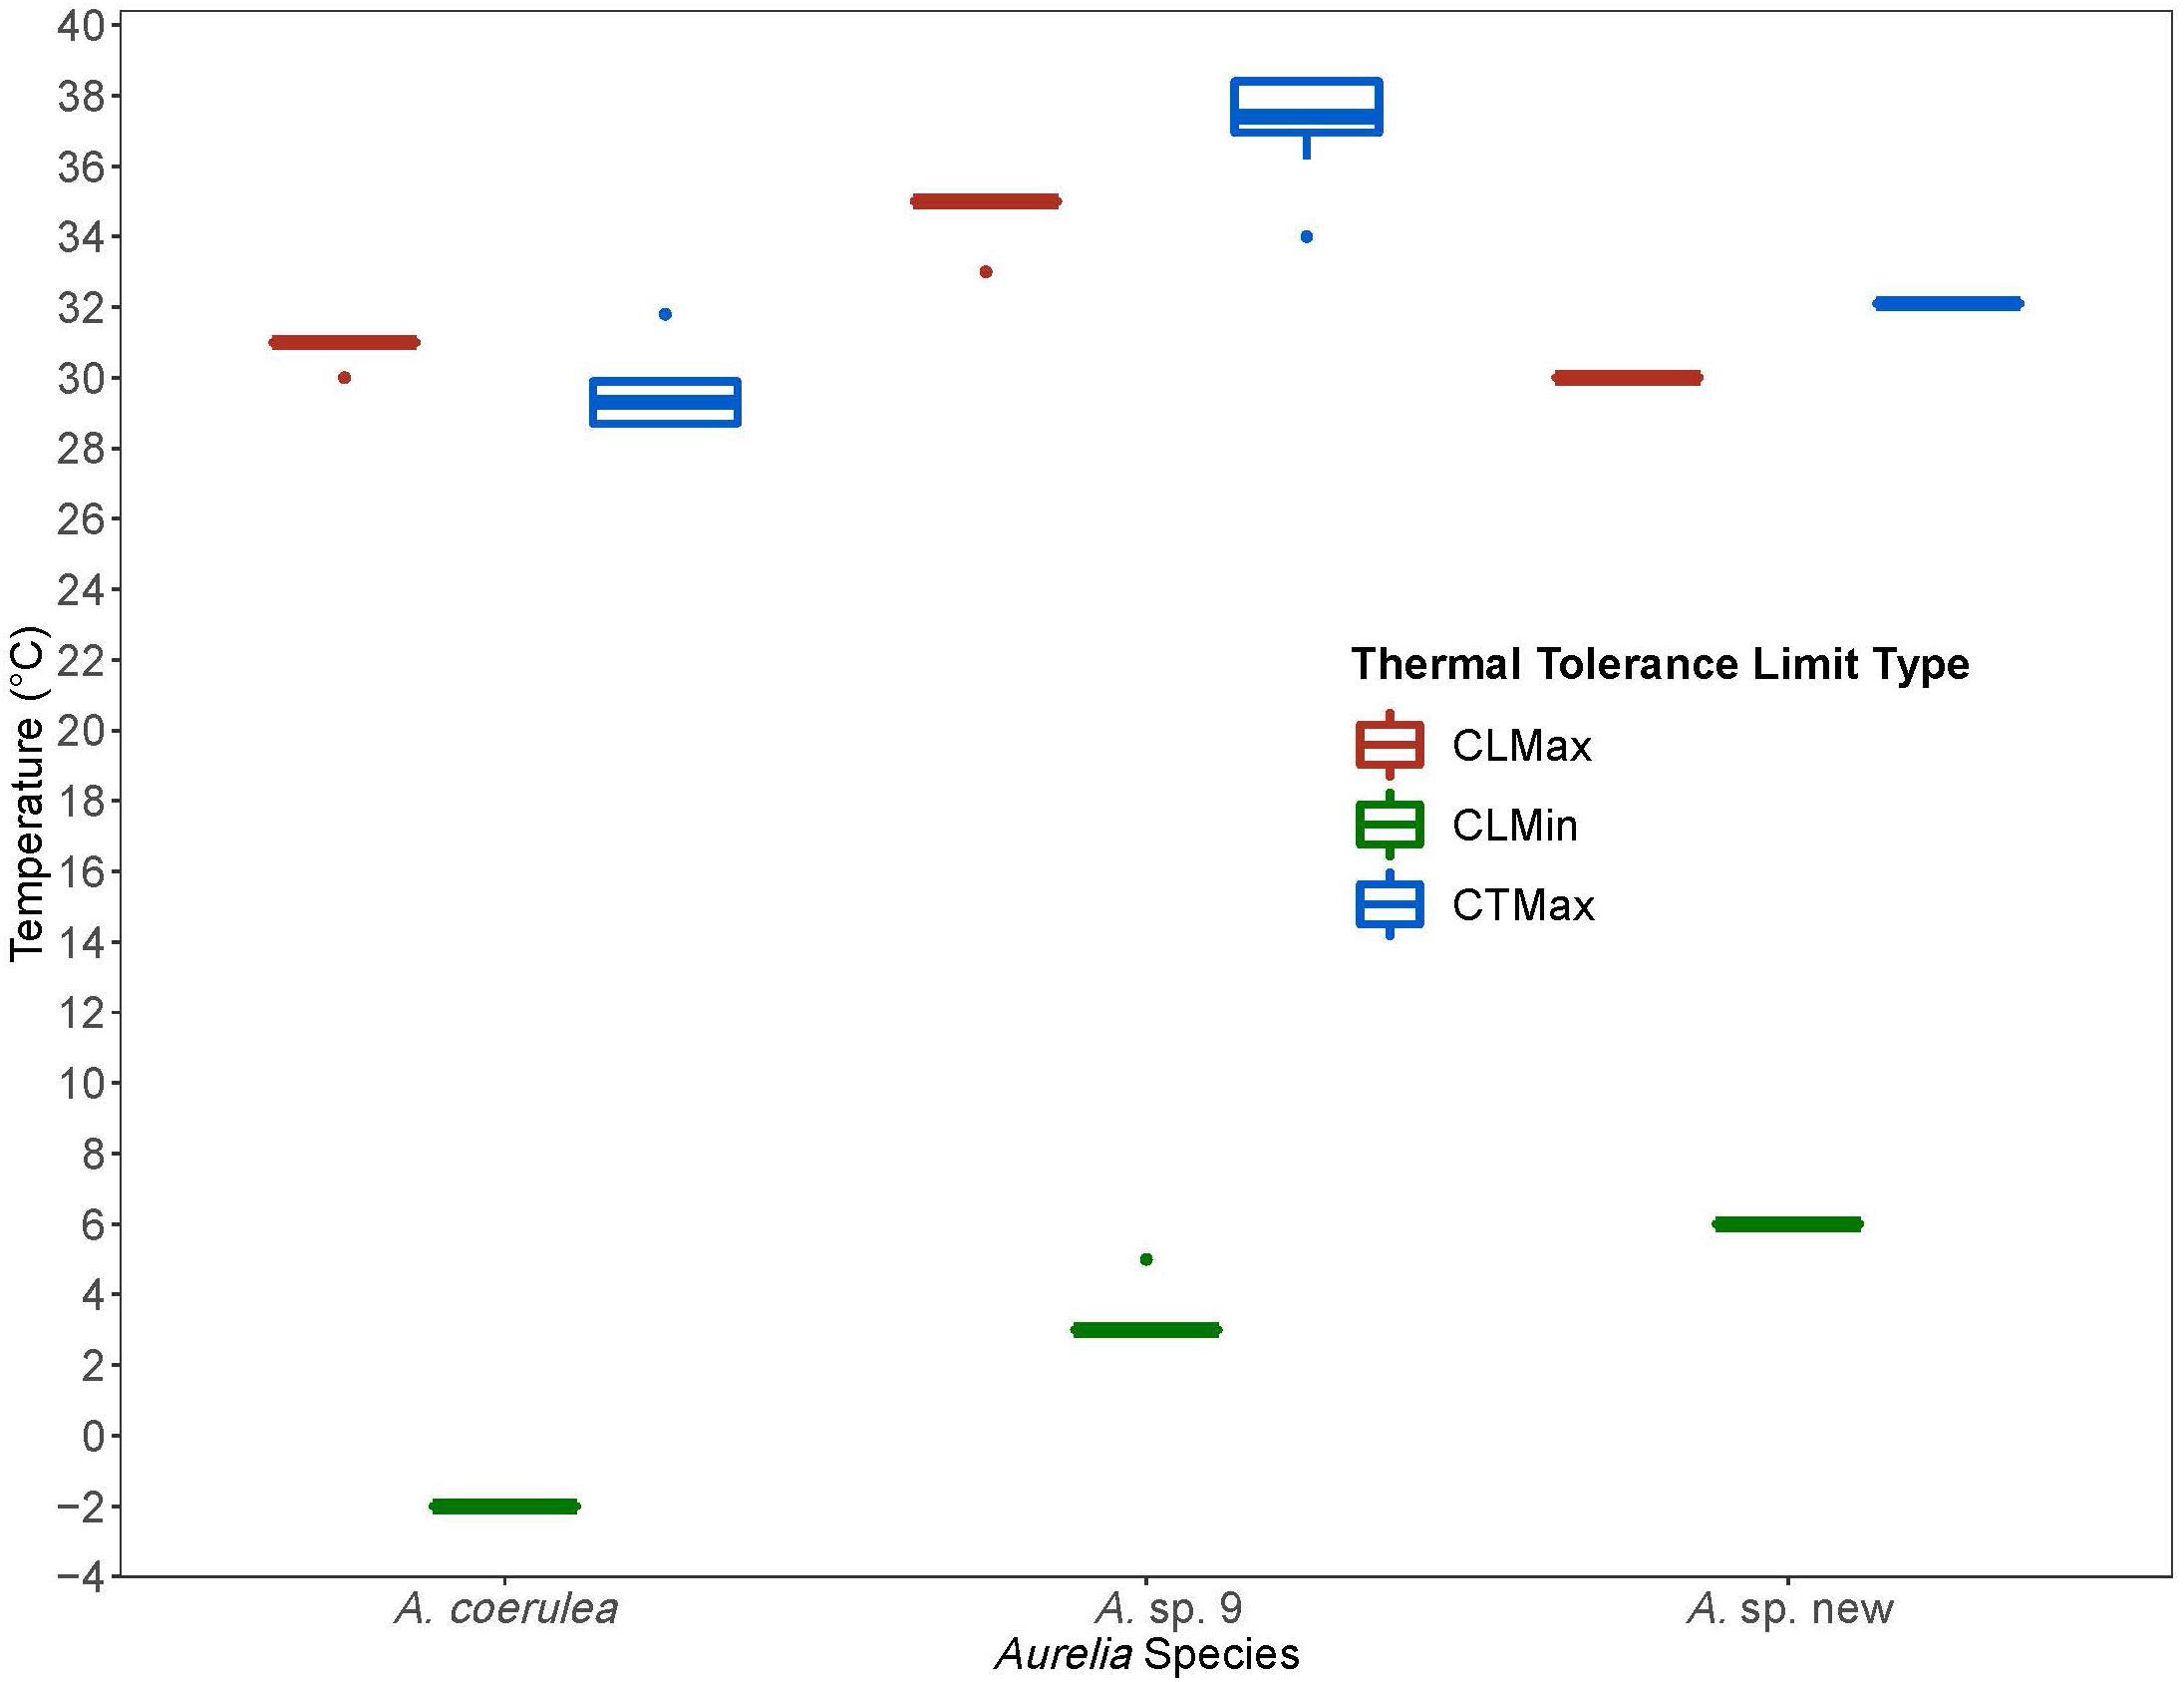
Figure 4. Comparison of thermal tolerance values from Chronic Lethal Maximum and Minimum and Critical Thermal Maximum experiments for Aurelia coerulea, A. sp. new, and A. sp. 9. Thermal limits are in degrees Celsius (°C). Colors designate thermal limit type: red is Chronic Lethal Maximum (CLMax), green is Chronic Lethal Minimum (CLMin), and blue is Critical Thermal Maximum (CTMax). Boxplots displays the median with the lower and upper hinges corresponding to the 25th and 75th percentiles and whiskers extending to 1.5 times the inter-quartile range. Single points indicate outliers.
Because of the difficulties in finding polyps in the wild, we acknowledge that we could not control or assess patterns of relatedness within the polyps used in our experiments. Additional molecular, morphological, and physiological studies are necessary to confirm the environmental tolerance results found here, especially for A. sp. new, where polyps were sourced from a single medusa and may not adequately reflect the genetic variation of the species.
The temperature and salinity tolerance ranges and limits of Aurelia congeners can be used to predict species’ responses to future conditions. Ocean surface temperatures are projected to increase by up to 4°C by the year 2100 (Biasutti et al., 2012), with benthic habitats becoming even warmer (Turner et al., 2017). A temperature increase of this magnitude may deter A. coerulea from invading or becoming established in the coastal GoM, as the upper thermal limit of this species is already at or below current summer average water temperatures. The temperature highs in the South and East China Seas (26–29°C) suggest that A. coerulea is currently living fairly close to its thermal limits in its native range, and may be especially at risk in enclosed habitats, which it is known to inhabit. Due to its similar upper thermal limits, Aurelia sp. new may also be negatively impacted overall. The Chronic Lethal Thermal upper limit (34.7°C) and Critical Thermal Maximum (37.2°C) of Aurelia sp. 9 suggest that it can withstand some increase in environmental temperatures. However, an increase of 4°C would bring water temperatures near the upper thermal limit for this species, which would potentially negatively impact Aurelia sp. 9 in the warmest extremes of its biogeographical range. Temperature increases are also expected to be greatest in coastal areas (Biasutti et al., 2012), indicating that coastal Aurelia sp. 9 populations would not benefit and may decline due to habitat temperature increase by the next century.
Data Availability Statement
The DNA sequence datasets for this study are deposited in GenBank, Accession Numbers MN531714 to MN531721 for COI and MN527964 to MN527966 for ITS1. Genetic data will be available through the Gulf of Mexico Research Initiative Information and Data Cooperative (GRIIDC). Thermal and salinity tolerance data is available in the Supplementary Material S2.
Author Contributions
AF and MM designed the experiments and wrote the manuscript. AF carried out the experiments.
Funding
This study was supported by the Texas Sea Grant No. 02-S170210 to MM and Texas Sea Grant-in-Aid to AF. A Sampling was conducted on a research cruise conducted by the Fisheries Ecology Lab at Texas A&M University, which was supported by a grant from the Gulf of Mexico Research Initiative (Deep Pelagic Nekton Dynamics Consortium).
Conflict of Interest
The authors declare that the research was conducted in the absence of any commercial or financial relationships that could be construed as a potential conflict of interest.
Acknowledgments
We thank Dr. Laura Jurgens for her suggestions on experimental design. We are thankful to the aquarium team at Moody Gardens for providing Aurelia polyps. We also thank Katie St. Clair and staff at the TAMUG Sea Life Facility for their expertise and support with establishing jellyfish cultures and caring for jellyfish life stages, as well as Betsabe Herrera for her help with daily jellyfish husbandry. We express our gratitude to Dr. Jay R. Rooker and the Fisheries Ecology Lab at Texas A&M University for the opportunity to accompany their research cruise aboard LUMCON’s R/V Pelican. We would also like to thank the crew of the R/V Pelican for their help with collection and jellyfish spotting.
Supplementary Material
The Supplementary Material for this article can be found online at: https://www.frontiersin.org/articles/10.3389/fmars.2020.00093/full#supplementary-material
MATERIAL S1 | Daily averaged response scores for Chronic Lethal Maximum and Minimum experiments for control and experimental polyps. CLM_controls tab contains daily averaged response score for controls of each species maintained at 21°C.
MATERIAL S2 | Raw and processed data for thermal and salinity tolerance experiments. CLMin and CLMax tab contains Chronic Lethal Minimum (CLMin) and Chronic Lethal Maximum (CLMax) values for the three species with sample size, standard deviation, and sample size (CLMax – CLMin) shown. CLMax and CLMin values are in degrees Celsius (°C). CTMax tab contains CTMax values for the three species with sample size, standard deviation, and intraspecific variability shown. CTMax values are in degree Celsius (°C). Intraspecific variability is shown as a percent value. CLSMin tab contains Chronic Lethal Minimum Salinity values for the three species with sample size and standard deviation shown. CLSMin values are in parts per thousand (ppt). Response Score (temperature) tab contains the raw data for the Chronic lethal temperature experiments. Date, temperature in degrees Celsius (°C), species, plate number, well number, response score, and total number of polyps in well is shown. Response Score (salinity) tab contains the raw data for the Chronic lethal salinity experiments. Date, temperature in degrees Celsius (°C), species, plate number, well number, response score, and total number of polyps in well is shown.
References
Abdul Azis, P. K., Al-Tisan, I., Al-Daili, M., Green, T. N., Dalvi, A. G. I., and Javeed, M. A. (2000). Effects of environment on source water for desalination plants on the eastern coast of Saudi Arabia. Desalination 132, 29–40. doi: 10.1016/s0011-9164(00)00132-6
Beitinger, T. L., Bennett, W. A., and McCauley, R. W. (2000). Temperature tolerances of North American freshwater fishes exposed to dynamic changes in temperature. Environ. Biol. Fish. 58, 237–275.
Belmonte, G., Scirocco, T., and Denitto, F. (2011). Zooplankton composition in Lake Varano (Adriatic Sea coast, Italy). Ital. J. Zool. 78, 370–378. doi: 10.1080/11250003.2011.561261
Bennett, J. M., Calosi, P., Clusella-Trullas, S., Martínez, B., Sunday, J., and Algar, A. C. (2018). GlobTherm, a global database on thermal tolerances for aquatic and terrestrial organisms. Sci. Data 5:180022. doi: 10.1038/sdata.2018.22
Biasutti, M., Sobel, A. H., Camargo, S. J., and Creyts, T. T. (2012). Projected changes in the physical climate of the Gulf Coast and Caribbean. Clim. Chang. 112, 819–845. doi: 10.1007/s10584-011-0254-y
Boyer, T. P., Biddle, M., Hamilton, M., Mishonov, A. V., Paver, C. R., Seidov, D., et al. (2011). Gulf of Mexico Regional Climatology NOAA/NODC. Silver Spring: NOAA.
Ceh, J., Gonzalez, J., Pacheco, A. S., and Riascos, J. M. (2015). The elusive life cycle of scyphozoan jellyfish – metagenesis revisited. Sci. Rep. 5, 12037–12037. doi: 10.1038/srep12037
Chiaverano, L. M., Bayha, K. W., and Graham, W. M. (2016). Local versus generalized phenotypes in two sympatric Aurelia species: understanding jellyfish ecology using genetics and morphometrics. PLoS One 11:e0156588. doi: 10.1371/journal.pone.0156588
Condon, R. H., Lucas, C. H., Pitt, K. A., and Uye, S. I. (2014). Jellyfish blooms and ecological interactions. Mar. Ecol. Prog. Ser. 510, 109–110.
Dawson, M. N., Gupta, A. S., and England, M. H. (2005). Coupled biophysical global ocean model and molecular genetic analyses identify multiple introductions of cryptogenic species. Proc. Natl. Acad. Sci. U.S.A. 102, 11968–11973. doi: 10.1073/pnas.0503811102
Dawson, M. N., and Martin, L. E. (2001). Geographic variation and ecological adaptation in Aurelia (Scyphozoa, Semaeostomeae): some implications from molecular phylogenetics. Hydrobiologia 451, 259–273. doi: 10.1007/978-94-010-0722-1_21
De Donno, A., Idolo, A., Bagordo, F., Grassi, T., Leomanni, A., and Serio, F. (2014). Impact of stinging jellyfish proliferations along south Italian coasts: human health hazards, treatment and social costs. Int. J. Environ. Res. Public Health 11, 2488–2503. doi: 10.3390/ijerph110302488
Duarte, C. M., Pitt, K. A., Lucas, C. H., Purcell, J. E., Uye, S.-I., and Robinson, K. (2013). Is global ocean sprawl a cause of jellyfish blooms? Front. Ecol. Environ. 11, 91–97. doi: 10.1890/110246
Eme, J., and Bennett, W. A. (2009). Critical thermal tolerance polygons of tropical marine fishes from Sulawesi, Indonesia. J. Therm. Biol. 34, 220–225. doi: 10.1016/j.jtherbio.2009.02.005
Folmer, O., Black, M., Hoeh, W., Lutz, R., and Vrijenhoek, R. (1994). DNA primers for amplification of mitochondrial cytochrome c oxidase subunit I from. Mol. Mar. Biol. Biotechnol. 3, 294–299.
Graham, W. M. (2001). Numerical increases and distributional shifts of Chrysaora quinquecirrha (Desor) and Aurelia aurita (Linné) (Cnidaria: Scyphozoa) in the northern Gulf of Mexico. Hydrobiologia 451, 97–111. doi: 10.1007/978-94-010-0722-1_9
Gröndahl, F. (1988). A comparative ecological study on the scyphozoans Aurelia aurita, Cyanea capillata and C. lamarckii in the Gullmar Fjord, western Sweden, 1982 to 1986. Mar. Biol. 97, 541–550. doi: 10.1007/bf00391050
Haraldsson, M., Tönnesson, K., Tiselius, P., Thingstad, T. F., and Aksnes, D. L. (2012). Relationship between fish and jellyfish as a function of eutrophication and water clarity. Mar. Ecol. Prog. Ser. 471, 73–85. doi: 10.3354/meps10036
Hays, G. C., Doyle, T. K., and Houghton, J. D. R. (2018). A paradigm shift in the trophic importance of jellyfish? Trends Ecol. Evol. 33, 874–884. doi: 10.1016/j.tree.2018.09.001
Heim-Ballew, H., and Olsen, Z. (2019). Salinity and temperature influence on Scyphozoan jellyfish abundance in the Western Gulf of Mexico. Hydrobiologia 827, 247–262. doi: 10.1007/s10750-018-3771-0
Hoèvar, S., Malej, A., Boldin, B., and Purcell, J. E. (2018). Seasonal fluctuations in population dynamics of Aurelia aurita polyps in situ with a modelling perspective. Mar. Ecol. Prog. Ser. 591, 155–166. doi: 10.3354/meps12387
Hubot, N., Lucas, C. H., and Piraino, S. (2017). Environmental control of asexual reproduction and somatic growth of Aurelia spp. (Cnidaria, Scyphozoa) polyps from the Adriatic Sea. PLoS One 12:e0178482. doi: 10.1371/journal.pone.0178482
Ishii, H., and Katsukoshi, K. (2010). Seasonal and vertical distribution of Aurelia aurita polyps on a pylon in the innermost part of Tokyo Bay. J. Oceanogr. 66, 329–336. doi: 10.1007/s10872-010-0029-5
Larson, R. J. (1991). Diet, prey selection and daily ration of Stomolophus meleagris, a filter-feeding scyphomedusa from the NE Gulf of Mexico. Estuar. Coast. Shelf Sci. 32, 511–525. doi: 10.1016/0272-7714(91)90038-d
Lucas, C. H., Graham, W. M., and Widmer, C. (2012). Jellyfish Life Histories: Role of Polyps in Forming and Maintaining Scyphomedusa Populations. Amsterdam: Elsevier Ltd.
Lutterschmidt, W. I., and Hutchison, V. H. (1997). The critical thermal maximum: history and critique. Can. J. Zool. 75, 1561–1574. doi: 10.1139/z97-783
Lynam, C. P., Gibbons, M. J., Axelsen, B. E., Sparks, C., Coetzee, J. C., Benjamin, G. H., et al. (2006). Jellyfish overtake fish in a heavily fished ecosystem. Curr. Biol. 16, 1976–1976.
Madeira, D., Narciso, L., Cabral, H. N., and Vinagre, C. (2012). Thermal tolerance and potential impacts of climate change on coastal and estuarine organisms. J. Sea Res. 70, 32–41. doi: 10.1016/j.seares.2012.03.002
Malej, A., Kogovšek, T., Ramšak, A., Catenacci, L., Bonnet, D., Carcaillet, F., et al. (2012). Blooms and population dynamics of moon jellyfish in the northern Adriatic. CBM Cah. Biol. Mar. 53:337. doi: 10.1016/j.scitotenv.2018.01.011
Marques, R., Cantou, M., Soriano, S., Molinero, C. J., and Bonnet, D. (2015). Mapping distribution and habitats of Aurelia sp. polyps in Thau lagoon, north-western Mediterranean Sea (France). Mar. Biol. 162, 1441–1449. doi: 10.1007/s00227-015-2680-2
Marques, R., Darnaude, A. M., Schiariti, A., Tremblay, Y., Molinero, C. J., Soriano, S., et al. (2019). Dynamics and asexual reproduction of the jellyfish Aurelia coerulea benthic life stage in the Thau lagoon (northwestern Mediterranean). Mar. Biol. 166:74.
Miller, M.-E. C., and Graham, W. M. (2012). Environmental evidence that seasonal hypoxia enhances survival and success of jellyfish polyps in the northern Gulf of Mexico. J. Exp. Mar. Biol. Ecol. 432, 113–120. doi: 10.1016/j.jembe.2012.07.015
Möller, H. (1984). Reduction of a larval herring population by jellyfish predator. Science 224, 621–622. doi: 10.1126/science.224.4649.621
Muhling, B. A., Lee, S.-K., Lamkin, J. T., and Liu, Y. (2011). Predicting the effects of climate change on bluefin tuna (Thunnus thynnus) spawning habitat in the Gulf of Mexico. ICES J. Mar. Sci. 68, 1051–1062. doi: 10.1093/icesjms/fsr008
Nagata, R. M., Haddad, M. A., and Nogueira, M. Jr. (2009). The nuisance of medusae (Cnidaria, Medusozoa) to shrimp trawls in central part of southern Brazilian Bight, from the perspective of artisanal fishermen. Pan Am. J. Aquat. Sci. 4, 312–325. doi: 10.1371/journal.pone.0195352
Peck, L. S., Clark, M. S., Morley, S. A., Massey, A., and Rossetti, H. (2009). Animal temperature limits and ecological relevance: effects of size, activity and rates of change. Funct. Ecol. 23, 248–256. doi: 10.1111/j.1365-2435.2008.01537.x
Piraino, S., Aglieri, G., Martell, L., Mazzoldi, C., Melli, V., Milisenda, G., et al. (2014). Pelagia benovici sp. nov.(Cnidaria, Scyphozoa): a new jellyfish in the Mediterranean Sea. Zootaxa 3794, 455–468. doi: 10.11646/zootaxa.3794.3.7
Pitt, K. A., and Kingsford, M. J. (2003). Temporal and spatial variation in recruitment and growth of medusae of the jellyfish, Catostylus mosaicus (Scyphozoa: Rhizostomeae). Mar. Freshw. Res. 54, 117–125.
Pörtner, H.-O. (2002). Climate variations and the physiological basis of temperature dependent biogeography: systemic to molecular hierarchy of thermal tolerance in animals. Comp. Biochem. Physiol. A Mol. Integr. Physiol. 132, 739–761. doi: 10.1016/s1095-6433(02)00045-4
Purcell, J. E. (2005). Climate effects on formation of jellyfish and ctenophore blooms: a review. J. Mar. Biol. Assoc. UK 85, 461–476. doi: 10.1017/s0025315405011409
Purcell, J. E. (2007). Environmental effects on asexual reproduction rates of the scyphozoan Aurelia labiata. Mar. Ecol. Prog. Ser. 348, 183–196. doi: 10.3354/meps07056
Purcell, J. E. (2011). Jellyfish and ctenophore blooms coincide with human proliferations and environmental perturbations. Annu. Rev. Mar. Sci. 4, 209–235. doi: 10.1146/annurev-marine-120709-142751
Purcell, J. E., Baxter, E. J., and Fuentes, V. (2013). Jellyfish as Products and Problems of Aquaculture. Advances in Aquaculture Hatchery Technology. Amsterdam: Elsevier, 404–430.
Purcell, J. E., Hoover, R. A., and Schwarck, N. T. (2009). Interannual variation of strobilation by the scyphozoan Amelia labiata in relation to polyp density, temperature, salinity, and light conditions in situ. Mar. Ecol. Prog. Ser. 375, 139–149. doi: 10.3354/meps07785
Purcell, J. E., Malej, A., and Benoviæ, A. (1999a). Potential links of jellyfish to eutrophication and Fisheries. Coast. Estuar. Stud. 55, 241–263. doi: 10.1029/ce055p0241
Purcell, J. E., and Sturdevant, M. V. (2000). Prey selection and dietary overlap among zooplanktivorours jellyfish and juvenile fishes in Prince William Sound, Alaska. Mar. Ecol. Prog. Ser. 210, 67–83. doi: 10.3354/meps210067
Purcell, J. E., Uye, S. I., and Lo, W. T. (2007). Anthropogenic causes of jellyfish blooms and their direct consequences for humans: a review. Mar. Ecol. Prog. Ser. 350, 153–174. doi: 10.3354/meps07093
Purcell, J. E., White, J. R., Nemazie, D. A., and Wright, D. A. (1999b). Temperature, salinity and food effects on asexual reproduction and abundance of the scyphozoan Chrysaora quinquecirrha. Mar. Ecol. Prog. Ser. 180, 187–196. doi: 10.3354/meps180187
Quiñones, J., Monroy, A., Acha, E. M., and Mianzan, H. (2013). Jellyfish bycatch diminishes profit in an anchovy fishery off Peru. Fish. Res. 139, 47–50. doi: 10.1016/j.fishres.2012.04.014
Riascos, J. M., Villegas, V., and Pacheco, A. S. (2014). Diet composition of the large scyphozoan jellyfish Chrysaora plocamia in a highly productive upwelling centre off northern Chile. Mar. Biol. Res. 10, 791–798. doi: 10.1080/17451000.2013.863353
Rippingale, R., and Kelly, S. (1995). Reproduction and survival of Phyllorhiza punctata (Cnidaria: Rhizostomeae) in a seasonally fluctuating salinity regime in Western Australia. Mar. Freshw. Res. 46, 1145–1151.
Robinson, K. L., and Graham, W. M. (2013). Long-term change in the abundances of northern Gulf of Mexico scyphomedusae Chrysaora sp and Aurelia spp. with links to climate variability. Limnol. Oceanogr. 58, 235–253. doi: 10.4319/lo.2013.58.1.0235
Scorrano, S., Aglieri, G., Boero, F., Dawson, M. N., and Piraino, S. (2017). Unmasking Aurelia species in the Mediterranean Sea: an integrative morphometric and molecular approach. Zool. J. Linn. Soc. 180, 243–267.
Segura-Puertas, L., Celis, L., and Chiaverano, L. (2009). “Medusozoans (Cnidaria: Cubozoa, Scyphozoa, and Hydrozoa) of the Gulf of Mexico,” in Gulf of Mexico-Origins, Waters, and Biota, eds J. Tunnel, D. Felder, and S. Aerle (Texas, USA: Texas A&M University Press), 369–379.
Shoji, J., Kudoh, T., Takatsuji, H., Kawaguchi, O., and Kasai, A. (2010). Distribution of moon jellyfish Aurelia aurita in relation to summer hypoxia in Hiroshima Bay, Seto Inland Sea. Estuar. Coast. Shelf Sci. 86, 485–490. doi: 10.1016/j.ecss.2009.03.001
Somero, G. N. (2005). Linking biogeography to physiology: evolutionary and acclimatory adjustments of thermal limits. Front. Zool. 2:1. doi: 10.1186/1742-9994-2-1
Somero, G. N. (2010). The physiology of climate change: how potentials for acclimatization and genetic adaptation will determine ‘winners’ and ‘losers’. J. Exp. Biol. 213, 912–920. doi: 10.1242/jeb.037473
Stillman, J. H. (2003). Acclimation capacity underlies susceptibility to climate change. Science 301, 65–65. doi: 10.1126/science.1083073
Thomas, C. D. (2010). Climate, climate change and range boundaries. Divers. Distrib. 16, 488–495. doi: 10.1111/j.1472-4642.2010.00642.x
Turner, R. E., Rabalais, N. N., and Justiæ, D. (2017). Trends in summer bottom-water temperatures on the northern Gulf of Mexico continental shelf from 1985 to 2015. PLoS One 12:e0184350. doi: 10.1371/journal.pone.0184350
Vinagre, C., Dias, M., Cereja, R., Abreu-Afonso, F., Flores, A. A., and Mendonça, V. (2019). Upper thermal limits and warming safety margins of coastal marine species–Indicator baseline for future reference. Ecol. Indic. 102, 644–649. doi: 10.1016/j.ecolind.2019.03.030
Vinagre, C., Leal, I., Mendonca, V., Madeira, D., Narciso, L., Diniz, M. S., et al. (2016). Vulnerability to climate warming and acclimation capacity of tropical and temperate coastal organisms. Ecol. indic. 62, 317–327. doi: 10.1016/j.ecolind.2015.11.010
Vinagre, C., Mendonça, V., Cereja, R., Abreu-Afonso, F., Dias, M., Mizrahi, D., et al. (2018). Ecological traps in shallow coastal waters—Potential effect of heat-waves in tropical and temperate organisms. PLoS One 13:e0192700. doi: 10.1371/journal.pone.0192700
Keywords: jellyfish, Scyphozoa, Cnidaria, Gulf of Mexico, temperature tolerance, salinity tolerance, climate change, Aurelia
Citation: Frolova A and Miglietta MP (2020) Insights on Bloom Forming Jellyfish (Class: Scyphozoa) in the Gulf of Mexico: Environmental Tolerance Ranges and Limits Suggest Differences in Habitat Preference and Resistance to Climate Change Among Congeners. Front. Mar. Sci. 7:93. doi: 10.3389/fmars.2020.00093
Received: 15 July 2019; Accepted: 04 February 2020;
Published: 21 February 2020.
Edited by:
Nancy Knowlton, Smithsonian Institution, United StatesReviewed by:
Craig W. Osenberg, University of Georgia, United StatesSusana Enríquez, National Autonomous University of Mexico, Mexico
Copyright © 2020 Frolova and Miglietta. This is an open-access article distributed under the terms of the Creative Commons Attribution License (CC BY). The use, distribution or reproduction in other forums is permitted, provided the original author(s) and the copyright owner(s) are credited and that the original publication in this journal is cited, in accordance with accepted academic practice. No use, distribution or reproduction is permitted which does not comply with these terms.
*Correspondence: Alexandra Frolova, frolova.alexandra@outlook.com