Circulation in the Seaflower Reserve and Its Potential Impact on Biological Connectivity
 Luisa Lopera
 Yuley Cardona
 Paula A. Zapata-Ramírez2
- 1Departamento de Geociencias y Medio Ambiente, Facultad de Minas, Universidad Nacional de Colombia, Sede Medellín, Medellín, Colombia
- 2Escuela de Ingeniería, Grupo de Automática y Diseño A + D, Universidad Pontificia Bolivariana, Medellín, Colombia
The influence of ocean currents on marine population connectivity is critical to territory planning, and such phenomena should be considered in the design and implementation of marine protected areas (MPAs), marine spatial planning strategies, and restoration plans, among other developments. Knowledge of the influence of currents is also vital in understanding the relationship between oceanographic drivers and ecosystem configurations. However, despite their importance, ocean currents and their role in coral connectivity remain poorly constrained in the Seaflower Marine Reserve, an area that hosts the most productive open-ocean coral reef system in the Caribbean and that was declared a biosphere reserve in 2000. We herein characterize the larva transport patterns associated with surface currents that control connectivity in the reserve. To achieve this aim, we simulated the advection of buoyant coral larvae of Acropora palmata during nine spawning events. Larval dispersal patterns were obtained through offline coupling of a high-spatiotemporal resolution hydrodynamic field and a biophysical Lagrangian model for particle dispersion. Ocean current fields were generated using a Regional Ocean Modeling System (ROMS) that was appropriately configured for the region. Larval dispersion was simulated using an Individual-Based Model (Ichthyop). Our results show that there are heterogeneous connectivity patterns during the spawning events at seasonal and inter-annual scales. This seems to be associated with high spatiotemporal dynamic variability in the region, such as the Caribbean Current bifurcation close to the Nicaraguan Rise, the intrusion-formation of mesoscale and sub-mesoscale eddies, and the semi-permanent presence of the Panama-Colombia Gyre. We also found that Serranilla, Providencia, Quitasueño, and Serrana act as the most important sinks. In contrast, the northernmost reefs, Serranilla, B. Alicia, and B. Nuevo, seem to be the most important sources of larvae, highlighting that these areas need to be incorporated into the current MPA zonification and that this could lead to the improvement of MPA effectiveness. Our findings also suggest the need to implement MPA networks between Jamaica and Colombia to allow biological populations to become resilient to environmental changes and less prone to local extinctions.
1. Introduction
The Seaflower Biosphere Reserve (SFBR) is located at the southwestern side of the Caribbean Sea and has an area of 180,000 km2, one-third of which (65,000 km2) is part of the Marine Protected Area (MPA) declared by the Colombian government in 2005. The zonation within the MPA comprises 0.2% of No-entry zone, 3.4% of No-take, 3.1% of Artisanal Fishing, 0.1% of Special Use, and 93.2% of General Use (Sánchez-Jabba, 2012). Due to its geographical location and jurisdictional framework, the SFBR is highly vulnerable to political decisions, resulting in Colombia, Jamaica, and Nicaragua all having jurisdiction over it. Each country has its own rules for environmental regulation, and these are not necessarily compatible. Figure 1 shows the boundaries of the SBRF, the MPA, and the common regime area. The SFBR system comprises two oceanic islands (San Andrés y Providencia) and a series of atolls and banks (Quitasueño, Serrana, Roncador, Serranilla, Albuquerque, Bajo Nuevo, Bajo Alicia, and Bolívar). Those geoforms are characterized by their associated ecosystems, which include mangroves, seagrasses, and coral reefs. The SFBR hosts ~77% from the total Colombian reef area and the largest and the most productive open-ocean coral reefs in the Caribbean (D́ıaz et al., 2000; CORALINA-INVEMAR, 2012). According to Prato and Rixcie (2015), the economic value of these coral reefs is between USD 270,900 and USD 353,000 million per year, i.e., they correspond to ~70% of the total contribution attributed to the Colombian Caribbean marine territory. However, the importance of the coral reefs is not only economic; the SFBR also hosts high biodiversity and contributes to shoreline protection (Prato and Rixcie, 2015).
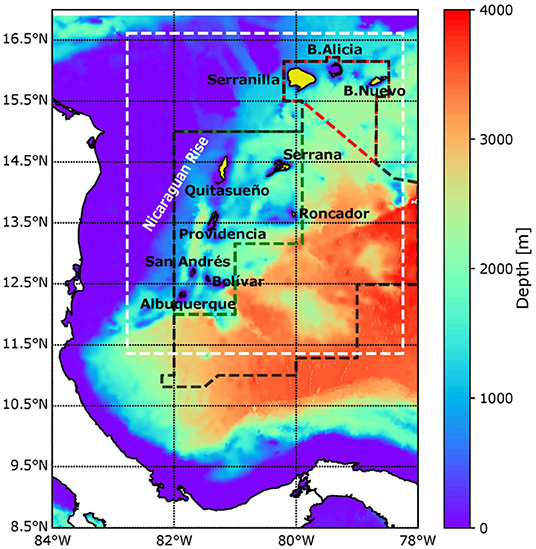
Figure 1. Parent domain for numerical integrations. White dashed lines indicate the nested domain, black dashed lines enclose the Seaflower Reserve, and green and red lines show the MPA and common regime area between Colombia and Jamaica, respectively. Background bathymetry and the black polygons indicating release and recruitment zones in the Lagrangian Model are from the Millennium Coral Reef Mapping Project.
The SFBR coral reef complex includes extensive benthic habitats, such as barrier reefs, reef lagoons, reef, slopes, forereefs, deep coral plateaus, seamounts, deep coral reefs, bank reefs, patch reefs, and atolls, while the most recurrent bottoms in them are: (i) calcareous matrixes, (ii) sand and coral debris, and (iii) calcareous, metamorphic, and basaltic rocks; all of them present low to medium inclinations, and their depth usually does not exceed 20 m (Díaz et al., 1997; Geister and D́ıaz, 2007; CORALINA-INVEMAR, 2012). This coral reef formation is a product of the oceanic location and strong wave exposure due to swells generated by the trend winds; as a result, turbulence controls the distribution of organisms in the reefs. The substrates are constituted principally by: Millepora complanate, zoanthids, Diploria strigosa, Diploria clivosa, Montastraea cavernosa, Colpophyllia natans, Siderastrea spp, Acropora palmata, Acropora cervicornis, sponges, and octocorallia. In the Seaflower MPA, 48 sclerictian corals species have been documented (of ~60–70 species known to exist in the Caribbean), 54 octocoral species with high endemism, 3 black coral species, 300 fish (one endemic fish), and 124 sponge species, among others (D́ıaz et al., 2000; Geister and D́ıaz, 2007). Among the most important species of corals throughout the Greater Caribbean is Acropora palmata, a major reef-builder in the Caribbean that contributes to reef growth, island formation, coastal protection, and sustaining the habitat of fisheries. Its three-dimensional thickets are present in intermediate waters of the forereef zone (1–20 m) (D́ıaz et al., 2000; Johnson et al., 2011; Rodŕıguez-Mart́ınez et al., 2014; NMFS, 2015).
Despite being among the most representative icons of the Colombian marine protection areas, knowledge about the Seaflower area is limited to biological inventories, some of which were led by the Comisiõn Colombiana del Océano (CCO) through Seaflower expeditions (Bolaños et al., 2015; Vega et al., 2015; Acero P. et al., 2019) and geological characterization (D́ıaz et al., 2000; Idárraga-García and León, 2019). The mesoscale surface circulation across the Colombian Caribbean has been studied by several authors, e.g., Andrade (2000); Richardson (2005); Ruiz (2011), but small-scale dynamic features and circulation in the water column remain unknown or poorly constrained. The surface circulation over Seaflower is driven by two features. The first is an east–west zonal current (the Caribbean Current) that, due to bathymetric configurations, is forced to split into two sections when it reaches the Nicaraguan Rise. One section flows toward the Caimán Sea, and the second enters a cyclonic gyre in the southwestern Caribbean. The latitude over which the bifurcation occurs is not well-known. The second feature driving surface circulation is the Panama-Colombia Gyre (PCG), a semi-permanent cyclonic gyre located in the southwestern Caribbean (Andrade, 2000; CORALINA-INVEMAR, 2012).
The influence of ocean currents on the distribution and abundance of marine organisms has been investigated since the 1980s. For example, Roughgarden et al. (1988) concluded that regional patterns of coastal circulation partially determine the ecological structure of marine organisms. An understanding of how reef systems are connected through ocean currents at different spatiotemporal scales has nonetheless greatly benefitted from the development of numerical models (Wood et al., 2014; Mayorga-Adame et al., 2017; Lequeux et al., 2018; Romero et al., 2018; Sanvicente-Añorve et al., 2018). Though the understanding of these biogeographic patterns is of key importance in territory planning (e.g., MPA design), particle dispersion patterns, connectivity, and their oceanographic drivers at the SFBR remain poorly understood. Schill et al. (2015) studied connectivity in the wider Caribbean and Gulf of Mexico in order to design and evaluate MPAs. Using a 10 × 10 km 2D daily current field and an explicit larval dispersal model, they aimed to identify the regional coral reef MPA network for conservation goals. Their results suggested the need to quantify connectivity information by marine eco-regions and at the level of Exclusive Economic Zones (EZZ). Despite their findings, the resolution of the results is not sufficiently high to be applied to local exercises since it does not reproduce smaller-scale processes, such as sub-mesoscale fronts, eddies, and filaments. Zhong et al. (2012), Zhong and Bracco (2013), Raitsos et al. (2017), and Medel et al. (2018) have highlighted the importance of small-scale processes, such as fronts, sub-mesoscale eddies, and filaments in larval and plankton dispersal.
Lonin et al. (2010) characterized the dispersion of queen conch Strombus gigas larvae in the SFBR during 2007 and 2009 using daily data from the Princeton Ocean Model (POM) at 18-km horizontal resolution. They found monthly connectivity patterns between the southernmost reefs to Providencia and Roncador, links amongst the Quitasueño–Serrana–Roncador system, and links between Serranilla, B. Alicia, and B. Nuevo. Links were particularly evident during the peak reproductive periods of strombus gigas (April and September). Larval connectivity has also been studied through genetic analysis of reefs. Foster et al. (2012) evaluated the connectivity of Caribbean coral populations in 26 sites outside the SFBR and found an east–west barrier of connectivity in the southern Caribbean resulting from low salinity and high sediment plume activity in the Colombian Basin, associated with the Magdalena River.
In this work, we characterized the mesoscale and sub-mesoscale dynamic conditions of the Seaflower Reserve in order to i) determine whether connectivity exists between reefs through the ocean currents and ii) provide information about the physical drivers that control larval distribution in the SFBR. To achieve this aim, we used a regional ocean model (ROMS) setup with horizontal resolutions of 5 and 1.7 km and an Individual-Based Model (Ichthyop). Using a fine spatiotemporal current field and parametrized larvae, we simulated nine spawning events for A. palmata in the SFBR during neutral (2003, 2008, 2014), El Niño (2002, 2009, 2015), and La Niña (2000, 2007, 2010) phases. In this regard, the impact of the ENSO in the Caribbean is not yet very clear. However, in the tropical Atlantic, the effect has been reported mainly to comprise changes in rainfall, sea surface temperature (SST), and sea level pressure (SLP). The ENSO phenomenon and the induced variability over the subtropical North Atlantic high sea level pressure affects the rainfall in the Caribbean region and the trade wind strength as a reversal in the sign of the correlation. Warm ENSO conditions lead to SST warming in the Caribbean, which is overlain by rainfall reductions, weaker trade winds, and consequent reduction in surface fluxes (Giannini et al., 2000, 2001a,b; Alexander et al., 2002). Our findings are the first concerning the regional patterns that lead to coral larva connectivity in the SFBR and are based on a 3D high-spatio-temporal resolution model. Thus, they provide information that is useful for the identification of critical areas requiring ecological protection through either the redesign or the incorporation of new MPA areas and/or protection co-management zones. Furthermore, our results could also be useful for identifying areas requiring restoration.
2. Materials and Methods
To identify hydrodynamic connectivity in the SFBR, a biophysical modeling approach was employed, using a Lagrangian tool (Ichthyop) forced by a regional ocean numerical model (ROMS). We simulated A. palmata particle dispersal during spawning events in 2000, 2002, 2003, 2007, 2008, 2009, 2010, 2014, and 2015. This methodological approach, together with the selected events, allowed determination of the influence of circulation patterns and their modifications due to macro-climatic phenomena (ENSO) that lead to larval dispersion and connectivity. The configurations of models used to assess connectivity driven by oceanographic conditions are described below.
2.1. Ocean Model Configuration
The model we used in this study to reproduce the hydrodynamic conditions for different spawning events in the SFBR was the Regional Ocean Modeling System (ROMS-Agrif v3.1.1). ROMS is a 3D free surface and hydrostatic regional oceanic model that solves primitive momentum equations in sigma terrain-following coordinates (S-levels) and orthogonal cartesian coordinates over the vertical and horizontal axes, respectively (Penven et al., 2008). In this study, ROMS was configured in a two-way nesting procedure using a high-resolution child model in a coarser parent model in order to represent small-scale features of SFBR dynamics in more detail. The parent grid has a horizontal resolution of 5 km in a domain extending from 84 to 78°W and from 8 to 17°N. The child grid, with a horizontal resolution of 1.7 km, is bounded by the white dashed line in Figure 1. Along the vertical axis, 35 s-levels were distributed in both grids, enhancing the resolution close to the surface (upper 100 m). The parent model was integrated using a time-step of 120 s, providing boundary conditions for the child model with a time step of 40 s. Then, the child model updates the parent model, and the process is repeated. For grid construction, GEBCO 30 arc-second (1-km resolution) was used to derive bathymetry, and a Shapiro smoother of 0.45 was applied to avoid pressure gradient errors (Weatherall et al., 2015). In addition, an Hmin value of 2 m was used for the parent model. First of all, to ensure suitable representation of the mean circulation conditions in the domain and the numerical stability of the model, a climatological simulation was integrated over 15 years. The run was forced at the surface using monthly climatological mean fields from the Era-Interim dataset, which covers the period 1979–2017 (Dee et al., 2011) and QuikSCAT/ASCAT wind forcing data, which covers the period 2000–2016 (Ricciardulli et al., 2011; Abderrahim and Fillon, 2012). The model was forced at the open boundaries (east and north) through monthly-average fields of temperature, salinity, sea surface height (SSH), and current components from GLORYS reanalysis (Ferry et al., 2010), which covers the period 2000-2015. All of the described databases have a spatial resolution of 0.25°. The initial condition was obtained from the climatological mean for the month of January. We simulated 9 years for the period comprising the timing of spawning (July to September) of A. palmata in the Caribbean Sea (section 2.2). For time-dependent simulations, daily surface forcing from QuikSCAT/ASCAT and Era-Interim were used, while 5-days average fields from GLORYS were imposed at the boundaries. The initial condition for each time-dependent simulation was obtained as the last June record during the climatological run; in this way, we ensure the proper start of each simulation. Three-hour averages of the velocity fields and state variables reproduced by the model were stored for use by the biophysical model in the subsequent modeling stages.
2.2. Lagrangian Particle Dispersion Model
Icthyop was used to model the buoyant and Lagrangian advection of coral larvae during the spawning events of 2000, 2002, 2003, 2007, 2008, 2009, 2010, 2014, and 2015. Icthyop is an individual-based model (IBM) developed to study the influence of physical factors and basic biological parameters on ichthyoplankton dynamics (Lett et al., 2008). It also allows the characterization of other marine species, such as coral larvae. Along the vertical axis, Icthyop simulates dispersion, buoyancy, and larval migration processes, while on the horizontal axis, it simulates advection and diffusion (Peliz et al., 2007; Lett et al., 2008; North et al., 2009).
The parameters we used to characterize A. palmata in our simulations are as follows.
2.2.1. Species
The Elkhorn coral Acropora palmata is historically considered a dominant reef-building coral in wave-exposed and high-surge reef zones, typically at depths of <10 m, and it is also considered a habitat provider for marine organisms in the Caribbean Sea (Rodŕıguez-Mart́ınez et al., 2014). It is predominantly located close to the reef crest and the shallowest zone of the outer reef. In addition, rehabilitation initiatives have been conducted to restore populations of A. palmata in the Caribbean (Chamberland et al., 2015). According to D́ıaz et al. (2000), A. palmata has been identified in almost all marine coral areas of Colombia. The Quitasueño, Providencia, Serrana, Albuquerque, and San Andrés regions show the highest occurrences of A. palmata in the SFBR. Due to its widespread presence in the Colombian Caribbean, its ecological importance, and the fact that it has been widely studied, we chose the Elkhorn Coral as the species on which to based our biophysical model.
2.2.2. Pelagic Larval Duration (PLD)
This parameter is defined as the period between spawning and the juvenile stage of coral larvae, i.e., it is the maximum time that the larvae spend in the water column as plankton. If larvae do not find a suitable zone within which to be recruited during their PLD, they will die. According to Baums et al. (2006) and Japaud et al. (2013), the timescale of the A. palmata PLD may oscillate between 20 and 30 days; hence, we used a PLD of 25 days.
2.2.3. Timing of Spawning
According to Jordan (2018), the spawning peak for A. palmata in the Caribbean lies between the third and the fifth day after the August full moon. Spawning was found to occur between 30 and 260 min after sunset. Consequently, in our models, we chose for spawning events to occur 4 days after the full moon of August and 150 min after sunset, which, for the Caribbean, occurs between 6:20 and 6:50 p.m. We chose an average value at 6:35 p.m.; thus, particle release was carried out at 9:00 p.m. Although the oceanic numerical model forcing did not include intra-day variability, performance of a linear interpolation between two closest data points as well as the storage record allowed us to obtain output data in a specific moment of the day that coincides with the spawning. Table 1 shows the full moon and spawning event dates and the corresponding ENSO phase.
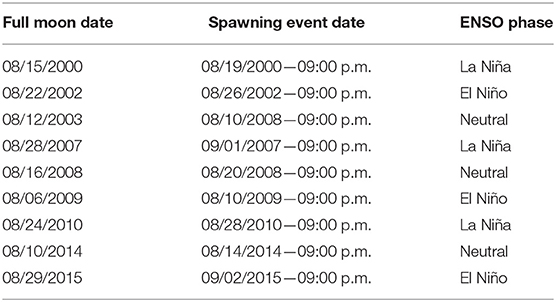
Table 1. Full moon and spawning event dates.
2.2.4. Pre-competency Period (PP)
This is the period before the coral larvae settle. According to Randall and Szmant (2009) and Japaud et al. (2013), the PP for A. palmata oscillates between 3 and 5 days, so we used a PP of 3 days in our study.
2.2.5. Release and Recruitment Zones
We used the Millennium Coral Reef Mapping and Global Distribution of Coral Reef databases to build a habitat layer of A. palmata, which is shown by the black and yellow polygons in Figure 1. More detailed release and recruitment zones can be found in the Supplementary Material. The databases are based on Landsat 7 images with a resolution of 30 m [Institute for Marine Remote Sensing, University of South Florida (IMaRS/USF), Institut de Recherche pour le Développement (IRD), UNEP-WCMC, The WorldFish Center, and WRI, 2011; UNEP-WCMC, WorldFish Centre, WRI, TNC, 2018].
2.2.6. Release Depth
We released passive particles without ontogenetic, vertical migration, or swimming capabilities between 1.5 and 15 m, i.e., the depth range within which A. palmata has been registered by D́ıaz et al. (2000). Particles were modeled to have a constant size during all PLD, and no mortality rate was included online in the Lagrangian model. Ichthyop conducted the release depending on the total coral area; this means that the number of particles released at each polygon was proportional to its area and at a random position within it (horizontal and vertical). Both the area and the number of particles released in each zone are displayed in Table 2.
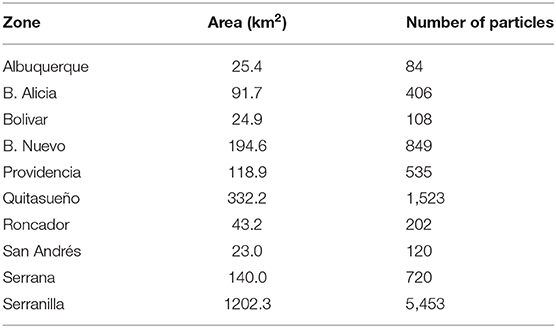
Table 2. Area of each zone and number of particles released.
2.2.7. Number of Released Particles
A sensitivity analysis for the number of released particles was carried out in order to choose the sample size. We released between 10,000 and 100,000 particles to detect differences in connectivity patterns during 2015; however, the connections obtained were shown to be almost the same, so the relative importance of reef connections in both cases is nearly identical, and the strongest/weakest links are the same. Consequently, and due to the constraints of computational time, the release of 10,000 particles was deemed sufficient for our modeling.
2.3. Mortality Rate
Connectivity results excluding mortality are associated with potential connectivity since they allowed the identification of the entire larvae-current interaction during the PLD. Nonetheless, the first stages of larval life are characterized by high daily mortality rates that vary between 10 and 20% (Becker et al., 2007; Schill et al., 2015). For this reason, we included mortality rates to quantify effective connectivity during spawning events. Mortality is included to remove daily, and randomly, a sample of 10, 15, or 20% from the current population. Following this, an ensemble of five hundred runs was used to obtain new connectivity measures. Here we present the effective connectivity results when considering a daily mortality of 15%.
2.4. Connectivity Matrices
Connectivity matrices were used to quantify the release-recruitment strength between two reefs at the end of the PLD. This approach assesses the percentage of larvae that arrive at a reef j (x-axis) from another reef i (y-axis) and allows the distinction of reefs as either sinks or sources. The diagonal of the matrix indicates reefs where local retention occurs (Mayorga-Adame et al., 2017; Lequeux et al., 2018). The reefs are ordered over the vertical axis based on their latitudinal position, from south to north.
2.5. Congruence Among Distance Matrices Test
In order to evaluate the existence of connectivity patterns according to the ENSO phases, we used the Congruence Among Distance Matrices (CADM) tool. CADM is a statistical test used to assess the concordance level of matrices using the distance between them. CADM tests the complete incongruence hypothesis (null hypothesis) between distance matrices by calculating the Kendall's W statistic. The W value provides an estimation of the degree of congruence among matrices on a scale between 0 (no congruence) and 1 (complete congruence) (Legendre, 2005; Campbell et al., 2011).
Distance matrices were calculated using the Euclidean Distance (ED) method, which is one of the most used distance metrics between n-dimensional matrices to determine how dissimilar they are. It is defined as the straight-line distance between two points in an n-dimensional space. Given two n-dimensional matrices in a Euclidean n-space, the ED is calculated following the Pythagorean metric or Euclidean norm.
With:
X = (X1, X2…Xn)
Y = (Y1, Y2…Yn)
In general:
3. Results
3.1. Surface Circulation Under Climatological Conditions
The dominant circulation features in the region can be identified from the integration of climatological conditions. Figure 2 shows the seasonality of mesoscale surface currents in the southwestern Caribbean, calculated from the model (upper part of the figure) and AVISO satellite data (lower part of the figure). Model data (5 km) were interpolated to AVISO resolution in order to make comparisons between them. According to model results and in agreement with available satellite data, there is a semi-permanent cyclonic gyre located in the southwestern of the region, known as the Panama-Colombia Gyre (PCG). The PCG reaches its highest current magnitudes (0.7 m/s) during September, October, and November (SON) and is at its weakest (0.4 m/s) during December, January, and February (DJF). Generally, the PCG is located between 80 and 84°W and between 8 and 13°N, with its center located at 82°W during DJF and March, April, and May (MAM), before moving eastward during June, July, and August (JJA) and SON.
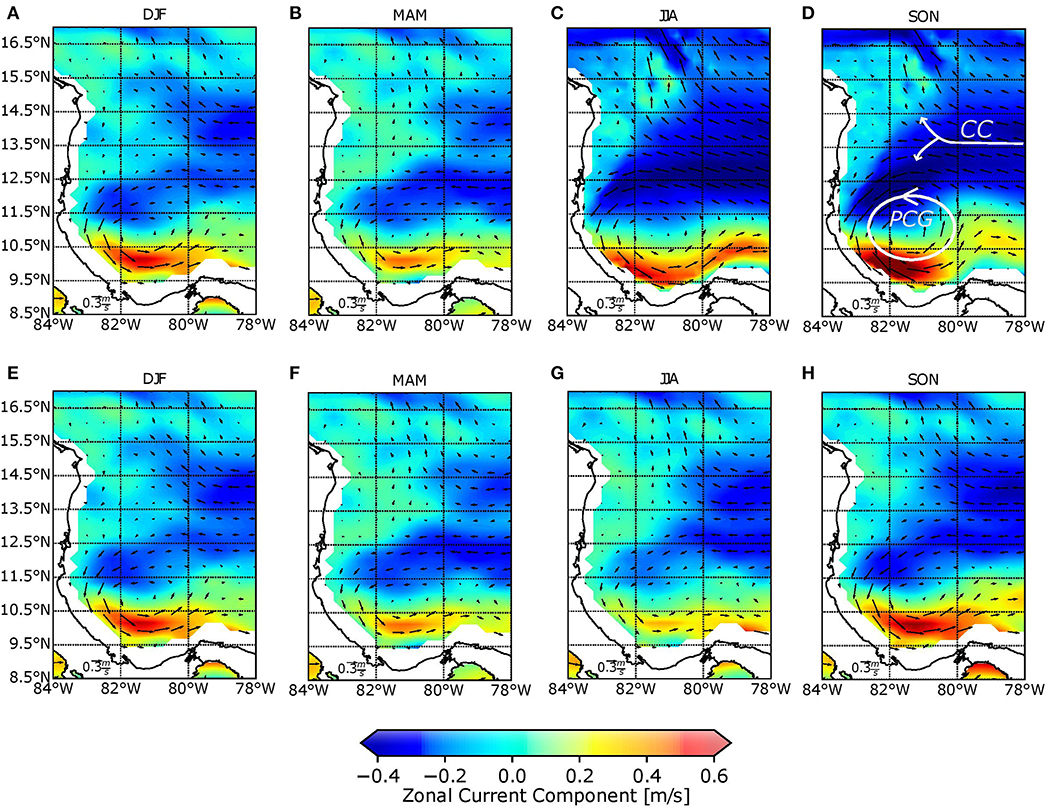
Figure 2. Seasonal behavior of surface currents from model data (upper panels) for: (A) DJF, (B) MAM, (C) JJA, (D) SON and AVISO satellite data (lower panels) for: (E) DJF, (F) MAM, (G) JJA, and (H) SON. DJF, December, January, and February; MAM, March, April, and May; JJA, June, July, and August; and SON, September, October, and November.
A strong zonal current traveling in an east-west direction is permanently represented in the model. This current, known as the Caribbean Current (CC), occurs between 11.5 and 15.5°N. It reaches its highest magnitudes during JJA (0.5 m/s) and is weakest during MAM (0.4 m/s). As shown in Figure 2, during JJA, the current along the SFBR is at its strongest, and this coincides with A. palmata spawning events. The presence of the Nicaraguan Rise causes the CC to split into two sections; the first flows toward the north and becomes the Loop Current, whereas the second flows toward the PCG. The bifurcation position associated with bathymetry has a climatological behavior, as shown in Figure 3. Red boxes enclose the latitudinal position of the CC bifurcation over 82°W. The arrows indicate the flow direction, and their lengths indicate current magnitude. During MAM and JJA, the position of the bifurcation is located around 13°N, whereas in SON and DJF, the bifurcation is displaced northward, almost at 14°N.
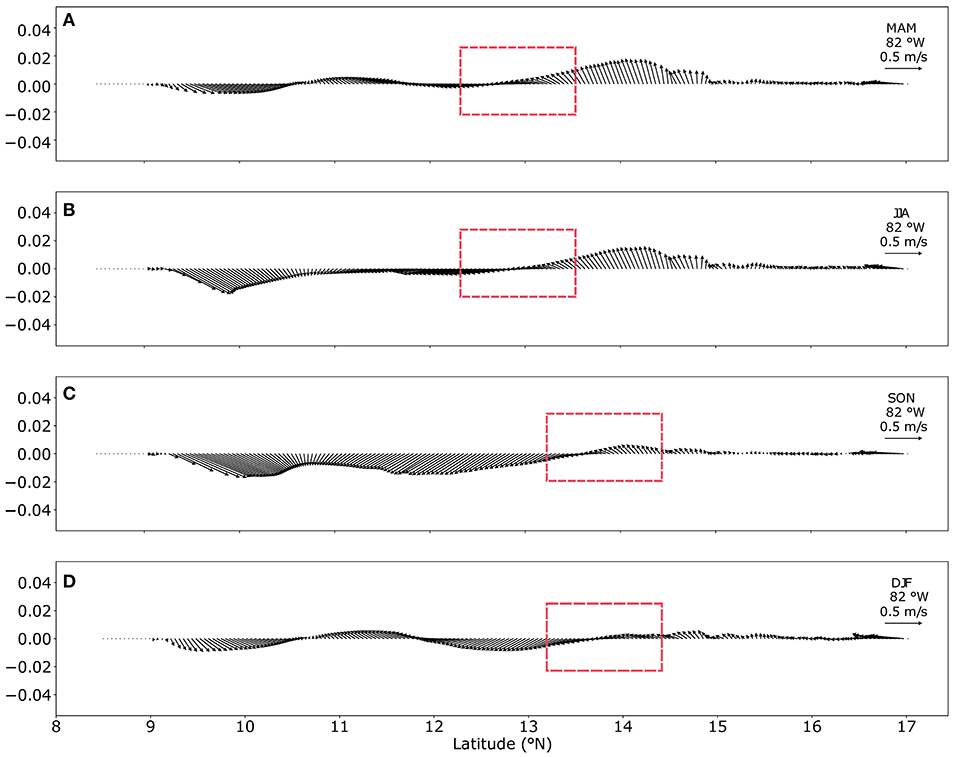
Figure 3. Seasonal position of the CC bifurcation. Transects over 82°W during the climatological seasons (A) March–April–May, (B) June–July–August, (C) September–October–November, and (D) December–January–February. The arrows show the direction of the flow, and arrow length corresponds to current speed (magnitude).
By comparison to AVISO satellite data, it can be seen that the most important features of the surface circulation (the CC, the CC bifurcation, and the PCG) were well-represented by the model. Figure 4 displays the kinetic energy (KE) differences between the model and AVISO, where kinetic energy was calculated as . Red coloration corresponds to KE overestimation, whereas blue coloration reflects KE underestimation. In general terms, for all of the four seasons, the model overestimated the KE and consequently overestimated the magnitude of the currents. Differences between 0.1 and 0.2 m2/s2 prevail in almost the entire domain over the year. The highest differences (more than 0.2 m2/s2) are located (i) close to 81°W–16°N due to the bathymetric effect generated by the Nicaraguan Rise (Figure 1) and the proximity of the northern boundary and (ii) close to the coast as a result of interpolation errors. During DJF and MAM, the lower portion of the PCG was underestimated by around 0.1 m2/s2 in the model. Additionally, red coloration above 12.5°N is consistent with an overestimation of the PCG not only in terms of magnitude but also in terms of spatial extension. AVISO data show a less expanded gyre in almost 0.5°.
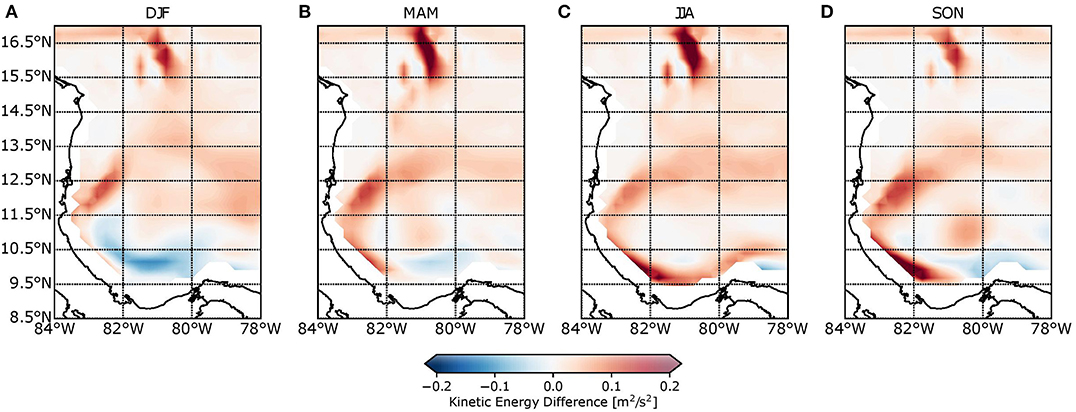
Figure 4. Seasonal kinetic energy difference between model and AVISO satellite data for (A) December–January–February, (B) March–April–May, (C) June–July–August, and (D) September–October–November. Red coloration is associated with kinetic energy overestimation, while blue coloration is associated with its underestimation.
Figure 5 shows seasonal differences in sea surface temperature (SST) between the model and REYNOLDS data. Red colors are associated with an overestimation of SST, whereas blue colors correspond to underestimation. The model underestimated SST during DJF and SON but overestimated them during MAM and JJA when compared to REYNOLDS data. The model underestimation (across almost the entire domain) was around 1.5°C during DJF, while in SON, the differences were between 0 and 0.8°C close to the PCG. Positive differences (i.e., overestimations) were obtained during MAM and JJA, with values lower than 1°C in both trimesters. The lowest differences between the model and satellite data resulted in JJA values that coincided with A. palmata spawning events. Model results, therefore, show good performance when compared with REYNOLDS data.
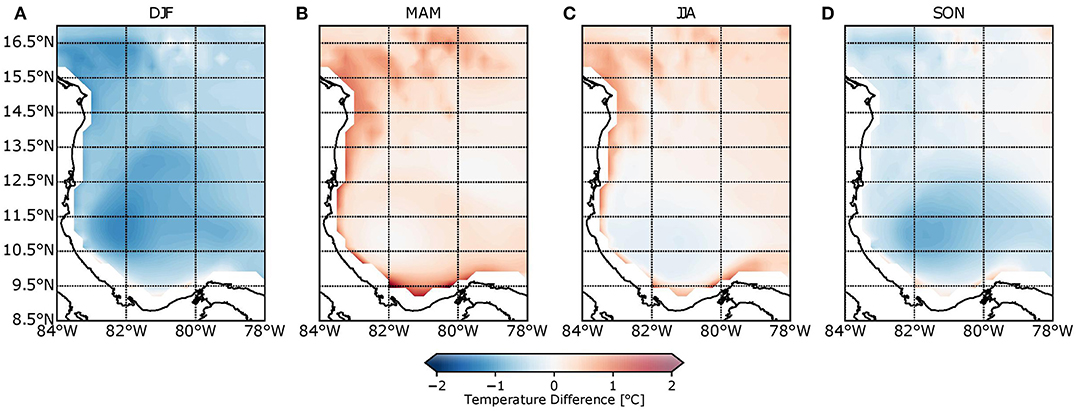
Figure 5. Seasonal temperature difference between model and REYNOLDS data for (A) December–January–February, (B) March–April–May, (C) June–July–August, and (D) September–October–November. Red coloration associated with temperature overestimation, while blue coloration is associated with its underestimation.
In-situ measurements over the water column are not available for the study zone; therefore, the model validation for this work is limited satellite-derived data for the surface layer. However, according to Montoya (2014), the mixed layer depth in the Colombian Caribbean has been found to be only around 25 m during JJA, so an accurate representation of the surface layer is sufficient to account for the depths of interest (1.5–15 m). In addition, most of the particles (more than 70%) remain in the upper 30 m during the PLD. This can be seen for some particles during the 2015 spawning event in the Supplementary Material.
3.2. Mesoscale and Sub-mesoscale Circulation During Spawning Events in the SFBR
At different spatio-temporal scales at the surface, the circulation over the Seaflower Reserve exhibits different characteristics. To track them, we used the model results from the nested grid (1.7 km resolution), which allowed the observation and accurate representation of small features close to the reefs. Dynamics during the spawning events were affected by eddy intrusion, and the presence of eddies was therefore considered to be vital for reef connectivity. To identify mesoscale and sub-mesoscale coherent structures (eddies), we calculated the Okubo Weiss (OW) parameter and vorticity (ξ) fields as follows:
where u and v are the eastward and northward velocity components, respectively. The OW parameter is used to distinguish strain-dominated areas from vorticity-dominated areas, while vorticity enables quantification of the local spinning motion.
In general terms, all modeled spawning events coincided with the presence of mesoscale and sub-mesoscale eddies. Here, we summarize the most significant cases. During 2009, we identified the presence of three structures, one anticyclonic and two cyclonic, all of which were present since the beginning of the spawning event. The anticyclonic eddy had a diameter of ~80 km, and its center was located over 82°W and 14°N, close to Serrana. Eddy deformation began after 9 days (21/08/2009) when the feature was proximal to the Nicaraguan Rise. The eddy transported larvae through its rotation and, due to its presence, the self-recruitment in Serrana was around 2%, whereas the recruitment in Serranilla was 6% of the total released larvae in Serrana. With a diameter of almost 70 km, the northernmost cyclonic eddy was located close to B. Nuevo and left the domain 10 days (22/08/2009) after the beginning of the event. This cyclonic eddy allowed self-recruitment in B. Alicia corresponding to 3% of the total amount of larvae. In B. Nuevo, the recruitment was around 8%. These data are presented in Figure 6B, and the output of the simulation during the spawning event can be observed in the Supplementary Material.
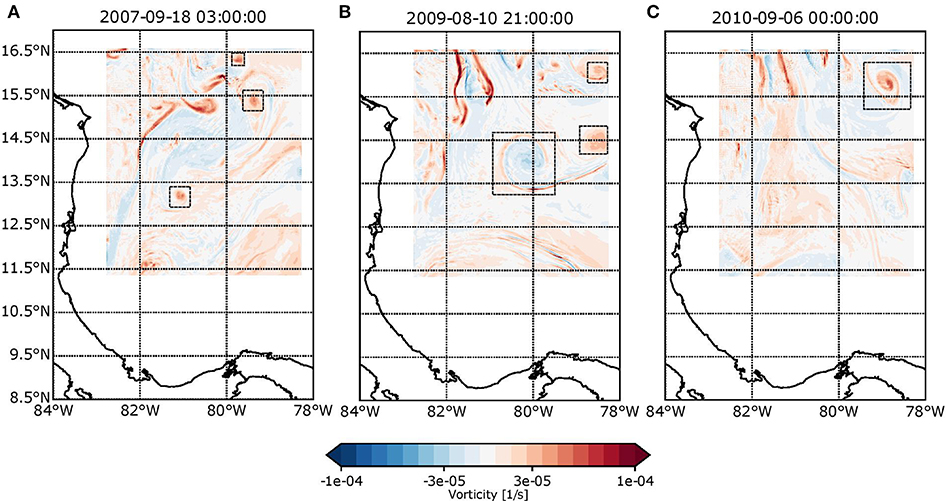
Figure 6. Vorticity fields for (A) 2009-08-10 21:00, (B) 2007-09-18 21:00, and (C) 2010-09-05 21:00. Red coloration indicates anticyclonic spin zones, while blue coloration shows cyclonic spin zones.
In 2010, a cyclonic eddy with a diameter of 60 km influenced the northernmost Seaflower reefs. As it entered lower depths, it lost coherence and was rapidly dissipated (Figure 6C). The recruitment associated with this eddy in B. Alicia was around 4% of the total larvae, whereas the self-recruitment in B. Nuevo was ~12%. Finally, we identified an anticyclonic eddy during 2002 with a diameter of ~50 km. This began to dissipate in Serranilla and disappeared when close to Quitasueño.
Sub-mesoscale eddies with diameters of <15 km were also common in the SFBR. In particular, we found that almost all spawning events were associated with the presence of cyclonic and anticyclonic sub-mesoscale eddies close to Serranilla, B. Alicia, and B. Nuevo, where abrupt bathymetry changes favor their formation. During 2007, we identified at least three sub-mesoscale cyclonic eddies with diameters between 10 km and 15 km moving in a north–south direction and lasting between 15 and 20 days. Two of these eddies entered through the north boundary and strengthened over Serranilla, B. Alicia, and B. Nuevo. The third was formed close to these reefs (Figure 6A). These sub-mesoscale structures linked isolated reefs from north to south, such as B. Nuevo-Albuquerque, B. Nuevo-San Andrés, Quitasueño-Serrana, and Serranilla-Serrana. These results highlight the influence of small-scale eddies on rates of recruitment and self-recruitment since, without their presence, the connections reported here would not have occurred.
The position of the CC bifurcation induced by the presence of the Nicaraguan Rise exhibited highly dynamic behavior during simulated spawning events. During 2000, 2003, 2010, and 2014, the bifurcation occurred close to 15, 14, 14.5, and 15°N, respectively (2, 1, 1.5, and 2° above the mean). During these years, the bifurcation was located in a more northern position in comparison to the mean, and the east side of the SFBR was dominated by a current toward the north, while the current at the west side (and below 14.5°N) was toward the south. During 2007 and 2008, the CC split at 12.5°N, whereas, in 2015, this occurred close to 11.5°N (0.5 and 1.5° below the mean). Cases showing this southernmost position of bifurcation were characterized by an important component of currents toward the south. Finally, 2002 and 2009 were distinguished by a bifurcation that was close to average conditions, which is evident in the significant zonal component of the CC.
At the southwestern margin of the domain, the PCG, a semi-permanent cyclonic gyre, has an influence between 8 and 12.5°N. Nevertheless, this feature may expand or contract; this defines the dynamics of the southernmost reefs (San Andrés, Albuquerque, and Bolívar). In the case of most simulated events, the PCG exerted influence until 12.5°N, for example, during 2000, 2002, 2003, 2008, and 2009, which is similar to its mean (climatological) behavior. During the 2015 event, the PCG contracted until 11.5°N, although during 2014, it expanded to 13°N. During the 2007 and 2010 events, the gyre was not well-defined.
3.3. Connectivity Patterns
Figure 7 shows potential connectivity matrices for each spawning event during El Niño (upper panels), La Niña (middle panels), and neutral ENSO years (lower panel). From these matrices, it is possible to determine that there is connectivity among coral reefs of the SFBR during the simulated spawning events. However, the number of successful links was highly variable over time; for example, in 2000 and 2003, there were only three and four links, respectively, while during 2007 and 2015, there were 24 and 21 successful links between the reefs. In addition, the connection strength was irregular, not only during the same event but also between years. For example, in 2008 there was a wide range of larva recruitment percentages, such as: 1% (B. Alicia-Providencia), 6% (Roncador-Bolívar), 11% (B. Nuevo-Providencia), 18% (self-recruitment in B. Alicia), 38% (self-recruitment in Serranilla), and 56% (Providencia-Quitasueño). Among events, for example, the larva recruitment between Serrana and Quitasueño oscillated between 0% (in 2003, 2007, 2008, 2009, 2010, and 2015) and higher values, i.e., 26% (2000), 29% (2002), and 90% (2014).
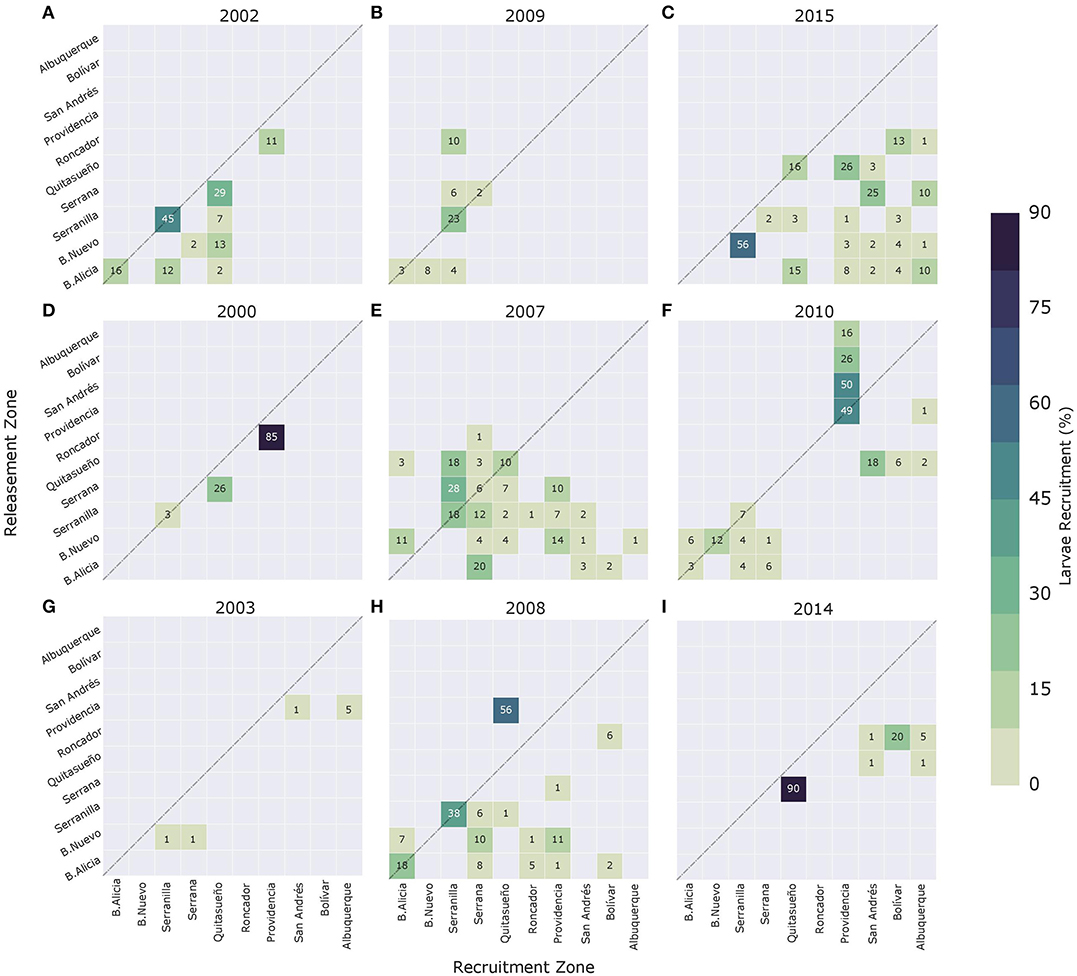
Figure 7. Connectivity matrices for (A) 2002, (B) 2009, (C) 2015, (D) 2000, (E) 2007, (F) 2010, (G) 2003, (H) 2008, and (I) 2014 spawning events. Upper panels correspond to El Niño years, middle panels to La Niña years, and bottom panels to neutral ENSO condition years. Connectivity matrix shows the strength of each connection based on the amount received by reef j (x-axis) and contributed by reef i (y-axis). The diagonal of the matrix indicates reefs where local retention occurs.
Most of the successful connections were concentrated over the sources of B. Alicia, B. Nuevo, and Serranilla (northernmost reefs) as well as in the self-recruitment cases. In the case of the sinks, the larvae were mainly received by the reefs located in the mid-zone, Quitasueño, Serrana, and Providencia. During the 2007, 2008, and 2015 events, the northernmost reefs, B. Alicia, B. Nuevo, and Serranilla, acted as the most important sources for the reefs located in the mid and southernmost zones. In 2000, 2003, 2010, and 2014, the connections were divided into two groups: (i) among the northernmost reefs and (ii) among the mid and southernmost reefs. Finally, during eight of the nine spawning events, the southernmost reefs were not larval sources.
Figure 8A displays the number of events where i-j connection occurred successfully, while Figure 8B shows the contribution of each i-j connection with respect to the overall recruitment across the SFBR for the simulated spawning events. The row sum indicates the number of times in which reef i acts as a source for all reefs (including self-recruitment) and its percentage contribution based on the total amount of recruited larvae in the reserve. On the other hand, the column sum shows the number of times in which reef j acts as a sink and the proportion of larvae received. For instance, B. Nuevo, B. Alicia, and Serranilla were more frequent sources (23, 22, and 18 occasions, respectively) in comparison to other reefs in the reserve. In contrast, the southernmost reefs, i.e., San Andrés, Bolívar, and Albuquerque, were the least frequent sources, with only one successful link during all simulated events. Serrana, Quitasueño, Roncador, and Providencia made 12, 12, 10, and 5 connections, respectively. However, based on the net larva exchange between reefs, Serranilla was the biggest contributor, with an amount close to 60% of larvae, during the simulated spawning events, of which 43% were associated with self-recruitment processes. With a difference close to 50% in the number of larvae provided to the system, reefs, such as B. Nuevo, Quitasueño, and Serrana supplied around 30% of larvae during the simulated events. Finally, the reefs providing the smallest amount of larvae to the system were the southernmost reefs, Albuquerque, San Andrés, and Bolívar, whose contribution was close to 1% each.
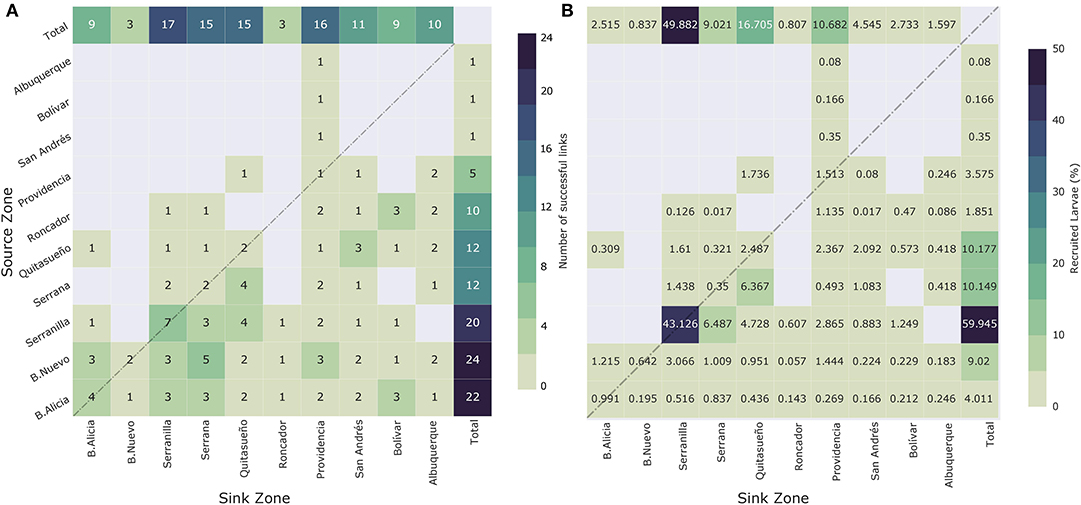
Figure 8. (A) Connectivity summary matrix for all spawning events. Row sums show the number of times that reef i acts as a source for all the reefs. Column sums indicate the number of times that reef j acts as a sink for all reefs (including self-recruitment). (B) Contribution of each i-j connection with respect to the overall recruitment across SFBR for all spawning events. Row sums indicate the percentage contribution of each source i to the total amount of recruited larvae. Column sums indicate the proportion of larvae received by the sink j.
The most recurrent as a sink were Serranilla, Providencia, Quitasueño, and Serrana, acting as such on 16, 16, 15, and 15 occasions across all events. In contrast, B. Nuevo and Roncador functioned as sinks only three times during all of the events. Finally, the B. Alicia, Bolivar, Albuquerque, and San Andres reefs acted as sinks 8, 9, 10, and 11 times, respectively. From a larva exchange point of view, the reef that received the most larvae was Serranilla, receiving ~50% of the total. As mentioned previously, around 43% were associated with self-recruitment processes. Quitasueño, Providencia, and Serrana were also important sinks for the system, receiving 17, 10, and 10% of the total amount of recruited larvae, respectively. The easternmost sinks, B. Nuevo and Roncador, received a lower number of larvae during the events. They received around 2% of the total recruited larvae across all reefs of the SFBR.
The information provided by Figure 8B is partially consistent with the results of Figure 8A. We identified the northernmost reefs B. Nuevo (23), B. Alicia (22), and Serranilla (18) as the most recurrent sources for the system; however, based on the net larva contribution during the simulated spawning events, Serranilla provided most of the larvae. It is essential to highlight that this is the biggest releasement zone (1202.3 km2) in which more larvae were released (> 50%). Therefore, the probability of becoming a relevant source for the system would have been increased. From the net larva contribution, Quitasueño and Serrana exceeded by about 5% the supply made by B. Alicia, which was the second most recurrent larva source; nevertheless, as in the previous case, the two releasement zones exceed the number of larvae released in B. Alicia in 3.5 and 1.5 times, respectively. These results suggest that there is not necessarily equivalence between link recurrence and net larva exchange. For example, the link between Serranilla and Serrana occurred three times, as among B. Alicia and Serrana, but the first linkage with Serranilla as a source amounted to 6.5% of the total quantity of recruits, whereas, for B. Alicia, this was <1%. In contrast, the less frequent sources are consistent with the reefs that provide fewer larvae to the system, i.e., the southernmost reefs Albuquerque, San Andrés, and Bolívar. It is important to note that they have the smallest reef areas in the reserve, and in consequence, fewer larvae were released from them (around 3% from the total). Also, they are highly influenced by the semi-permanent presence of the PCG.
On the other hand, looking at the sinks, the recurrence and net exchange among the reefs allowed us to identify that those located in the middle of the reserve and also the biggest zones (i.e., Providencia, Quitasueño, Serrana, and Serranilla) were the most important during the simulated events. In contrast, the weakest and least frequent sinks were those located on the easternmost (B. Nuevo and Roncador) side of the domain where the east–west direction of the currents does not favor larva recruitment. It is noteworthy that, for example, in B. Nuevo, more than 50% of recruited larvae were supported by self-recruitment processes due to the strong influence of mesoscale eddies. In general terms, the most frequent sink reefs were those in which more larvae were recruited during the simulated spawning events.
We simulated spawning events during El Niño, La Niña, and under neutral ENSO conditions in order to assess the influence of macro-climatic phenomena on surface dynamics and the resulting connectivity patterns, which are shown in Figure 7. Our hydrodynamic results suggest that surface dynamics did not suffer significant changes due to atmospheric fluctuations associated with the ENSO. Consequently, the way in which reefs are connected did not exhibit any pattern since there is high variability in the surface circulation of the domain. To quantitatively evaluate the existence of patterns in connectivity matrices, we applied the CADM test to the distance matrices calculated through Equation 2 for El Niño, La Niña, and neutral ENSO conditions. We got Kendall coefficients of 0.68, 0.65, and 0.65, respectively, with p-values of 0 in all cases. The obtained W coefficients, as well as the p-values, reject the null hypothesis of the complete incongruence of matrices; this evidence suggests the existence of congruence in connectivity matrices based on ENSO conditions. This congruence is linked to the abundant presence of zeros (non-connections) in them; the above implies the existence of a non-connection pattern during the ENSO, given the lack of larva transfer among reefs. We also evaluated differences in the successful connections between pairs of events. Figure 9 indicates the percentage of connections whose i-j position between events is different. For example, between 2002, 2009, and 2015 (El Niño events), the CADM test suggests high congruence due to the number of non-connections in them; however, at least 73% of the successful connections occur in different positions in the matrices. In the case of La Niña, at least 89% of the links differ in position, while for neutral years, it is 95%. In all cases, the percentage of dissimilarity in links is at least 70%, while in some cases, 100% of the connections differ in their position, for example, during 2009–2015, 2003–2014, or 2000–2003. This fact demonstrates high variability in the way the reefs connect over time.
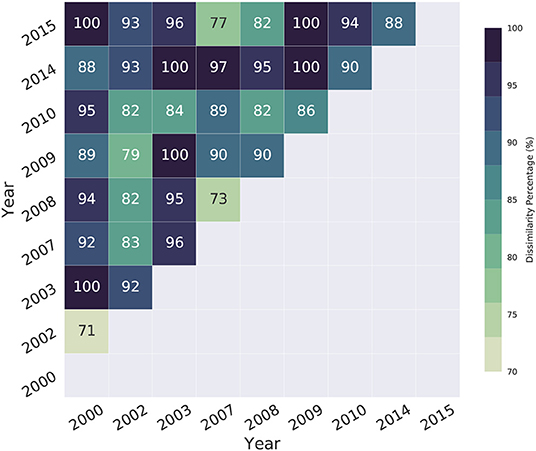
Figure 9. Dissimilarity percentage between pairs of events. This shows the percentage of reef connections between events whose i-j position in the connectivity matrices differs.
3.4. Potential Connectivity vs. Effective Connectivity
Effective connectivity matrices for a daily mortality rate of 15% during the nine spawning events are shown in Figure 10. In general, and as expected, when the mortality rate is included in connectivity measures, links in the matrices are sparser. Weak potential connections (below 5%) are more susceptible to disappearing when mortality is taken into account. The links between Providencia and San Andrés, B. Nuevo and Serranilla, and B. Nuevo and Serrana during the 2003 event (Figure 7G) disappeared when mortality was applied (Figure 10); however, other stronger links, such as B. Nuevo-Quitasueño (13%) in 2002 or Serrana-Providencia (10%) in 2007 also disappeared when using a daily mortality rate of 15%. On the other hand, where potential larval exchange was stronger, the connections lasted but in smaller proportions, and a large number of links with <5% total exchange were found to arise. For effective connectivity, the most recurrent sources are the northernmost reefs, whereas the least recurrent are the southernmost. Serranilla, Providencia, Quitasueño, and Serrana were the most recurrent sinks, whereas B. Nuevo and Roncador were the least common in this regard.
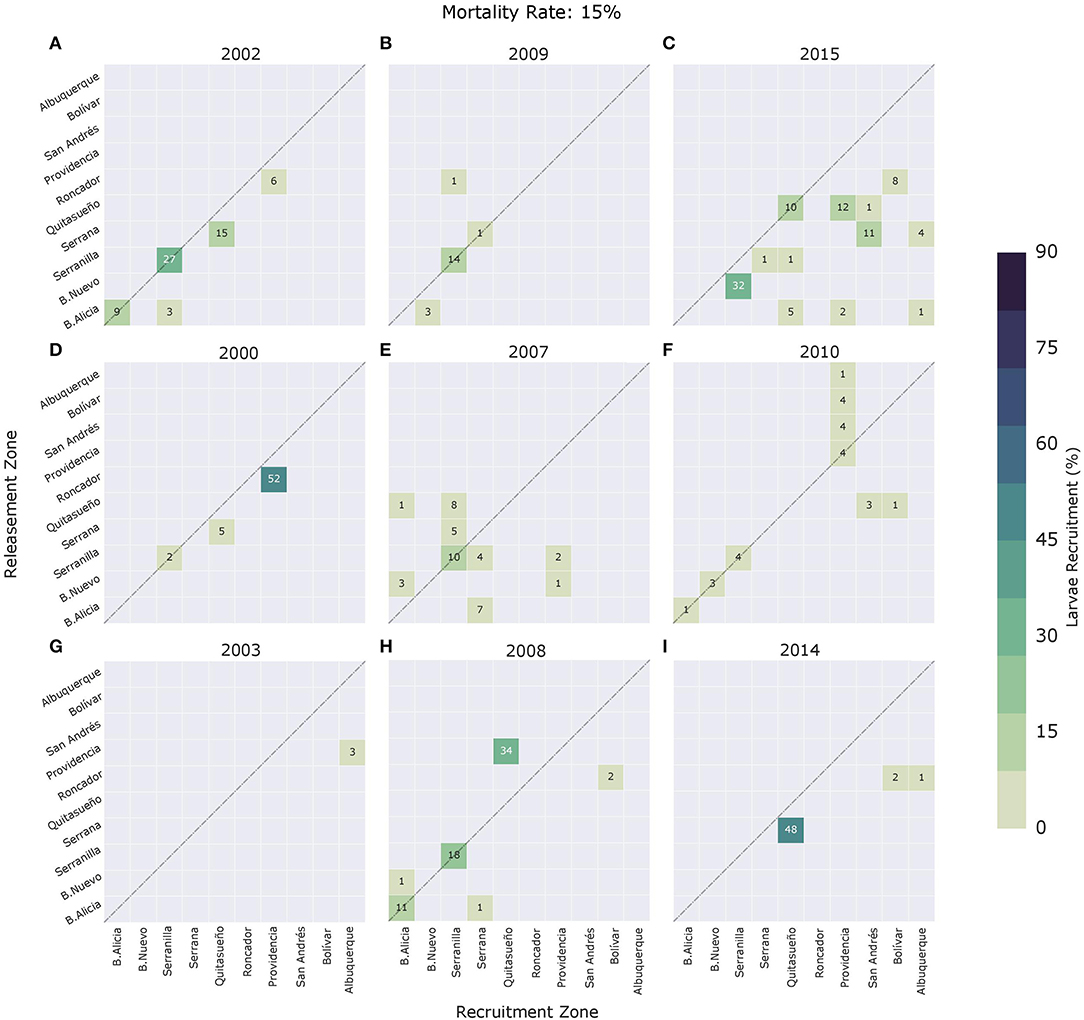
Figure 10. Connectivity matrices for the (A) 2002, (B) 2009, (C) 2015, (D) 2000, (E) 2007, (F) 2010, (G) 2003, (H) 2008, and (I) 2014 spawning events, using a daily mortality rate of 15%. Upper panels correspond to El Niño years, middle panels to La Niña years, and bottom panels to neutral ENSO condition years. Connectivity matrix shows the strength of each connection based on the amount received by reef j (x-axis) and contributed by reef i (y-axis). The diagonal of the matrix indicates reefs where local retention occurs.
4. Discussion
Appropriate representation of the SFBR dynamics at high spatiotemporal scales allowed us to determine that there is indeed reef connectivity in the SFBR. Potential and effective connectivity were found for A. palmata species using a pre-competency period of 3 days and a pelagic larval duration of 25 days.
Connectivity behavior was found to be dynamically associated with: (i) the latitudinal migration of the CC bifurcation, which is itself linked to bathymetric forcing by the Nicaraguan Rise, (ii) the presence of mesoscale and sub-mesoscale coherent structures (eddies), and (iii) the expansion-contraction of the semi-permanent PCG. The patterns described for the CC and the PCG concur with previous findings reported by Andrade (2000, 2001), who reported a dominant CC with an effect in the upper 700 m, high mesoscale variability associated with eddies entering the region through the Antilles Islands, and an intense cyclonic gyre (PCG). Jouanno et al. (2008, 2009) also reported the influence of mesoscale eddies in the Colombian Caribbean and noted that these eddies either came from Brazil or were generated by CC instabilities in Colombian or Venezuelan basins.
Our model suggests that the position of CC bifurcation induced by the bathymetric effect of the Nicaraguan Rise is critical in the configuration of the dynamic system and is a crucial parameter when identifying potential connections among reefs. The bifurcation of the CC controls the larva dispersal patterns in almost all modeled events. Similar behavior was identified in the tropical Atlantic by Endo et al. (2019), where the latitudinal variability in the South Equatorial Current bifurcation was crucial to the meridional transport of individuals. When the CC bifurcation occurs at its northernmost locations (>13°N), such as in 2000, 2003, 2010, and 2014, it acts as a barrier between the southern and northern reefs and favors the links between the middle and southern reefs. This pattern is associated with a current toward the north in B. Nuevo, B. Alicia, and Serranilla that rapidly transports a large amount of the larvae released in these reefs out of the domain. Notwithstanding, the southward current in the west favors connections between middle and southernmost reefs, such as Providencia-Albuquerque, Providencia-San Andrés, and Roncador-Bolívar. In this sense, Sanvicente-Añorve et al. (2018) reported that the mean circulation patterns in the Gulf of Mexico are also associated with complex bathymetry and act as an oceanographic barrier for larval dispersal in the Mississippi Canyon. In contrast, when the CC bifurcation reaches its southernmost positions (i.e., <13°N), for example, in 2007, 2008, and 2015, the predominant connectivity direction is from north to south. During these events, the northernmost reefs of B. Alicia, B. Nuevo, and Serranilla appear to be a source of larvae for reefs located in more southern positions, e.g., Albuquerque, Providencia, Bolívar, and San Andrés, due to the southward current over the domain.
Mesoscale and sub-mesoscale eddies were seen to have significant importance in the connection of isolated reefs and to favor self-recruitment, even when the general circulation patterns did not facilitate it. A large number of sub-mesoscale eddies were generated in the northern part of the domain, where abrupt changes in bathymetry occur (Figure 1). In this regard, Zatsepin et al. (2018) also found that bathymetric roughness associated with underwater banks and its interaction with currents were important factors in sub-mesoscale eddy formation. This fact highlights the importance of studying the role of sub-mesoscale structures in oceanic matter dispersion (e.g., nutrients, sediments) in the SFBR.
Regarding the PCG, it influenced the southernmost reefs (San Andrés, Albuquerque, and Bolívar) and rapidly removed larvae from the domain. It is important to note that the evaluation of the larval re-circulation due to expansion-contraction of the PCG is crucial for understanding the connectivity pattern behavior in the domain; this fact has also been reported, for example, by Staaterman et al. (2012) in the Florida Keys, where the semi-permanent presence of a gyre in the Dry Tortugas region allows more larva retention, resulting in higher self-recruitment rates.
The resulting connectivity measures are highly variable, which is evident both in the existence of the link and its varying strength between individual years. For instance, variability in the Roncador-Bolívar link is seen from the way in which they are connected. In 2008, the connection amounted to 6%, in 2014 it was 20%, and in 2015 it was 13%. No connection existed between them in the other years. Siegel et al. (2008) also demonstrated in California that larval connectivity is inherently an intermittent and heterogeneous process on annual time scales, i.e., it is a stochastic process driven by the interaction between coastal circulation and organisms' life histories. Similarly, Watson et al. (2010) identified variable connectivity in the Southern California Bight (SCB), with the strength of sources and sinks varying between locations and between years. The reason for such heterogeneity lies in the patterns of ocean circulation in the SCB. In the SFBR, the ocean circulation (CC, eddies, and PCG) did not show relationships with ENSO phases; as a consequence, and supported by dissimilarity percentages, the connectivity matrices show high variability in the way the reefs connect over time. In all cases, the difference for connected reefs among events was at least 70%, reaching 100% values in some cases; this implies that linked reefs do not exhibit predictable behavior.
The surface circulation features in the SFBR allowed 105 links in potential connectivity and 52 effective (including self-recruitment) links among the reefs during all of the spawning events modeled. Despite not being part of the MPA (Figure 1), the northernmost reefs, Serranilla, B. Nuevo, and B. Alicia, acted as a larval source, accounting for ~60 and 50% (in potential and effective connectivity, respectively) of the total number of connections. These findings highlight not only the ecological importance of these reefs in long-term system resilience but also illustrate the need to include them within the MPA framework. The integration of reefs into the MPA could be achieved through the redesign of preexisting MPA zonation. As suggested by Schill et al. (2015), the integration of larval dispersal data into a decision-making framework is useful for determining the prioritization of conservation areas and maintenance of the MPA. Herein, we have highlighted the need to include a full 3D high-resolution hydrodynamic field that allows us to take small-scale features into account as well, as they play a key role in the connectivity of coral reefs.
However, based on the total amount of recruited larvae across all reefs, the most significant source was Serranilla, which provided ~60% of larvae to the system. It is important to note that without self-recruitment processes, Serranilla would have supplied around 17% of larvae, a contribution that is very close to those of Serrana, Quitasueño, and B. Nuevo. We also highlight the need to protect the northernmost reefs of Seaflower due to their high self-recruitment rates and the fact that they are high-percentage source regions for reefs, such as Roncador (100%), Serrana (92%), and Bolivar (62%). In this sense, the findings of Suzuki et al. (2011) stand out in suggesting protected area designation where intense self-recruitment occurs, since this is crucial to the resilience of Acropora corals.
In general, effective connectivity matrices are more sparse than potential connectivity matrices as a result of mortality incorporation. In addition, a large amount (65%) of links accounted for up to 5% of larva exchange. This demonstrates the importance of protecting SFBR reefs, since their connections are weak and sparse, and, as a consequence, the resilience of the system could potentially be affected by oceanographic events.
The results of the biophysical modeling presented herein have several limitations and sources of uncertainty. (i) The minimum value among the range of the PP was chosen, which could have led to overestimated recruitment rates (including self-recruitment). However, it is noteworthy that the Colombian Caribbean is a highly energetic basin, and the larvae are rapidly expelled from the domain. In addition, numerical models tend to overestimate current magnitude, as can be seen in Figure 3 through seasonal kinetic energy differences. Due to these factors, the use of higher PP values could lead to underestimation of recruitment percentages and loss of information. Nevertheless, this could be an important source of uncertainty. (ii) We used a mean value of 25 days for the pelagic larval duration parameter. Other calculations showed us that <10% of recruited larvae were recruited 20 days after the releasement; therefore, the impact of the PLD is not bigger, as could be expected. (iii) The polygons used and provided by the Coral Millennium databases do not always account for the precise location of A. palmata and its abundance; this could lead to an overestimation or underestimation of the larval source areas in the Seaflower Reserve. (iv) The absence of genetic analyses limits the model validation.
5. Conclusions
This work has identified the existence of reef connectivity and has characterized the dynamic conditions leading to such connectivity in the SFBR using a numerical modeling approach with high spatio-temporal resolution. This has allowed, for the first time, the exploration of the impact of mesoscale and sub-mesoscale structures on coral larva transport and reef connectivity during nine modeled spawning events. Understanding of the physical drivers and their influence over reef connectivity has been enhanced through the representation of small-scale features present in the region, thus, providing useful information for the identification of critical areas for ecological protection and their incorporation into conservation plans. Despite being a model-based result that may require genetic validation, the results compiled present the most extensive high-resolution connectivity information for this region.
Coral larva transport in the SFBR is highly modulated by the position of CC bifurcation. In cases where the CC bifurcation reaches its northernmost position in comparison to the mean, it acts as a barrier between the northern and southern reefs, whereas its southernmost bifurcation favors connectivity from north to south. The high current speeds and the expansion and contraction of the PCG enable larval release from the San Andrés, Albuquerque, and Bolivar reefs, and these larvae are rapidly trapped on the PCG and removed from the domain.
Alongside with CC and PCG, the region is characterized by mesoscale and sub-mesoscale eddies. The lower part of the Caribbean is constantly populated by large-scale eddies that transit westward and lose coherence as they strike the Nicaraguan Rise. We found a large presence of sub-mesoscale eddies close to Serranilla, B. Alicia, and B. Nuevo, where the abrupt bathymetry changes favor their formation. These mesoscale and sub-mesoscale eddies allow self-recruitment in the northern part of the reserve and are also important larval sources to the southern reefs.
Our results indicate that Serranilla, B. Alicia, and B. Nuevo are key larval sources in the SFBR and contribute to potential and effective connectivity from the recurrence point of view. However, they currently lie outside the MPA protection framework and are located in a common regime area between Colombia and Jamaica. Therefore, we advise that these areas be included in an MPA zonation, as this could consequently improve the effectiveness of the reserve. Our results also suggest the importance of implementation of MPA frameworks between the countries concerned with the reserve, since these could allow the coral populations to be more resilient to environmental changes and less prone to local extinctions.
The existence of links and their strength in connectivity matrices demonstrated high variability between the years and a lack of relation with atmospheric forcing imposed by ENSO phases; therefore, there is no predictable pattern in connected reefs. Nevertheless, the presented matrices are a useful tool for easily interpreting reef to reef connections for ecological managers and decision-makers.
Data Availability Statement
The datasets generated for this study are available on request to the corresponding author.
Author Contributions
LL performed the calculations and analyzed the data. YC, PZ-R, and LL conceived and designed the main research ideas and methods, and worked on the main discussions and conclusions.
Conflict of Interest
The authors declare that the research was conducted in the absence of any commercial or financial relationships that could be construed as a potential conflict of interest.
Acknowledgments
LL thanks COLCIENCIAS for its economic support through Convocatoria 812 de 2018. PAZ-R acknowledge the support from the Royal Academy of Engineering (Project Award IAPP18-19\210). We thank Dr. ANASTAZIA BANASZAK for her valuable comments and suggestions to the document, in particular to the issue related to the species studied and we thank the two reviewers for insightful comments that significantly improved the manuscript.
Supplementary Material
The Supplementary Material for this article can be found online at: https://www.frontiersin.org/articles/10.3389/fmars.2020.00385/full#supplementary-material
Video S1. Vorticity fields and particle dispersion during 2009 spawning event.
Image S1. Serranilla, B. Alicia, and B. Nuevo location.
Image S2. Quitasueño, Serrana, Providencia and Roncador location.
Image S3. San Andrés, Bolívar, and Albuquerque location.
Image S4. Vertical behavior for some particles during 2015 spawning event.
References
Abderrahim, B., and Fillon, C. (2012). Gridded surface wind fields from METOP/ASCAT measurements. Int. J. Rem. Sens. 33, 1729–1754. doi: 10.1080/01431161.2011.600348
Acero, P. A., Tavera, J. J., Polanco, F. A., and Bolaños-Cubillos, N. (2019). Fish biodiversity in three northern islands of the seaflower biosphere reserve (Colombian Caribbean). Front. Mar. Sci. 6:113. doi: 10.3389/fmars.2019.00113
Alexander, M. A., Bladé, I., Newman, M., Lanzante, J. R., Lau, N.-C., and Scott, J. D. (2002). The atmospheric bridge: the influence of enso teleconnections on air–sea interaction over the global oceans. J. Clim. 15, 2205–2231. doi: 10.1175/1520-0442(2002)015<2205:TABTIO>2.0.CO;2
Andrade, C. (2000). The circulation and variability of the Colombian Basin in the Caribbean Sea (Ph.D. thesis), University of Wales, Cardiff, United Kingdom.
Andrade, C. (2001). Las corrientes superficiales en la cuenca de colombia observadas con boyas de deriva. Rev. Acad. Colomb. Cien. Exact. Físic. Nat. 96, 321–335.
Baums, I. B., Paris, C. B., and Chérubin, L. M. (2006). A bio-oceanographic filter to larval dispersal in a reef-building coral. Limnol. Oceanogr. 51, 1969–1981. doi: 10.4319/lo.2006.51.5.1969
Becker, B. J., Levin, L. A., Fodrie, F. J., and McMillan, P. A. (2007). Complex larval connectivity patterns among marine invertebrate populations. Proc. Natl. Acad. Sci. U.S.A. 104, 3267–3272. doi: 10.1073/pnas.0611651104
Bolaños, N., Abril, A., Bent, H., Caldas, J., and Acero, A. (2015). Lista de peces conocidos del archipiélago de san andrés, providencia y santa catalina, reserva de la biosfera seaflower, caribe occidental colombiano. Bol. Investig. Mar. Cost. José Benito Vives Andrésis (INVEMAR) 44, 127–162. doi: 10.25268/bimc.invemar.2015.44.1.24
Campbell, V., Legendre, P., and Lapointe, F.-J. (2011). The performance of the congruence among distance matrices (cadm) test in phylogenetic analysis. BMC Evol. Biol. 11:64. doi: 10.1186/1471-2148-11-64
Chamberland, V. F., Vermeij, M. J., Brittsan, M., Carl, M., Schick, M., Snowden, S., et al. (2015). Restoration of critically endangered elkhorn coral (Acropora palmata) populations using larvae reared from wild-caught gametes. Glob. Ecol. Conserv. 4, 526–537. doi: 10.1016/j.gecco.2015.10.005
CORALINA-INVEMAR (2012). Atlas de la Reserva de Biósfera Seaflower. Archipiélago de San Andrés, Providencia y Santa Catalina. Santa Marta: Serie de Publicaciones Especiales de INVEMAR # 28.
Dee, D. P., Uppala, S., Simmons, A., Berrisford, P., Poli, P., Kobayashi, S., et al. (2011). The era-interim reanalysis: configuration and performance of the data assimilation system. Q. J. R. Meteorol. Soc. 137, 553–597 doi: 10.1002/qj.828
Díaz, J. M., Sánchez, J. A., and Geister, J. (1997). “Development of lagoonal reefs in oceanic reef complexes of the southwestern Caribbean: geomorphology, structure and distribution,” in Proceedings 8th International Coral Reef Symposium, Vol. 1 (Panamá), 779–784.
Díaz, J. M., Barrios, L. M., Cendales, M. H., Garzón-Ferreira, J., Geister, J., Parra-Velandia, F., et al. (2000). Áreas coralinas de colombia. Invemar Serie Publ. Especial. 5:176.
Endo, C. A. K., Gherardi, D. F. M., Pezzi, L. P., and Lima, L. N. (2019). Low connectivity compromises the conservation of reef fishes by marine protected areas in the tropical south atlantic. Sci. Rep. 9:8634. doi: 10.1038/s41598-019-45042-0
Ferry, N., Parent, L., Garric, G., Barnier, B., Jourdain, N. C., and the Mercator Ocean team (2012). Global eddy permitting ocean reanalysis GLORYS1V1: description and results. Mercator Q. Newslett. 36, 15–27.
Foster, N. L., Paris, C. B., Kool, J. T., Baums, I. B., Stevens, J. R., Sanchez, J. A., et al. (2012). Connectivity of caribbean coral populations: complementary insights from empirical and modelled gene flow. Mol. Ecol. 21, 1143–1157. doi: 10.1111/j.1365-294X.2012.05455.x
Geister, J., and Díaz, J. (2007). Ambientes arrecifales y geologyía de un archipiélago oceánico: San Andrés, Providencia y Santa Catalina (Mar Caribe, Colombia) con guía de campo. Bogotá: Ingeominas.
Giannini, A., Cane, M. A., and Kushnir, Y. (2001a). Interdecadal changes in the enso teleconnection to the caribbean region and the north atlantic oscillation. J. Clim. 14, 2867–2879. doi: 10.1175/1520-0442(2001)014<2867:ICITET>2.0.CO;2
Giannini, A., Chiang, J. C. H., Cane, M. A., Kushnir, Y., and Seager, R. (2001b). The enso teleconnection to the tropical atlantic ocean: contributions of the remote and local ssts to rainfall variability in the tropical americas. J. Clim. 14, 4530–4544. doi: 10.1175/1520-0442(2001)014<4530:TETTTT>2.0.CO;2
Giannini, A., Kushnir, Y., and Cane, M. A. (2000). Interannual variability of Caribbean rainfall, ENSO, and the Atlantic Ocean. J. Clim. 13, 297–311. doi: 10.1175/1520-0442(2000)013<0297:IVOCRE>2.0.CO;2
Idárraga-García, J., and León, H. (2019). Unraveling the underwater morphological features of roncador bank, Archipelago of Aan Andres, Providencia and Santa Catalina (Colombian Caribbean). Front. Mar. Sci. 6:77. doi: 10.3389/fmars.2019.00077
Institute for Marine Remote Sensing University of South Florida (IMaRS/USF), Institut de Recherche pour le Développement (IRD), UNEP-WCMC, The WorldFish Center, and WRI. (2011). Global Coral Reefs Composite Dataset Compiled from Multiple Sources for use in the Reefs at Risk Revisited Project Incorporating Products from the Millennium Coral Reef Mapping Project prepared by IMaRS/USF and IRD.
Japaud, A., Fauvelot, C., and Bouchon, C. (2013). “Populations genetic study of the corals Acropora palmata and Acropora cervicornis of Guadeloupe (French West Indies) in view of their preservation,” in Proceedings of the 66 th Gulf and Caribbean Fisheries Institute. doi: 10.1071/MF14181
Johnson, M., Lustic, C., Bartels, E., Baums, I., Gilliam, D., Larson, L., et al. (2011). Caribbean Acropora Restoration Guide: Best Practices for Propagation and Population Enhancement. Caribbean Acropora Restoration Guide. The Nature Conservancy.
Jordan, A. (2018). Patterns in Caribbean coral spawning (Master's thesis), Nova Southeastern University, Fort Lauderdale, FL, United States.
Jouanno, J., Sheinbaum, J., Barnier, B., and Molines, J.-M. (2009). The mesoscale variability in the caribbean sea. Part II: energy sources. Ocean Model. 26, 226–239. doi: 10.1016/j.ocemod.2008.10.006
Jouanno, J., Sheinbaum, J., Barnier, B., Molines, J.-M., Debreu, L., and Lemarié, F. (2008). The mesoscale variability in the caribbean sea. Part I: simulations and characteristics with an embedded model. Ocean Model. 23, 82–101. doi: 10.1016/j.ocemod.2008.04.002
Legendre, P. (2005). Species associations: the Kendall coefficient of concordance revisited. J. Agric. Biol. Environ. Stat. 10:226. doi: 10.1198/108571105X46642
Lequeux, B. D., Ahumada-Sempoal, M.-A., López-Pérez, A., and Reyes-Hernández, C. (2018). Coral connectivity between equatorial eastern pacific marine protected areas: a biophysical modeling approach. PLoS ONE 13:e0202995. doi: 10.1371/journal.pone.0202995
Lett, C., Verley, P., Mullon, C., Parada, C., Brochier, T., Penven, P., et al. (2008). A lagrangian tool for modelling ichthyoplankton dynamics. Environ. Model. Softw. 23, 1210–1214. doi: 10.1016/j.envsoft.2008.02.005
Lonin, S. C., Prada, M., and Erick, C. (2010). “Simulación de dispersión de las larvas de caracol pala strombus gigas en la reserva de biósfera seaflower, Caribe occidental Colombiano,” in Boletín Científico CIOH (Colombia), 8–24. doi: 10.26640/22159045.212
Mayorga-Adame, C. G., Batchelder, H. P., and Spitz, Y. H. (2017). Modeling larval connectivity of coral reef organisms in the Kenya-Tanzania region. Front. Mar. Sci. 4:92. doi: 10.3389/fmars.2017.00092
Medel, C., Parada, C. E, Morales, C., Pizarro, O., Ernst, B., and Conejero, C. (2018). How biophysical interactions associated with sub- and mesoscale structures and migration behavior affect planktonic larvae of the spiny lobster in the Juan Fernández Ridge: a modeling approach. Prog. Oceanogr. 162, 98–119. doi: 10.1016/j.pocean.2018.02.017
Montoya, R. (2014). Variabilidad estacional e interanual del balance de calor en la capa de mezcla superficial en el mar caribe (Master's thesis), Universidad Nacional de Colombia, Bogotá, Colombia.
NMFS (2015). Recovery Plan for Elkhorn (Acropora palmata) and Staghorn (A. cervicornis) Corals. Technical report, National Marine Fisheries Service.
North, E. W., Gallego, A., and Petitgas, P. (2009). Manual of Recommended Practices for Modelling Physical-Biological Interactions During Fish Early Life. International Council for the Exploration of the Sea.
Peliz, A., Marchesiello, P., Dubert, J., Marta-Almeida, M., Roy, C., and Queiroga, H. (2007). A study of crab larvae dispersal on the Western Iberian shelf: physical processes. J. Mar. Syst. 68, 215–236. doi: 10.1016/j.jmarsys.2006.11.007
Penven, P., Marchesiello, P., Debreu, L., and Lefèvre, J. (2008). Software tools for pre-and post-processing of oceanic regional simulations. Environ. Model. Softw. 23, 660–662. doi: 10.1016/j.envsoft.2007.07.004
Prato, J., and Rixcie, N. (2015). Aproximación a la valoración económica ambiental del departamento Archipiélago de San Andrés, Providencia y Santa Catalina–Reserva de la Biósfera Seaflower. Bogotá: Secretaría Ejecutiva de la Comisión Colombiana del Océano SECCO, Corporación para el desarrollo sostenible del Archipiélago de San Andrés, Providencia y Santa Catalina-CORALINA.
Raitsos, D. E., Brewin, R. J., Zhan, P., Dreano, D., Pradhan, Y., Nanninga, G. B., et al. (2017). Sensing coral reef connectivity pathways from space. Sci. Rep. 7:9338. doi: 10.1038/s41598-017-08729-w
Randall, C. J., and Szmant, A. M. (2009). Elevated temperature affects development, survivorship, and settlement of the elkhorn coral, Acropora palmata (Lamarck 1816). Biol. Bull. 217, 269–282. doi: 10.1086/BBLv217n3p269
Ricciardulli, L., Wentz, F. J., and Smith, D. K. (2011). Remote Sensing Systems QuikSCAT Ku-2011 Daily. Ocean Vector Winds on 0.25 deg grid, Version 4. Santa Rosa, CA: Remote Sensing Systems.
Richardson, P. (2005). Caribbean current and eddies as observed by surface drifters. Deep Sea Res. II Top. Stud. Oceanogr. 52, 429–463. doi: 10.1016/j.dsr2.2004.11.001
Rodríguez-Martínez, R. E., Banaszak, A. T., McField, M. D., Beltran-Torres, A. U., and Alvarez-Filip, L. (2014). Assessment of acropora palmata in the mesoamerican reef system. PLoS ONE 9:e96140. doi: 10.1371/journal.pone.0096140
Romero, M., Treml, E., Acosta, A., and Paz, D. (2018). The eastern tropical pacific coral population connectivity and the role of the eastern pacific barrier. Sci. Rep. 8:9354. doi: 10.1038/s41598-018-27644-2
Roughgarden, J., Gaines, S., and Possingham, H. (1988). Recruitment dynamics in complex life cycles. Science 241, 1460–1466. doi: 10.1126/science.11538249
Ruiz, M. (2011). Variabilidad de la Cuenca Colombia (mar Caribe) asociada con El Niño-Oscilación del Sur, vientos Alisios y procesos locales (Ph.D. thesis), Universidad Nacional de Colombia, Bogotá, Colombia.
Sánchez-Jabba, A. M. (2012). Manejo ambiental en seaflower, reserva de biosfera en el archipiélago de San Andrés, Providencia y Santa Catalina. Cartagena: Documentos de Trabajo Sobre Economía Regional y Urbana; No. 176.
Sanvicente-Añorve, L., Zavala-Hidalgo, J., Allende-Arandía, E., and Hermoso-Salazar, M. (2018). Larval dispersal in three coral reef decapod species: influence of larval duration on the metapopulation structure. PLoS ONE 13:e0193457. doi: 10.1371/journal.pone.0193457
Schill, S. R., Raber, G. T., Roberts, J. J., Treml, E. A., Brenner, J., and Halpin, P. N. (2015). No reef is an island: integrating coral reef connectivity data into the design of regional-scale marine protected area networks. PLoS ONE 10:e0144199. doi: 10.1371/journal.pone.0144199
Siegel, D. A., Mitarai, S., Costello, C. J., Gaines, S. D., Kendall, B. E., Warner, R. R., et al. (2008). The stochastic nature of larval connectivity among nearshore marine populations. Proc. Natl. Acad. Sci. U.S.A. 105, 8974–8979. doi: 10.1073/pnas.0802544105
Staaterman, E., Paris, C. B., and Helgers, J. (2012). Orientation behavior in fish larvae: a missing piece to hjort's critical period hypothesis. J. Theor. Biol. 304, 188–196. doi: 10.1016/j.jtbi.2012.03.016
Suzuki, G., Arakaki, S., and Hayashibara, T. (2011). Rapid in situ settlement following spawning by acropora corals at Ishigaki, Southern Japan. Mar. Ecol. Prog. Ser. 421, 131–138. doi: 10.3354/meps08896
UNEP-WCMC WorldFish Centre, WRI, TNC. (2018). Global Distribution of Warm-water Coral Reefs, Compiled from Multiple Sources Including the Millennium Coral Reef Mapping Project. Version 4.0. Includes contributions from IMaRS-USF and IRD (2005), IMaRS-USF (2005) and Spalding et al. (2001). Cambridge,UK: UN Environment World Conservation Monitoring Centre. Available online at: http://data.unep-wcmc.org/datasets/1
Vega, J., Díaz, C., Gómez, K., López, T., Díaz, M., and Gómez, I. (2015). Biodiversidad marina en bajo nuevo, bajo alicia, y banco serranilla, reserva de biosfera seaflower. Bol. Investig. Mar. Costeras José Benito Vives de Andrésis (INVEMAR) 44, 199–224. doi: 10.25268/bimc.invemar.2015.44.1.27
Watson, J., Mitarai, S., Siegel, D., Caselle, J., Dong, C., and McWilliams, J. (2010). Realized and potential larval connectivity in the southern california bight. Mar. Ecol. Prog. Ser. 401, 31–48. doi: 10.3354/meps08376
Weatherall, P., Marks, K. M., Jakobsson, M., Schmitt, T., Tani, S., Arndt, J. E., et al. (2015). A new digital bathymetric model of the world's oceans. Earth Space Sci. 2, 331–345. doi: 10.1002/2015EA000107
Wood, S., Paris, C., Ridgwell, A., and Hendy, E. (2014). Modelling dispersal and connectivity of broadcast spawning corals at the global scale. Glob. Ecol. Biogeogr. 23, 1–11. doi: 10.1111/geb.12101
Zatsepin, A., Kubryakov, A., Aleskerova, A., Elkin, D., and Kukleva, O. (2018). Physical mechanisms of submesoscale eddies generation: evidences from laboratory modeling and satellite data in the black sea. Ocean Dyn. 69, 253–266. doi: 10.1007/s10236-018-1239-4
Zhong, Y., and Bracco, A. (2013). Submesoscale impacts on horizontal and vertical transport in the Gulf of Mexico. J. Geophys. Res. Oceans 118, 5651–5668. doi: 10.1002/jgrc.20402
Keywords: seaflower, ocean modeling, coral dispersal, surface currents, recruitment, eddies
Citation: Lopera L, Cardona Y and Zapata-Ramírez PA (2020) Circulation in the Seaflower Reserve and Its Potential Impact on Biological Connectivity. Front. Mar. Sci. 7:385. doi: 10.3389/fmars.2020.00385
Received: 07 June 2019; Accepted: 05 May 2020;
Published: 16 June 2020.
Edited by:
Sonia Bejarano, Leibniz Centre for Tropical Marine Research (LG), GermanyReviewed by:
Pablo Saenz-Agudelo, Austral University of Chile, ChileTimothée Brochier, IRD UMR209 Unité de Modélisation Mathématique et Informatique de Systèmes Complexes (UMMISCO), France
Copyright © 2020 Lopera, Cardona and Zapata-Ramírez. This is an open-access article distributed under the terms of the Creative Commons Attribution License (CC BY). The use, distribution or reproduction in other forums is permitted, provided the original author(s) and the copyright owner(s) are credited and that the original publication in this journal is cited, in accordance with accepted academic practice. No use, distribution or reproduction is permitted which does not comply with these terms.
*Correspondence: Luisa Lopera, lfloperag@unal.edu.co