Transcriptomic Analysis of Liver Tissue in Fat Greenling (Hexagrammos otakii) Exposed to Elevated Ambient Ammonia
 Li Li1
  Fawen Hu
- 1Shandong Key Laboratory of Disease Control in Mariculture, Marine Biology Institute of Shandong Province, Qingdao, China
- 2Precision Medicine Center of Oncology, The Affiliated Hospital of Qingdao University, Qingdao, China
Fat greenling (Hexagrammos otakii) is an important aquaculture fish species in northern China. Unfortunately, the increase of nitrogen in water due to residual feed and animal feces has caused considerable losses to the fat greenling breeding industry. Studies on detoxification metabolism and immune responses of fat greenling under ammonia stress have not been carried out. We used high-throughput sequencing to extract RNA from the liver of fat greenling, 48 and 96 h post-exposure, to water containing 30 mg/L NH4Cl. A total of 87,675 high-quality unigenes were obtained by transcriptome analysis, the N50 and mean length were 1,523 and 772 bp, respectively. There were 320 and 272 genes (DEGs) identified in the two sampling times (48 and 96 h), containing 132 and 137 significantly up-regulated genes, and 188 and 135 down-regulated genes, respectively. Ten DEGs were randomly selected for validation by quantitative PCR. Further annotation and analysis indicated that the DEGs were enriched in the MAPK-signaling pathway, FOXO-signaling pathway, phosphatidylinositol-signaling pathway, cytokine-cytikine receptor interaction, Hippo-signaling pathway, and neuroactive ligand-receptor interaction. These pathways were mainly related to oxidative stress and immune responses. This research provides a valuable resource to further study of detoxification metabolism and immune responses of fat greenling under ammonia stress.
Introduction
Fat greenling (Hexagrammos otakii) is one of the most important marine economic fish, largely because of its high-quality meat. In China, fat greenling are mainly distributed in the Yellow Sea, the Bohai Sea, and the East China Sea (Habib et al., 2011; Hu et al., 2017). With rapid aquaculture intensification and increased scales of production, nitrogen (especially ammonia) pollution from the aquaculture industry has become increasingly problematic. Degradation of nitrogenous organic matter, such as residuals from bait and fish excrement, increases the load of nitrogenous chemicals in surrounding waters. Increases of ammonia in aquaculture water may result in disease or death of fat greenling, which may restrict further development of the fat greenling aquaculture industry.
Ammonia nitrogen exists in two forms, namely, non-ionic ammonia (NH3) and ionic ammonium (NH4+); ionic ammonium is non-toxic to aquatic animals, but non-ionic ammonia may be harmful (Constable et al., 2003). Non-ionic ammonia can directly affect gills of fish and has a significant impact on enzymatic hydrolysis reactions and the stability of cell membranes. In some cases aquatic animals die, causing severe economic losses (DeFreitas et al., 2000; Koo et al., 2005). Studies also have shown that long-term exposure to NH3-N could affect the antioxidant enzyme activity of fish, destroy antioxidant systems, and reduce immune capacity (Hegazi et al., 2010; Yang et al., 2010, 2011). Under chronic ammonia stress, it also could affect osmotic pressure balance and cause death of nerve cells. As content of ammonia in tissues increases, damage to the liver and kidney systems, congestion, and hepatic comas may ensue (Felipo et al., 1994; Randall and Tsui, 2002; Eddy, 2005; Benli et al., 2008; Wilkie et al., 2011). Many studies have shown that liver plays a key role in homeostatic processes (Alvarellos et al., 2005; Alves et al., 2010; Cordeiro et al., 2012). When a fish is under stress, the liver provides energy needed by other tissues as amino acid catabolism occurs (Vijayan et al., 1990; Mommsen et al., 1999; Aluru and Vijayan, 2007), to help reduce risk of ammonia poisoning (Walsh and Mommsen, 2001; Ip et al., 2004). There has been little study of response mechanisms to ammonia stress in fat greenling.
RNA-Seq is a powerful high-throughput sequencing method, which has been widely used in a variety of fish research, including minnows (Gobiocypris rarus) (Gao et al., 2015), topmouth culter (Culter alburnus) (Zhao et al., 2016), and Mandarin fish (Siniperca chuatsi) (Hu et al., 2015). To better understand the liver detoxification mechanism of fat greenling under ammonia nitrogen stress, after ammonia nitrogen exposure, we used transcriptomic profiling on fat greenling liver, targeting differentially expressed genes (DEGs) and cellular signaling pathways. We also focused analysis on the anti-oxidative system and immune responses. In doing so, we provide new data on detoxification of ammonia by fish livers.
Materials and Methods
Experiment and Sample Collection
Fat greenling (400–500 g) were obtained from Luhai Aquatic Technology Development Company of Qingdao, China. Fish were acclimated in tanks (5 m3) containing aerated sand-filtered seawater (salinity 31%, pH 7.9–8.1, dissolved oxygen 6 mg/L) at 20 ± 0.5°C for 3 weeks before experiments. During the acclimation period, half of the water was replaced twice a day in each tank, and fish were fed to satiation with special feed twice a day. Fish were fasted for 48 h before (and then during) ammonia exposure experiments.
Following studies that have previously suggested 96 h LC50 values for fat greenling was 39.35 mg/L, we performed a preliminary experiment to determine optimal ammonia concentration. Based on results from our preliminary experiment, 30 mg/L NH4Cl was chosen for the 48 and 96 h trials. Animals were randomly divided into the experimental group (48, 96 h) and control group (seawater only) with 3 replicates, each of which had 6 fishes. After anaesthetizing with MS-222, 3 fish livers from each replicate were removed and immediately submerged in 10 ml RNAlater (Ambion, United States) at 0 (as control), 48, and 96 h after exposure experiment. Tissues were stored at -80°C until RNA extraction.
RNA Isolation and Illumina Sequencing
RNA was extracted from each liver sample using Trizol reagent (Invitrogen, United States) following the manufacturing protocol. RNA degradation and contamination were detected using a 1% agarose gel. RNA purity was measured using the NanoPhotometer® spectrophotometer (IMPLEN, CA, United States). RNA concentration was measured using Qubit® RNA Assay Kit in Qubit2.0® Fluorometer (Life Technologies, CA, United States). RNA integrity was measured using the RNA Nano 6000 Assay Kit of the Agilent Bioanalyzer 2100 system (Agilent Technologies, CA, United States). The RNA of each mixed sample is divided into two parts: one is used for transcriptome sequencing and the other is used for real-time fluorescence quantitative PCR (qRT-PCR) to validate the reproducibility of DEGs data obtained from transcriptome sequencing.
Sequencing libraries were generated using NEBNext®UltraTM RNA Library Prep Kit for Illumina (NEB, United States) according to the manufacturer’s recommendations; index codes were added to attribute sequences to each sample. Briefly, purification of mRNA from total RNA with poly-T oligo-attached magnetic beads. First, cDNA strands were synthesized using random hexamer primers and M-MuLV reverse transcriptase (RNase H-). Second, cDNA strand synthesis using DNA polymerase I and RNase H. Select 150–200 bp cDNA fragments and use the AMPure XP system to purify the library fragments (Beckman Coulter, Beverly, CA, United States). The PCR products were purified by AMPure XP system and library quality was assessed on the Agilent Bioanalyzer 2100 system. Then, sequencing was carried out by BioMarker (Beijing, China) using the Illumina Hiseq 2000 platform.
Transcriptome Assembly, Quality Control, and Gene Functional Annotation
The protocols of transcriptome assembly and annotation were provided by BioMarker (Beijing, China). Briefly, raw reading in fastq format is handled by an internal perl script. Clean reads were obtained by deleting reads including adapters or ploy-N, as well as low quality reads. Calculate the Q20, Q30, GC-content, and sequence duplication level of the clean data. All downstream analyses were based on high-quality cleaning data. The clean reads were spliced and assembled into transcript using Trinity software (Haas et al., 2011), and the longest transcript under each gene was extracted as a unigene (Altschul et al., 1990).
Gene function was annotated based on the following databases: NR (NCBI non-redundant protein sequences); Pfam (Protein family) (Coggill et al., 2012); KOG/COG/eggNOG (Clusters of Orthologous Groups of Proteins) (Fedorova et al., 2004); Swiss-Prot (a manually annotated and reviewed protein sequence database) (Bairoch et al., 2003); KEGG (Kyoto Encyclopedia of Genes and Genomes) (Kanehisa, 2000); and GO (Gene Ontology).
Quantification of Gene Expression Levels and Differential Expression Analysis
Gene expression levels were estimated by RSEM for each sample (Li and Dewey, 2011). The read count for each unigene comes from the mapping results and then normalized to FPKM (expected number of Fragments Per Kilobase of transcript sequence per Millions base pairs sequenced) (Trapnell et al., 2010).
Differential expression was performed using the DESeq R package (1.10.1) with biological replicates (Anders and Huber, 2010). DESeq provides statistical routines for determining differential expression of digital gene expression data using a model based on the negative binomial distribution. The resulting p-value uses Benjamini and Hochberg’s method to control the false discovery rate. Genes with an adjusted p < 0.05 after DESeq adjustment were assigned as differentially expressed (Benjamini and Hochberg, 1995).
GO/KEGG Enrichment Analysis for DEGs
Gene topological (GO) enrichment analysis was performed on differentially expressed genes (DEGs) using topGO R package based on Kolmogorov-Smirnov test. All DEGs of fat greenling liver were mapped to GO terms in the GO database. The study set represented the GO terms of all identified DEGs. The calculated p-value was corrected by Bonferroni, with p ≤ 0.05 as the threshold.
According to KEGG database resources, pathway enrichment analysis was performed to find significantly enriched signal transduction or metabolic pathways. KOBAS (Mao et al., 2005) software was used to detect the enrichment of differentially expressed genes in the KEGG pathway.
Quantitative Real-Time PCR (qRT-PCR)
To validate reliability of DEGs data obtained from the transcriptome sequencing in liver of fat greenling, selected 10 differently expressed genes for qRT-PCR detection. Primers for qRT-PCR were designed with Premier 5.0 (Table 1). Briefly, the same RNA samples were used for sequencing, and the cDNA was synthesized using the TransScript II All-in-One First-Strand cDNA Synthesis SuperMix for qPCR (One-Step gDNA Removal). The qRT-PCR was carried out using Bio-Rad CFX96. All reactions were done in triplicate. The 30524 gene was used as the internal reference. Expression levels were quantitatively analyzed using the 2–Δ Δ CT method (Schmittgen and Livak, 2001), and all data were given in terms of relative mRNA expression. Differences between the experimental group and the control group were used to assess changes in gene expression.
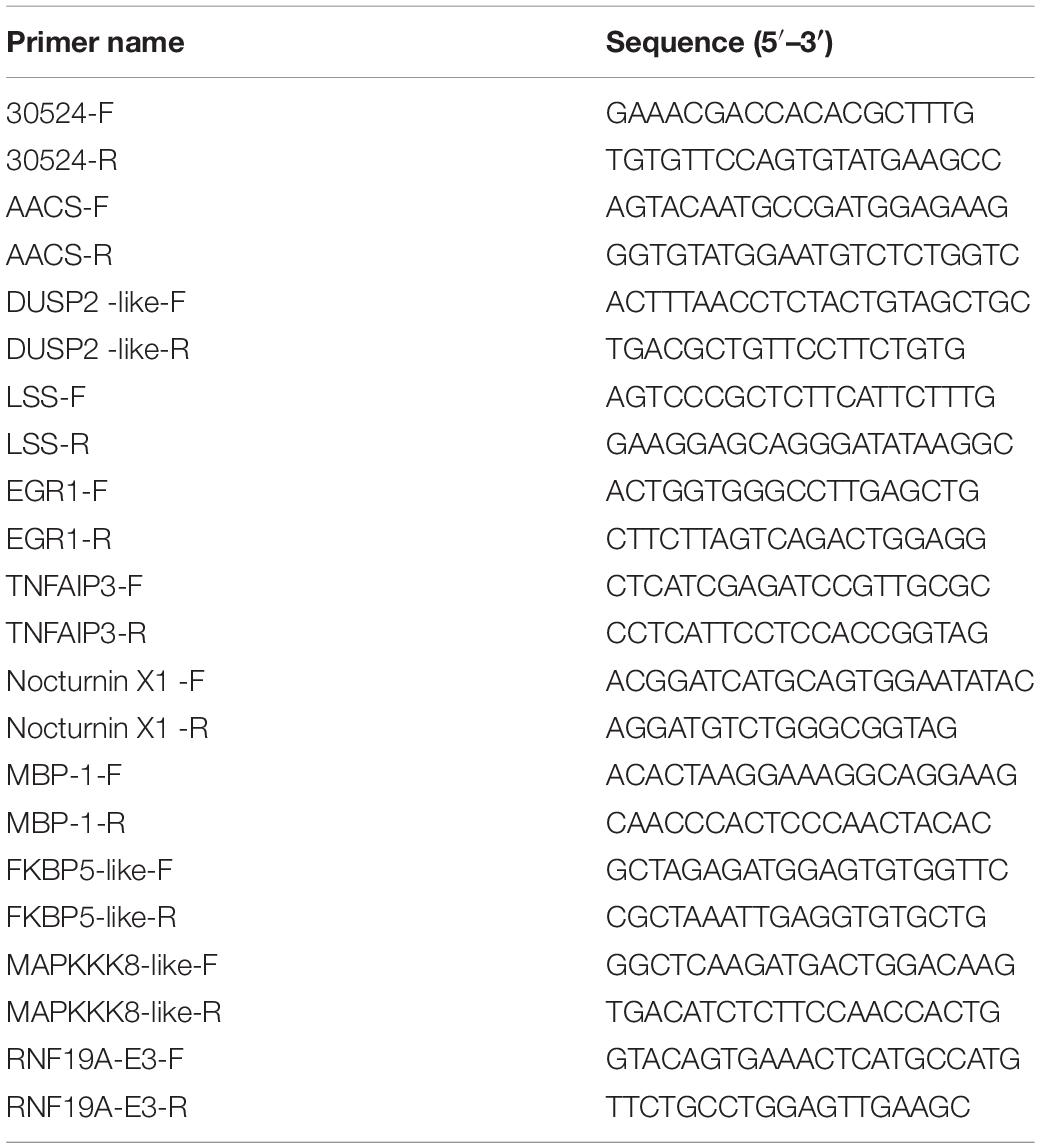
Table 1. Sequences of primers used in qRT-PCR analysis.
Results
Sequencing and de novo Assembly of Fat Greenling Transcriptome Data
In total, 195,335 transcripts with an average length of 1,647bp were generated. After assembling clean reads, 87,675 unigenes were generated from 195,335 transcripts, with a N50 and mean length of 1,523 and 772 bp, respectively, were generated from 195,335 transcripts (Table 2). There were 8,007 unigenes larger than 2,000 bp (Figure 1). The sequencing data of each treatment and control group have been stored in NCBI sequence read archive database with the accession number SAMN11155636. The major characteristics of each library, including clean reads, GC content, and Q30, are summarized in Table 3.
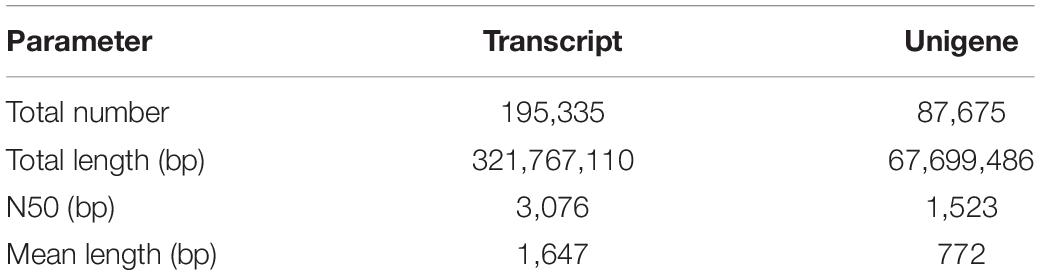
Table 2. Summary of sequence analysis.
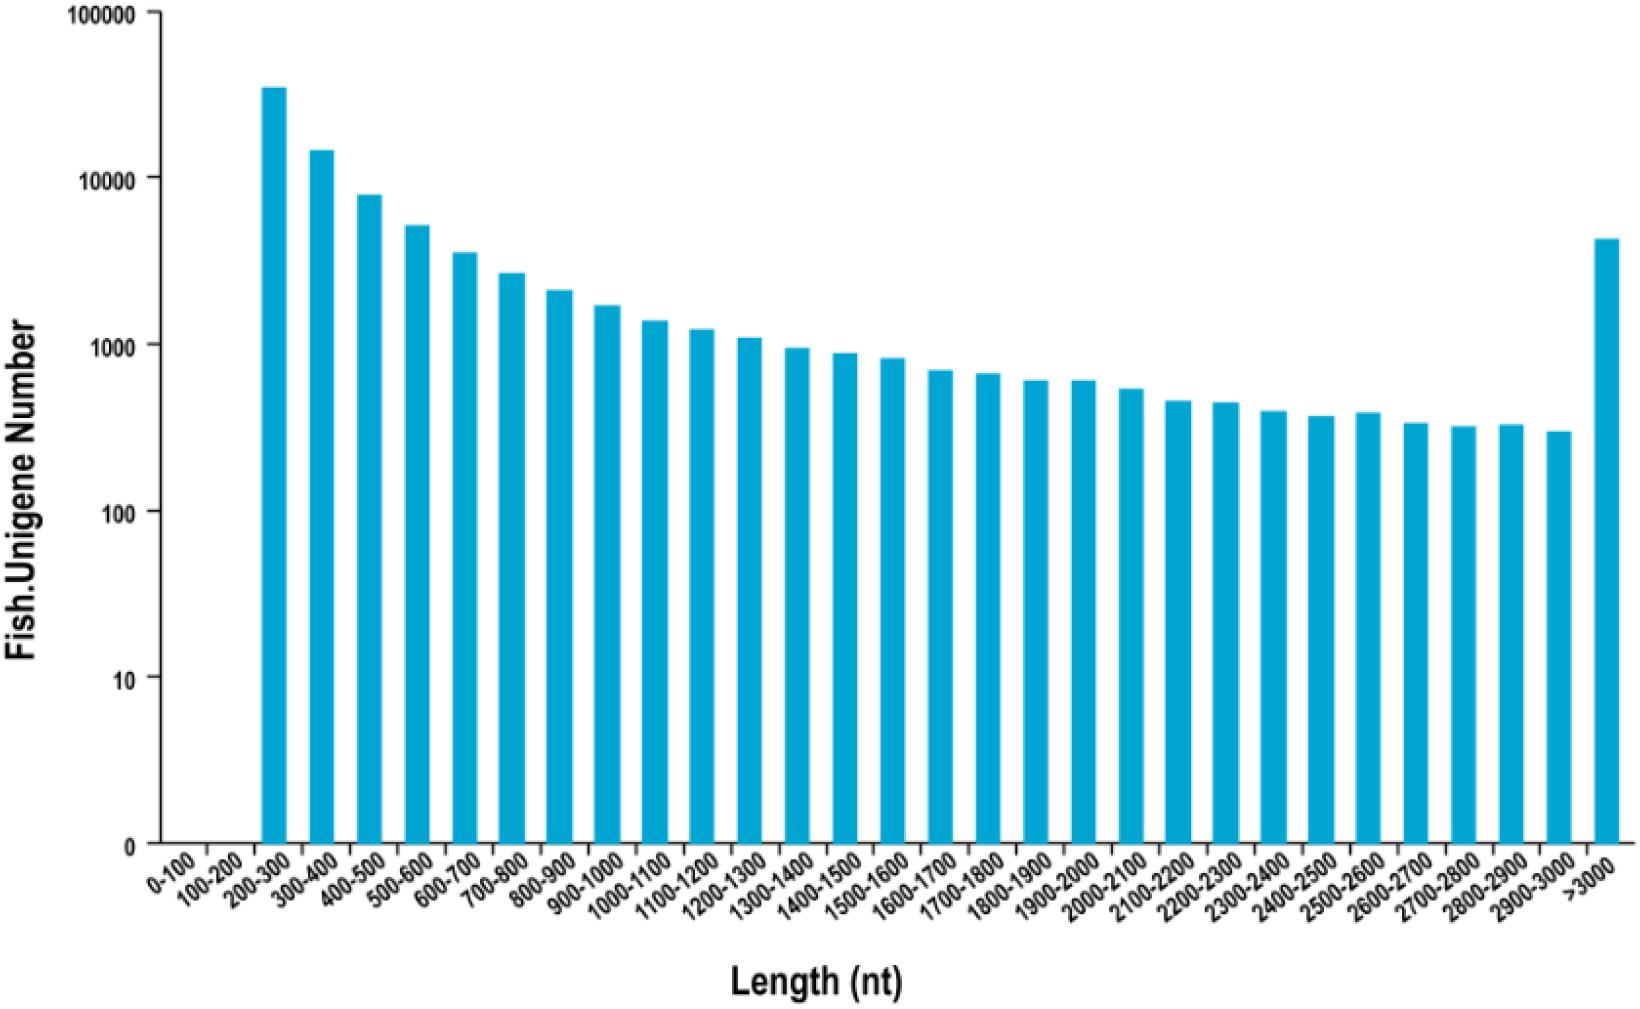
Figure 1. Length distribution of assembled unigenes. X-axis: length, Y-axis: Unigene number.
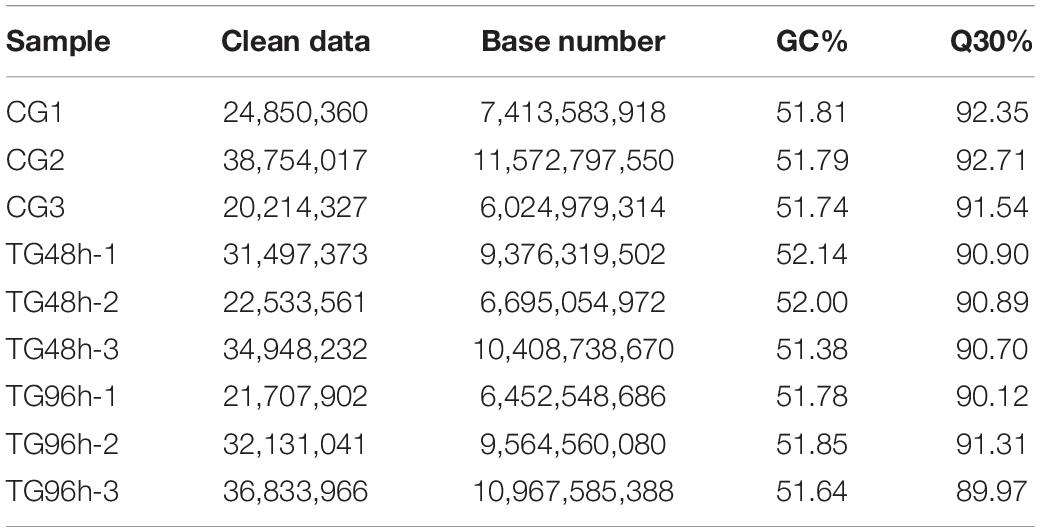
Table 3. Quality of sequencing.
Functional Annotation of Unigenes
Functional annotation of unigenes was performed using the Blast comparison database. The annotated database includes COG, GO, KEGG, KOG, Pfam, Swissprot, eggNOG, and NR. A total of 28,062 unigenes were successfully matched in these databases, accounting for 32% of all unigenes (Table 4). Results showed that 6,724 unigenes (7.67%) successfully matched in the COG database, 14,559 unigenes (16.6%) in GO, 16,131 unigenes (18.4%) in KEGG, 17,437 unigenes (19.89%) in KOG, 18,757 unigenes (21.4%) in Pfam, 14,111 unigenes (16.1%) in Swissprot, 26,230 unigenes (29.92%) in eggNOG, and 24,567 unigenes (28.02%) in the NR database (Table 4).
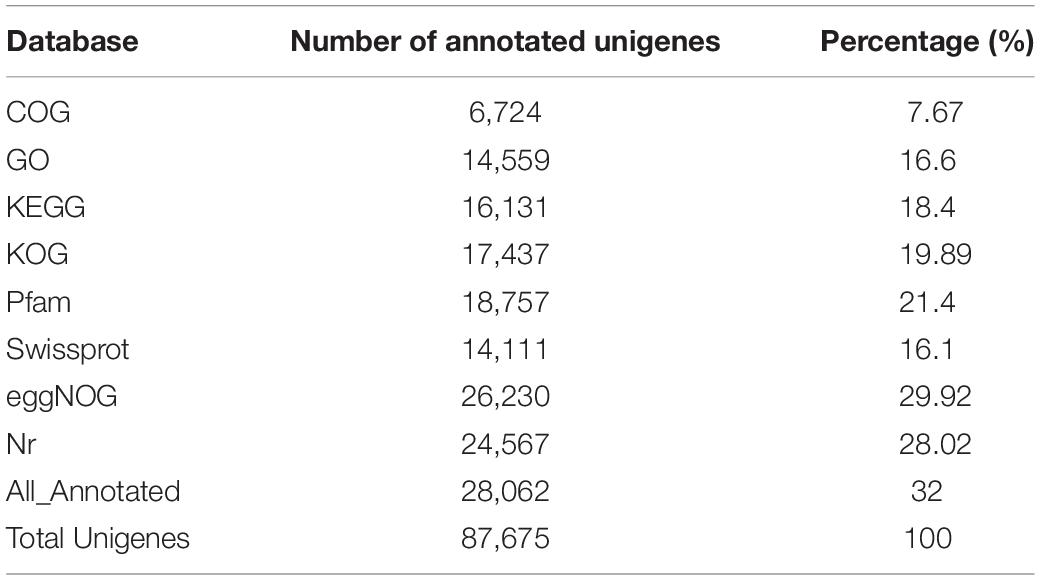
Table 4. Annotation of unigenes in different database.
For KOG, a total of 17,437 unigenes (19.89%) were assigned to 26 descriptions. Main categories included: signal-transduction mechanisms, post-translational modification, protein turnover, chaperones, and transcription (Figure 2). In the eggNOG database, a total of 26,230 unigenes (29.92%) were assigned to 26 descriptions. Among them, genes involved were signal transduction mechanisms, post-translational modification, protein turnover, chaperones, and intracellular trafficking, secretion, and vesicular transport (Figure 3).
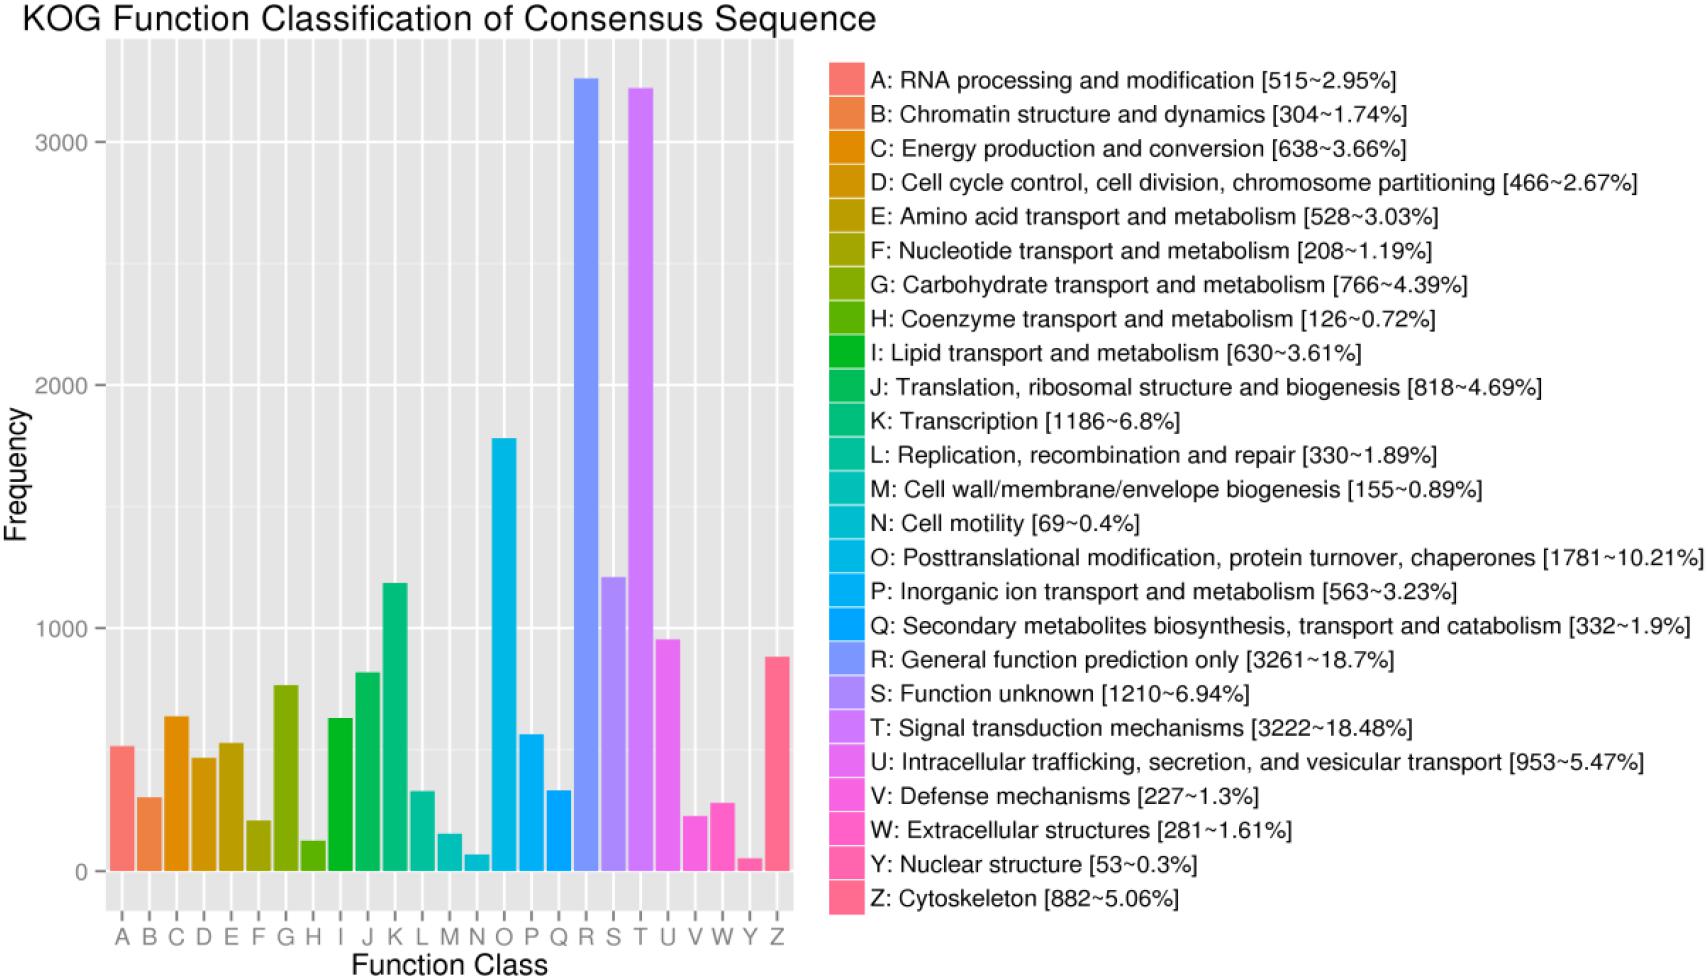
Figure 2. The KOG function classification of assembled unigenes. X-axis: the function class of KOG, Y-axis: the frequency of unigens.
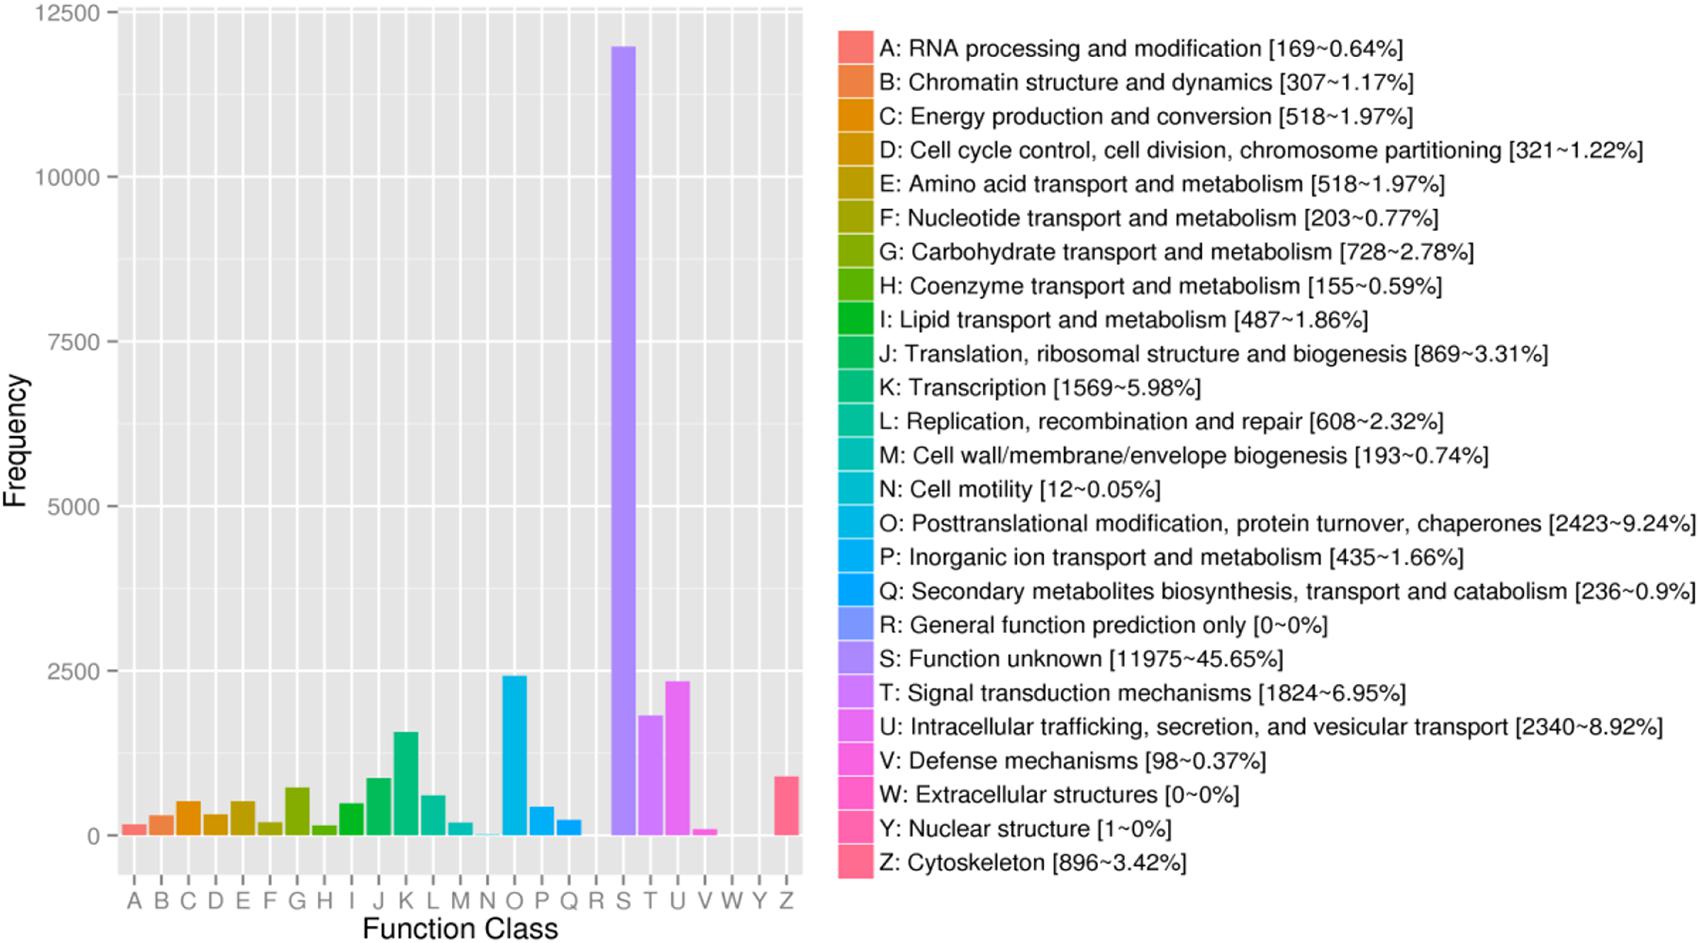
Figure 3. The eggNOG functional classification of assembled unigenes. X-axis: the function class of eggNOG, Y-axis: the frequency of unigens.
After GO annotation, the genes divided into three ontologies: biological process (BP), cellular component (CC), and molecular function (MF). There were 14,559 unigenes (16.6%) in the GO database which aligned with 58 functional terms. In the CC designation, these unigenes were related to the categories: cell, cell part, organelle, and membrane. In the MF designation, these unigenes mainly related to binding and catalytic activity. The BP category related to cellular process, metabolic process, single-organism process, and biological regulation (Figure 4).
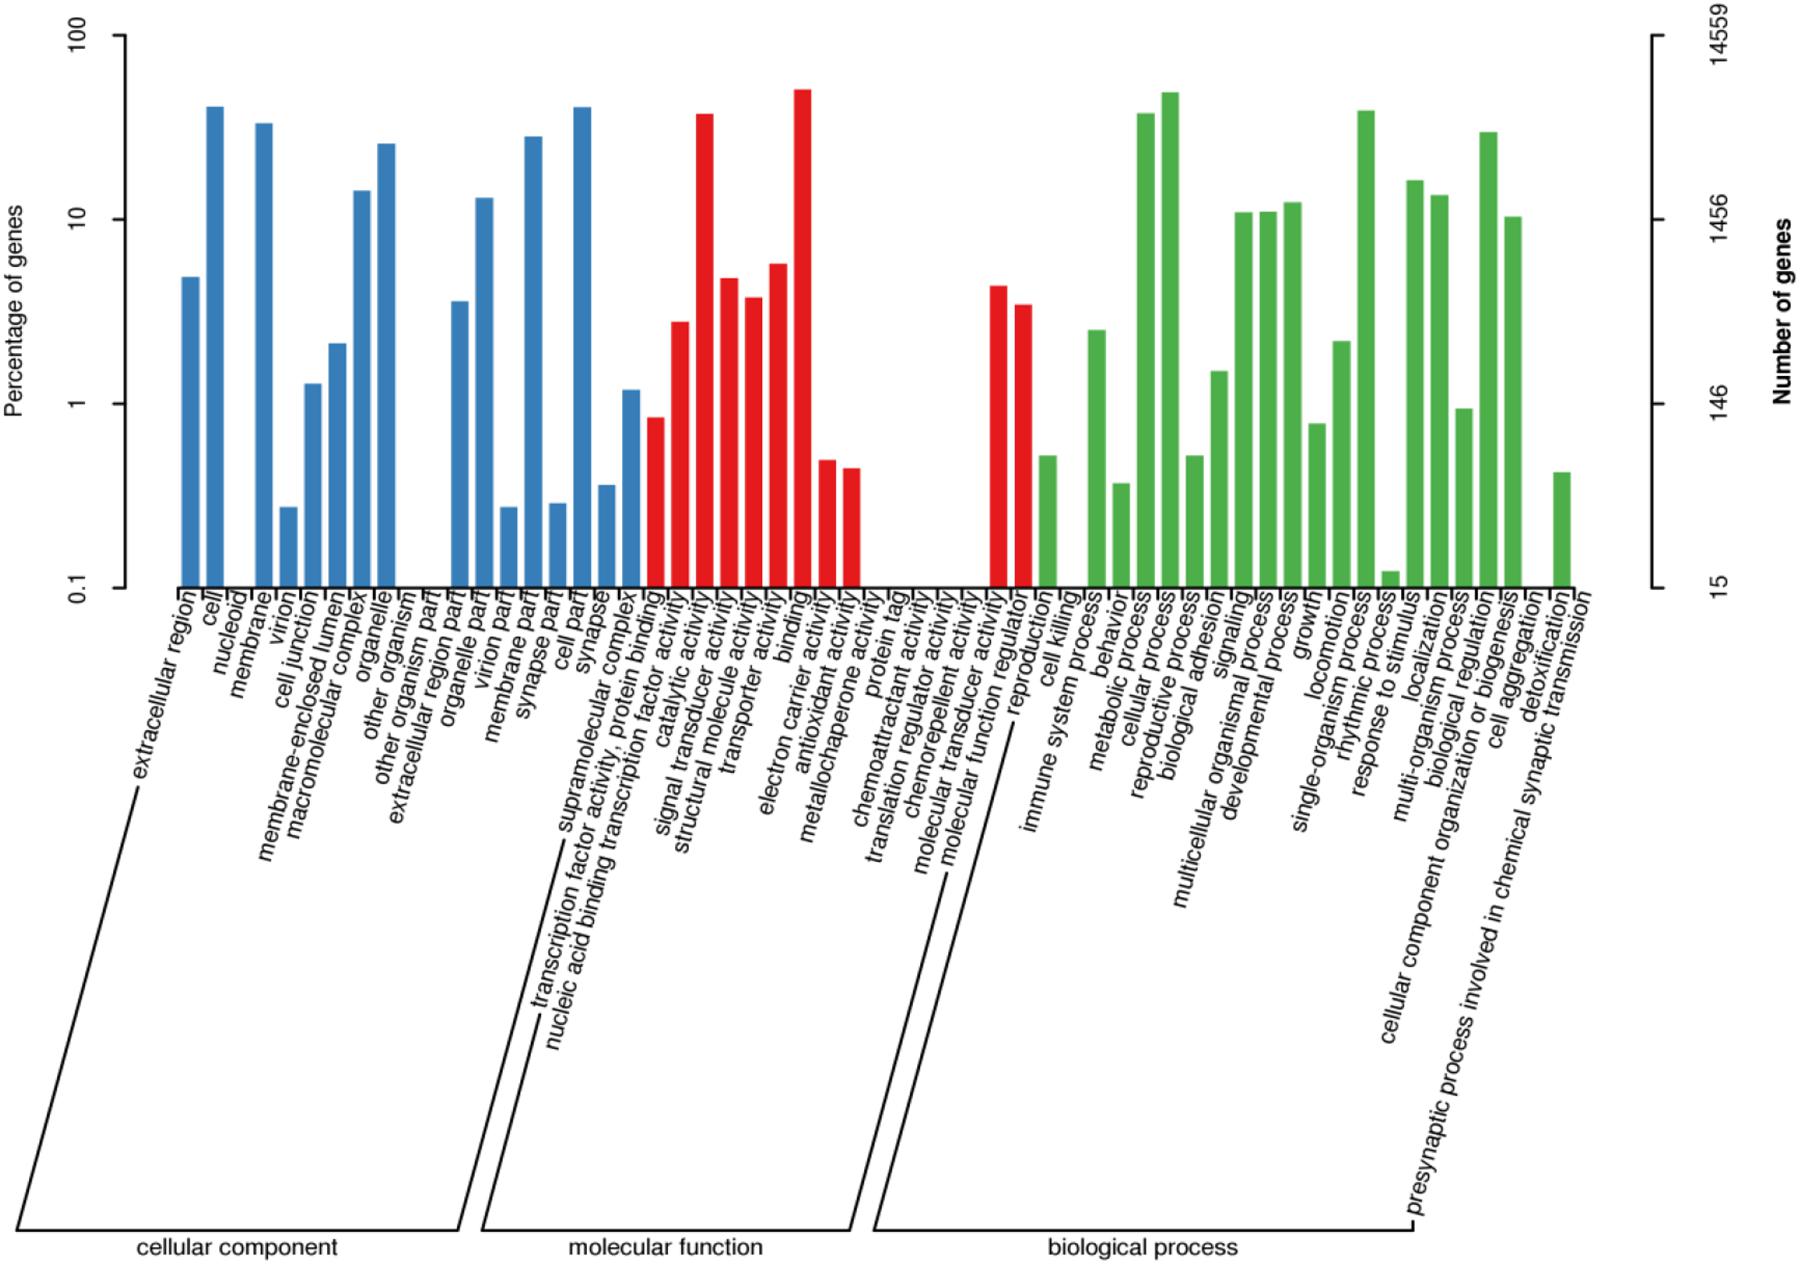
Figure 4. GO classification of assembled unigenes. X-axis: GO classification, including biological process, cellular component, and molecular function, Y-axis: The left ordinate is the percentage of genes; the right ordinate is the numbers of genes.
Identification and Analysis of DEGs
Analysis revealed 320 and 272 genes showed different expression in the two sampling times (48 and 96 h). Among them, the significantly up-regulated unigenes were 132 and 137, and the significantly down-regulated unigenes were 188 and 135, respectively (Figure 5). The DEGs of control group and 48 h (G0), the DEGs of control group and 96 h (G2), the DEGs of 48 and 96 h (G6) (Figure 6).
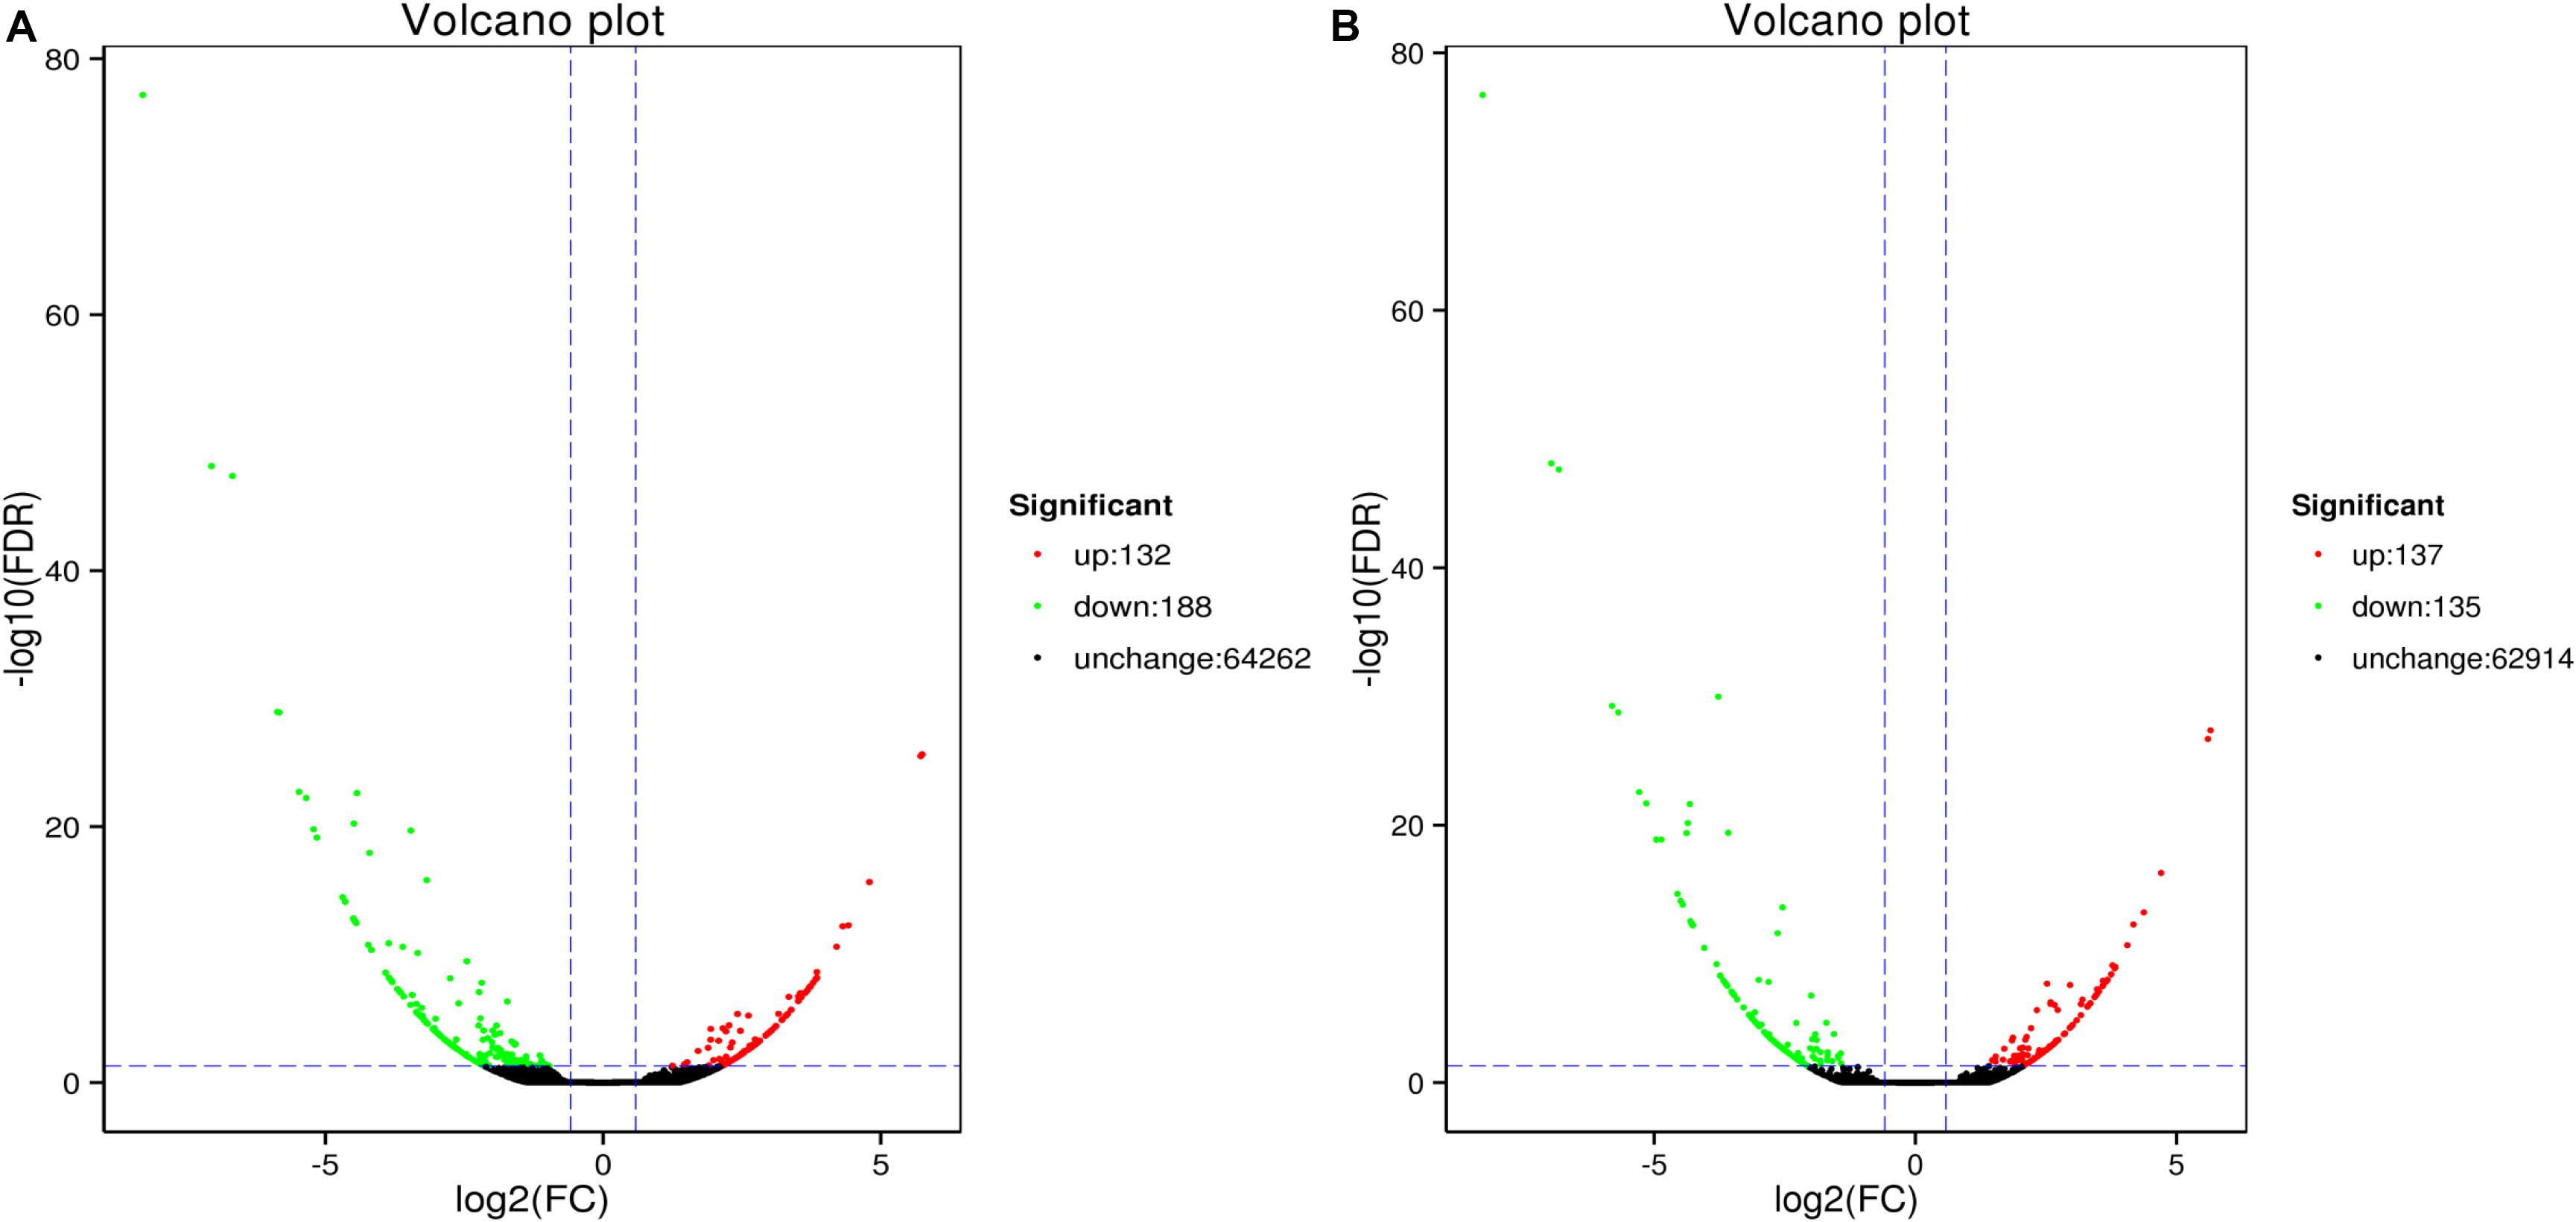
Figure 5. MA plot of differentially expressed genes between ammonia exposure and control group (A, 48 h; B, 96 h). Volcano Plot of differently expressed genes after ammonia exposure. Each dot represents a gene. X-axis: The logarithmic value of the multiple of the difference in the expression of a gene between two samples, Y-axis: The negative pair value of the error detection rate.
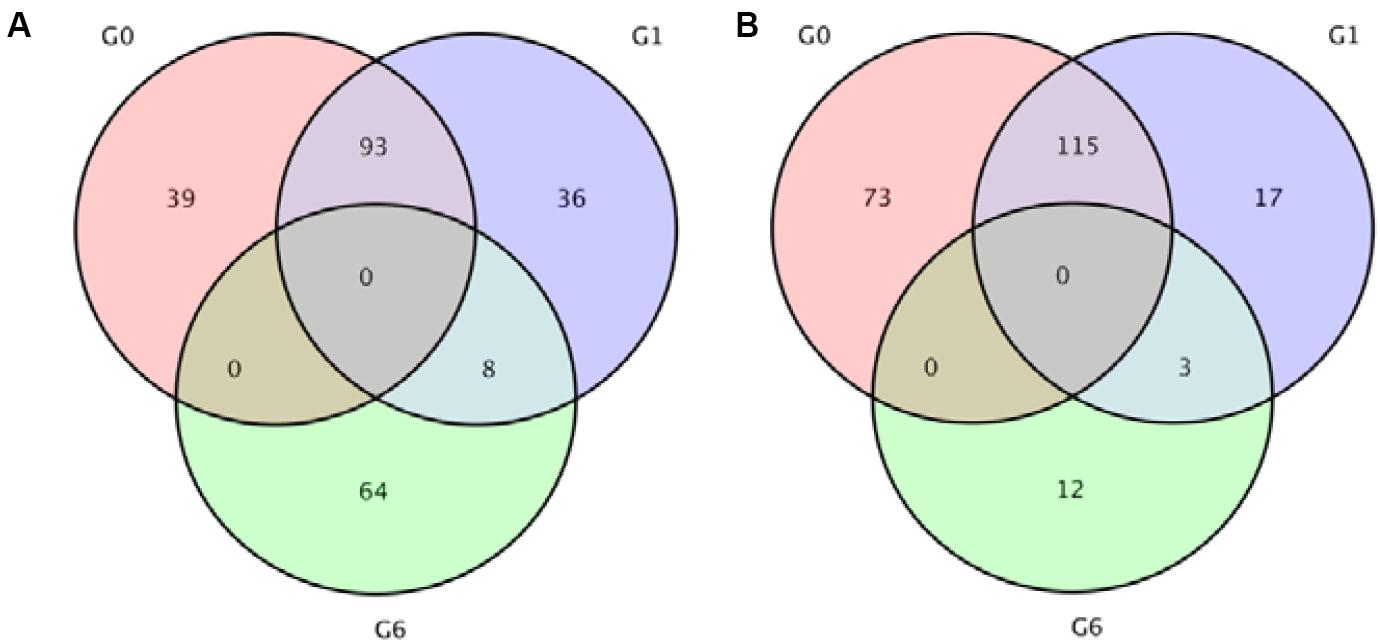
Figure 6. Venn diagrams indicating the differentially expressed genes in 48 and 96 h after ammonia exposure. (A) Upregulated genes; (B) downregulated genes.
GO Functional Classification of DEGs
Go enrichment analysis of DEG showed that these genes were significantly enriched in three main functional categories (based on a value of p ≤ 0.05). GO-enrichment categories at 48 and 96 h are similar (Figure 7). In the BP category, the DEGs were significantly enriched in metabolic process, single-organism process, and cellular process. In the CC category, the DEGs were significantly enriched in cell part and cell. In MF category, the DEGs were significantly enriched in catalytic activity and binding.
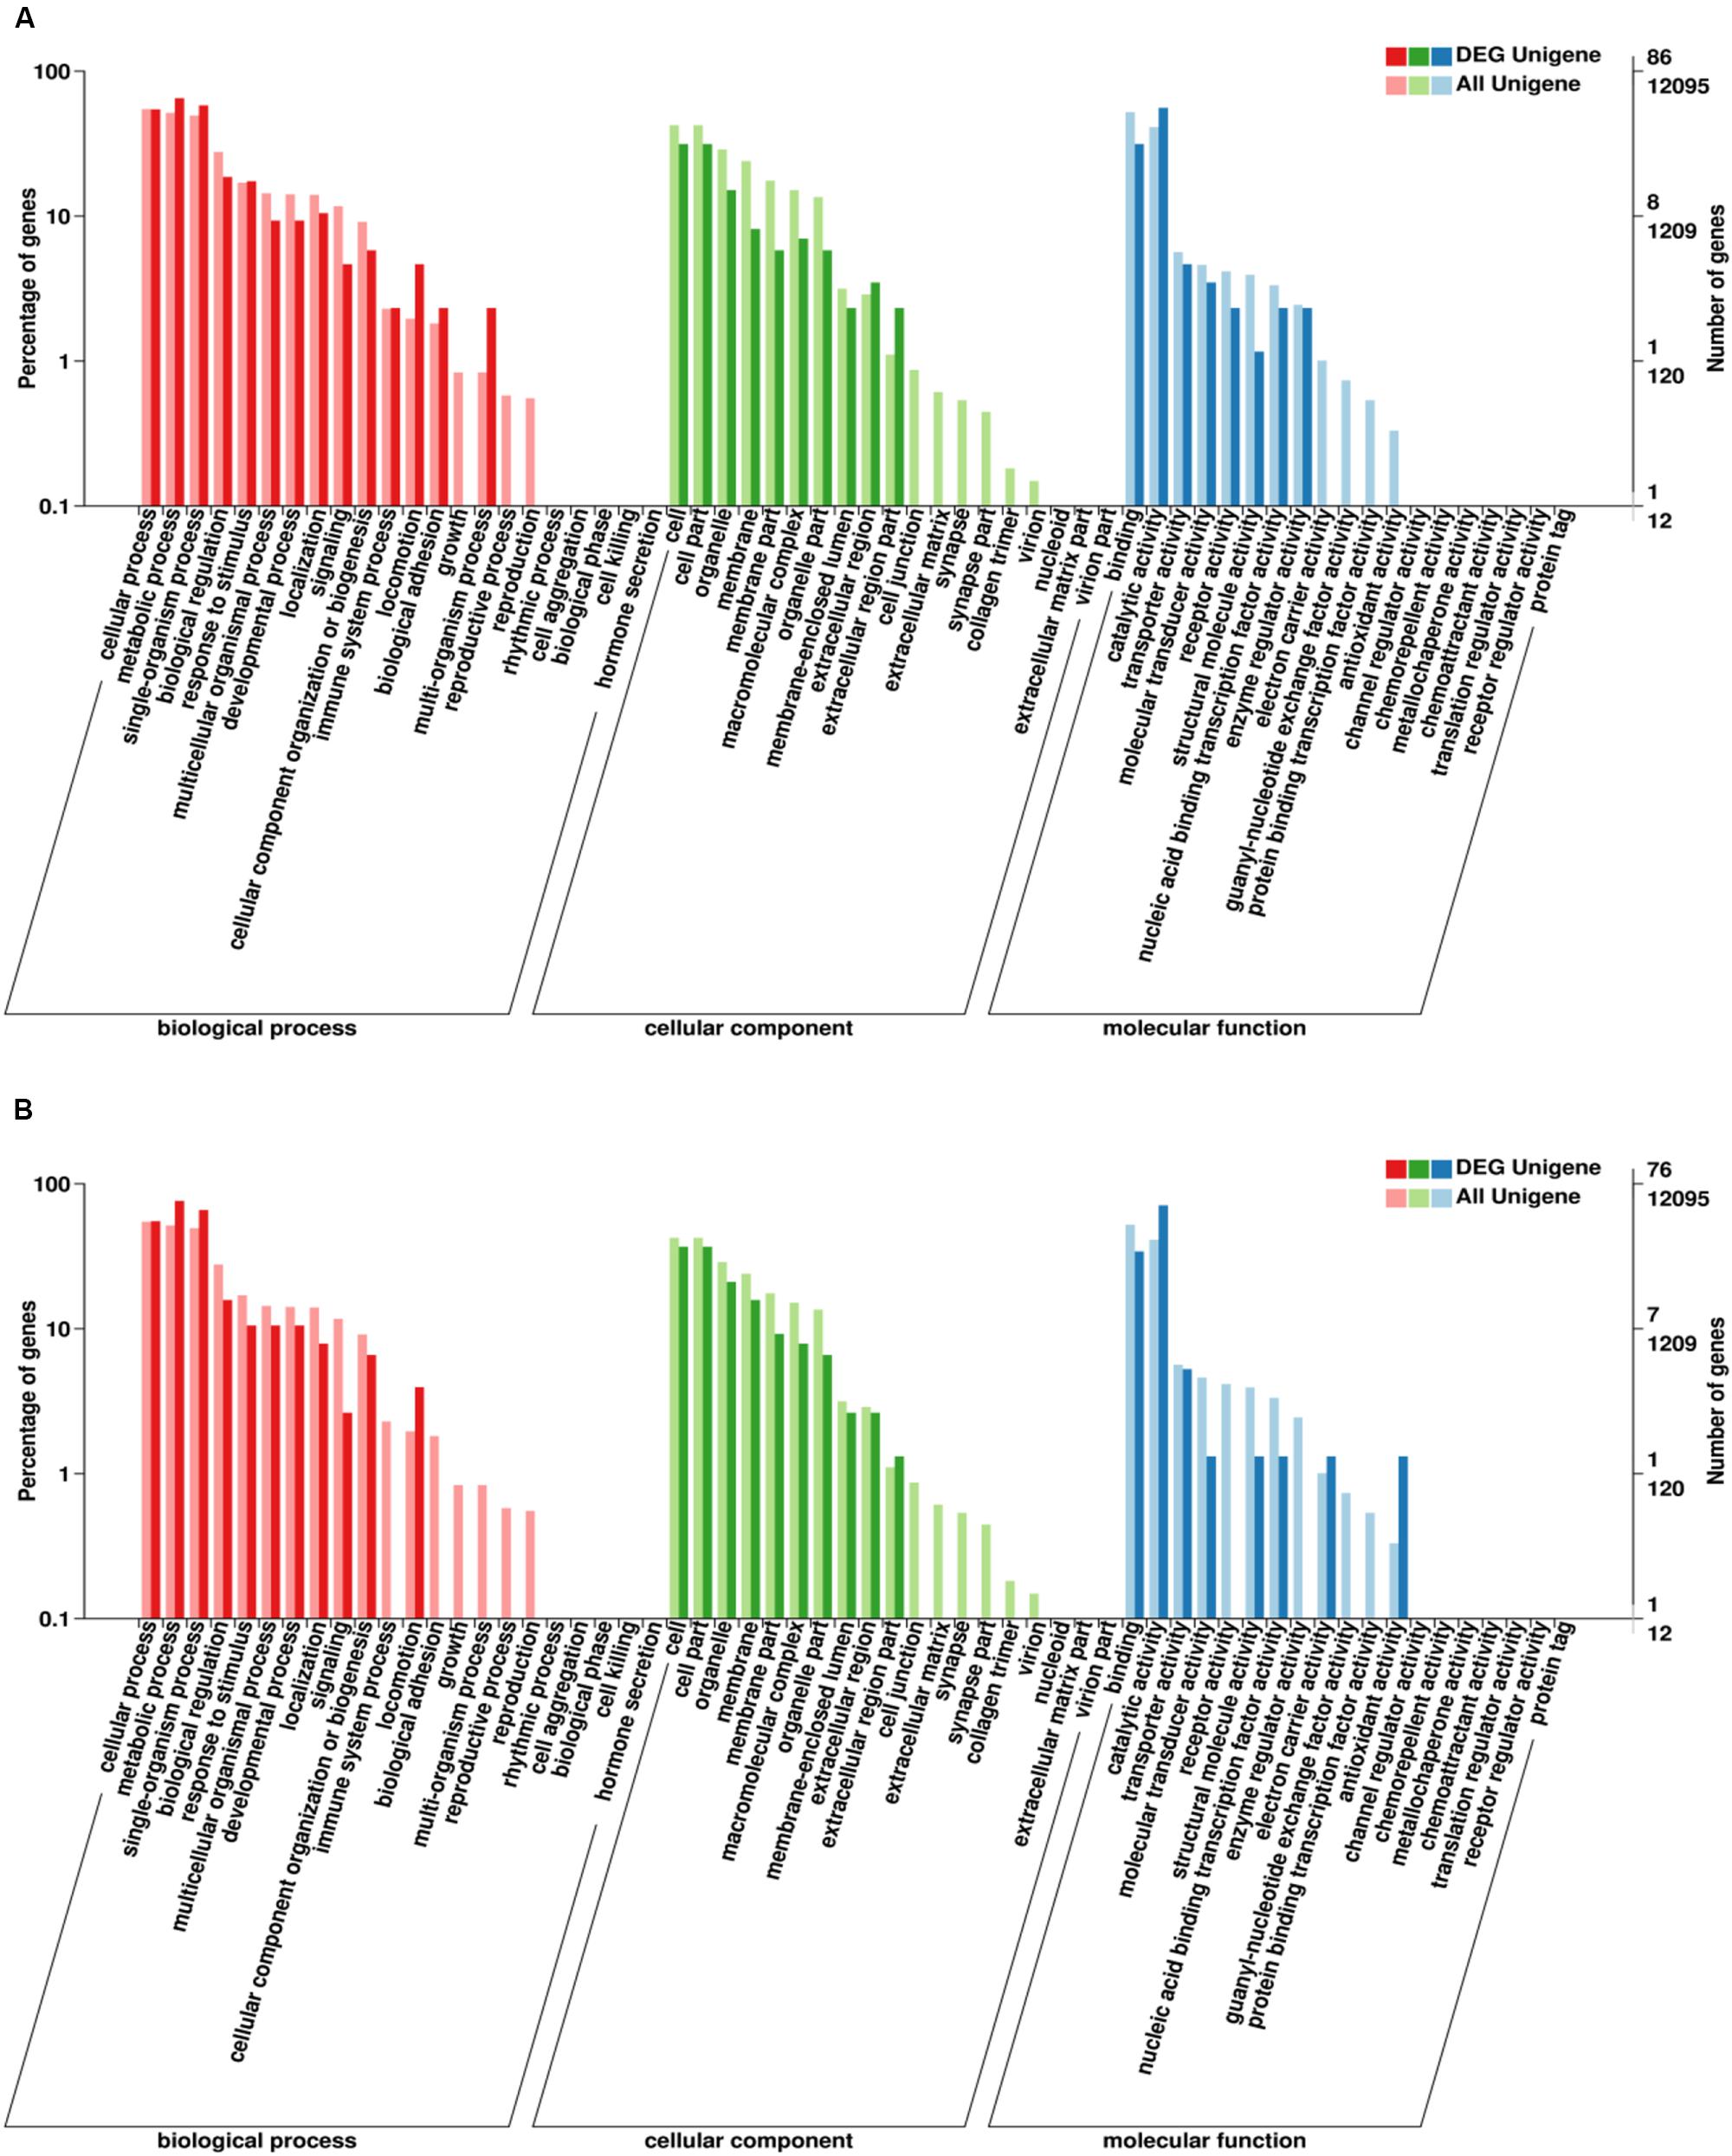
Figure 7. Gene ontology (GO) classification of DEGs. X-axis: GO classification, including biological process, cellular component, and molecular function; Y-axis: The left ordinate is the percentage of the number of DEGs, and the right ordinate is the number of DEGs (darker bars) and the number of all genes (lighter bars) (A, 48 h; B, 96 h).
KEGG Pathway Classification of DEGs
Since there is no reference genomic sequence for fat greenling, the function and classification of the selected genes are obtained by comparison with sequence homology analysis of related gene sequences of the species in Table 5. Function and pathway allocation of DEGs were performed after ammonia exposure 48 and 96 h, and all DEGs were analyzed against the KEGG database. The top 20 pathways with the most abundant DEGs involved in with ammonia exposure are shown in Figure 8, and pathway-enrichment analysis showed that DEGs were mainly enriched in carbon metabolism and biosynthesis of amino acids. After ammonia exposure for 48 and 96 h, DEGs enriched in carbon metabolism were dominant. DEGs induced by exposure mainly were reflected in environmental information processing that play an important role in immune function, oxidative stress, and apoptosis. Seven subclasses related to immune function, oxidative stress, and apoptosis, and further elaborate on the basis of KEGG pathway analysis, including the MAPK-signaling pathway, FOXO-signaling pathway, phosphatidylinositol-signaling pathway, cytokine-cytikine receptor interaction, Hippo-signaling pathway, and neuroactive ligand-receptor interactions (Table 5). A total of 16 DEGs were induced, of which three genes were up-regulated and 13 genes were down-regulated. These DEGs are associated with oxidative stress and apoptosis.
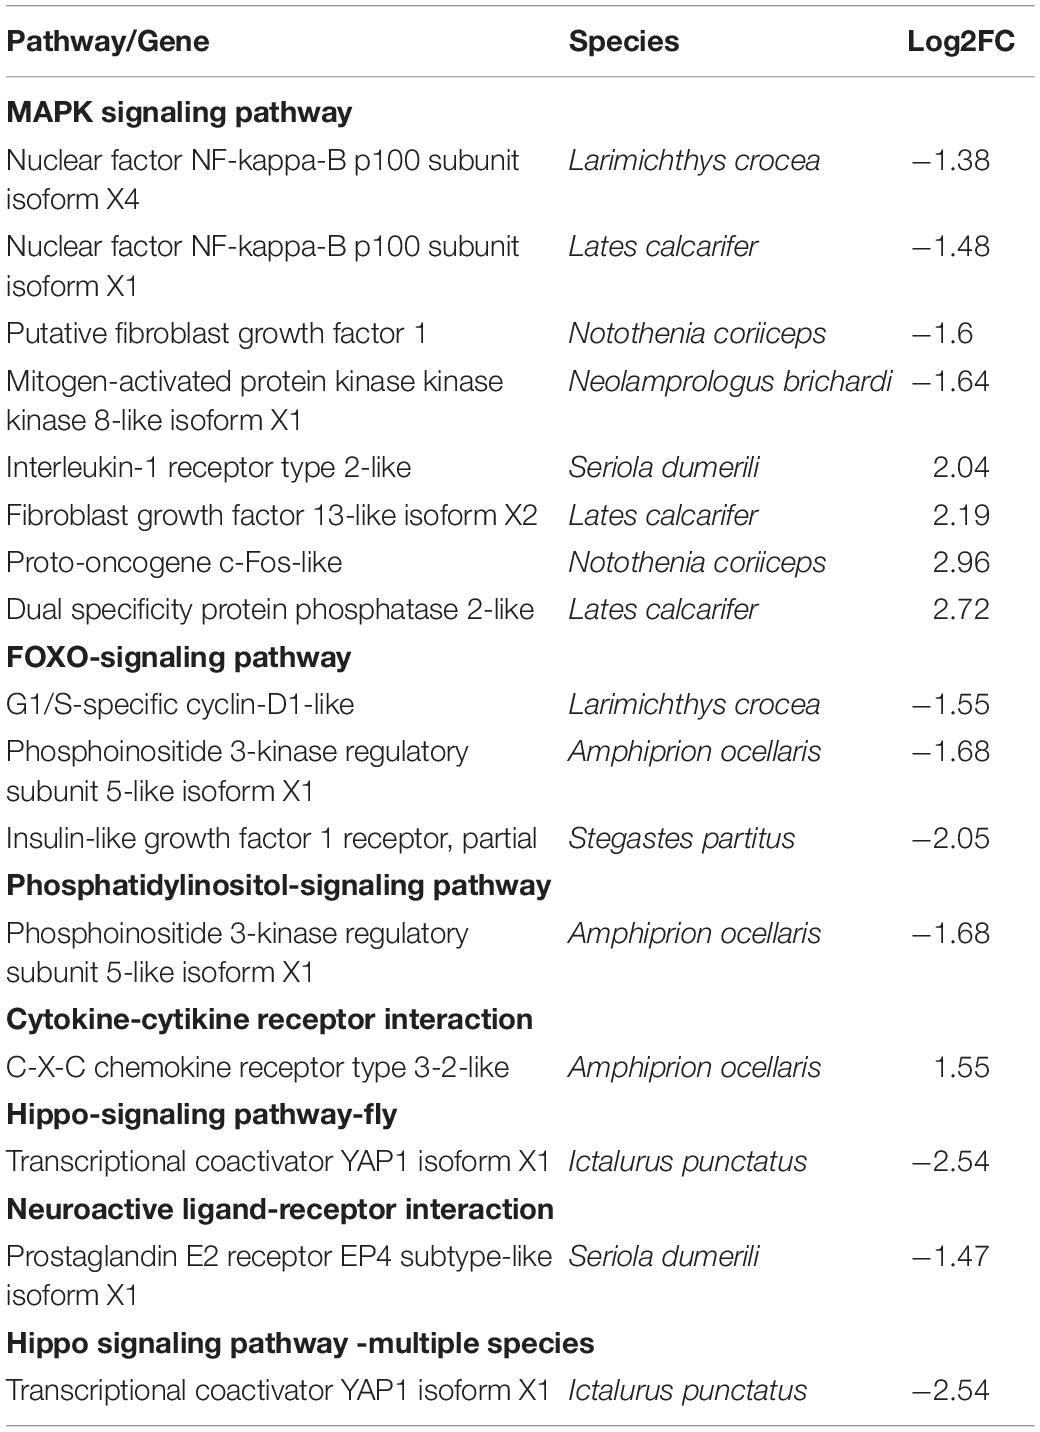
Table 5. List of DEGs involved in environmental information processing in control and ammonia exposure treatments.
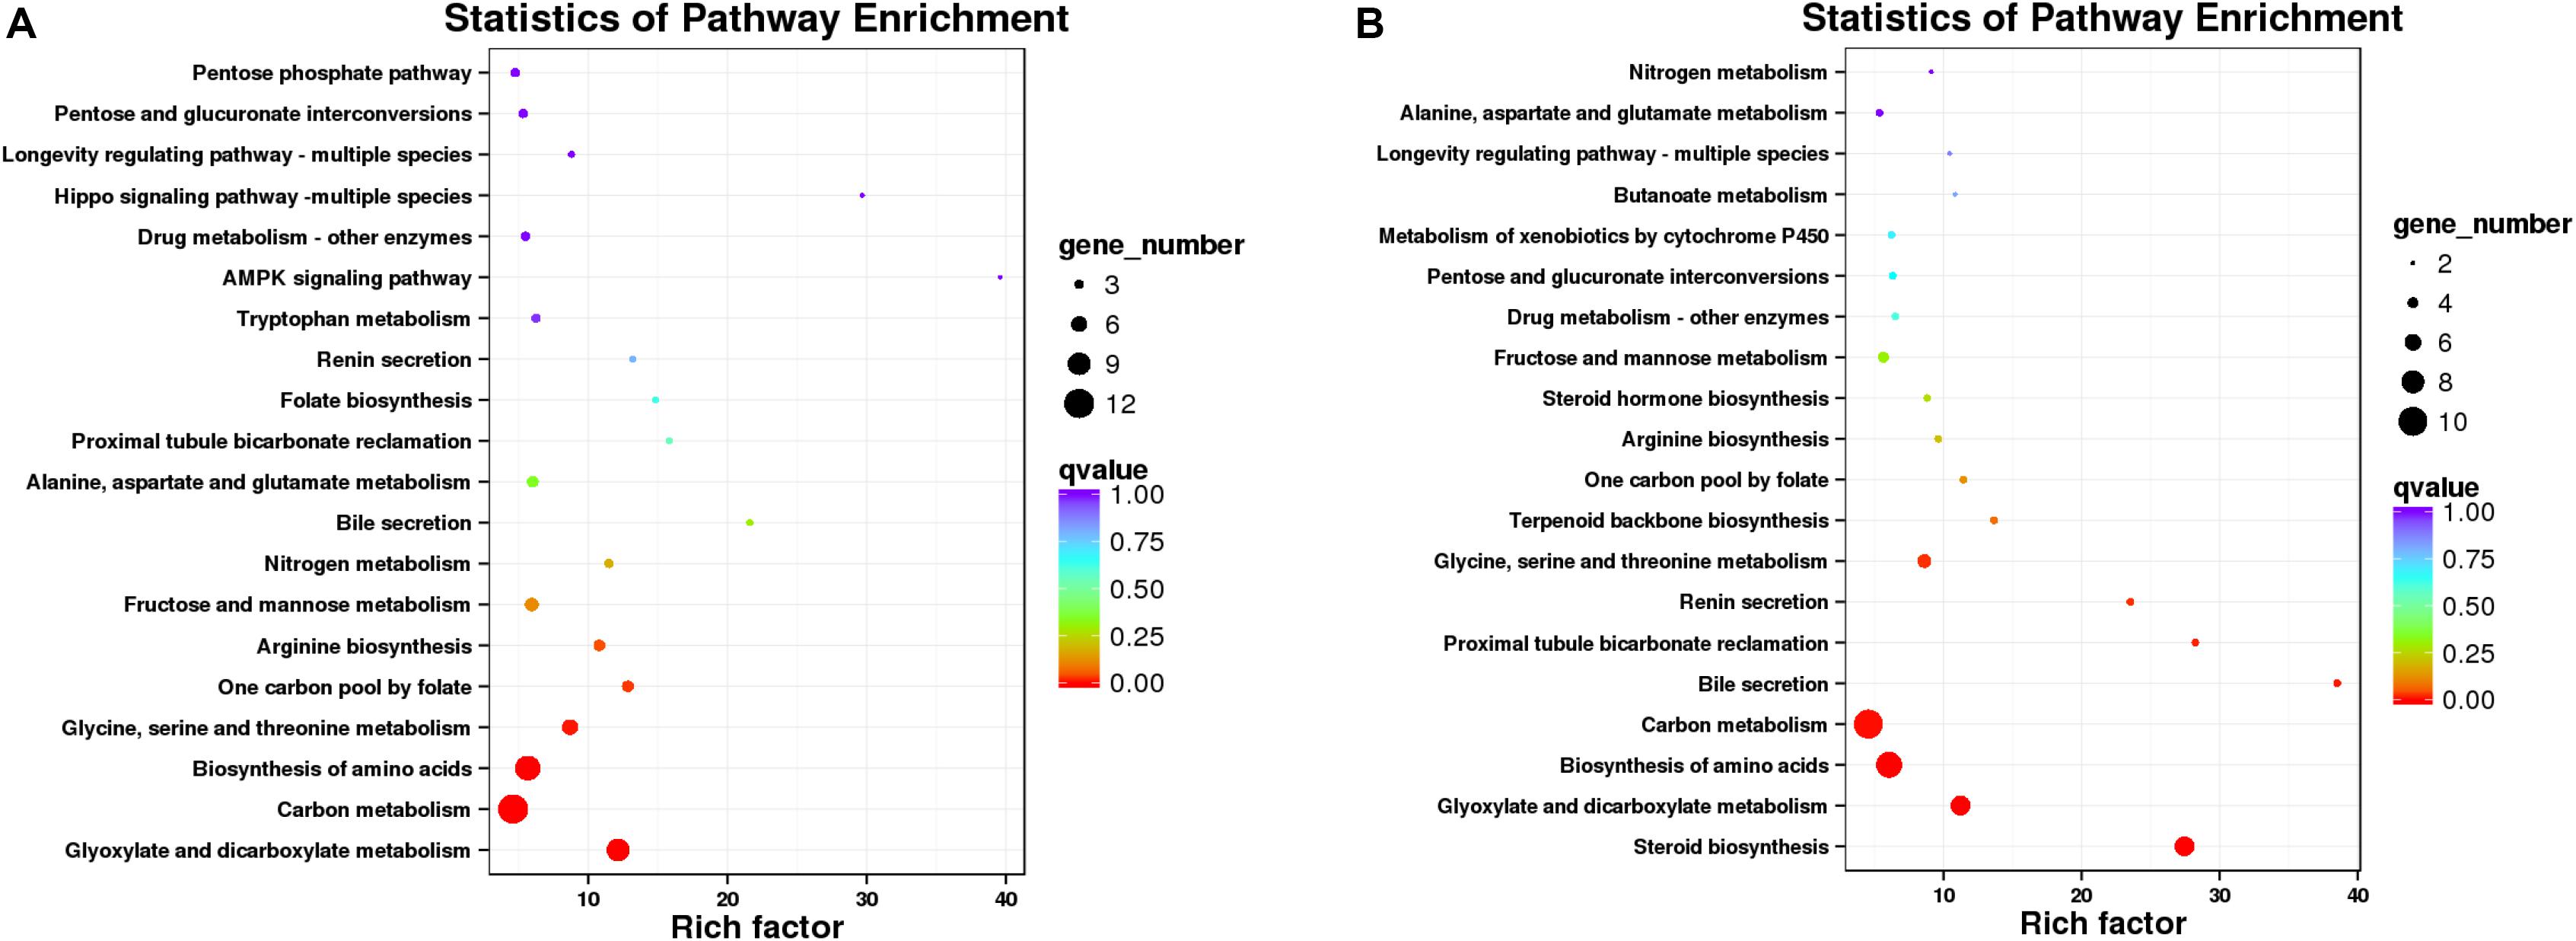
Figure 8. Scatterplot of enriched KEGG pathways for DEGs (A, 48 h; B, 96 h). Sizes of bubbles indicates the number of DEGs in the corresponding pathway, and the colors of the bubble represent the q-value, q-value is the P-value after multiple hypothesis test.
Validation of Expression Genes by qRT-PCR
To verify RNA-seq results, we randomly selected four up-regulated and six down-regulated DEGs with different fold changes for qRT-PCR analysis. As shown in Figure 9, in both experiments, the expression of these 10 genes showed the same pattern of up-regulation and down-regulation. The qRT-PCR analysis results are thus consistent with data from the RNA-seq.
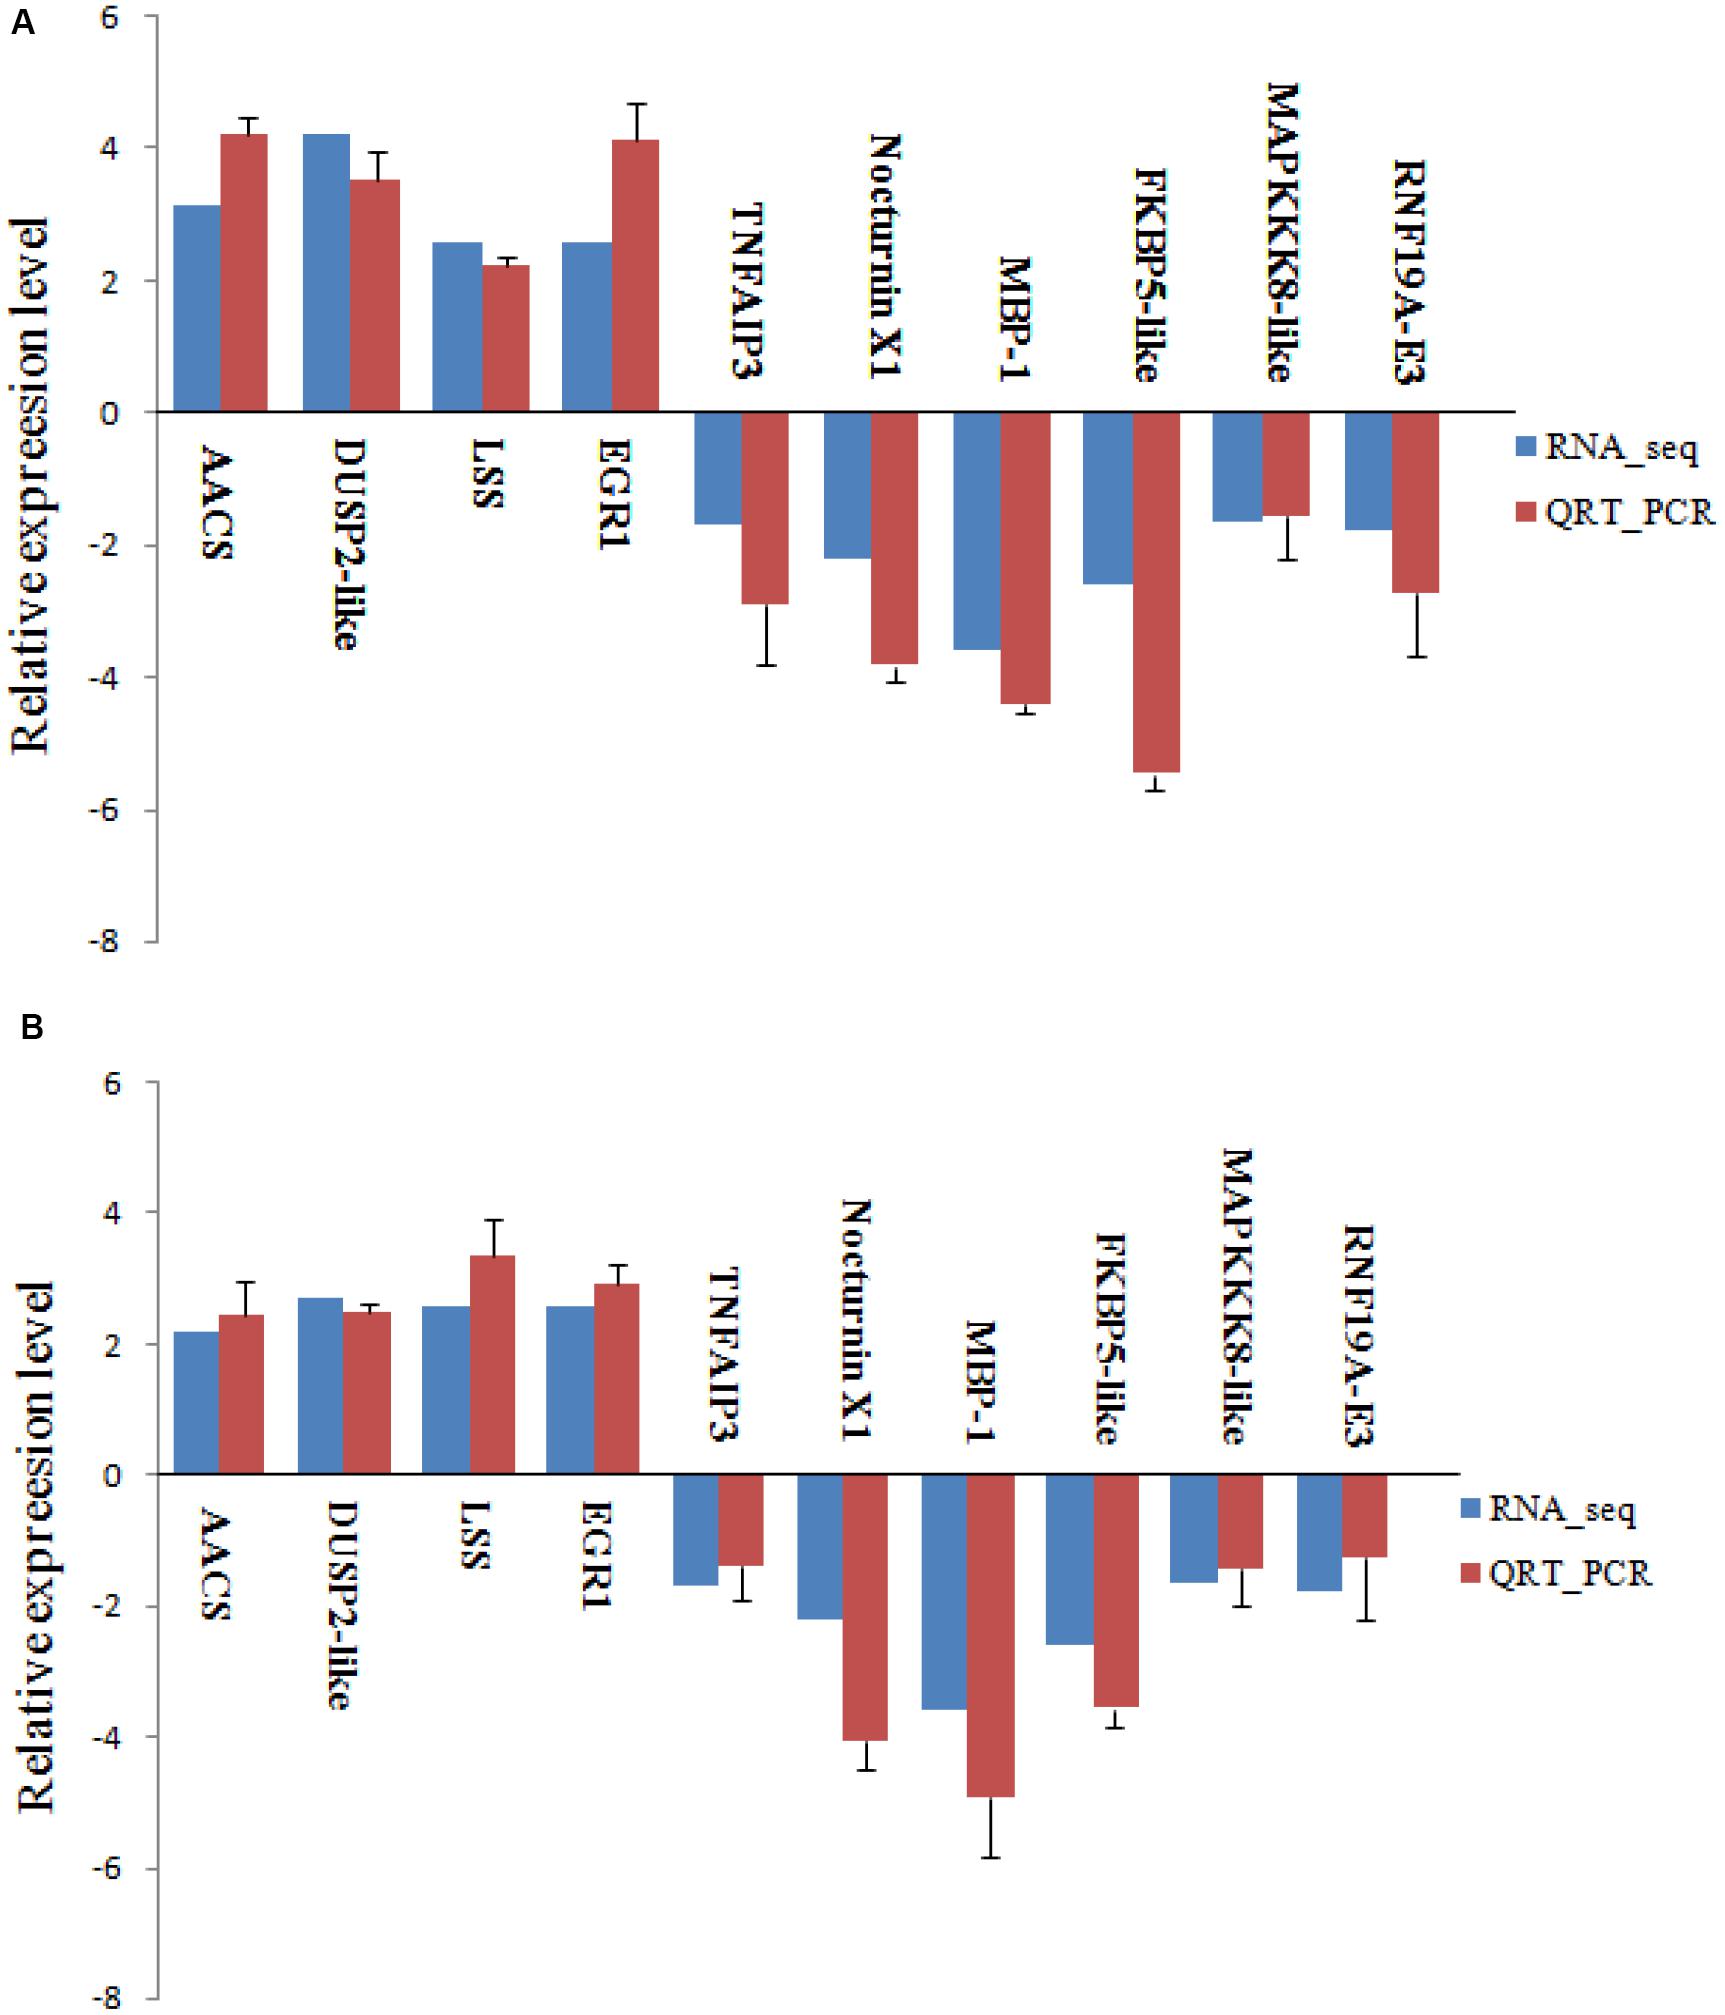
Figure 9. Validation of RNA-seq data by qRT-PCR analysis. Relative expression of gene expression was log2 (fold change) (A, 48 h; B, 96 h). The relative expression of 10 random genes, were determined by RT-qPCR (blue column) and RNA-seq (red column). Error bars represented standard deviation (SD, n = 3).
Discussion
Fat greenling is one of the most common commercial aquatic animals. Studies on fat greenling mainly have focused on pollution biology and physiology; few have focused on transcriptome analysis, with the exception of spleen analysis following V. harveyi infection (Diao et al., 2019). We carried out high-throughput sequencing nine samples of fat greenling under ammonia exposure. A total of 78.48 Gb of clean data were obtained, the clean data of each sample reached 6.02 Gb, and the Q30 was above 89.97%, indicating that the sequencing effect was good and provided a credible basis for subsequent assembly. A total of 87,675 unigenes were obtained after assembly, of which 16,756 unigenes were over 1 kb in length, 28,062 unigenes were successfully annotated by blast alignment databases. The experimental sequencing data coverage was high, and the library construction was successful. These results contribute to our understanding of fat greenling genes, providing data for the future study of the species.
Ammonia is a highly toxic environmental pollutant (Ye et al., 2018). Previous reports have suggested that high concentrations of ammonia in water accumulate in different tissues of aquatic organisms, triggering oxidative stress, immunosuppression, and other physiological problems (Cheng et al., 2015; Zhang et al., 2015; Li et al., 2016). GO-enrichment analysis showed that DEGs in fat greenling liver under ammonia exposure were significantly enriched in terms of cellular process, metabolic process, and single-organism process in BF, which were correlated with oxidative stress and immunological function. KEGG analysis showed that the DEGs were mainly involved in environmental information processing, including the MAPK-signaling pathway, FOXO-signaling pathway, phosphatidylinositol-signaling pathway, cytokine-cytikine receptor interaction, Hippo-signaling pathway-fly, and neuroactive ligand-receptor interactions. These pathways were mainly associated with oxidative stress and immunological functioning. Several important KEGG pathways to be discussed below are likely to be involved in the response of fat greenling under ammonia exposure.
MAPK Signaling Pathway
Eukaryotic cells regulate gene expression through a cascade of MAPK (mitogen-activated protein kinase) signals under various stressful conditions, such as oxidative stress inflammation (Obata et al., 2000; Kyriakis and Avruch, 2001; Lee and Choi, 2003; Marshall et al., 2005; Feidantsis et al., 2012). In this study, some DEGs in the MAPK pathway were associated with cell damage, disease, and immunity, including NF-kappa-B, fibroblast growth factor (FGF-13), mitogen-activated protein kinase kinase kinase 8 (MAP3K8), interleukin-1 receptor (IL-1RI), proto-oncogene and dual-specificity protein phosphatase 2 (Dusp2) (Table 5). NF-kappa-B is a pleiotropic transcription factor existing in almost all cell types and is the end point of a series of signal transduction events triggered by a series of stimuli related to biological processes such as inflammation, immunity, differentiation, cell growth, tumorigenesis, and apoptosis (Lee et al., 2013). Studies have shown that medaka defensins are important cationic antimicrobial peptides, which have been shown to have a relationship with NF-kappa-B and play an important role in resistance to pathogens (Zhao, 2008). Down-regulation of NF-KB is triggered by autoimmune diseases, chronic inflammation, and cancers.
MAP3K8 (TPL-2) is associated with the TLR-signaling pathway; TLRs target a common signaling pathway that causes activation of NF-KB, MAPKs, ERK, P38, and JNK. When cells receive signal stimulation, p105 is phosphorylated (Salmeron et al., 2001), causing its ubiquitination to release tpl2; the released tpl2 is activated by phosphorylation of the site, thereby activating MEK1/2 and its downstream ERK1/2, realizing the entire MAPK signal (Lang et al., 2003).
Interleukin type I receptor (IL-1RI) intracellular regions are also present in the Drosophila Toll protein, a discovery that highlights the role members of the il-1 family have in innate responses (Gay and Keith, 1991). IL-1β is a major inflammatory cytokine that also plays a role in inflammation associated with many chronic diseases (Wettlaufer et al., 2016). The expression of IL-1RI in kidney, spleen, liver, and sputum of Salmo salar was up-regulated after LPS and TNF-α stimulation, indicating that IL-1RI plays a major role in inflammatory response by regulating IL-1β (Subramaniam et al., 2002).
Under normal conditions, intracellular c-fos is highly conserved and has only low levels of expression which are difficult to detect (Blume et al., 1999). When the body is stimulated by external factors, intracellular c-fos can be induced rapidly (Usuki et al., 2000; Dong et al., 2005). A variety of extracellular signals can activate downstream transcription factors through second messengers, induce Fos protein biological expression, act on target genes, and then respond to external stimuli (Akins et al., 1996). At present, a variety of fish c-fos genes have been cloned, including in Oncorhynchus mykiss (Matsuoka et al., 1998), Rivulus marmoratus (Li et al., 2004), Dicentrarchus labrax (Rimoldi et al., 2009), Fugu rubripes (Trower et al., 1996), and Oryzias latipes (Okuyama et al., 2011). We found that ammonia exposure led to the expression of the MAPK-signaling pathway in the liver of fat greenling, and the response is used to mobilize the up-regulated and down-regulated expression of related genes to cope with stress.
FOXO-Signaling Pathway and Phosphatidylinositol-Signaling Pathway
Studies have shown expression of related factors in the FOXO-signaling pathway, which can increase expression of related antioxidant defense system enzymes (Cox and Lane, 1995). Down-regulated expression of phosphoinositide 3-kinase (PI-3K) genes occurs in both the FOXO-signaling pathway and phosphatidylinositol-signaling pathway. Phosphoinositide 3-kinase is an enzyme with serine/threonine protein kinase activity, consisting of two chains, P85 and P110, and is involved in immune cell activation signal transduction and activation. Reports have shown that in T cells, a variety of cytokines, antigen receptors, and environmental factors stimulate activation of PI-3K. Akt is activated accordingly, as well as other downstream transcription factors, in response to viruses and other environmental factors. As such, they play a key role in maintaining a positive immune response of T cells, and promote development of T cells during the immune response (Sasaki et al., 2002). We showed expression of G1/s-specific cyclin-d1 and the PI-3K gene were down-regulated, and we speculate that ammonia had a negative regulatory effect on the PI-3K signal pathway. We observed that, compared with the control group, fish showed sluggish activity, and some fish had ulcerations on their skin, indicating that stress resistance of fish may have been decreased.
Cytokine-Cytikine Receptor Interaction and Hippo-Signaling Pathway-Fly
Chemokines are low-molecular (mostly 8–10KD) proteins that are capable of attracting leukocytes to the site of infection, and they play an important role in the inflammatory response. C-X-C chemokine receptor type 3 (CXCR3) plays an important role in regulating the transport and function maintenance of T cells (Groom, 2011). There are many studies that have focused on induction of chemokines and chemokine receptors by pathogens and environmental stimuli. For example, acute toxicity of sodium nitrite, along with bacterial, fungal, and viral infections, can induce the expression of CXCR3a in Channa striatus (Bhatt et al., 2014). LPS also can induce the expression of CXC chemokines in carp (Savan et al., 2003).
We found CXCR3 involved in cytokine and cytokine receptor pathways was up-regulated, as well as were genes in other immune-related pathways, including interleukin-1 receptor type 2-like, fibroblast growth factor 13-like isoform X2, proto-oncogene c-fos like, and dual-specificity protein phosphatase 2-like. These are helpful for screening immune-related genes and analyzing their expression.
The Hippo-signaling pathway is mediated through the downstream effector molecule YAP (yes-associated) protein (transcriptional coactivator with pdz-binding motif)/TAZ (transcriptional coactivator with pdz-binding motif), and regulates cell proliferation, apoptosis, differentiation, and tissue size by inhibiting cell proliferation and promoting apoptosis; it also plays an important role in development and homeostasis (Pan, 2007; Saucedo and Edgar, 2007; Zhao et al., 2008, 2010, 2011; Zhang et al., 2009). The core members of the Hippo-signaling pathway were first identified by genetic screening in Drosophila. Hippo-signaling pathways are highly conservative, and include MST1/2, SAV1, LATS1/2, MOB1A/B, and YAP/TAZ (Chan et al., 2005; Dong et al., 2007; Zhao et al., 2007).
At present, there is no report thorough published examination on the HIPPO signaling pathway in fishes. YAP1 also is associated with apoptosis. It is speculated that the down-regulation of YAP1 gene under ammonia-N stress is related to the occurrence of various diseases.
Neuroactive Ligand-Receptor Interaction and Hippo Signaling Pathway-Multiple Species
Prostaglandin E2 (PGE2) is an important arachidonic acid metabolite with strong immune activity, which can regulate the development, function, and survival of immune cells (Tilley et al., 2001). E-prostanoid receptors (EPs) are divided into four subtypes: EP1, EP2, EP3, and EP4. PGE2 ACTS on T lymphocytes and dendritic cells through EP4 receptors to promote differentiation of Th1 cells and the amplification of Th17 cells. Recent studies have shown that PGE2-EP4 signaling plays an important role in some autoimmune diseases (Libioulle et al., 2007; Yao et al., 2009; Chen et al., 2010; Ngoc et al., 2011).
In summary, our results show that fat greenling experience ammonia-driven physiological stress. A number of DEGs were significantly enriched, and related to pathways of immune or oxidative stress. Parallel results from GO functional analysis and KEGG-signaling pathway classification analysis, suggest we have identified various genes related to immune and oxidative stress. Ammonia exposure clearly seems to affect liver function, and our data provide a foundation for future research on this ecologically and economically important fish species.
Data Availability Statement
The datasets generated for this study can be found in the NCBI Sequence Read Archive Database under accession number SAMN11155636.
Ethics Statement
The animal study was reviewed and approved by the Marine Biology Institute of Shandong Province.
Author Contributions
FH and WG: substantial contributions to the conception and design of the work and provide approval for publication of the content. LL, FG, YJ, XuW, XiW, LP, and DL: acquisition of data for the work. LL: analysis and interpretation of data for the work. LL and FH: drafting the work and revising it critically for important intellectual content. All authors agreed to be accountable for all aspects of the work in ensuring that questions related to the accuracy and integrity of any part of the work are appropriately investigated and resolved.
Funding
This study was supported by the Key Technology Research and Development Program of Shandong (2019GHY112071 and 2019GHY112062) and Major agricultural application technology innovation projects in Shandong Province (SD2019YY007).
Conflict of Interest
The authors declare that the research was conducted in the absence of any commercial or financial relationships that could be construed as a potential conflict of interest.
References
Akins, P. T., Liu, P. K., and Hsu, C. Y. (1996). Immediately early gene expression in respones to cerebral isochemia: friend or foe? Strok 27, 1682–1687. doi: 10.1161/01.STR.27.9.1682
Altschul, S. F., Gish, W., Miller, W., Myers, E. W., and Lipman, D. J. (1990). Basic local alignmentsearch tool. J. Mol. 215, 403–410.
Aluru, N., and Vijayan, M. M. (2007). Hepatic transcriptome response to glucocorticoid receptor activation in rainbow trout. Physiol. Genomics 31, 483–491. doi: 10.1152/physiolgenomics.00118.2007
Alvarellos, S. S., Guzmán, J. M., Carrión, R. L., Míguez, J. M., Martín Del Río, M. P., and Mancera, J. M. (2005). Interactive effects of high stocking density and food deprivationon carbohydrate metabolism in several tissues of gilthead sea bream Sparusauratus. Exp. Zool. A Comp. Exp. Biol. 303, 761–775. doi: 10.1002/jez.a.203
Alves, R. N., Cordeiro, O., Silva, T. S., Richard, N., Vareilles, M. D., and Marino, G. (2010). Metabolic molecular indicators of chronic stress in gilthead seabream (Sparusaurata) using comparative proteomics. Aquaculture 299, 57–66. doi: 10.1016/j.aquaculture.2009.11.014
Anders, S., and Huber, W. (2010). Differential expression analysis for sequence count data. Genome Biol. 11:R106. doi: 10.1186/gb-2010-11-10-r106
Bairoch, A., Boeckmann, B., Apweiler, R., Blatter, M. C., Estreicher, A., Gasteiger, E., et al. (2003). The SWISS-PROT protein knowledge base and its supplement TrEMBL in. Nucleic Acids Res. 31, 365–370. doi: 10.1093/nar/gkg095
Benjamini, Y., and Hochberg, Y. (1995). Controlling the false discovery rate: a practical andpowerful approach to multiple testing. J. R. Stat. Soc. Ser. B 57, 289–300. doi: 10.1111/j.2517-6161.1995.tb02031.x
Benli, A. C. K., Koeksal, G., and Oezkul, A. (2008). Sublethal ammonia exposure of Nile tilapia (Oreochromisniloticus L.):effects on gill, liver and kidneyhistology. Chemosphere 72, 1355–1358. doi: 10.1016/j.chemosphere.2008.04.037
Bhatt, P., Chaurasia, M. K., Palanisamy, R., Kumaresan, V., Arasu, A., Sathyamoorthi, A., et al. (2014). Molecular cloning, characterization and gene expression of murrel CXC chemokine receptor 3a against sodium nitrite acute toxicity and microbial pathogens. Fish Shellfish Immunol. 39, 245–253. doi: 10.1016/j.fsi.2014.05.019
Blume, A., Herdegen, T., and Unger, T. (1999). Angiotensin peptides and inducible transcription factors. Mol. Med. 77, 339–357. doi: 10.1007/s001090050360
Chan, E. H. Y., Nousiainen, M., Chalamalasetty, R. B., Schäfer, A., Nigg, E. A., Silljé, H. H. W., et al. (2005). The Ste20-like kinase Mst2 activates the human large tumor suppressor kinase Lats1. Oncogene 24, 2076–2086. doi: 10.1038/sj.onc.1208445
Chen, Q., Muramoto, K., Masaaki, N., Ding, Y., Yang, H., Mackey, M., et al. (2010). A novel antagonist of the prostaglandin E(2) EP(4) receptor inhibitsTh1 differentiation and Th17 expansion and is orally activein arthritis models. Br. J. Pharmacol. 160, 292–310. doi: 10.1111/j.1476-5381.2010.00647.x
Cheng, C. H., Yang, F. F., Ling, R. Z., Liao, S. A., Miao, Y. T., Ye, C. X., et al. (2015). Effects of ammonia exposure on apoptosis, oxidative stress, and immune response in pufferfish (Takifugu Obscurus). Aquat. Toxicol. 64, 61–71. doi: 10.1016/j.aquatox.2015.04.004
Coggill, P. C., Punta, M., and Eberhardt, R. Y. (2012). ThePfam protein families database. Nucleic Acids Res. 40, D290–D301.
Constable, M., Charlton, M., Jensen, F., McDonald, K., Craig, G., and Taylor, K. W. (2003). An ecological risk assessment of ammonia in the aquatic environment. Hum. Ecol. Risk Assess. 9, 527–548. doi: 10.1080/713609921
Cordeiro, O. D., Silva, T. S., Alves, R. N., Costas, B., Wulff, T., and Richard, N. (2012). Changes inliver proteome expression of senegalese sole (Solea senegalensis) in response torepeated handling stress. Mar. Biotechnol. 14, 714–729. doi: 10.1007/s10126-012-9437-4
Cox, L. S., and Lane, D. P. (1995). Tumour suppressors, kinases and clamps: how p53 regulates the cell cycle in response to DNA damage. Bioessays 17, 501–508. doi: 10.1002/bies.950170606
DeFreitas, R. M., Rodriguez, E. M., Santos, E. A., and Ansaldo, M. (2000). Histopathological changes in gills of the estuarine crab Chasmagnathus granulate (Crustacea-Decapoda) following acute exposure to ammonia. Comp. Biochem. Physiol. Part C Oxicol. Pharmacol. 125, 157–164. doi: 10.1016/S0742-8413(99)00093-6
Diao, J., Liu, H. J., Hu, F. W., Li, L., and Wang, X. L. (2019). Transcriptome analysis of immune response in fat greenling (Hexagrammosotakii) against Vibrio harveyi infection. Fish Shellfish Immunol. 84, 937–947. doi: 10.1016/j.fsi.2018.10.067
Dong, J., Yin, H. B., Liu, W. Y., Wang, P., Jiang, Y., and Chen, J. (2005). Congenital iodine deficiency and hypothyroidism impair LTP and decrease C-fos and C-jun expression in rat hippocampus. Neurotoxicology 26, 417–426. doi: 10.1016/j.neuro.2005.03.003
Dong, J. X., Feldmann, G., Huang, J. B., Wu, S. A., Zhang, N. L., Comerford, S. A., et al. (2007). Elucidation of a universal size-control mechanismin Drosophila and mammals. Cell 130, 1120–1133. doi: 10.1016/j.cell.2007.07.019
Eddy, F. B. (2005). Ammonia in estuaries and effects on fish. Fish Biol. 67, 1495–1513. doi: 10.1111/j.1095-8649.2005.00930.x
Fedorova, N. D., Koonin, E. V., Jackson, J. D., Jacobs, A. R., Kryloa, D. M., Makarova, K. S., et al. (2004). A comprehensive evolutionary classification of proteins encoded in complete eukaryotic genomes. Genome Biol. 5:R7. doi: 10.1186/gb-2004-5-2-r7
Feidantsis, K., Portner, H. O., Markou, T., Lazou, A., and Michaelidis, B. (2012). Involvement of p38 MAPK in the induction of Hsp70 during acute thermalstress in red blood cells of the gilthead sea bream, Sparusaurata. J. Exp. Zool. Part A 317, 303–310. doi: 10.1002/jez.1725
Felipo, V., Kosenko, E., Minana, M. D., Marcaida, G., and Grisolia, S. (1994). Molecular mechanism of acute ammonia toxicity and of its prevention by L-carnitine. Adv. Exp. Med. Biol. 66, 65–77. doi: 10.1007/978-1-4615-1989-8_7
Gao, G. M., Yu, Z. J., Yan, J. Y., Li, J. J., Shen, S., Jia, B., et al. (2015). Lowering blood ammonia prevents hepatocyte injury and apoptosis. Int. J.Clin. Exp. Med. 8, 12347–12355.
Gay, N. J., and Keith, F. J. (1991). Drosophila toll and IL-1 receptor. Nature 6325, 355–356. doi: 10.1038/351355b0
Groom, J. R. (2011). CXCR3 in T cell function. Exp. Cell Res. 317, 620–631. doi: 10.1016/j.yexcr.2010.12.017
Haas, B. J., Grabherr, M. G., Yassour, M., Levin, J. Z., Thompson, D. A., Amit, I., et al. (2011). Fullengthtranscriptome assembly from RNA-seqdata without a reference genome. Nat. Biotechnol. 29, 644–652. doi: 10.1038/nbt.1883
Habib, K. A., Jeong, D., Myoung, J. G., Min, S. K., Jang, Y. S., Shim, J. S., et al. (2011). Populationgenetic structure and demographic history of the fat greenling Hexagrammos otakii. Genes. Genom. 33, 413–423. doi: 10.1007/s13258-011-0059-4
Hegazi, M. M., Attia, Z. I., and Ashour, O. A. (2010). Oxidative stress and antioxidant enzymes in liver and white muscle of Nile tilapia juveniles in chronic ammonia exposure. Aquat. Toxicol. 99, 118–125. doi: 10.1016/j.aquatox.2010.04.007
Hu, F. W., Pan, L., Gao, F. X., Jian, Y. X., Wang, X., Li, L., et al. (2017). Effect of temperature on incubation period and hatching success of fat greenling (hexagrammosotakii, Jordan &Starks) eggs. Aquacult. Res. 48, 361–365. doi: 10.1111/are.12853
Hu, X. Q., Fu, X. Z., Li, N. Q., Dong, X. X., Zhao, L. J., Lan, J. F., et al. (2015). Transcriptomic analysis of Mandarin fish brain cells infected with infectious spleen and kidney necrosis virus with an emphasis on retinoic acid- inducible gene 1-like receptors and apoptosis pathways. Fish Shellfish Immunol. 45, 619–629. doi: 10.1016/j.fsi.2015.05.007
Ip, Y. K., Tay, A. S., Lee, K. H., and Chew, S. F. (2004). Strategies for surviving highconcentrations of environmental ammonia in the swamp eel Monopterusalbus. Physiol. Biochem. Zool. 77, 390–405. doi: 10.1086/383510
Koo, J. G., Kim, S. G., Jee, J. H., and Kim, J. M. (2005). Effects of ammonia and nitrite on survival, growth and moulting in juvenile tiger crab, Orithyiasinica (Linnaeus). Aquac. Res. 36, 79–85. doi: 10.1111/j.1365-2109.2004.01187.x
Kyriakis, J. M., and Avruch, J. (2001). Mammalian mitogen-activated protein kinasesignal transduction pathways activated by stress and inflammation. Physiol. Rev. 81, 807–869. doi: 10.1152/physrev.2001.81.2.807
Lang, V., Janzen, J., Fischer, G. Z., Soneji, Y., Beinke, S., Salmeron, A., et al. (2003). βTrCP-Mediated proteolysis of NF-kB1 p105 requires phosphorylation of p105 serines 927 and 932. Mol. Cell. Biol. 23, 1402–1413. doi: 10.1128/MCB.23.1.402-413.2003
Lee, H. J., Jeong, Y. J., Lee, T. S., Park, Y. Y., Chae, W. G., Chung, I. K., et al. (2013). Moringa fruit inhibits LPS-induced NO/iNOS expression through suppressing the NF-KB activation in RAW 264.7 cells. Am. J. Chin. Med. 41, 1109–1123. doi: 10.1142/S0192415X13500754
Lee, P. J., and Choi, A. M. K. (2003). Pathways of cell signaling in hyperoxia. Free Radical. Biol. Med. 35, 341–350. doi: 10.1016/S0891-5849(03)00279-X
Li, B., and Dewey, C. N. (2011). RSEM: accurate transcript quantification from RNA-Seq datawith or without a reference genome. BMC Bioinf. 12:323.
Li, M., Gong, S. Y., Li, Q., Yuan, L. X., Meng, F. X., and Wang, R. X. (2016). Ammoniatoxicity induces glutamine accumulation, oxidative stress and immunosuppression in juvenile yellow catfish Pelteobagrusfulvidraco. Comp. Biochem. Physiol. C 183, 1–6. doi: 10.1016/j.cbpc.2016.01.005
Li, Y., Kim, I., Kim, Y. J., Kim, M. K., Yoon, Y. D., Lee, Y. S., et al. (2004). Cloning and sequence analysis of the self-fertilizing fish Rivulusmarmoratus immediate early gene c-fos. Mar. Environ. Res. 58, 681–685. doi: 10.1016/j.marenvres.2004.03.062
Libioulle, C., Louis, E., Hansoul, S., Sandor, C., Farnir, F., Franchimont, D., et al. (2007). Novel Crohn disease locus identified by genome-wide association maps to a gene desert on 5p13. 1 and modulates expression of PT-GER4. PLoS Genet. 3:e58. doi: 10.1371/journal.pgen.0030058
Mao, X. Z., Cai, T., Olyarchuk, J. G., and Wei, L. P. (2005). Automated genome annotation and pathwayidentification using the KEGG Orthology (KO) as a controlled vocabulary. Bioinformatics 21, 3787–3793. doi: 10.1093/bioinformatics/bti430
Marshall, W. S., Ossum, C. G., and Hoffmann, E. K. (2005). Hypotonic shock mediation byp38 MAPK, JNK, PKC, FAK, OSR1 and SPAK in osmosensing chloridesecreting cells of killifish opercular epithelium. J. Exp. Biol. 208, 1063–1077. doi: 10.1242/jeb.01491
Matsuoka, I., Fuyuki, K., Shoji, T., and Kurihara, K. (1998). Identification of c-fos related genes and their induction by neural activation in rainbow trout brain. Biochim. Biophys. Acta 1395, 220–227. doi: 10.1016/S0167-4781(97)00164-4
Mommsen, T. P., Vijayan, M. M., and Moon, T. W. (1999). Cortisol in teleosts: dynamics, mechanisms of action, and metabolic regulation. Rev. Fish Biol. Fish. 9, 211–268. doi: 10.1023/a:1008924418720
Ngoc, P. B., Suzuki, J., Ogawa, M., Hishikari, K., Takayama, K., Hirata, Y., et al. (2011). The anti-inflam-matory mechanism of prostaglandin e2 receptor 4 activation in rat experimental autoimmune myocarditis. J. Cardiovasc. Pharmacol. 57, 365–372. doi: 10.1097/fjc.0b013e31820b7be1
Obata, T., Brown, G., and Yaffe, M. B. (2000). MAP kinase pathwaysactivated by stress: the p38 MAPK pathway. Crit. Care Med. 28, N67–N77. doi: 10.1097/00003246-200004001-00008
Okuyama, T., Suehiro, Y., Imada, H., Shimada, A., Naruse, K., Takeda, H., et al. (2011). Induction of c-fos transcription in the medaka brain (Oryziaslatipes) in response to mating stimuli. Biochem. Biophys. Res. Commun. 404, 453–457. doi: 10.1016/j.bbrc.2010.11.143
Pan, D. J. (2007). Hippo signaling in organ size control. Genes Dev. 21, 886–897. doi: 10.1101/gad.1536007
Randall, D., and Tsui, T. (2002). Ammonia toxicity in fish. Mar. Pollut.Bull. 1, 17–23. doi: 10.1016/s0025-326x(02)00227-8
Rimoldi, S., Terova, G., Brambilla, F., Bernardini, G., Gormati, R., and Saroglia, M. (2009). Molecular characterization and expression analysis of Na+/H+ exchanger (NHE)-1 and c-Fos genes in sea bass (Dicentrarchuslabrax, L) exposed to acute and chronic hypercapnia. J. Exp. Mar. Biol. Ecol. 375, 32–40. doi: 10.1016/j.jembe.2009.05.002
Salmeron, A., Janzen, J., Soneji, Y., Bump, N., Kamens, J., and Allen, H. (2001). Direct phosphorylation of NF-kB1 p105 by the IkB Kinase complex on serine 927 is essential for signal-induced p105 proteolysis. J. Biol. Chem. 276, 22215–22222. doi: 10.1074/jbc.m101754200
Sasaki, T., Suzuki, A., Sasaki, J., and Penninger, J. M. (2002). Phosphoinositide 3-kinases in immunity:lessons from knockout mice. J. Biochem. 131, 495–501. doi: 10.1093/oxfordjournals.jbchem.a003126
Saucedo, L. J., and Edgar, B. A. (2007). Filling out the hippo pathway. Nat. Rev. Mol. Cell Biol. 8, 613–621. doi: 10.1038/nrm2221
Savan, R., Kono, T., Aman, A., and Sakai, M. (2003). Isolation and characterization of a novel CXC chemokine in common carp (Cyprinuscarpio L.). Mol. Immunol. 39, 829–834. doi: 10.1016/s0161-5890(02)00257-2
Schmittgen, T., and Livak, K. (2001). Analysis of relative gene expression data using real-time quantitative PCR and the 2-ΔΔCT method. Method 25, 402–408. doi: 10.1006/meth.2001.1262
Subramaniam, S., Stansberg, C., Olsen, L., Zou, J., Secombes, C. J., and Cunningham, C. (2002). Cloning of a Salmosalar interleukin-1receptor-like cDNA. Dev. Comp. Immunol. 26, 415–431. doi: 10.1016/s0145-305x(01)00091-x
Tilley, S. L., Coffman, T. M., and Koller, B. H. (2001). Mixed messages:modulation of inflammation and immune responses by prostaglandins and thromboxanes. J. Clin. Invest. 108, 15–23. doi: 10.1172/JCI200113416
Trapnell, C., Williams, B. A., Pertea, G., Mortazavi, A., Kwan, G., van Baren, M. J., et al. (2010). Transcript assembly and quantification by RNA-Seq reveals unannotated transcripts and isoform switching during cell differentiation. Nat. Biotechnol. 28, 511–515. doi: 10.1038/nbt.1621
Trower, M. K., Orton, S. M., Purvis, I. J., Sanseau, P., Riley, J., Christodoulou, C., et al. (1996). Conservation of synteny between the genome of the pufferfish (Fugurubripes) and the region on human chromosome 14 (14q24.3) associated with familial Alzheimer disease (AD3 locus). Proc. Natl. Acad. Sci. U.S.A. 93, 1366–1369. doi: 10.1073/pnas.93.4.1366
Usuki, F., Takahashi, N., Sasagawa, N., and Ishiura, S. (2000). Differential signaling pathways following oxidative stress in mutant myotonin protein kinase c DNA-transfected C2C12 cell lines. Biochem. Biophys. Res. Commun. 267, 739–743. doi: 10.1006/bbrc.1999.2026
Vijayan, M. M., Ballantyne, J. S., and Leatherland, J. F. (1990). High stocking density altersthe energy metabolism of brook charr. Salvelinusfontinalis fontinalis. Aquaculture 88, 371–381. doi: 10.1016/0044-8486(90)90162-g
Walsh, P. J., and Mommsen, T. P. (2001). Evolutionary considerations of nitrogenmetabolism and excretion. Fish Physiol. 20, 1–30. doi: 10.1016/S1546-5098(01)20002-8
Wettlaufer, S. H., Scott, J. P., Mceachin, R. C., Petersgolden, M., and Huang, S. K. (2016). Reversal of the transcriptome by prostaglandin E2 during myofibroblast dedifferentiation. Am. J. Respir. Cell Mol. Biol. 54, 114–127. doi: 10.1165/rcmb.2014-0468OC
Wilkie, M. P., Pamenter, M. E., Duquette, S., Dhiyebi, H., Sangha, N., and Skelton, G. (2011). The relationship between NMDA receptor function and the high ammonia tolerance ofanoxia-tolerant goldfish. J. Exp. Biol. 214, 4107–4120. doi: 10.1242/jeb.057513
Yang, W., Sun, H. J., Xiang, F. H., Yang, Z., and Chen, Y. F. (2011). Response of juvenile crucian carp(Carassiusauratus) to long-term ammonia exposure:feeding,growth,and antioxidant defenses. Freshwater Ecol. 26, 563–570. doi: 10.1080/02705060.2011.570944
Yang, W., Xiang, F. H., Sun, H. J., Chen, Y. F., Minter, E., and Yang, Z. (2010). Changes in the selected hematological parameters and gill Na+/K+ATPase activity of juvenile crucian carp Carassiusauratus during elevated ammonia exposure and the post-exposure recovery. Biochem. Syst. Ecol. 38, 4557–4562. doi: 10.1016/j.bse.2010.06.005
Yao, C., Sakata, D., Esaki, Y., Li, Y. X., Matsuoka, T., Kuroiwa, K., et al. (2009). Prostaglandin E2-EP4 signaling promotes immune inflammation through Th1 celldifferentiation and Th17 cell expansion. Nat. Med. 15, 633–640. doi: 10.1038/nm.1968
Ye, H., Xiao, S. J., Wang, X. Q., Wang, Z. Y., Zhang, Z. S., Zhu, C. K., et al. (2018). Characterization of spleen transcriptomeof Schizothoraxprenanti during Aeromonashydrophila infection. Mar. Biotechnol. 20, 246–256. doi: 10.1007/s10126-018-9801-0
Zhang, L., Yue, T., and Jiang, J. (2009). Hippo signaling pathway and organ size control. Fly 3, 68–73. doi: 10.4161/fly.3.1.7788
Zhang, Y. F., Ye, C. X., Wang, A. N., Zhu, X., Chen, C. H., Xian, J. N., et al. (2015). Isolated and combined exposure to ammonia and nitrite in giant freshwater pawn (Macrobrachium rosenbergii): effects on the oxidative stress, antioxidant enzymatic activities and apoptosis in haemocytes. Ecotoxicology 24, 1601–1610. doi: 10.1007/s10646-015-1477-x
Zhao, B., Lei, Q. Y., and Guan, K. L. (2008). The Hippo-YAP pathway:new connections between regulation of organ size and cancer. Curr. Opin. Cell Biol. 20, 638–646. doi: 10.1016/j.ceb.2008.10.001
Zhao, B., Li, L., Lei, Q. Y., and Guan, K. L. (2010). The Hippo-YAP pathway in organ size control and tumorigenesis: an updated version. Genes Dev. 24, 862–874. doi: 10.1101/gad.1909210
Zhao, B., Tumaneng, K., and Guan, K. L. (2011). The Hippo pathway in organ size control, tissue regeneration and stem cell self-renewal. Nat. Cell Biol. 13, 877–883. doi: 10.1038/ncb2303
Zhao, B., Wei, X. M., Li, W. Q., Udan, R. S., Yang, Q., Kim, J., et al. (2007). Inactivation of YAPoncoprotein by the Hippo pathway is involvedin cell contact inhibition and tissue growth control. Genes Dev. 21, 2747–2761. doi: 10.1101/gad.1602907
Zhao, J. G. (2008). Studies on genomic organization, antimicrobial activity and immune modulation of a medaka β-defensin gene, Institute of Hydrobiology. Chin. Acad. Sci. 5:e12883.
Zhao, L. J., Tu, J. G., Zhang, Y. L., Wang, J. F., Yang, L., Wang, W. M., et al. (2016). Transcriptomic analysis of the head kidney of Topmouthculter (Culteralburnus) infected with Flavobacteriumcolumnare with an emphasis on phagosome pathway. Fish Shellfish Immunol. 57, 413–418. doi: 10.1016/j.fsi.2016.09.001
Keywords: fat greenling (Hexagrammos otakii), ammonia, transcriptomic analysis, detoxification, immune responses, nitrogen
Citation: Li L, Gao F, Jian Y, Wang X, Wang X, Pan L, Guo W, Liu D and Hu F (2020) Transcriptomic Analysis of Liver Tissue in Fat Greenling (Hexagrammos otakii) Exposed to Elevated Ambient Ammonia. Front. Mar. Sci. 7:418. doi: 10.3389/fmars.2020.00418
Received: 15 February 2020; Accepted: 12 May 2020;
Published: 19 June 2020.
Edited by:
Libin Zhang, Institute of Oceanology (CAS), ChinaReviewed by:
Chenglong Wu, Huzhou University, ChinaFotini Kokou, Wageningen University & Research, Netherlands
Copyright © 2020 Li, Gao, Jian, Wang, Wang, Pan, Guo, Liu and Hu. This is an open-access article distributed under the terms of the Creative Commons Attribution License (CC BY). The use, distribution or reproduction in other forums is permitted, provided the original author(s) and the copyright owner(s) are credited and that the original publication in this journal is cited, in accordance with accepted academic practice. No use, distribution or reproduction is permitted which does not comply with these terms.
*Correspondence: Fawen Hu, fwhu88@163.com