Spatial Patterns of Particles and Plankton in the Warming Arctic Fjord (Isfjorden, West Spitsbergen) in Seven Consecutive Mid-Summers (2013–2019)
 Marlena Szeligowska1*
  Emilia Trudnowska1
  Rafał Boehnke1
  Anna Maria Dąbrowska2
  Józef Maria Wiktor2 Sławomir Sagan3
  Katarzyna Błachowiak-Samołyk1
- 1Pelagic Biocenosis Functioning Laboratory, Marine Ecology Department, Institute of Oceanology, Polish Academy of Sciences, Sopot, Poland
- 2Marine Protists Laboratory, Marine Ecology Department, Institute of Oceanology, Polish Academy of Sciences, Sopot, Poland
- 3Remote Sensing Laboratory, Department of Marine Physics, Institute of Oceanology, Polish Academy of Sciences, Sopot, Poland
The restructuring of planktonic communities toward an increasing share of small individuals is not only expected, but also already observed consequence of warming in the rapidly changing Arctic. Here, we demonstrate a simultaneous study on the nano-, micro- and meso plankton (divided into small and large), and corresponding size fractions of particles along a hydrographical gradient in the Isfjorden – the largest Spitsbergen fjord system. The sampling was performed in seven following summers (2013–2019) from the main basin under the influence of Atlantic Waters (ISA station), up to Billefjorden – the innermost part affected by meltwaters from Nordenskiöldbreen (BAB station). Our objective was to elucidate the composition and spatial patterns in distribution of plankton and particles (P&P) under various hydrographical regimes. Combining two laser-based measurements (LOPC and LISST) with standard plankton analysis allowed us to conclude that vertical hydrographical stratification and eddy activity were forcing either layered or patchy distribution of P&P. The concentrations of P&P measured by LISST (nano- and micro-) were lower than the abundance of the corresponding size fractions of protists, but they did not differ significantly among the stations due to different origin of P&P. Nevertheless, the decreasing trend in the abundance of both investigated mesoplankton fractions could be observed between the ISA and BAB stations, whereas the opposite tendency was noted for P&P. Moreover, the abundance of mesoplankton was equal to the concentrations of the corresponding size fractions of P&P at the ISA station and much lower than the LOPC counts at the BAB station, which points toward notable amount of marine aggregates in the glacial bay. Even if some observations alluded to P&P susceptibility to the local processes, the inter-annual variability in P&P distribution surpassed the differences between the sampling stations. It suggests that both the large-scale processes (i.e., intensified inflow of Atlantic Waters) and natural seasonal changes associated with subtle differences in sampling timing had a stronger influence on investigated plankton than local factors. This pioneering study, which links traditional and advanced methods, clearly demonstrated that such approach is convenient for tracking small-scale spatial patterns and inter-annual variability of P&P in the Arctic pelagial.
Introduction
The most rapid and substantial climate-related changes in marine ecosystems are observed at high latitudes, particularly in the Arctic. The reduction of sea ice cover, retreat of glaciers and thus an intensified freshwater discharge with suspended sediments are among the most pronounced consequences of climate fluctuations in this polar region. They are expected to result in strengthening of Arctic stratification and weakening of the large-scale ocean circulation (Murray et al., 2012; Straneo and Heimbach, 2013). Svalbard archipelago (74–81°N, 10–35°E), located in the European Arctic, is a unique area to study the aftermaths of warming (Symon et al., 2005; Piechura and Walczowski, 2009; Pavlov et al., 2013). The fjords on the western coast of Spitsbergen, which is the largest island of Svalbard archipelago, are exposed to various and dynamic forces that are driving local ecosystems. Among them, an advection of warm Atlantic Waters (AW) with West Spitsbergen Current - the major contributor to the oceanic heat transport to the Arctic - is essential (Carroll et al., 2011). Since these fjords balance Atlantic, Arctic, saline and freshwater regimes, different habitats exist there over relatively small spatial scales. Therefore, biological components of the west Spitsbergen coastal waters might be extremely vulnerable and potentially sensitive indicators of the environmental changes. However, they are still not fully explored and the knowledge gap is the most apparent for Isfjorden - the largest Svalbard fjord system.
It is only recently that glacier-impacted fjordic waters have been recognized as unique ecosystems being important nurseries and feeding areas for many fish, seabirds and marine mammals (Lydersen et al., 2014; Urbanski et al., 2017), or even as biomes with potential implications for the global carbon cycle (Smith et al., 2015). Since plankton is a key component of the Arctic pelagic food web, pathways and efficiency of energy transfer to the higher trophic levels depend on its structure and dynamics. Despite a few group-specific studies on the fluctuations of either protists or zooplankton (e.g., Gluchowska et al., 2016; Kubiszyn et al., 2017), the nature of the progressing changes in its functioning as an entire planktonic community remains poorly characterized. It is caused by the fact that such investigations require extensive, simultaneous, and interdisciplinary studies on the essential roles which various plankton size fractions play. For planktonic organisms size is a crucial determinant of their predator and prey range, but it is a technical challenge to cover such a wide size spectrum of planktonic individuals. However, resolving their community structure and dynamics is of great importance, since high spatial variability in plankton distribution represented by patches formation have been widely demonstrated to have a substantial role in enhancing trophic transfer (e.g., Wishner et al., 1988; Godø et al., 2012; Majaneva et al., 2013).
Even though the mosaic nature of the plankton distribution pattern is well-known, the phenomenon of plankton patchiness, which has been shown to be a ubiquitous and important feature also in the Arctic (e.g., Trudnowska et al., 2016), is still poorly characterized. Thus, any ability to predict the spatial patterns of plankton would significantly enhance our understanding of the Arctic ecosystems functioning. However, owing to the high variability of physical processes at small spatial scales and their impacts on biological dynamics controlling plankton distribution, high resolution sampling is necessary for further elucidation of such patterns. Recent technical advances in laser-based devices have opened new perspectives in ecological and behavioral studies by significantly improving sampling resolution. For instance, they allowed to describe wide size structure and distribution of particles and plankton in the Fram Strait, which is the main northward passage of AW to the Arctic region (Trudnowska et al., 2018). Nonetheless, even though laser-based systems used in the study measure particles suspended in the seawater in a wide range of sizes and at high frequency (Sprules and Barth, 2016), they do not allow distinguishing between living organisms (protists, zooplankton) and particulate matter. Hence, in areas with high detritus abundances the amounts of plankton might be overestimated (Stemmann and Boss, 2012) and it is important to compare the results obtained by laser-based measurements with complementary dataset to provide qualitative information.
Addressing the evident knowledge gap concerning the simultaneous examination of the relative roles of various size fractions of plankton and particles (P&P), we performed a comprehensive study on the inter-annual changes in distribution of wide range of plankton size fractions (nano-, micro-, small, and large mesoplankton) and the corresponding size fractions of particles. We used two laser-based counters: Laser In Situ Scattering and Transmissometry instrument (LISST-100X) for smaller (3–200 μm), and Laser Optical Plankton Counter (LOPC) for larger size fractions (200–5000 μm). These measurements were conducted simultaneously with standard sampling methods for protists and zooplankton (Niskin bottles and plankton nets, respectively) followed by microscopic analyses of these formations. Due to a strong contribution of marine aggregates to the laser-based counts, throughout this article we refer to P&P collectively while describing results from LISST or LOPC, whereas we refer exclusively to plankton in the case of standard methods. Our objective was to describe small-scale distribution and relative roles of different planktonic groups in relation to the hydrographic structure and various river/glacier discharge impacts in Isfjorden in seven summer seasons (2013–2019). In this context, our research constitutes the first such comprehensive attempt to present a holistic view on spatio-temporal coupling between particles, aggregates, auto- and heterotrophic protists together with zooplankton divided into small and large size fractions.
Materials and Methods
Study Area
Data were collected in Isfjorden (78°70′ N–78°27′ N, 13°–17° E), Spitsbergen (Figure 1) during the cruises on the R/V Oceania conducted by the Institute of Oceanology of the Polish Academy of Sciences (IO PAN) in the late July – early August surveys (covering the main melting season) in 2013–2019 (24–25 July 2013, 24 July 2014, 10 August 2015, 9–10 August 2016, 12–13 August 2017, 2–3 August 2018, 26–27 July 2019). The continuous, high resolution laser-based measurements were performed within the upper 70 m water column along a 60 km transect crossing Isfjorden, starting from sampling station located at the mouth of the southern branch of Isfjorden – Adventfjorden (ISA), through station in the central part of Isfjorden (ISF3 sampling station) up to the innermost part of Billefjorden (BAB sampling station).
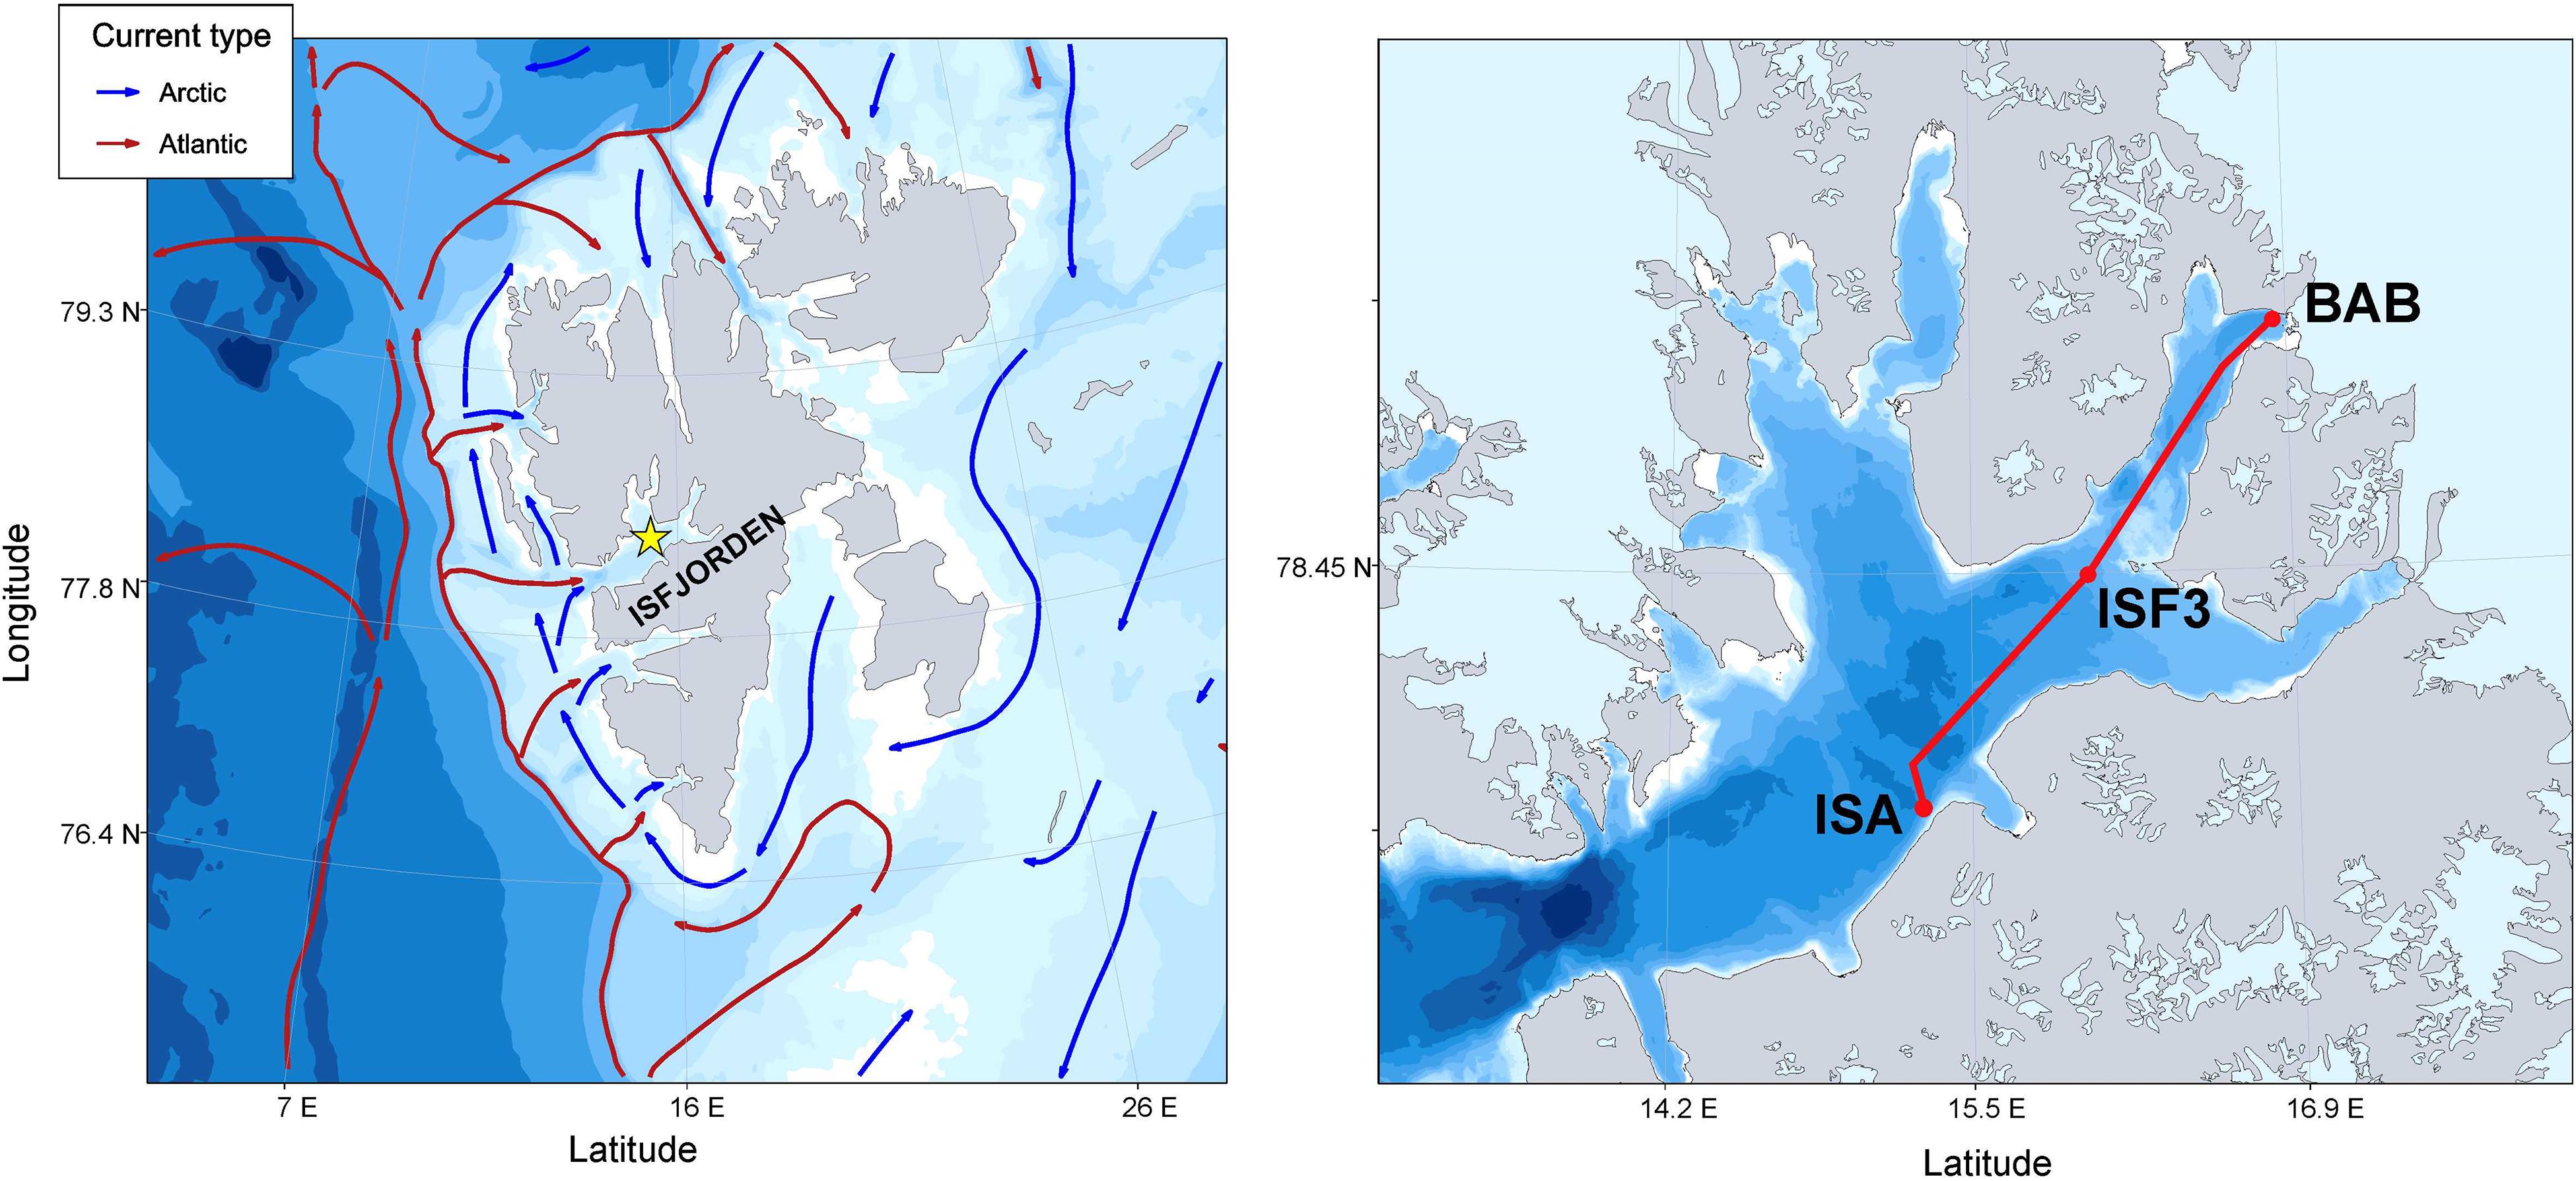
Figure 1. Study area: Map of Svalbard Archipelago with schematic ocean currents circulation (PlotSvalbard R package by Vihtakari (2019); transect of laser-based measurements (LOPC & LISST marked as a red line) and plankton stations (ISA, ISF3 and BAB marked as red dots) in Isfjorden.
During summer hydrographic conditions in Isfjorden can easily switch from typically Arctic to the Atlantic (Cottier et al., 2005, 2007). Due to the wide (about 10 km) and deep (455 m) mouth, it is open to the seawaters, and thus prone to the influence of AW carried by the West Spitsbergen Current (Nilsen et al., 2008). The hydrographical properties of Isfjorden vary from year to year, depending on the intensity of the advection of AW (Walczowski and Piechura, 2011) and the extent of the mixing (Svendsen et al., 2002) with Arctic Waters from the Sørkapp Current (flowing along West Spitsbergen shelf), local water and additional freshwater input originating from melting glaciers (Saloranta and Svendsen, 2001; Pavlov et al., 2013).
The area of ISA sampling station is influenced by the inflow of AW and three glacial-fed rivers discharging fresh and turbid waters during the main melting season (Leikvin and Evenset, 2009). BAB sampling station was located in Billefjorden - about 30 km long and 5–8 km wide northern branch of Isfjorden. The fjord is relatively shallow - the average depth is 160 m and maximum of approximately 190 m (Nilsen et al., 2008). An outer sill of 70 m and inner one of 50 m divide Billefjorden into outer and inner basins and restrict to some extent the exchange between them (Nilsen et al., 2008). AW advected to Billefjorden, Arctic Waters and/or Transformed AW undergo subsequent transformation through mixing with local waters from fjord and glacial waters (Pavlov et al., 2013). In summer, Billefjorden is supplied with meltwater with sediments load from a large glacier (Nordenskiöldbreen). A distinctive stratification of surface waters develops during this season and a pronounced thermocline and a halocline extend down to sill depth (Daase et al., 2007) covering cold and dense water masses. Due to severely restricted water masses exchange in the inner basin of Billefjorden, it is less affected by inflowing AW (Cottier et al., 2005; Nilsen et al., 2008). Hence, winter water is still present. ISF3 station is located approximately in the middle of the transect. This station was set in order to represent typical conditions of the central part of Isfjorden. Moreover, a cross-fjord location of the sampling station gives a possibility to test if in some years the upper water layer was under higher influence of either the innermost glacial plumes, or the AW advected from the shelf.
Laser-Based Measurements
The high resolution laser-based measurements of size-fractionated P&P distribution were conducted along a 60 km transect from the mouth of Adventfjorden up to Billefjorden (Figure 1) in an undulating mode between the surface and 70 m depth. The concentrations of wide size range of P&P (between 3 μm to 5 mm) were measured by means of two optical counters mounted on the same platform: Laser In Situ Scattering and Transmissometry instrument (LISST-100X, type B, Sequoia Scientific, Inc., WA, United States) and a Laser Optical Plankton Counter (LOPC, Brooke Ocean Technology Dartmouth, Canada) equipped with a conductivity-temperature-depth sensors (CTD, SBE 911plus, Seabird Electronics Inc., United States) and a fluorometer (Seapoint Sensors Inc., United States). The details regarding the principles of the LISST and LOPC are presented elsewhere (e.g., Agrawal and Pottsmith, 2000; Herman et al., 2004; Basedow et al., 2010; Trudnowska et al., 2014).
Standard Plankton Sampling and Analysis
Plankton samples were collected at three stations (BAB, ISF3, and ISA) located along a 60 km transect of laser-based measurements. Samples for analysis of the protist community, as well as chlorophyll a concentration were collected by means of 8 L Niskin bottles. In 2013 and 2014 sampling was performed in the euphotic zone, defined as layer from 100% (at 0 m) down to 1% of incident photosynthetically active radiation (PAR). In 2015, samples were collected from the arbitrarily chosen depths covering the photic zone: 0 m, 5 m, 15 m, 25 m, 50 m; due to technical problems two depths remained unsampled, i.e., 15 m and 0 m at the ISA and BAB stations, respectively. Starting from 2016 the depths, from which samples were collected, were fixed on 5 m, 15 m, 25 m, and 50 m and immediately physically integrated into one sample (volume of 200 mL) representing the mean community structure (cells in m3) for the upper 5–50 m water column. For this purpose, samples were mixed in proportion to the vertical extent of water they represent, according to the formulas given in Möller and Bernhard (1974). Regardless of the sampling method, the protists subsamples of 200 mL volume were immediately fixed with an acidic Lugol’s solution and, after 24 h, with borax-buffered formaldehyde. Both fixatives were added to a 2% final concentration. In years 2013 to 2016 subsamples of volume 250 mL - 400 mL for chlorophyll a concentrations were filtered through GF/F Whatman filters (pore size of 0.7 μm) in triplicates, and immediately frozen at −80°C. Extraction was done in 10 mL methanol for 20–24 h in cold (4°C) and dark place as given in Holm-Hansen and Riemann (1978). Chlorophyll a concentration (mg⋅m–3) was measured with a Turner Trilogy fluorometer calibrated with chlorophyll a standard (Sigma S6144). Quantitative and qualitative analyses of protists were done following the protocols of Utermöhl (1958) and modified by Edler (1979). Protist samples preparation for microscopic analysis and data processing was performed in accordance with Kubiszyn et al. (2014). As the Lugol’s fixative precluded mode of nutrition identification, we used the available literature (Stoecker et al., 1994; Vaqué et al., 1997; Dolan et al., 2002; Gribble et al., 2007; Leadbeater, 2008; Mironova et al., 2009; Gómez and Artigas, 2014) and the Nordic Microalgae web base1, to distinguish mode of nutrition of the observed taxa. Because mixotrophy cannot be determined in fixed material, taxa were classified as strict phototrophs or heterotrophs as described by Kubiszyn et al. (2014). If taxa could not be identified to the species level, and thus, the mode of nutrition could not be specified (i.e., unidentified small mono- and biflagellates of 3–7 μm) and a few taxa of the Gymnodinium and Gyrodinium genera), the “undetermined” mode of nutrition was also used.
Zooplankton sampling was performed at the same three stations as protists sampling in a vertical hauls (50–0 m) of WP2 net with a mesh size of 100 μm and an opening of 0.25 m2. Samples were immediately preserved with 4% borax-buffered formaldehyde-seawater solution. Samples were prepared into appropriate volume depending on their densities and 2 mL subsamples were taken by Henson-Stempel pipette. The analysis was done under the stereomicroscope at 10–40× magnifications. All organisms were enumerated and identified from subsamples until at least 300 individuals were identified. The rest of each sample was analyzed for less abundant stages and rare species. Zooplankton identification was done to the lowest possible taxonomic level. All large and medium-sized calanoids were identified to appropriate species and copepodite stages. Calanus finmarchicus, C. glacialis and C. hyperboreus copepodite stages were distinguished by the comparison of prosome length measurements of all counted individuals with a size table obtained for Calanus spp. from Billefjorden by Arnkværn et al. (2005). Identification of Pseudocalanus to species level (P. minutus and P. acuspes) was done only for females because of uncertainties in distinguishing the remaining copepodite stages. Additionally, at least ten individuals representing various macrozooplankton and non-copepod mesozooplankton taxa per sample were measured. For morphometric analysis the total length distance from the top of a head/tip of a rostrum to the end of the body was used in case of longitudinal shape zooplankters (Søreide et al., 2003) or diameter in case of round shape zooplankters (Gannefors et al., 2005). Zooplankton abundances were calculated as a number of individuals in a cubic meter (individuals⋅m–3) using the volume of cylinder formula where h: layer of sampled water column, surface area: opening of the WP2 net. Filtration efficiency of 100% of the net was assumed. The occasional counts of macrozooplanktonic organisms >5 mm (i.e., euphausiids, amphipods) were not included in the total abundance.
Data Processing and Statistical Analysis
Measurements of LISST and LOPC from the upper 2.5 m were discarded to minimize false counts due to a wave action, stray light or air bubble formation. The concentrations of P&P were calculated as the counts in a cubic meter (counts⋅m–3), based on the sampled water volume and then averaged over 1 m depth intervals. In order to avoid potential errors at the lower and upper ends of the instrument’s detection limits (Blanco et al., 1994; Mikkelsen et al., 2005; Stemmann et al., 2008; Davies et al., 2012), we restricted data to 3–200 μm equivalent spherical diameter (ESD) for the LISST and to 200–5000 μm ESD for the LOPC. Consequently, the size bins were aggregated into commonly used size ranges for nano- (3–20 μm) and micro- (20–200 μm) fractions as well for small- (200–500 μm) and large mesoplankton (500–5000 μm ESD) fractions, which corresponds to the division level between small and large copepods as well as between microaggregates and macroaggregates (>500 μm) (Simon et al., 2002; Trudnowska et al., 2018).
Brunt–Väisälä frequency squared (N2), which is a measure of the vertical stratification or the static stability of the water column, was calculated from salinity, temperature and pressure using the MATLAB seawater toolbox2. If N2 > 0, the water column is hydrostatically stable, and when N2 < 0, it becomes hydrostatically unstable. The level of stratification can be based on the following criteria: N2 < 2⋅10–5 rad2s–2 non-stratified, 2⋅10–5 rad2s–2 < N2 < 5⋅10–5 rad2s–2 weakly stratified and N2 > 5⋅10–5 rad2s–2 strongly stratified (Mojica et al., 2015). The sections of temperature, salinity, chlorophyll a fluorescence, N2, and different P&P size fractions distributions were prepared using Ocean Data View Software (Schlitzer, 2018).
The analysis of plankton taxonomic composition (grouped into few dominating categories, corresponding to the ones presented in the results) and share of particular size fractions was performed on log-transformed abundance data to ensure a more balanced view of the community structure by reducing the influence of the most numerous taxa. Bray–Curtis similarity matrixes, which are the most commonly used scaling for biological community analysis, were applied to measure the resemblance among communities found at stations in particular years. To assess the similarities in the taxonomic composition of size fractions a non-metric MDS method was applied. The one-way ANOSIM was used to test if the differences in the relative roles of various plankton size fractions between investigated years and stations were similar (R = 0) or statistically different (R = 1, when groups of samples are well separated and characterized by the highest dissimilarity). The Spearman rank was used as a correlation method either for years or stations.
The number spectrum, an analog to the widely known particle size distribution (PSD), is one among the most popular approaches to analyze the size spectrum of particles (e.g., Jackson et al., 1997; Stemmann et al., 2008) and here it was calculated by dividing the concentration (abundance) of plankton as well of P&P within the size fractions by a width (difference between size limits) of the size fraction. The slope of the linear log-log dependence between size and a number of P&P reflects the relative importance of smaller (steep slope) or larger (flatter slope) components. The slopes of the size-fractionated concentrations of plankton and P&P were compared and tested using the Kruskal–Wallis test, which is a nonparametric one-way ANOVA based on ranks, used for comparing numerous independent samples. The importance of the effect of year and station was also tested by the Kruskal–Wallis test on abundances of particular size fractions of both plankton and P&P. The statistical analyses were computed in R (R Core Team, 2013), PRIMER v7 & PERMANOVA (Anderson et al., 2008; Clarke and Gorley, 2015), and Matlab v2018b packages (MATLAB, 2018).
Results
Hydrography and Chlorophyll a Fluorescence
The warmest water was generally found within the upper 20 m (Figure 2). In this surface layer, the temperature varied mainly between 4 and 10°C, with the highest temperatures near the BAB station in 2018 and 2019. Seawater temperature was decreasing with depth and toward the innermost station. The coldest water masses (Winter Cooled Water, T < −0.5°C, S > 34.4) were observed each year behind the sill that separates Billefjorden from the central part of Isfjorden (Nilsen et al., 2008). At ISA and ISF3 stations temperature was usually above 0°C even at 70 m depth. Out of the seven investigated summers, in 2013 the lowest seawater temperatures (below 0°C) were noted at each station in the water layer below 40 m, while opposite temperature pattern was found in the warmest 2014 (up to 40 km of section distance temperature in the 50 m water layer was higher than 4°C). The water stratification differed between the first 20–40 km of the transect and further on, with shallower warm and freshwater layer near the ISA station and deeper and more pronounced freshwater layer closer to Billefjorden (BAB station). At approximately 20 km distance from the ISA station a discontinuity in hydrographic structure was observed in 2016–2018 (marked by arrows in Figure 2). It was most probably accompanied by shallow submesoscale eddy with a diameter of a few kilometers, whose core was characterized by local depression of the warmer and fresher water. The fresh surface water layer (10 m) with salinity reduced to around 29 was stretched for around 30 km from the BAB station. The area close to ISA station was also influenced by freshwater input (salinity reduced to 32 in the uppermost 10 m). The salinity was increasing with depth and it was generally between 33 and 34 below 20 m with an exception in 2014 when it reached 35. The fluorescence of chlorophyll a along the transect was the highest in the upper 20 m layer, but occasionally its high values reached down to 40 m at the ISA station. The fluorescence of chlorophyll a was usually lower and restricted to narrower vertical ranges in Billefjorden. The relative values of chlorophyll a fluorescence were the lowest in 2013 and the highest in 2014. The vertical extent of an euphotic zone varied along the transect, e.g., from 10–12 m in the inner Billefjorden (BAB station) to 28–32 m in the southern part of the fjord (ISA) in 2013 and 2014. Low fluorescence of chlorophyll a in the surface water layer was observed inside the hydrographical discontinuity in 2016–2018. In 2013–2016, the water column was strongly stratified and hydrostatically stable even down to 40 m, whereas in 2017–2019, a stratification gradient was shallow (upper 5 m) and hydrographic structure of the water column was most probably unstable, especially in the Billefjorden part of the transect (Figure 2).
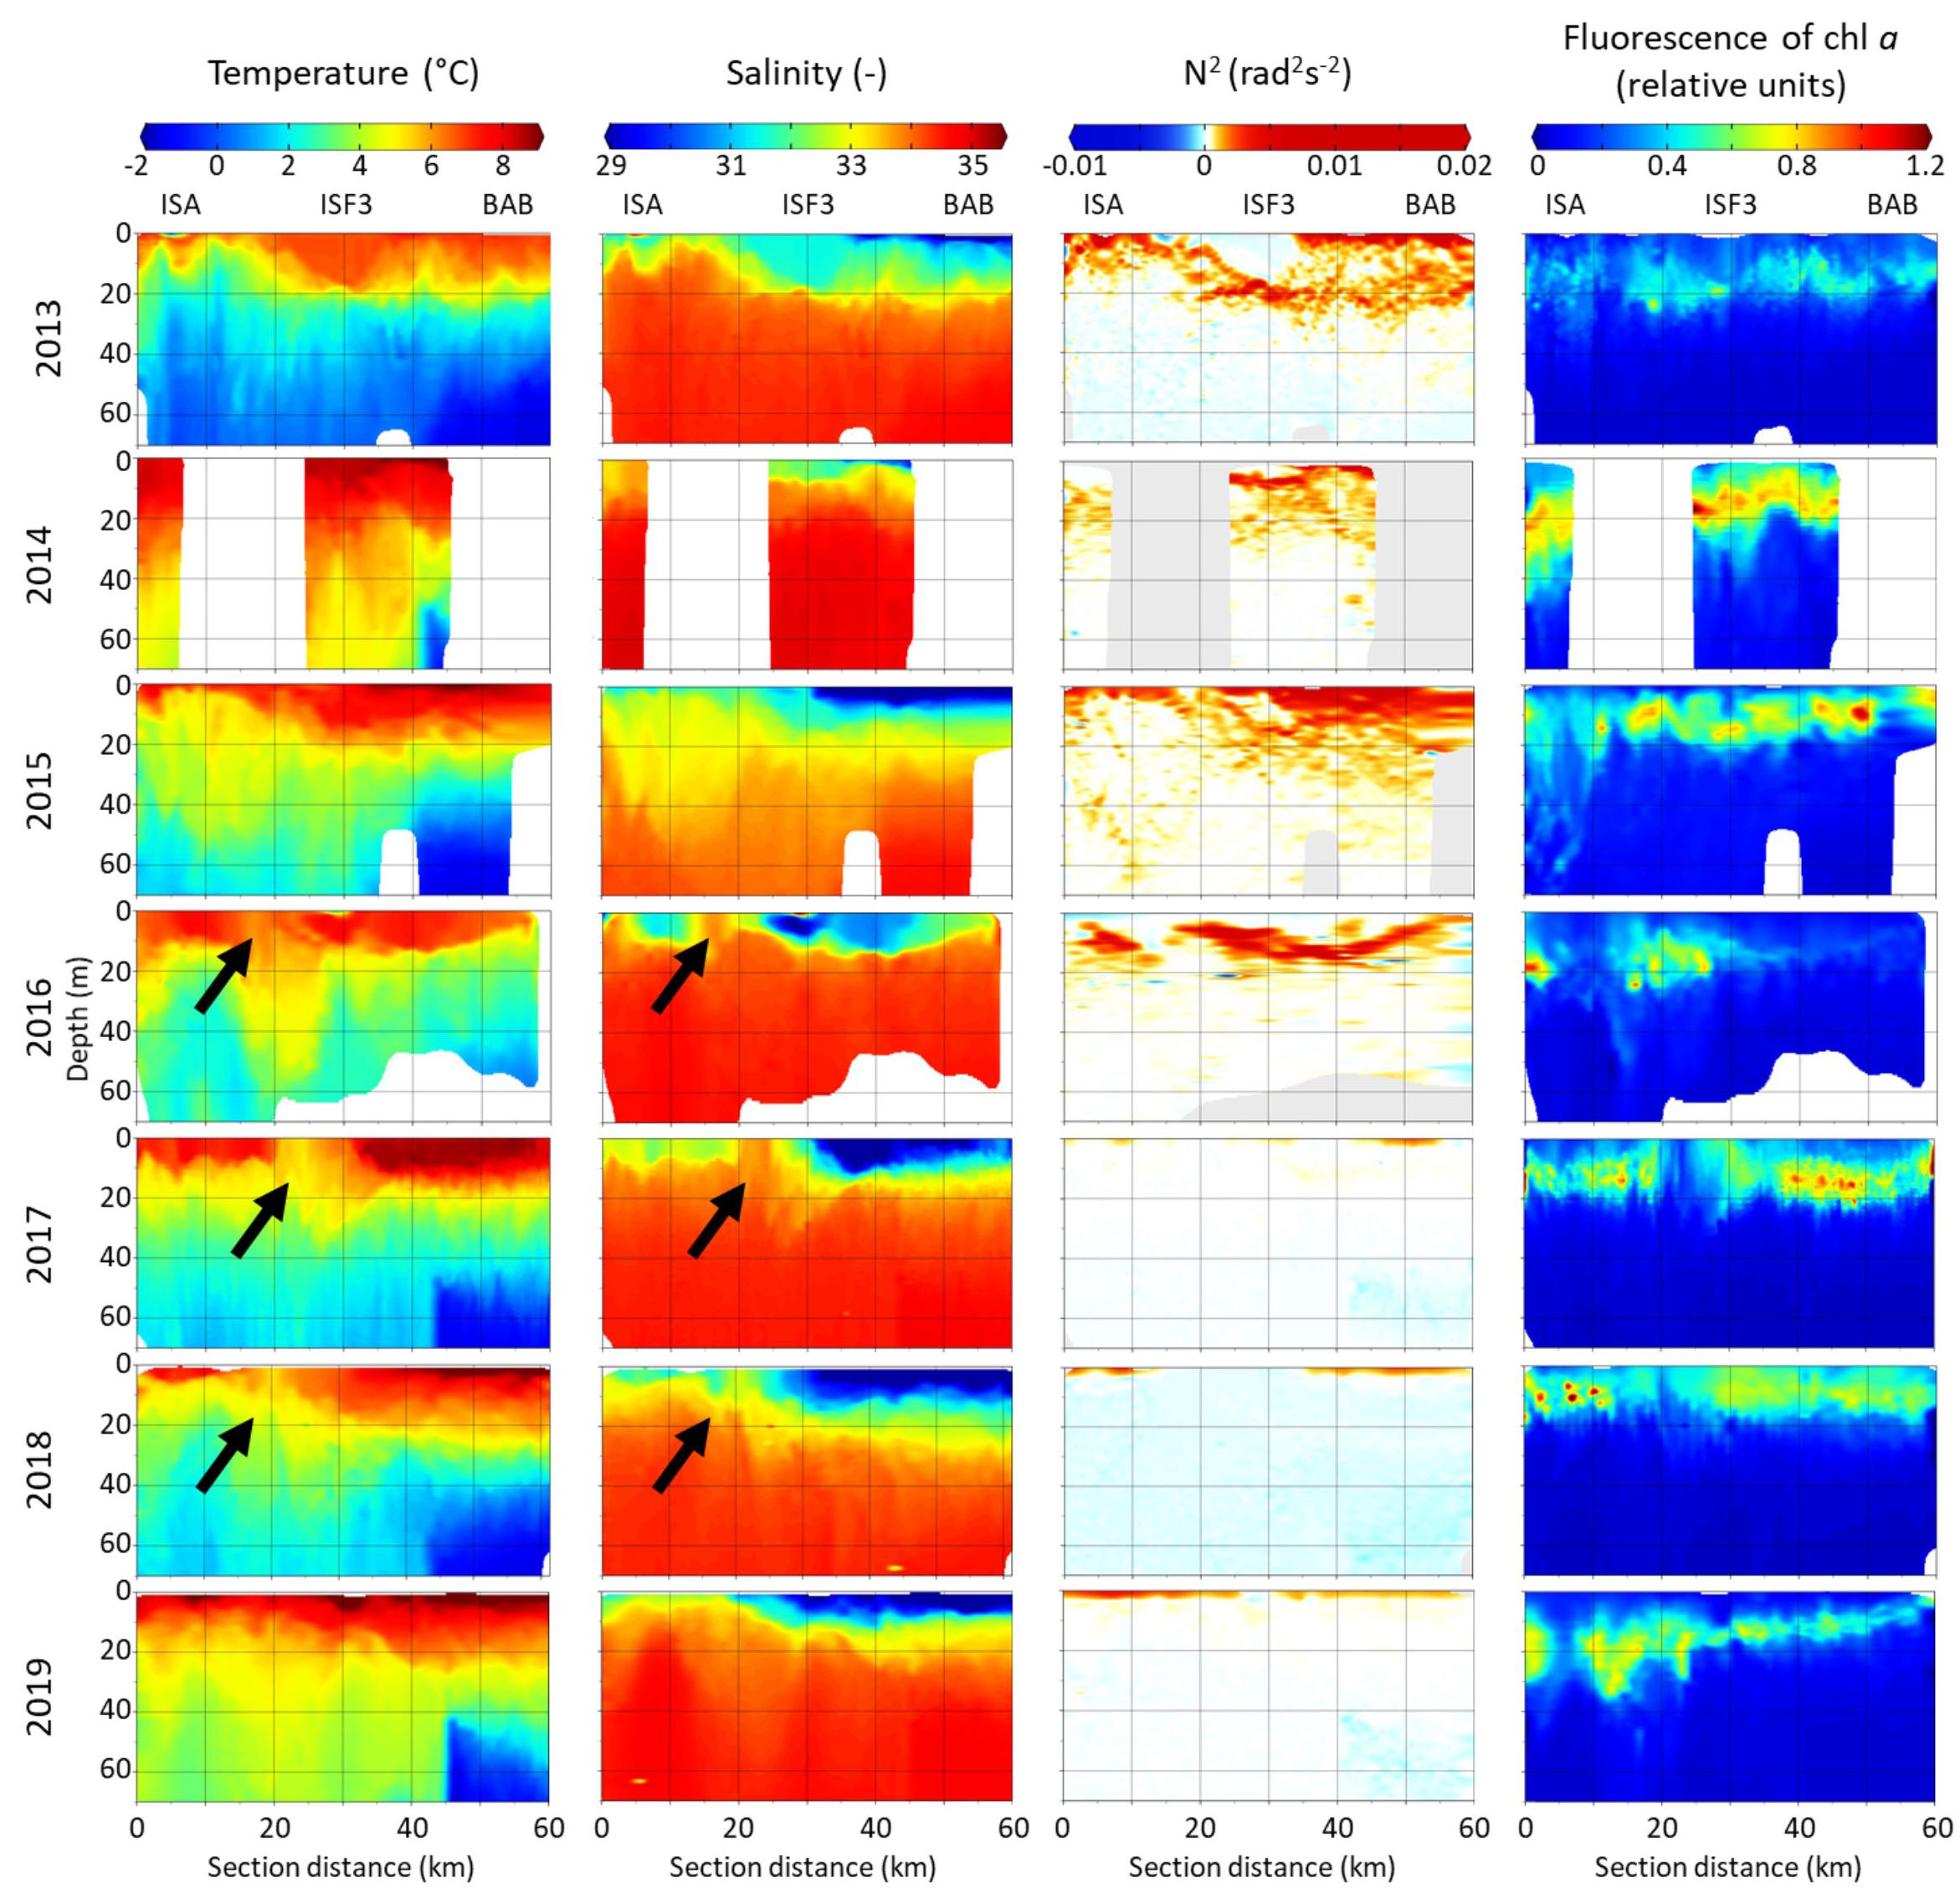
Figure 2. Distribution of temperature (°C), salinity, water column stability (Brunt–Väisälä frequency squared N2 [rad2s–2]) and fluorescence of chlorophyll a (relative units) along Isfjorden transect from ISA station (left side of each graph) up to BAB station (right side of each graph) in seven consecutive mid-summers (2013–2019). Arrows indicate a hydrographical discontinuity followed by eddy.
Spatial Distribution of P&P Size Fractions Along the Investigated Transect of Laser-Based Measurements
Distribution of P&P evaluated by laser-based devices (LISST and LOPC) of nano- (3–20 μm), micro- (20–200 μm), small meso- (200–500 μm) and large meso- (500–5000 μm) size fractions strongly varied between the investigated summers (Figure 3). Apart from 2018, the peaks of all analyzed fractions were mostly concentrated in the upper 20 m layer. Generally, the nano- fraction was almost uniformly concentrated near the surface along the transects. Between 2015 and 2017 the micro- fraction occurred in a form of a few kilometers long surface patches. This fraction was extremely abundant in 2018 (note different scale) and 2019 and expressed a particularly distinguishable distribution pattern in 2019, with the vertical extension of the peaks through the whole investigated water body. The interesting feature of the small meso- fraction distribution was that at the BAB station – the end of the transect – P&P were often (in 2013, 2016, 2018, and 2019) very numerous also in the deeper parts of the water column. The patches of the large meso- fraction were mostly less extended than the ones of the small meso- fraction (except for 2014). There was a similar vertical pattern of nano-, micro- and small meso- fractions in 2015 and 2016, manifested by their peaks in distribution – the larger the fraction, the deeper it was present in the water column. In 2017 the location of peaks in abundance of nano-, micro- and small fractions was also compatible. The exceptionally high abundance of all size fractions of P&P was observed in 2018 in a form of three corresponding concentration peaks that spread vertically through the whole studied water column (70 m). In 2016–2018 low abundance of P&P in the surface water layer was associated with the observed hydrographical discontinuity. At its edge the P&P accumulation zone was present, which most probably resulted from the eddy formation. In 2019 there were also high numbers of nano- and micro- sized particles accompanied by a peak in abundance of small meso- fraction observed in the deeper waters.
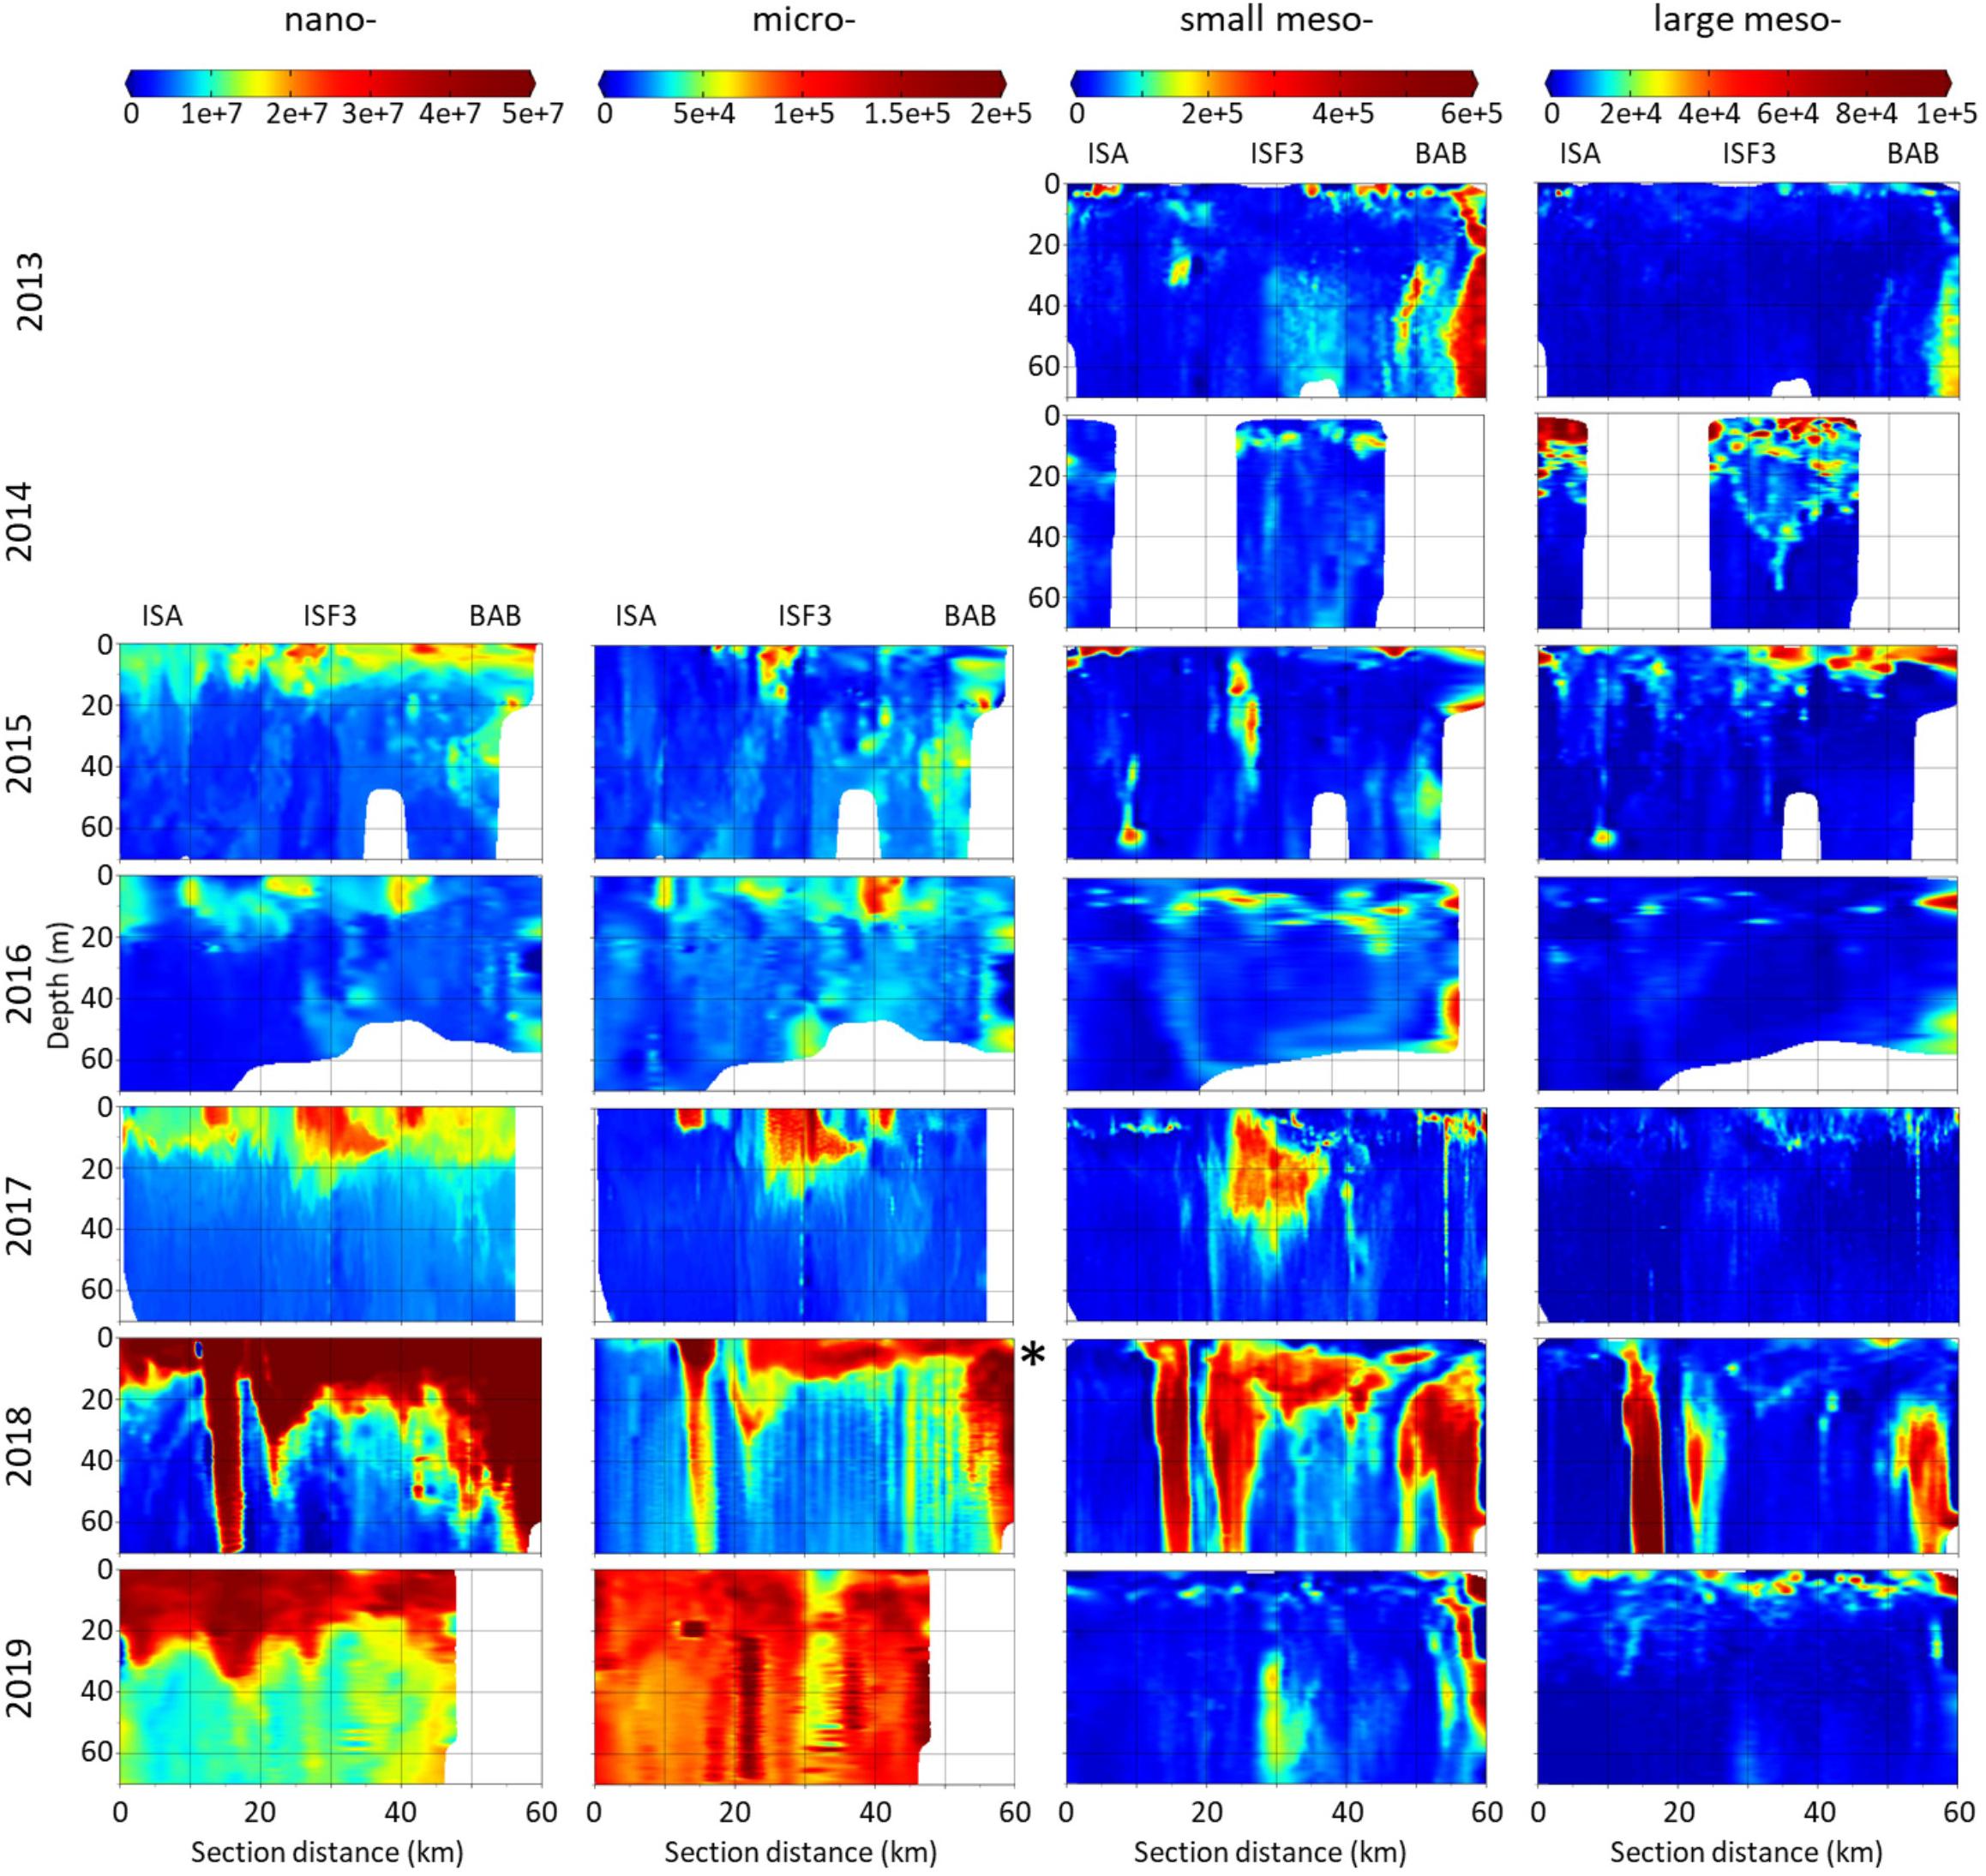
Figure 3. Distribution of abundance (counts⋅m–3) of P&P classified into four size fractions: nano-, micro-, small meso- and large meso- in the upper water column along Isfjorden transect from ISA station (left side of each graph) up to BAB station (right side of each graph) in seven consecutive mid-summers (2013–2019). Note different scales between size fractions. In 2018 the abundances of micro- fraction were one order of magnitude higher than in other years (∗). Data for nano- and micro- fractions (LISST) were not collected in 2013 and 2014.
Abundance and Taxonomic Composition of Plankton Divided Into Various Size Fractions
In total, 90 protist taxa with the most diverse Dinophyceae (39), Ciliophora (16), Bacillariophyce (15), and Prymnesiophyceae (5) were identified, whereas in the case of zooplankton we noted 40 taxonomical categories with the highest number of Copepoda (14). The nanoplanktonic fraction, which constituted the most important contributor to the total protists abundance, was predominated by Cryptophyceae (up to 100%) mainly represented by Teleaulax spp., whereas the microplanktonic fraction was usually dominated by Ciliophora (up to 82%) with the highest number of Lohmanniella oviformis and Acanthostomella norvegica (Figure 4). Occasionally, there were peaks in abundance associated with Dinophyceae (Gymnodinium spp. in 2013) or Prymnesiophyceae (Phaeocystis pouchetii in 2017 and 2018) at the ISA station. The high abundance of Dinophyceae (Peridiniales indet. and Protoperidinium spp.) was also observed among the microorganisms in 2013 at the ISA station and in 2018 at the BAB station.
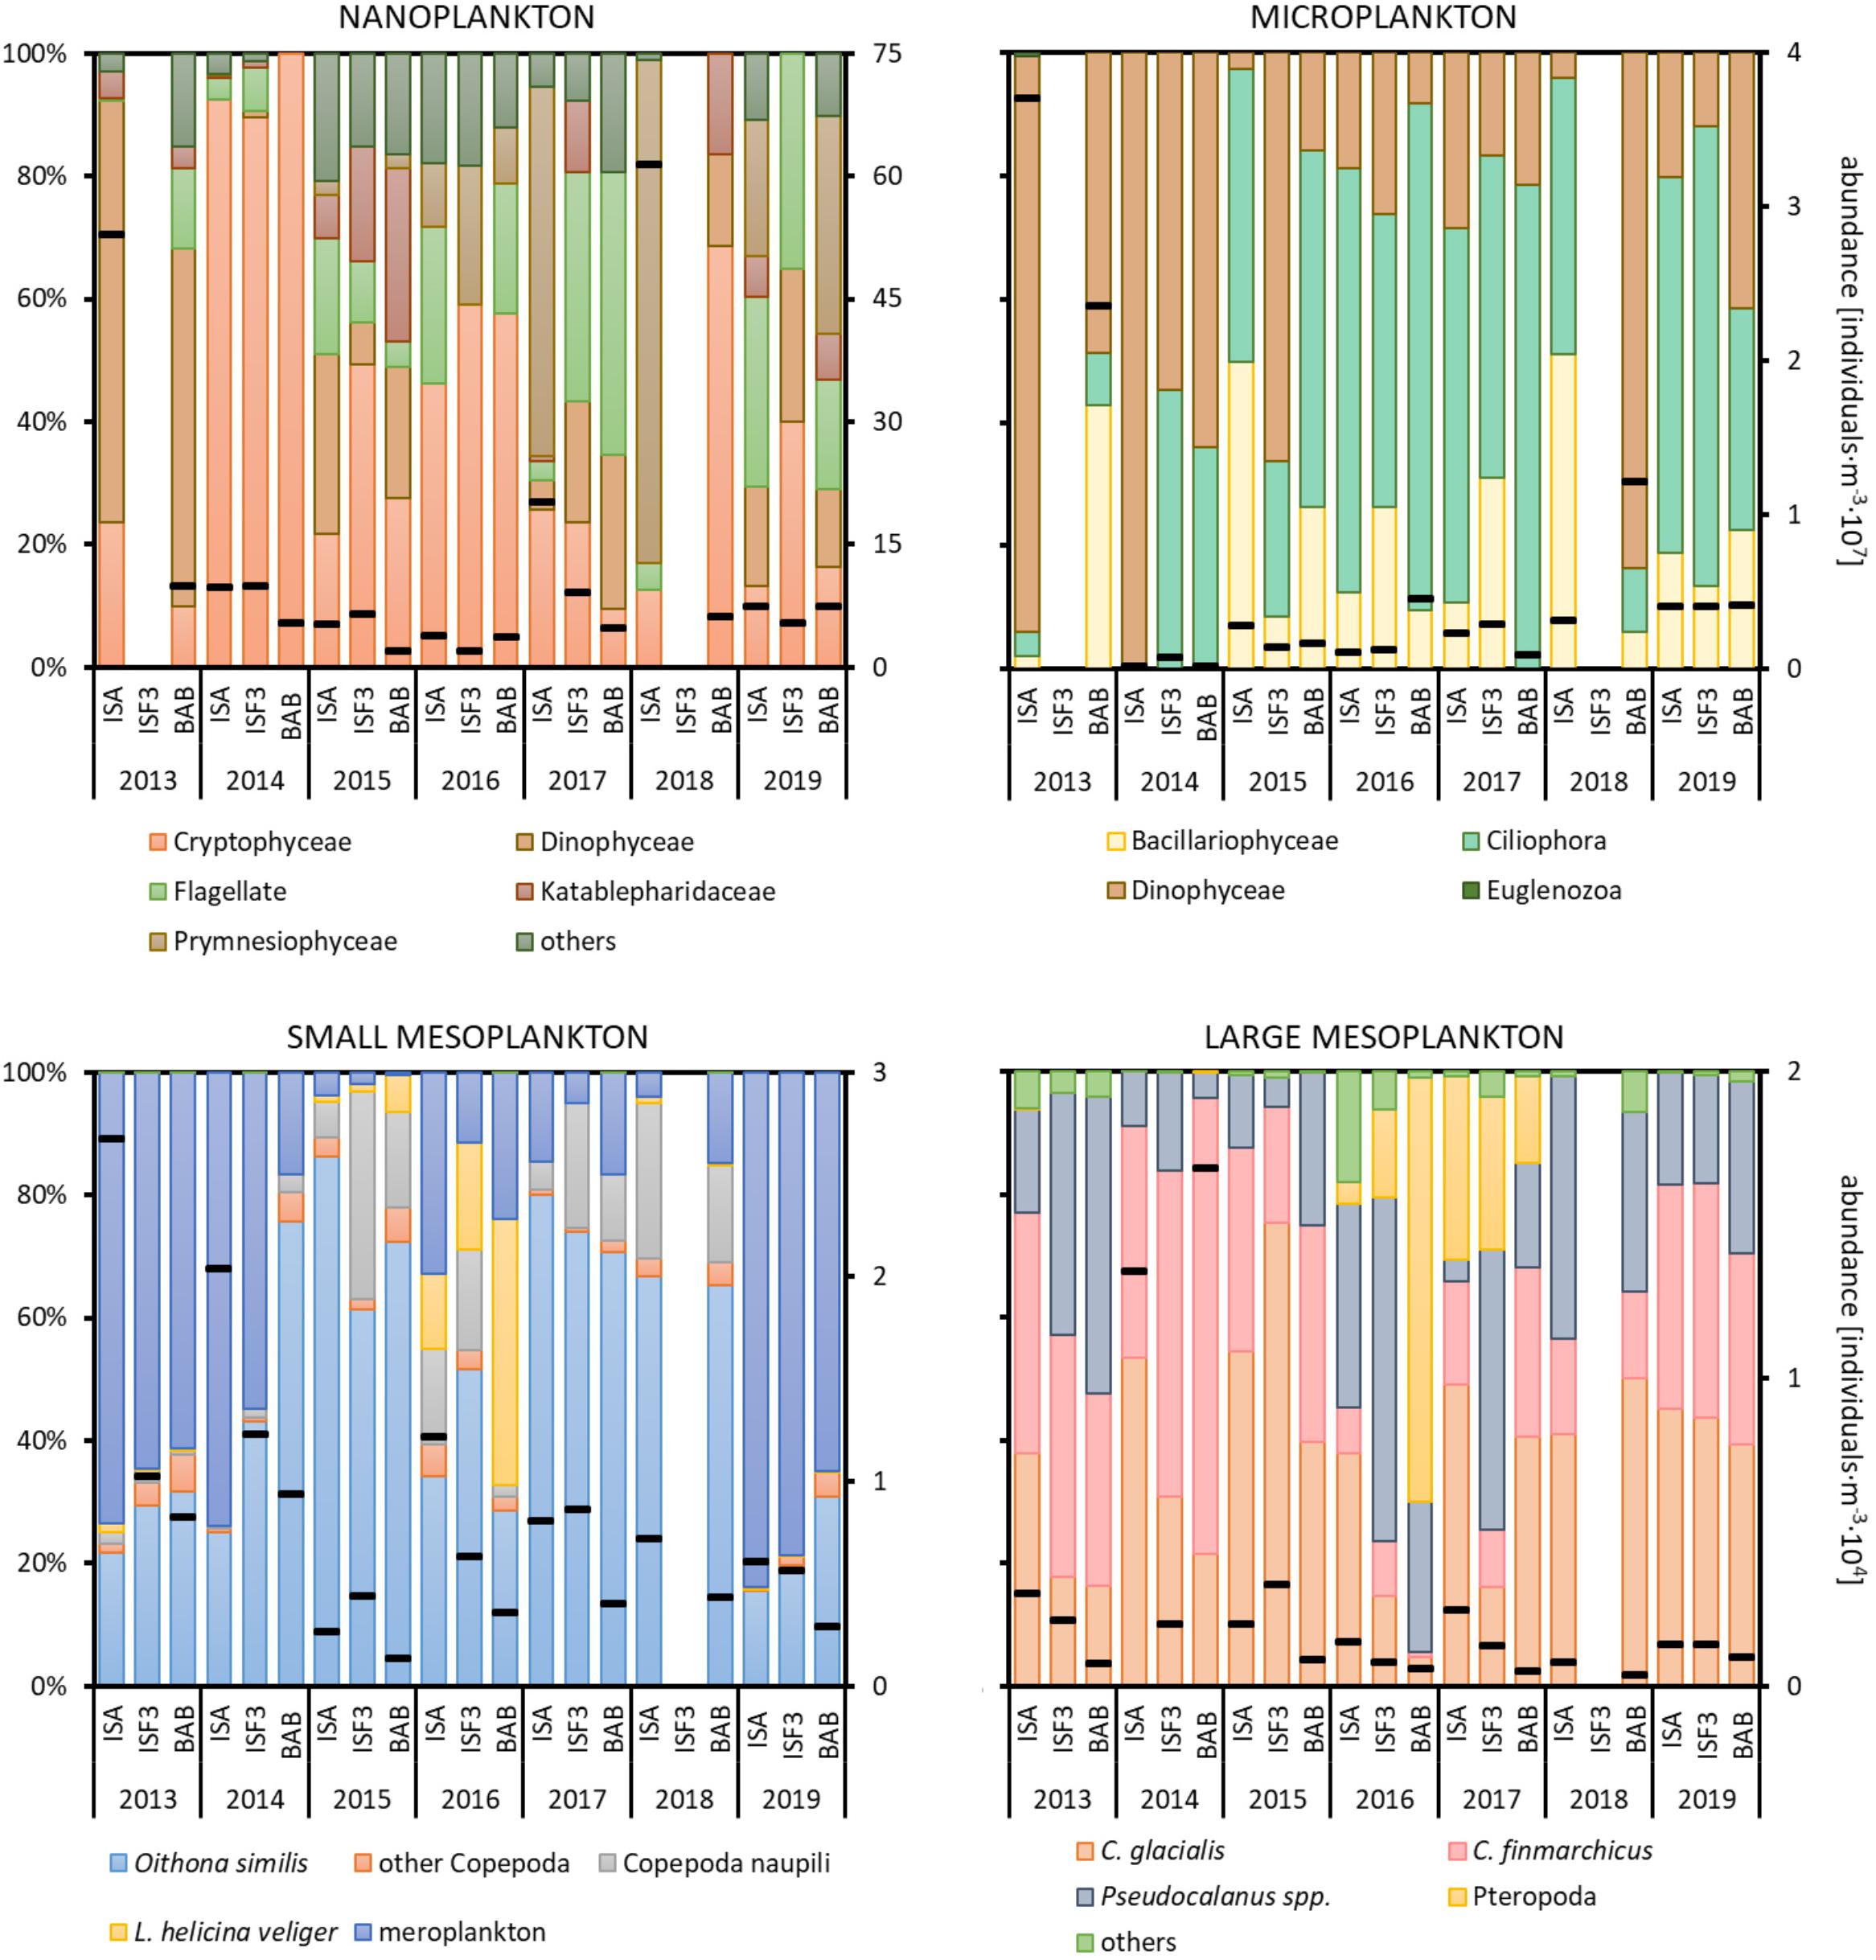
Figure 4. Abundance (black dashes) of various plankton size fractions (individuals⋅m–3) and relative abundances (%) of the major taxonomic groups at three Isfjorden stations: ISA, ISF3 and BAB in seven consecutive mid-summers (2013–2019). Data for protists at ISF3 station were not collected in 2013 and 2018, whereas for zooplankton in 2018. Note different scales for size fractions.
The small mesoplankton fraction was primarily represented by Oithona similis (15–82% of the total abundance) throughout the entire study period (Figure 4). In addition to typical planktonic organisms, larval stages of benthic organisms (Bivalvia, Polychaeta, and Echinodermata) were also abundant, especially in 2013, 2014, and 2019. Their abundance was the highest at the ISA station and the lowest at the BAB station in most of the investigated mid-summers. Veligers of Limacina helicina were observed each year with abundance peak in 2016. High densities of juveniles of L. helicina (marked in yellow as Pteropoda in Figure 4 – large mesoplankton) were found in 2016 and 2017 at all investigated stations. In 2015–2018, a significant number of Copepoda nauplii was also observed. The large mesoplankton fraction was characterized by the domination of both Calanus species with prevailing C. finmarchicus in 2013 and 2014 and C. glacialis in 2015. In 2014 older life stages (CIV–CVI) of C. glacialis were especially abundant, but due to high overall abundance of L mesoplankton their relative role was similar to other years.
Taxonomic composition of protists and zooplankton was characterized by large temporal (between 2013 and 2019) and spatial (among ISA, ISF3, and BAB stations) variations. The species composition of the nano- fraction differed between stations especially in 2014, 2018, and 2019 (Figure 5). Non-metric MDS scaling (Figure 5) showed that microplanktonic community composition was clearly separated at ISA station in 2013 and 2014 (due to the overwhelming dominance of Dinophycae). Even though the differences in the detailed nano- and microplankton species composition between years and stations were tremendous, no significant differences were assigned to coarse taxonomical grouping (a few dominating categories presented in Figure 4) used for non-metric MDS scaling and data analyses (Table 1). The most year-specific taxonomic composition was found for the small meso- fraction (Figure 5 and Table 1), whereas the composition of the large meso- fraction was relatively similar between 2016 and 2017, but different in other years (due to the prominent presence of pteropods). Abundance of the taxonomical groups within small and large mesoplankton differed more among various years than among stations (Figure 5 and Table 1).
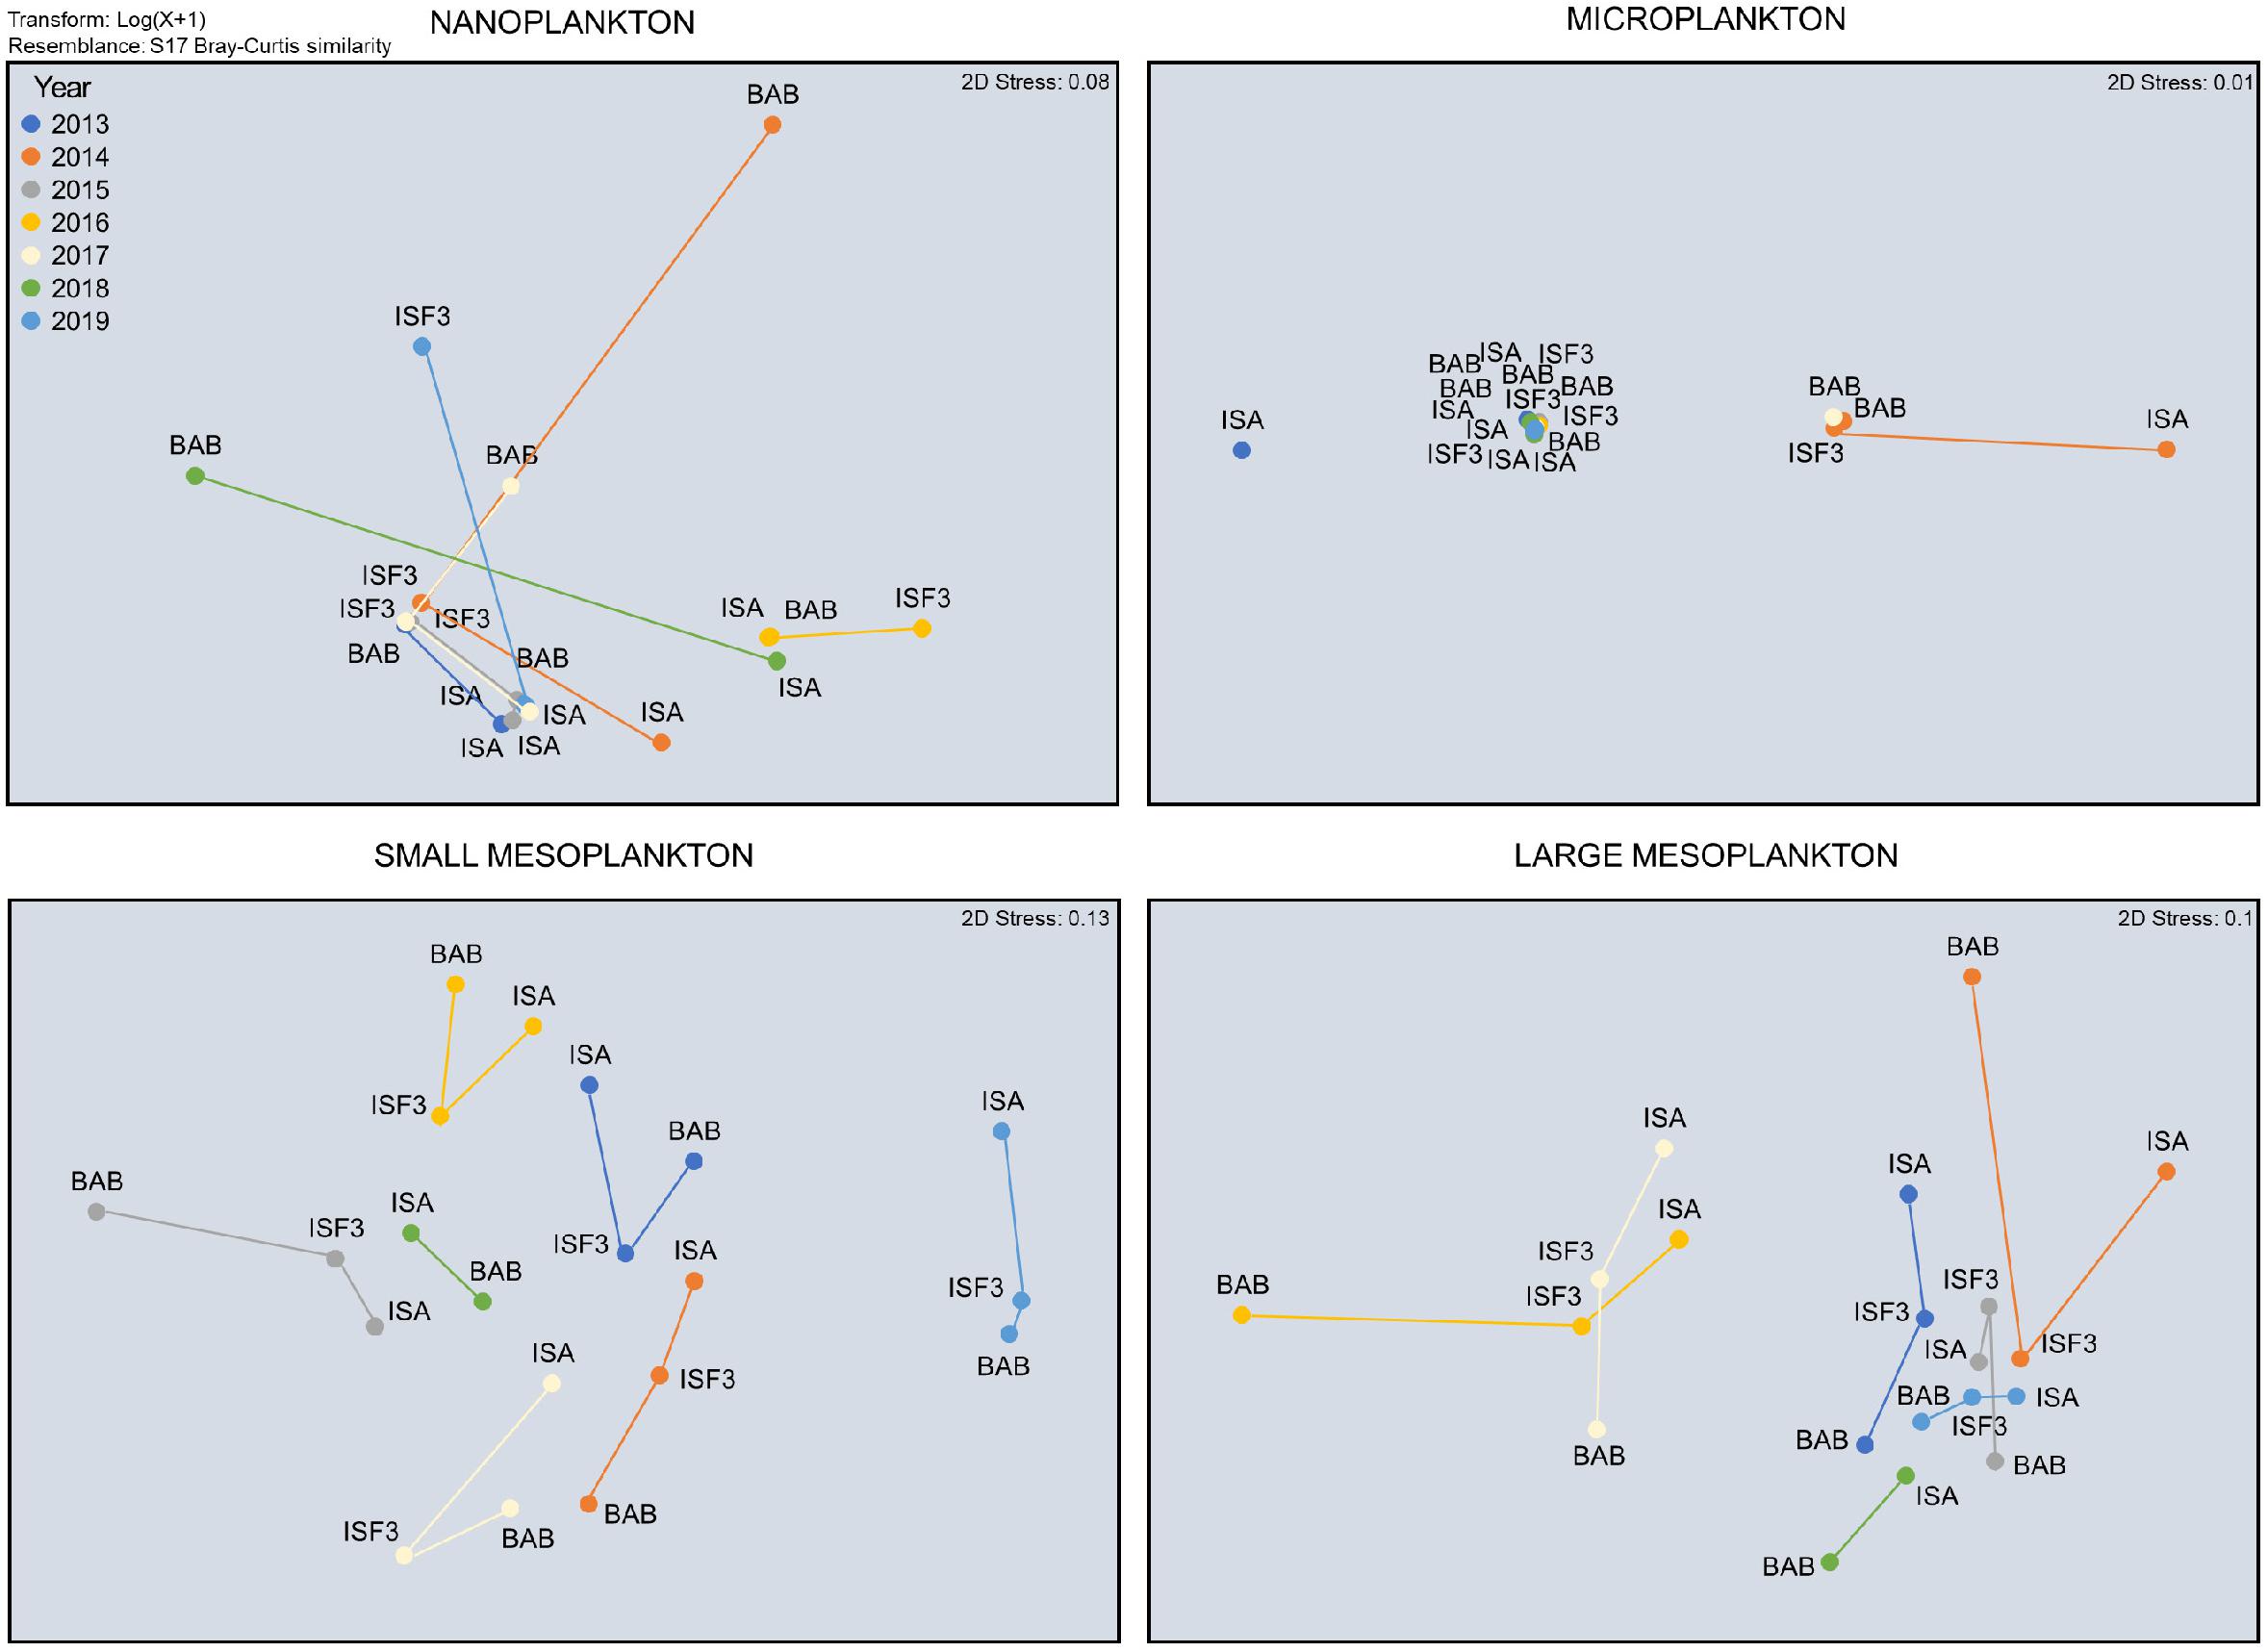
Figure 5. Non-metric MDS scaling of Bray–Curtis resemblance of the composition of dominating taxonomical groups within particular plankton size fractions.
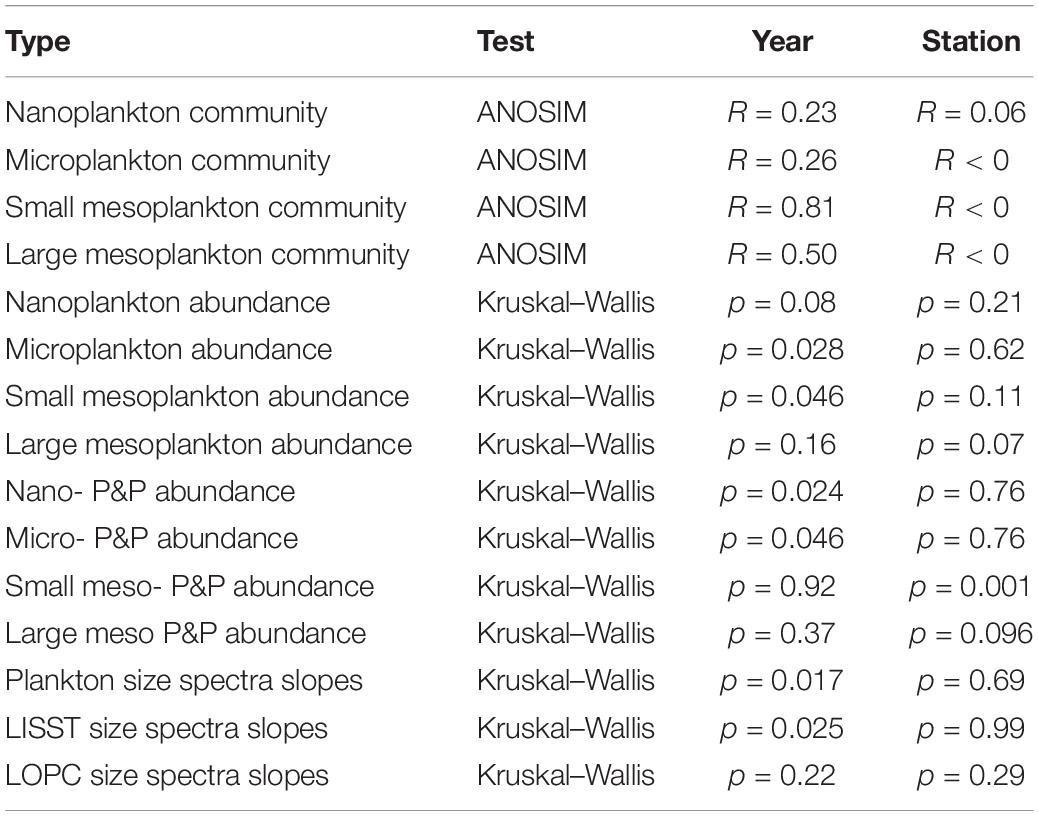
Table 1. The results of ANOSIM and Kruskal–Wallis tests provided for all plankton size fractions and studied years/stations together with the slopes of plankton size spectra derived from LISST and LOPC.
Shares of Various Plankton Size Fractions in Total Abundance
The shares of various plankton size fractions (%) differed more between years (Supplementary Figure S1, slopes in Table 1) than among stations. At the BAB station the share of microplankton was higher than at the ISA station in 2013, 2016, and 2018, whereas the lowest across all the stations ratio between micro- to nanoplankton was observed in 2014 and 2017. The exceptionally high (>25%) importance of large in relation to small mesoplankton was observed in 2014, 2015, and 2019. In general, the ratio between larger size fraction and smaller size fraction (micro- vs. nano-, large- vs. small-) was higher in dataset comprising plankton than in laser-based measurements of P&P (Supplementary Figure S1). The abundance of both plankton and P&P decreased from the smallest to the largest size fractions studied (Figures 6A,B). The slopes obtained for plankton at each station and year investigated separately ranged from around −2.5 to −4.7, but mostly oscillated around −3 (Figure 6C). The slightly increasing trend of the size spectra slopes toward steepness (i.e., the increasing role of smaller fractions) was observed between 2016 through 2017 to 2018 (Figure 6C). The variability in the slopes was the highest at the ISA station and the lowest at the ISF3 station with only one exception in 2013 (−4.7) (Figure 6D). The BAB station was characterized by rather low variability, except in 2014 (−2.5), but also characterized by more steeper size spectra slopes in comparison with ISF3 station (implying higher contribution of the smallest fractions). Due to the methodological issues discussed below, we could not obtain a smooth transition between the results provided by the two laser-based instruments and thus we decided to consider them separately (Figure 6B). The steeper slope was observed for LOPC measurements and ranged from around −5.4 at the ISA station to −6.09 at the ISF3 station. For LISST measurements the slopes were very similar between stations (around −4), but differed significantly among years (Table 1).
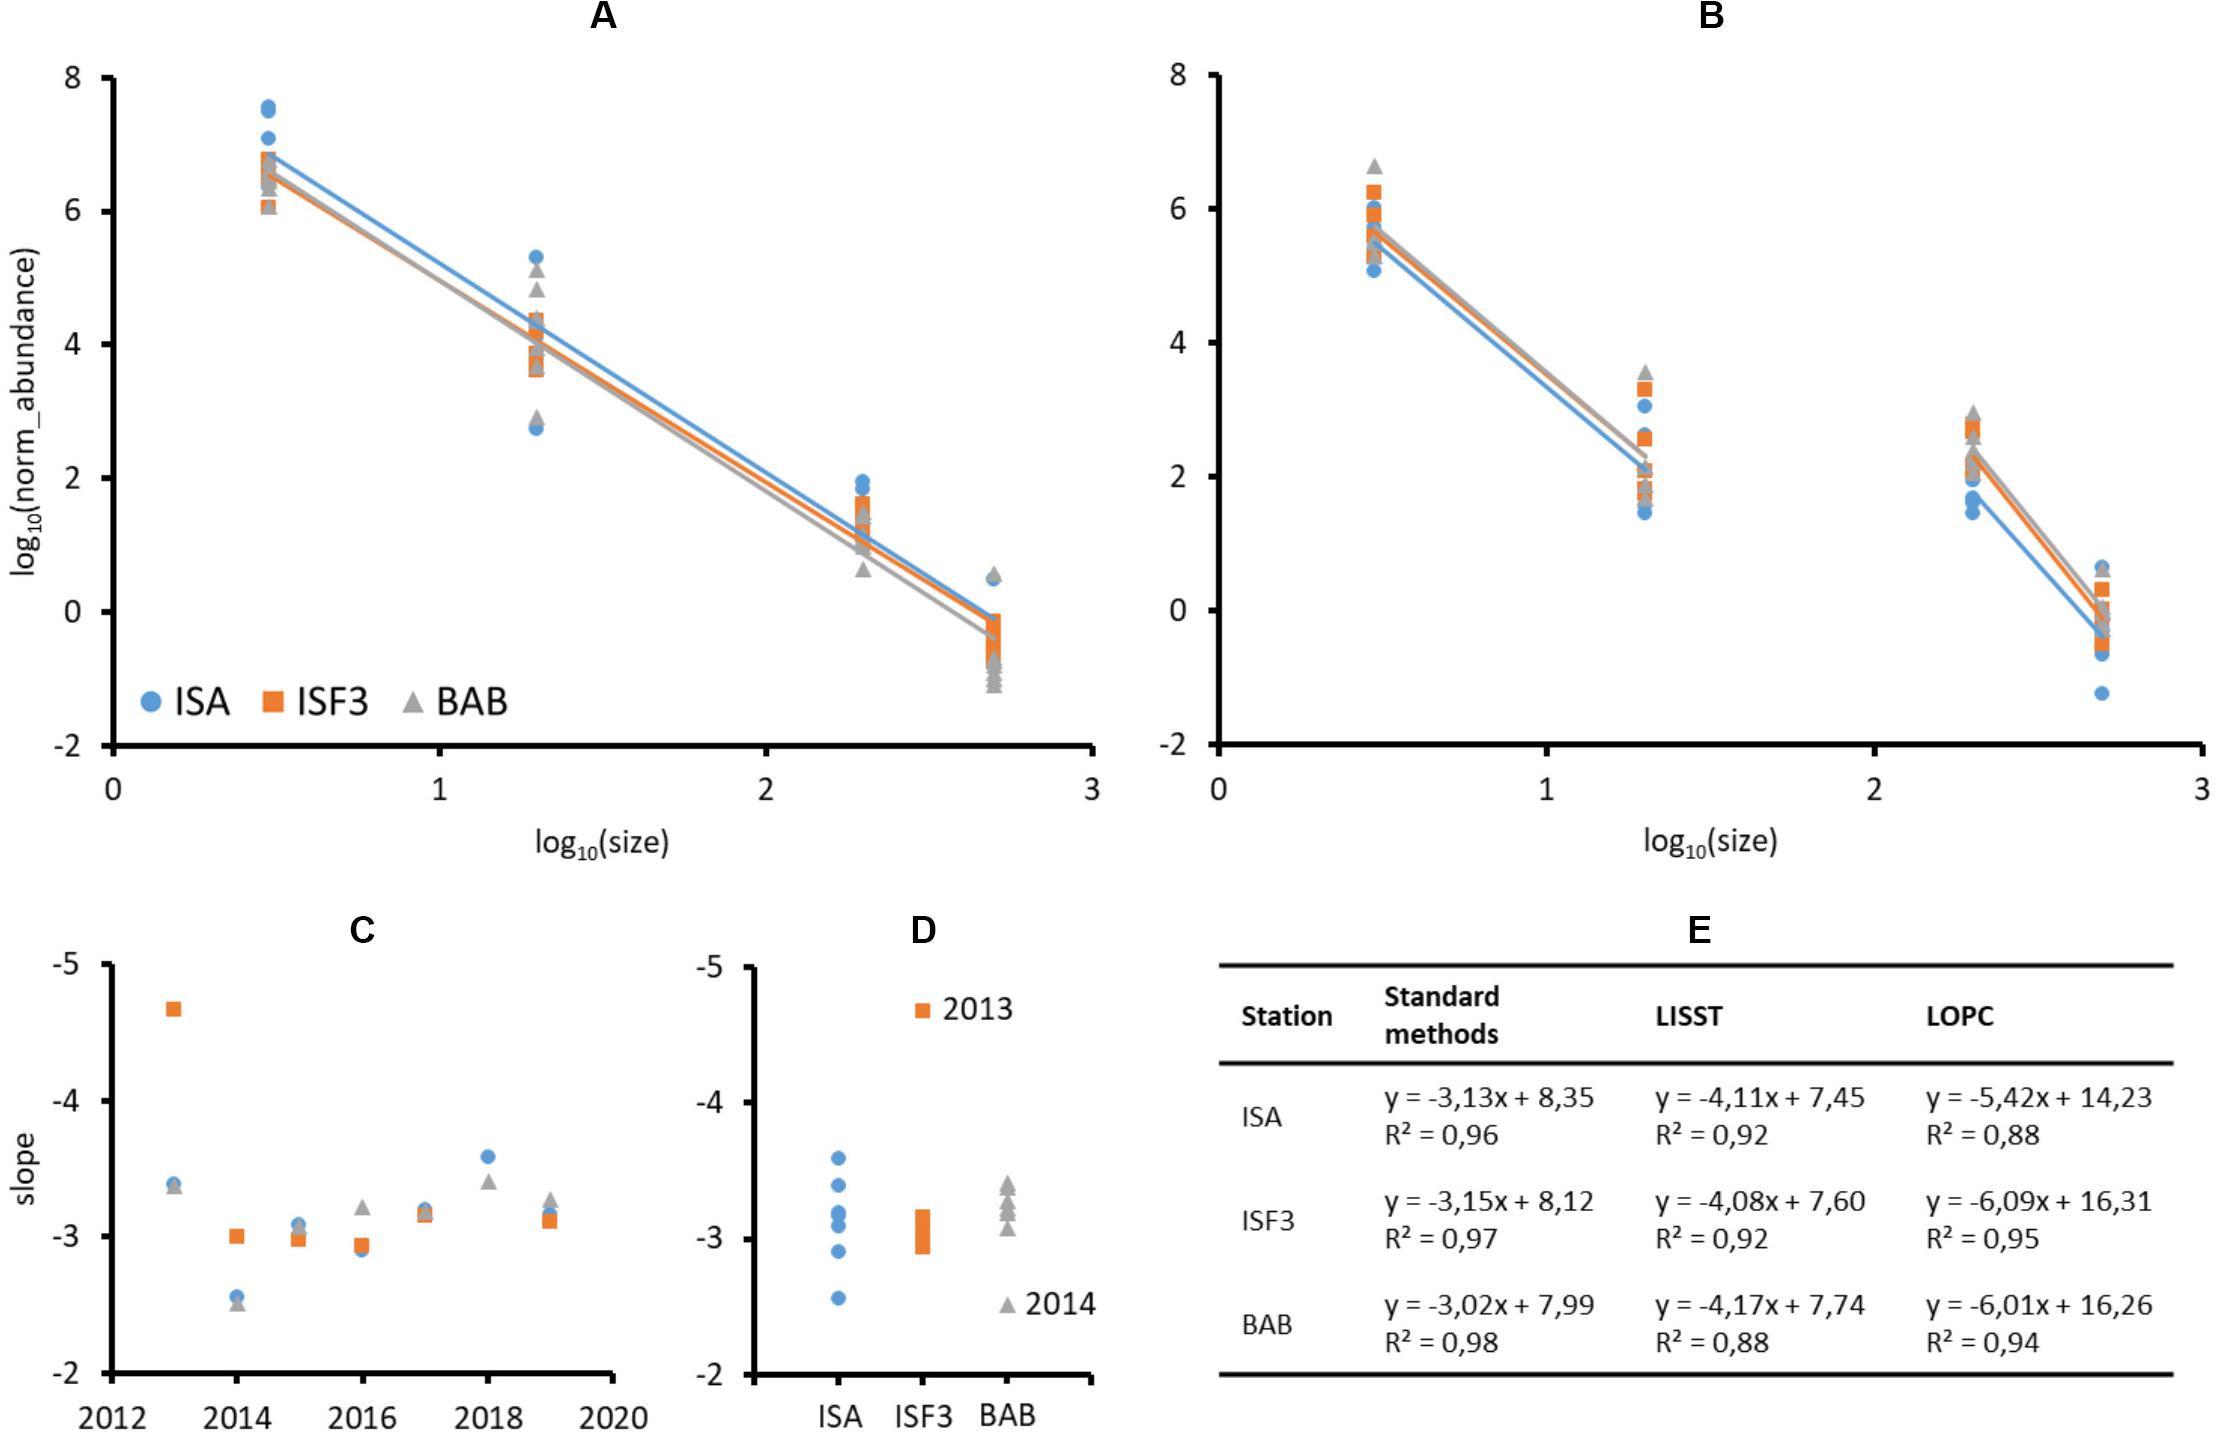
Figure 6. Log-transformed normalized abundances of plankton (A) and P&P (B) size fractions (individuals⋅m–3 and counts⋅m–3) at three Isfjorden stations: ISA, ISF3, and BAB in seven consecutive mid-summers (2013–2019). Slopes of the number spectrum fitted to plankton concentrations over years (C) and stations (D). Table of linear fit equations and R-squared values obtained for standard methods and laser-based measurements of plankton and P&P abundance (E).
Regional Comparison Between Standard (Plankton) and Laser-Based (P&P) Abundance Estimates
In general, higher abundance of planktonic organisms was observed at the ISA station and lower at the BAB station, while opposite pattern was noted for P&P (Figure 7). This gradient was especially well-pronounced for small mesoplankton fraction (Kruskal–Wallis chi-squared = 13.318, df = 2, p-value = 0.001282), but was also visible for nano- and large meso- fractions. The concentrations measured by LISST were lower than the abundance of the corresponding size fractions of protists collected by standard plankton sampling. The abundances of nano- and micro- fractions assessed by the laser counter did not differ significantly among the stations, while slightly decreasing gradient (from ISA toward BAB) was observed in the abundance of nanoplankton concentrations. Abundance of zooplankton was usually lower than the concentrations of the corresponding size fractions derived from LOPC measurements, with the exception of large meso- fraction at ISA station, where the similar ranges of concentrations were assessed by both methodological approaches. Moreover, the gradient between stations could be observed in the form of decreasing number of small and large mesoplankton along with the increasing number of particles toward BAB station. What is worth noting, the difference between concentrations estimated by the LOPC measurements and zooplankton concentrations estimated from net samples was the highest at BAB station.
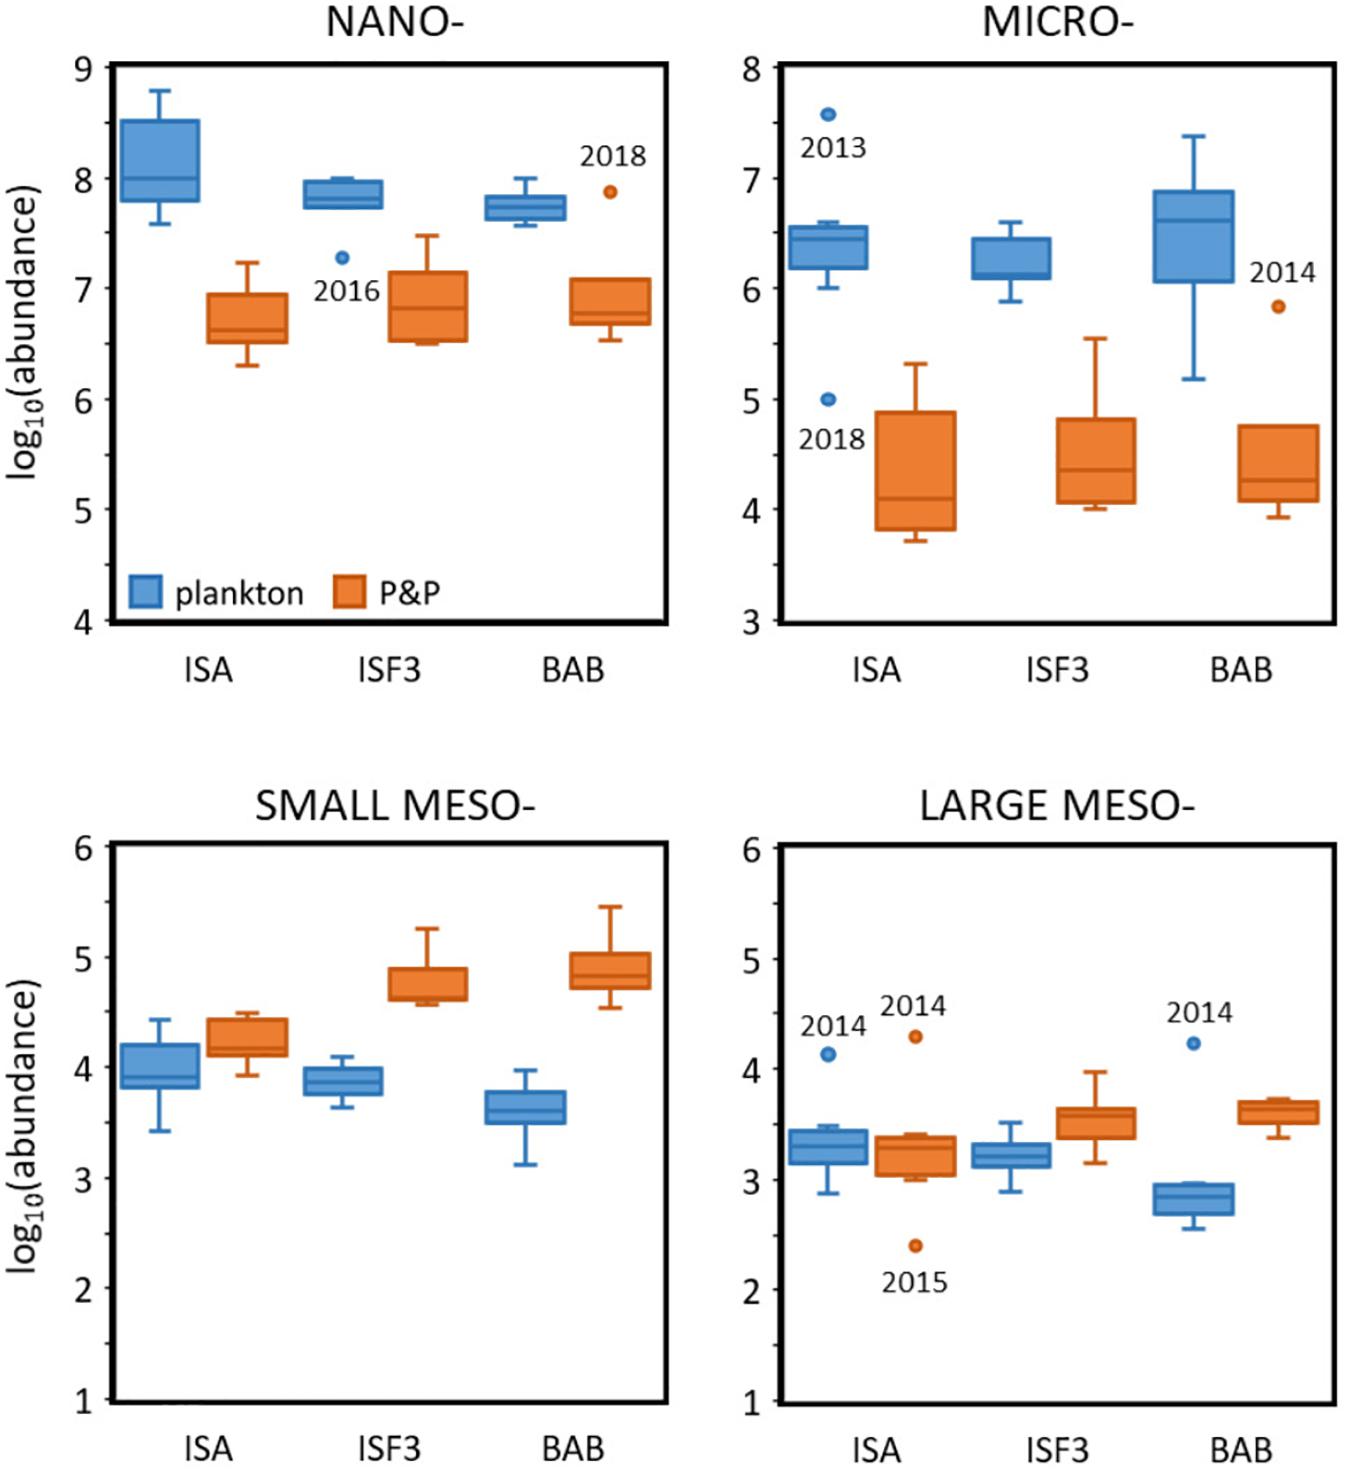
Figure 7. Log-transformed abundances (individuals⋅m–3 and counts⋅m–3) of plankton (blue) and P&P (orange) within four analyzed size fractions at three Isfjorden stations: ISA, ISF3 and BAB in seven consecutive mid-summers (2013–2019). The start (the lower quartile) and the end of the box (the upper quartile) represent 25% and 75% of the data, respectively. The line in the box represents the median value. The whiskers are defined as 1.5 times the inter-quartile range. Anything outside the whiskers is considered as an outlier (dots).
Discussion
Environmental Gradients and Their Influence on P&P Distribution
The inflow of freshwater from the glacier in the inner part of the Billefjorden induced strong physical gradients of temperature and salinity along the investigated transect and triggered substantial, typical for summer stratification of the water column (Hop et al., 2002; Cottier et al., 2010). The observed vertical environmental gradients and eddies as well as stratification reflected by the Brunt–Väisälä frequency squared, N2 (Figure 2), enhanced either layered or patchy distribution pattern of P&P, similarly as was shown in several previous studies (Dekshenieks et al., 2001; Möller et al., 2012; Trudnowska et al., 2016). In this study a sharp decrease in P&P numbers with depth was observed in the case of nano- and micro- size fractions of P&P, which were concentrated in the upper 20–30 m depth layer. It seems to be a common pattern observed in various marine environments (e.g., Jackson and Checkley, 2011; Gluchowska et al., 2017b). Such a distribution of the two smallest fractions of P&P could be caused by either the fact that they were entrapped by the stratification gradient or that they were concentrated close to the surface due to the better light conditions for photosynthesis, as their distribution corresponded well with peaks in fluorescence of chlorophyll a in the surface water layer (Figures 2, 3). Even though the averaged concentrations of nano- and micro- fractions in the 50 m water column did not differ significantly among the stations along the transect (Figure 7), they most likely were of diverse origin. We concluded that in the central part of the Isfjorden there was a high number of primary producers in the surface water layer (down to around 20 m depth), whereas in the Billefjorden the presence of numerous fine inorganic sediments within the whole 50 m water column strongly contributed to the overall abundance of these size fractions. It was evident in 2015, 2016, and 2019 due to the diminishing signal of chlorophyll a fluorescence toward innermost part of the section. The low salinity at the surface – a sign of freshwater discharge with suspended sediments – is associated with an increase in the turbidity of the upper water layer. The high particles loads result in substantial light absorption and consequently reduction of the vertical extent of the euphotic zone (Weslawski et al., 1995; Keck et al., 1999) as was observed in the glacial bay in Billefjorden.
Contrary to the smaller size fractions, we observed well-pronounced gradual increase in number of two meso- fractions of P&P from ISA toward BAB station (Figures 3, 7). It was associated with the opposite trend for planktonic organisms, whose concentrations were generally higher at ISA station and gradually decreased toward the innermost BAB station (Figures 4, 7). The similar horizontal gradient of dominance of zooplankton in relation to marine aggregates concentrations was previously followed along the Hornsund fjord axis and was clearly coupled with hydrographical differences between the outer and innermost parts of the fjord (Trudnowska et al., 2014). The increased number of particles at BAB station within small meso- fraction was probably caused by the same phenomena as recently observed in other fjords, where the glacier meltwater discharge led to increase in the abundance of small and amorphous particles (Trudnowska et al., 2014, 2020a). We also observed lower abundance of larvae of benthic organisms (meroplankton in Figure 4) in Billefjorden than outside the Adventfjorden in most of the investigated mid-summers. The survey on benthic communities in an Arctic glacier-fed river estuary in Adventfjorden showed that they are sensitive to sediment instabilities and physical disturbance caused by high sedimentation and frequent sediment gravity flows (Włodarska-Kowalczuk et al., 2007). In 2018 the patches of P&P were spreading along the whole water column and most probably they consisted of sea-bottom sediments resuspended by storm-induced wave action (Zajączkowski and Włodarska-Kowalczuk, 2007). The influence of bottom sediments on the optical seawater properties after storm has been earlier observed in Svalbard coastal waters (Trudnowska et al., 2015).
The accumulation of P&P in the central part of investigated transect (ISF3) was observed by both laser-based (mainly smaller size fractions) and conventional methods (zooplankton), which suggests that a transitional zone between glacial waters and advected AW may constitute a convergence zone for P&P. We observed a specific hydrographical structure in the form of discontinuities in the temperature, salinity and fluorescence of chlorophyll a distributions at the entrance to Billefjorden (Figure 2), which was followed by the submesoscale eddies localized in the vicinity of the Gåsøyane islands in 2016–2018. The formation of eddies in the middle of investigated transect was confirmed by satellite observations (Supplementary Figure S2). It is also supported by a numerical model of barotropic tides in the western Svalbard fjords developed by Kowalik et al. (2015), which showed stronger currents in the ISF3 station area and indicated a local depression of water surface as an interesting feature of the tidal eddies. The strong tidal currents, frequently generated in the western fjords of Svalbard (modeled by Kowalik et al., 2015; Nilsen et al., 2016) are responsible for the water exchange in the shallow or narrow subdomains and can cause oscillating motion resulting in P&P entrapment within eddies, which in turn are an additional driving force of the observed patchiness, both in fjords and on the shelf (Trudnowska et al., 2016).
Even though the nano- and micro- fractions of P&P represented mostly layered distribution, both meso- fractions of P&P followed the patchy pattern. Occasionally a tight spatial coupling among peaks in abundance of particular size fractions of P&P was observed (e.g., between micro- and small meso- fractions in 2015; among nano-, micro- and small meso- fractions in 2017). Moreover, the multi-fraction patches were also observed (e.g., in 2016 and 2018, consisting of nano-, micro- and small meso-). Large meso- fraction seemed to be mostly de-coupled in space from the other fractions, which agrees with previous observation that its distribution is independent from basic environmental forcing and biological factors are thought to have a stronger influence on large mesoplankton aggregation processes (Trudnowska et al., 2016). However, it seems that when the strong physical forcing occurs, such as the mixture of storm waving and eddy activity observed in 2018, this fraction is also contributing to the multi-fraction patches. Due to the high overall variability in Isfjorden dataset, most probably caused by the interaction between active (biologically driven) and passive (forced by physical mechanisms) patchiness and seasonal dynamics of P&P in this region, which also differ depending on their origin, it is difficult to indicate specific mechanisms for matching or separation of different P&P fractions’ distribution. However, considering the fact that the larger size fractions of P&P tended to occur slightly deeper in the water column than the smaller ones, they were most likely formed in the process of physical coagulation (McCave, 1984; Jackson, 1990) and/or flocculation of smaller P&P, which is especially intensified by freshwater supply (Zajączkowski and Włodarska-Kowalczuk, 2007; Trudnowska et al., 2020a). The biological process enhancing formation of larger particles with higher sinking velocities is the presence of mucilaginous colonies of phytoplankton, which due to their increased sugar-driven strictness play a ‘cleaning’ role when passing through the water column. Also zooplankton activity (e.g., grazing) may produce large sinking particles in form of the fecal pellets, molts and dead bodies (Sheldon et al., 1972; Alldredge and Silver, 1988). In addition, many ecological traits such as niche portioning, predator avoidance, population abundance, growth rate and productivity of zooplankton are also responsible for the diverse spatial patterns of P&P (Simon et al., 2002; Norrbin et al., 2009; Lalande et al., 2011).
The Inter-Annual Variability in the Taxonomic Composition of Various Plankton Size Fractions
The observed mid-summer protists community structure (Figure 4) was typical for the West Spitsbergen waters (e.g., Piwosz et al., 2009; Hodal et al., 2012; Kubiszyn et al., 2014, 2017). It was characterized by the domination of nanoplanktonic flagellates (especially Dinophyceae and Cryptophyceae), as well as microplanktonic Ciliophora, which, due to active movement ability and a number of nutrition modes, are well adapted to live in turbid fjord waters. The abundances of nano- and microplankton were at a similar level throughout the observational period, except for much higher values of both size fractions recorded in 2013 and 2018. In 2013, it was represented primarily by highly numerous Dinophyceae (mainly Gymnodinium of size 5–20 μm), which constitutes an almost year-round component of the West Spitsbergen plankton (Kubiszyn et al., 2017). Unfortunately, due to the plasticity of the naked (athecate) Gymnodinium cells and the susceptibility to fixation, most of the taxa are usually (also in the presented study) identified only to the genus level in the light microscopy, by what the determination of their contribution to the total primary production is largely unknown. Due to the fact that most of the protists are mixotrophic and the mode of nutrition of some of them could not be specified, it was not possible to infer about the decrease in primary producers in glacier-influenced waters based on the species composition. In 2018, the exceptionally high nanoplankton abundance was related mainly to the presence of the prymnesiophyte P. pouchetii, and most likely resulted from advection of the community along with the AW. The high numbers of P. pouchetii at the ISA station were observed, inter alia, by Kubiszyn et al. (2017) during spring 2012, after the strong inflow of AW to the shelf. According to recent studies, Phaeocystis cells are affiliated with AW (Metfies et al., 2016). However, this species has been regularly noted in the European Arctic waters. Moreover, it is commonly believed that the increase in abundance of small pico- and nanoplankton species in the last two decades is directly related to the warm anomaly in the Fram Strait (Nöthig et al., 2015).
The small mesoplankton was dominated by O. similis, which is one of the most abundant mesozooplankton species in the sub-Arctic and Arctic regions (Auel and Hagen, 2002; Hopcroft et al., 2005; Daase and Eiane, 2007; Madsen et al., 2008; Gluchowska et al., 2016), but often underestimated in standard mesozooplankton studies basing on sampling with plankton net with 180 or 200 um mesh size. Thus, in the current investigation, we took an advantage to assess the whole copepodite structure of this species by using WP2 net with 100 μm mesh size. Dominance of this cyclopoid occurred in years 2014 and 2017. It was probably due to the intensified advection of AW since O. similis is the most abundant zooplankton transported with the West Spitsbergen Current (Weydmann et al., 2014; Gluchowska et al., 2017a, b) which strongly reshapes the zooplankton size structure (Trudnowska et al., 2020b). Substantially higher abundance of O. similis in 2014 noted at BAB sampling station indicates that the strong advection of AW in this year reached even the innermost parts of Isfjorden. It is consistent with the CTD profiles from this survey, which showed the presence of warmer and more saline waters in 2014 in Isfjorden than in the remaining years. Studies from another west Spitsbergen fjord - Hornsund showed that in the summer of 2014 AW was observed for the first time in its main basin and even in Brepollen – the innermost glacial bay (Promińska et al., 2018). In this study, the main contributors to the abundance of large meso- fraction were Calanus copepods, which represent the key element of zooplankton communities in Svalbard fjords (Scott et al., 2000; Weslawski et al., 2000; Hop et al., 2002; Kwasniewski et al., 2003) and are of major importance in the Arctic food web (Falk-Petersen et al., 1987, 2002; Scott et al., 1999) due to both their high abundance and high lipid content. A similar pattern in abundance peaks were observed for C. finmarchicus as for O. similis, since both species are typically advected to the region with AW (Wassmann et al., 2015, 2019; Basedow et al., 2018). Because of the smaller individual size of the local population of C. glacialis in Billefjorden (Gabrielsen et al., 2012), the distinction between the two species has to be interpreted with caution. However, the coexistence of these two Calanus species in Billefjorden is year-round, despite the lower survival rate of C. finmarchicus (Arnkværn et al., 2005). Large meso- fraction represented mainly by Calanus spp., which was shown to gather during summer in the surface 20 m water layer either in high (2014, 2015, 2017, and 2019) or low concentrations (2013, 2016, and 2018), suggests oscillation of stronger or weaker advection of AW, respectively (Figure 3).
Apart from numerically dominating copepods (Oithona spp. and Calanus spp.), also pteropods have been found to be significant zooplanktonic group in this study. In 2015 and 2016 we noted high numbers of L. helicina veligers (small mesoplankton in Figure 4), whereas in 2016 and 2017 there was a high abundance of L. helicina post-larval stages (large mesoplankton in Figure 4). Since pteropods have their main seasonal abundance peaks in the late summer and/or early autumn (Lischka and Hagen, 2016; Wiedmann et al., 2016), the current results suggest that seasonal development of zooplankton in Isfjorden was the most advanced in 2015–2017. In a year-round study carried out in Adventfjorden Stübner et al. (2016) detected the higher abundances of juvenile Pteropoda in the early August 2012. In this study the samples were collected in the first half of August in 2015–2018, whereas in 2013, 2014, and 2019 at the end of July. Our results demonstrated that even such small changes in sampling dates as several days (up to 3 weeks) could result in domination of different compositional state of zooplankton as the shifts between peaks of pteropods in 2016 and 2017 and meroplankton in 2013, 2014, and 2019. Potentially, it could affect the observed mid-summer protist community structure as many benthic invertebrate larvae are at their peak abundance in the water column during the summer (Kuklinski et al., 2013) and rely largely on the protist food base (Maloy et al., 2013). Also, the high abundance of Copepoda nauplii in 2015–2018 have been most probably caused by the fact that the present study was not performed at exactly the same time of the summer. Due to the high inter-annual variability in taxonomic structure and abundance of protists and zooplankton in comparison to less pronounced differences between stations, which was illustrated by non-metric MDS scaling, we concluded that large-scale processes and natural seasonal changes had stronger influence on the plankton communities than local factors.
Standard vs. Laser-Based Approach
A size is an important property of P&P affecting their concentration and multiple physical, biogeochemical and ecological traits such as settling speed, coagulation rate, consumption and/or trophic relationships. Thus, it is a convenient ecological indicator that merges many co-varying traits. The typical, negative relation between plankton size and concentrations was observed, with nano- fraction being on average two orders of magnitude more abundant than micro- fraction, which in turn was from two to three orders of magnitude more abundant than mesoplankton. Similarly, small mesoplankton was a few times more abundant than large meso- fraction (Figure 6A and Supplementary Figure S1). Laser counts showed similar trend for the smallest fractions (nano- two to three orders of magnitude more abundant than micro-), but the numbers of P&P in micro- fraction were only slightly higher than in both meso- fractions combined (Figure 6B and Supplementary Figure S1). The relations between particular size fractions, assessed by the slopes to their size spectra linear fitting, did not differ among stations (Figure 6D), but varied among years in the case of plankton (Figure 6C) and the smallest P&P fraction (assessed via LISST). This suggests that seasonal differences in pulses of specific plankton taxa may cause some deviations from theoretical striking regularity of body size distributions within aquatic systems (Platt and Denman, 1978; Stemmann et al., 2008). We conclude that the lack of smooth transition from nano- and micro- to the meso- fractions (Figure 6B) was due to the fact that the measurements of LISST and LOPC are based on a different physical property (LISST uses light scattering, whereas LOPC detection is based on light attenuation), which results in their different sensitivity to mineral vs. organic material. Thus, we decided to analyze and interpret the results from these two devices separately. Moreover, the differences between abundance of plankton estimates derived from standard and laser-based approaches showed that abundances of protists were generally higher than those provided for small P&P measured by LISST (Figure 7, upper). However, the protists were sampled at a few depth levels up to 50 m, while LISST continuous measurements were averaged over the upper 50 m layer. In case of zooplankton, the net catches were either equal (ISA station) or lower (BAB and ISF3 stations) to those detected by LOPC (Figure 7, bottom). This discrepancy in numbers of P&P can partially be explained by the smaller seawater volume sampled by the lasers compared to standard methods. However, according to previous data the difference between zooplankton abundance and LOPC measurements is mainly attributed to fragile aggregates and detritus that are often not analyzed in net catches, but also disaggregated by the net passage and thus not correctly sampled (e.g., González-Quirós and Checkley, 2006). This was the case especially at the BAB station, where the glacier runoff resulted in an increase of small and amorphous particles in the water column (this study), similarly as in other Svalbard glacial bay (Trudnowska et al., 2014, 2020a). However, their role is still seriously underestimated because the marine snow aggregates are so fragile that they can only be observed in situ in undisturbed water.
Even though the high resolution measurements of all particles suspended in sampled seawater (Sprules and Barth, 2016) have important advantages, traditional plankton sampling followed by taxonomic analysis is still necessary to recognize living and non-living components of the pelagic environment. By combining these two approaches we were able to show that most of the particles counted by LOPC included biological components (i.e., zooplankton) in the central part of Isfjorden, but suspended matter from a river (Schultes and Lopes, 2009) or a glacier plume (Trudnowska et al., 2014) in Billefjorden was also incorporated. The estimates dealing with the real contribution of plankton and other biota to the overall content of Spitsbergen fjordic waters are lacking, even though the substantial role of marine aggregates in the overall P&P biomass was previously recorded in Hornsund fjord (Trudnowska et al., 2014) as well as in Fram Strait and along West Spitsbergen Shelf (Trudnowska et al., 2018). Furthermore, Sagan and Darecki (2018) have examined a level of correlation between light attenuation at 676 nm and simultaneously measured size fractioned particle content with LISST, in attempt to confer mineral to organic particle proportions between Hornsund and Kongsfjorden waters. This successful combination of independent methods of observation has shown that ‘Atlantification’ observed in Kongsjorden yielded highest proportion of organic suspensions over the Hornsund waters, while the two fjords are equally under the influence of glacier’s meltwater. However, so far only a few studies took an effort to distinguish between plankton and non-living particles by analysis of their optical properties obtained from automatic devices (Mikkelsen et al., 2005; Stemmann et al., 2008; Jackson and Checkley, 2011; Forest et al., 2012).
Conclusions
1. The environmental gradient, imposed by the advection of saline waters of Atlantic origin to the central part of Isfjorden and turbid freshwater discharge from the glacier in the inner fjord, was consistent among studied years. Together with vertical water stratification and signals of eddies it was forcing either layered (nano- and micro- fractions) or patchy (meso- fractions) distribution of P&P.
2. The nano- and micro- fractions of P&P were mostly confined to the upper water layer and their distribution was interrelated with the highest fluorescence of chlorophyll a. Even though their concentrations did not differ significantly between the stations, they most likely were of diverse origin (i.e., primary producers in the central part of Isfjorden vs. fine inorganic particles in the glacial bay).
3. Increasing amount of both meso- fractions of P&P from AW (ISA) toward glacial-influenced turbid waters (BAB) with simultaneous decrease in the zooplankton abundance from the central part of Isfjorden to the glacial bay was observed.
4. Many patches of P&P were observed as ‘multi-fractionated,’ i.e., the peak concentrations of various size fractions were well matched regarding the position in the water column, while some concentration peaks were located independently for individual size fractions, with large meso- fraction being the most self-governing P&P fraction.
5. Despite the conservative dominants, subtle changes in plankton composition structure were mostly year-specific., e.g., years with the intensified advection of AW were characterized by increased share of P. pouchetii and O. similis, while years with slightly later sampling dates were characterized by higher contribution of pteropods and benthic larvae.
6. The relations between particular size fractions, assessed by the size spectra slopes, did not differ among stations, but varied among years in the case of plankton and the smallest P&P fractions. The observed inter-station differences in LOPC measurements point toward notable contribution of marine aggregates to total P&P counts in the glacial bay in the Billefjorden.
7. The compatibility between concentrations of zooplankton obtained by traditional nets and optical method (LOPC) in central part of Isfjorden proves the usefulness of this laser counter to map fine-scale zooplankton distribution in clear seawaters in contrast to glacial-influenced waters where the misalignment in concentrations (significantly higher recorded by LOPC) was a common feature.
Data Availability Statement
The datasets generated for this study are available on request to the corresponding author.
Author Contributions
MS analyzed the data, prepared the original draft and most of the figures. ET analyzed the laser-based measurements derived from LOPC and then integrated them with LISST data, prepared part of the figures and statistical analysis, and designed the concept of this study. KB-S acquired the funding, designed the field campaign, and the concept of this manuscript. KB-S, AD, ET, and JW collected the samples. AD performed the chlorophyll a and protists analysis and substantially contributed to the protistan part of the manuscript. RB performed the zooplankton analysis. SS analyzed the laser-based measurements derived from LISST. All co-authors proof-read the manuscript prior to submission. All authors contributed to the article and approved the submitted version.
Funding
This study was funded by two Polish National Science Centre projects (NCN, PicMac 2013/09/B/NZ8/03365, and CoastDark 2018/29/B/NZ8/02463) and partly also by Polish Ministry of Science and Education grant (AREX Project 3547/Norway/2016/2). This survey was additionally supported by the statutory activity of the Institute of Oceanology, Polish Academy of Sciences (IO PAN).
Conflict of Interest
The authors declare that the research was conducted in the absence of any commercial or financial relationships that could be construed as a potential conflict of interest.
Acknowledgments
The authors acknowledge the captain and crew of the RV Oceania for their valuable support during field measurements.
Supplementary Material
The Supplementary Material for this article can be found online at: https://www.frontiersin.org/articles/10.3389/fmars.2020.00584/full#supplementary-material
Footnotes
- ^ http://nordicmicroalgae.org
- ^ http://mooring.ucsd.edu/software/matlab/doc/toolbox/ocean/swstate.html
References
Agrawal, Y. C., and Pottsmith, H. C. (2000). Instruments for particle size and settling velocity observations in sediment transport. Mar. Geol. 168, 89–114. doi: 10.1016/s0025-3227(00)00044-x
Alldredge, A. L., and Silver, M. W. (1988). Characteristics, dynamics and significance of marine snow. Prog. Oceanogr. 20, 41–82. doi: 10.1016/0079-6611(88)90053-5
Anderson, M., Gorley, R. N., and Clarke, K. (2008). PERMANOVA+ for PRIMER. Guide to Software and Statistical Methods. Plymouth: PRIMER-E Ltd.
Arnkværn, G., Daase, M., and Eiane, K. (2005). Dynamics of coexisting Calanus finmarchicus, Calanus glacialis and Calanus hyperboreus populations in a high-Arctic fjord. Polar Biol. 28, 528–538. doi: 10.1007/s00300-005-0715-8
Auel, H., and Hagen, W. (2002). Mesozooplankton community structure, abundance and biomass in the central Arctic Ocean. Mar. Biol. 140, 1013–1021. doi: 10.1007/s00227-001-0775-4
Basedow, S. L., Sundfjord, A., von Appen, W.-J., Halvorsen, E., Kwasniewski, S., and Reigstad, M. (2018). Seasonal variation in transport of zooplankton into the Arctic basin through the Atlantic gateway, Fram Strait. Front. Mar. Sci. 5:194. doi: 10.3389/fmars.2018.0
Basedow, S. L., Tande, K. S., and Zhou, M. (2010). Biovolume spectrum theories applied: spatial patterns of trophic levels within a mesozooplankton community at the polar front. J. Plankton Res. 32, 1105–1119. doi: 10.1093/plankt/fbp110
Blanco, J. M., Echevarría, F., and García, C. M. (1994). Dealing with size-spectra: some conceptual and mathematical problems. Sci. Mar. 58, 17–29.
Carroll, M. L., Ambrose, W. G. Jr., Levin, B. S., Henkes, G. A., Hop, H., and Renaud, P. E. (2011). Pan-Svalbard growth rate variability and environmental regulation in the Arctic bivalve Serripes groenlandicus. J. Mar. Syst. 88, 239–251. doi: 10.1016/j.jmarsys.2011.04.010
Clarke, K. R., and Gorley, R. N. (2015). Getting Started with PRIMER v7. Plymouth: Plymouth Marine Laboratory.
Cottier, F., Tverberg, V., and Inall, M. (2005). Water mass modification in an Arctic fjord through cross−shelf exchange: the seasonal hydrography of Kongsfjorden, Svalbard. J. Geophys. Res. 110:C12005.
Cottier, F. R., Nilsen, F., Inall, M. E., Gerland, S., Tverberg, V., and Svendsen, H. (2007). Wintertime warming of an Arctic shelf in response to large-scale atmospheric circulation. Geophys. Res. Lett. 34:L18504. doi: 10.1029/2007GL029948
Cottier, F. R., Nilsen, F., Skogseth, R., Tverberg, V., Skarðhamar, J., and Svendsen, H. (2010). Arctic fjords: a review of the oceanographic environment and dominant physical processes. Geol. Soc. Lond. Special Publ. 344, 35–50. doi: 10.1144/SP344.4
Daase, M., and Eiane, K. (2007). Mesozooplankton distribution in northern Svalbard waters in relation to hydrography. Polar Biol. 30, 969–981. doi: 10.1007/s00300-007-0255-5
Daase, M., Vik, J. O., Bagøien, E., Stenseth, N. C., and Eiane, K. (2007). The influence of advection on Calanus near Svalbard: statistical relations between salinity, temperature and copepod abundance. J. Plankton Res. 29, 903–911. doi: 10.1093/plankt/fbm068
Davies, E. J., Nimmo-Smith, W. A. M., Agrawal, Y. C., and Souza, A. J. (2012). LISST-100 response to large particles. Mar. Geol. 307, 117–122. doi: 10.1016/j.margeo.2012.03.006
Dekshenieks, M. M., Donaghay, P. L., Sullivan, J. M., Rines, J. E., Osborn, T. R., and Twardowski, M. S. (2001). Temporal and spatial occurrence of thin phytoplankton layers in relation to physical processes. Mar. Ecol. Prog. Ser. 223, 61–71. doi: 10.3354/meps223061
Dolan, J. R., Claustre, H., Carlotti, F., Plounevez, S., and Moutin, T. (2002). Microzooplankton diversity: relationships of tintinnid ciliates with resources, competitors and predators from the Atlantic Coast of Morocco to the Eastern Mediterranean. Deep Sea Res. Part I 49, 1217–1232. doi: 10.1016/S0967-0637(02)00021-3
Edler L. (ed.) (1979). Recommendations on Methods for Marine Biological Studies in the Baltic Sea. Phytoplankton and Chlorophyll. Sweden: Baltic Marine Biologists BMB.
Falk-Petersen, S., Dahl, T. M., Scott, C. L., Sargent, J. R., Gulliksen, B., Kwasniewski, S., et al. (2002). Lipid biomarkers and trophic linkages between ctenophores and copepods in Svalbard waters. Mar. Ecol. Prog. Ser. 227, 187–194. doi: 10.3354/meps227187
Falk-Petersen, S., Sargent, J. R., and Tande, K. S. (1987). Lipid composition of zooplankton in relation to the sub-arctic food web. Polar Biol. 8, 115–120. doi: 10.1007/BF00297065
Forest, A., Stemmann, L., Picheral, M., Burdorf, L., Robert, D., Fortier, L., et al. (2012). Size distribution of particles and zooplankton across the shelf-basin system in southeast Beaufort Sea: combined results from an Underwater Vision Profiler and vertical net tows. Biogeosciences 9, 1301–1320. doi: 10.5194/bg-9-1301-2012
Gabrielsen, T. M., Merkel, B., Søreide, J. E., Johansson-Karlsson, E., Bailey, A., Vogedes, D., et al. (2012). Potential misidentifications of two climate indicator species of the marine arctic ecosystem: Calanus glacialis and C. finmarchicus. Polar Biol. 35, 1621–1628. doi: 10.1007/s00300-012-1202-7
Gannefors, C., Böer, M., Kattner, G., Graeve, M., Eiane, K., Gulliksen, B., et al. (2005). The Arctic sea butterfly Limacina helicina: lipids and life strategy. Mar. Biol. 147, 169–177. doi: 10.1007/s00227-004-1544-y
Gluchowska, M., Dalpadado, P., Beszczynska-Möller, A., Olszewska, A., Ingvaldsen, R. B., and Kwasniewski, S. (2017a). Interannual zooplankton variability in the main pathways of the Atlantic water flow into the Arctic Ocean (Fram Strait and Barents Sea branches). ICES J. Mar. Sci. 74, 1921–1936. doi: 10.1093/icesjms/fsx033
Gluchowska, M., Kwasniewski, S., Prominska, A., Olszewska, A., Goszczko, I., Falk-Petersen, S., et al. (2016). Zooplankton in Svalbard fjords on the Atlantic–Arctic boundary. Polar Biol. 39, 1785–1802. doi: 10.1007/s00300-016-1991-1
Gluchowska, M., Trudnowska, E., Goszczko, I., Kubiszyn, A. M., Blachowiak-Samolyk, K., Walczowski, W., et al. (2017b). Variations in the structural and functional diversity of zooplankton over vertical and horizontal environmental gradients en route to the Arctic Ocean through the Fram Strait. PLoS One 12:e0171715. doi: 10.1371/journal.pone.0171715
Godø, O. R., Samuelsen, A., Macaulay, G. J., Patel, R., Hjøllo, S. S., Horne, J., et al. (2012). Mesoscale eddies are oases for higher trophic marine life. PLoS One 7:e30161. doi: 10.1371/journal.pone.0030161
Gómez, F., and Artigas, L. F. (2014). High diversity of dinoflagellates in the intertidal sandy sediments of Wimereux (north-east English Channel, France). J. Mar. Biol. Assoc. U.K. 94, 443–457. doi: 10.1017/S0025315413001744
González−Quirós, R., and Checkley, D. M. (2006). Occurrence of fragile particles inferred from optical plankton counters used in situ and to analyze net samples collected simultaneously. J. Geophys. Res. Oceans 111:C05S06.
Gribble, K. E., Nolan, G., and Anderson, D. M. (2007). Biodiversity, biogeography and potential trophic impact of Protoperidinium spp. (Dinophyceae) off the southwestern coast of Ireland. J. Plankton Res. 29, 931–947. doi: 10.1093/plankt/fbm070
Herman, A. W., Beanlands, B., and Phillips, E. F. (2004). The next generation of optical plankton counter: the laser-OPC. J. Plankton Res. 26, 1135–1145. doi: 10.1093/plankt/fbh095
Hodal, H., Falk-Petersen, S., Hop, H., Kristiansen, S., and Reigstad, M. (2012). Spring bloom dynamics in Kongsfjorden, Svalbard: nutrients, phytoplankton, protozoans and primary production. Polar Biol. 35, 191–203. doi: 10.1007/s00300-011-1053-7
Holm-Hansen, O., and Riemann, B. (1978). Chlorophyll a determination: improvements in methodology. Oikos 30, 438–447. doi: 10.2307/3543338
Hop, H., Pearson, T., Hegseth, E. N., and Kovacs, K. M. (2002). The marine ecosystem of Kongsfjorden. Polar Res. 21, 167–208.
Hopcroft, R. R., Clarke, C., Nelson, R. J., and Raskoff, K. A. (2005). Zooplankton communities of the Arctic’s Canada basin: the contribution by smaller taxa. Polar Biol. 28, 198–206. doi: 10.1007/s00300-004-0680-7
Jackson, G. A. (1990). A model of the formation of marine algal flocs by physical coagulation processes. Deep Sea Res. Part A. Oceanogr. Res. Papers 37, 1197–1211. doi: 10.1016/0198-0149(90)90038-w
Jackson, G. A., and Checkley, D. M. Jr. (2011). Particle size distributions in the upper 100 m water column and their implications for animal feeding in the plankton. Deep Sea Res. Part I Oceanogr. Res. Papers 58, 283–297. doi: 10.1016/j.dsr.2010.12.008
Jackson, G. A., Maffione, R., Costello, D. K., Alldredge, A. L., Logan, B. E., and Dam, H. G. (1997). Particle size spectra between 1 pum and 1 cm at Monterey Bay. Deep Sea Res. I 11, 1739–1767. doi: 10.1016/s0967-0637(97)00029-0
Keck, A., Wiktor, J., Hapter, R., and Nilsen, R. (1999). Phytoplankton assemblages related to physical gradients in an arctic, glacier-fed fjord in summer. ICES J. Mar. Sci. 56, 203–214. doi: 10.1006/jmsc.1999.0631
Kowalik, Z., Marchenko, A., Brazhnikov, D., and Marchenko, N. (2015). Tidal currents in the western Svalbard Fjords. Oceanologia 57, 318–327. doi: 10.1016/j.oceano.2015.06.003
Kubiszyn, A. M., Piwosz, K., and Wiktor, J. M. (2014). The effect of inter-annual Atlantic water inflow variability on the planktonic protist community structure in the West Spitsbergen waters during the summer. J. Plankton Res. 36, 1190–1203. doi: 10.1093/plankt/fbu044
Kubiszyn, A. M., Wiktor, J. M., Wiktor, J. M. Jr., Griffiths, C., Kristiansen, S., and Gabrielsen, T. M. (2017). The annual planktonic protist community structure in an ice-free high Arctic fjord (Adventfjorden, West Spitsbergen). J. Mar. Syst. 169, 61–72. doi: 10.1016/j.jmarsys.2017.01.013
Kuklinski, P., Berge, J., McFadden, L., Dmoch, K., Zajaczkowski, M., Nygård, H., et al. (2013). Seasonality of occurrence and recruitment of Arctic marine benthic invertebrate larvae in relation to environmental variables. Polar Biol. 36, 549–560. doi: 10.1007/s00300-012-1283-3
Kwasniewski, S., Hop, H., Falk-Petersen, S., and Pedersen, G. (2003). Distribution of Calanus species in Kongsfjorden, a glacial fjord in Svalbard. J. Plankton Res. 25, 1–20. doi: 10.1093/plankt/25.1.1
Lalande, C., Bauerfeind, E., and Nöthig, E. M. (2011). Downward particulate organic carbon export at high temporal resolution in the eastern fram strait: influence of Atlantic water on flux composition. Mar. Ecol. Prog. Ser. 440, 127–136. doi: 10.3354/meps09385
Leadbeater, B. S. (2008). Choanoflagellate evolution: the morphological perspective 1. Protistology 5, 256–267.
Leikvin, Ø, and Evenset, A. (2009). Avløp fra Longyearbyen til Adventfjorden. Miljøfaglige Vurderinger. Akvaplan-Niva Report, 4535-1.
Lischka, S., and Hagen, W. (2016). Seasonal dynamics of mesozooplankton in the Arctic Kongsfjord (Svalbard) during year-round observations from August 1998 to July 1999. Polar Biol. 39, 1859–1878. doi: 10.1007/s00300-016-2005-z
Lydersen, C., Assmy, P., Falk-Petersen, S., Kohler, J., Kovacs, K. M., Reigstad, M., et al. (2014). The importance of tidewater glaciers for marine mammals and seabirds in Svalbard, Norway. J. Mar. Syst. 129, 452–471. doi: 10.1016/j.jmarsys.2013.09.006
Madsen, S. D., Nielsen, T. G., and Hansen, B. W. (2008). Annual population development and production by small copepods in Disko Bay, western Greenland. Mar. Biol. 155, 63–77. doi: 10.1007/s00227-008-1007-y
Majaneva, S., Berge, J., Renaud, P. E., Vader, A., Stübner, E., Rao, A. M., et al. (2013). Aggregations of predators and prey affect predation impact of the Arctic ctenophore Mertensia ovum. Mar. Ecol. Prog. Ser. 476, 87–100. doi: 10.3354/meps10143
Maloy, A. P., Nelle, P., Culloty, S. C., Slater, J. W., and Harrod, C. (2013). Identifying trophic variation in a marine suspension feeder: DNA- and stable isotope-based dietary analysis in Mytilus spp. Mar. Biol. 160, 479–490. doi: 10.1007/s00227-012-2105-4
McCave, I. N. (1984). Size spectra and aggregation of suspended particles in the deep ocean. Deep Sea Res. Part A. Oceanogr. Res. Papers 31, 329–352. doi: 10.1016/0198-0149(84)90088-8
Metfies, K., von Appen, W. J., Kilias, E., Nicolaus, A., and Nöthig, E. M. (2016). Biogeography and photosynthetic biomass of arctic marine pico-eukaroytes during summer of the record sea ice minimum 2012. PLoS One 11:e0148512. doi: 10.1371/journal.pone.0148512
Mikkelsen, O. A., Hill, P. S., Milligan, T. G., and Chant, R. J. (2005). In situ particle size distributions and volume concentrations from a LISST-100 laser particle sizer and a digital floc camera. Continent. Shelf Res. 25, 1959–1978. doi: 10.1016/j.csr.2005.07.001
Mironova, E. I., Telesh, I. V., and Skarlato, S. O. (2009). Planktonic ciliates of the Baltic Sea (a review). Inland Water Biol. 2, 13–24. doi: 10.1134/S1995082909010039
Mojica, K. D., van de Poll, W. H., Kehoe, M., Huisman, J., Timmermans, K. R., Buma, A. G., et al. (2015). Phytoplankton community structure in relation to vertical stratification along a north−south gradient in the Northeast Atlantic Ocean. Limnol. Oceanogr. 60, 1498–1521. doi: 10.1002/lno.10113
Möller, F., and Bernhard, M. (1974). A sequential approach to the counting of plankton organisms. J. Exp. Mar. Biol. Ecol. 15, 49–68. doi: 10.1016/0022-0981(74)90063-x
Möller, K. O., John, M. S., Temming, A., Floeter, J., Sell, A. F., Herrmann, J. P., et al. (2012). Marine snow, zooplankton and thin layers: indications of a trophic link from small-scale sampling with the video plankton recorder. Mar. Ecol. Prog. Ser. 468, 57–69. doi: 10.3354/meps09984
Murray, M. S., Eicken, H., Starkweather, S., Gerlach, S. C., Evengard, B., Gearhard, S., et al. (2012). “Responding to Arctic environmental change-translating our growing understanding into a research agenda for action,” in Proceedings of the Workshop Report’Responding to Arctic Environmental Change’International Study for Arctic Change, (IASC), Kingston.
Nilsen, F., Cottier, F., Skogseth, R., and Mattsson, S. (2008). Fjord–shelf exchanges controlled by ice and brine production: the interannual variation of Atlantic Water in Isfjorden, Svalbard. Cont. Shelf Res. 28, 1838–1853. doi: 10.1016/j.csr.2008.04.015
Nilsen, F., Skogseth, R., Vaardal-Lunde, J., and Inall, M. (2016). A simple shelf circulation model: intrusion of Atlantic water on the west spitsbergen shelf. J. Phys. Oceanogr. 46, 1209–1230. doi: 10.1175/JPO-D-15-0058.1
Norrbin, F., Eilertsen, H. C., and Degerlund, M. (2009). Vertical distribution of primary producers and zooplankton grazers during different phases of the Arctic spring bloom. Deep Sea Res. Part II Top. Stud. Oceanogr. 56, 1945–1958. doi: 10.1016/j.dsr2.2008.11.006
Nöthig, E. M., Bracher, A., Engel, A., Metfies, K., Niehoff, B., Peeken, I., et al. (2015). Summertime plankton ecology in Fram Strait—a compilation of long-and short-term observations. Polar Res. 34:23349. doi: 10.3402/polar.v34.23349
Pavlov, A. K., Tverberg, V., Ivanov, B. V., Nilsen, F., Falk-Petersen, S., and Granskog, M. A. (2013). Warming of Atlantic water in two west Spitsbergen fjords over the last century (1912–2009). Polar Res. 32:11206. doi: 10.3402/polar.v32i0.11206
Piechura, J., and Walczowski, W. (2009). Warming of the west Spitsbergen current and sea ice north of Svalbard. Oceanologia 51, 147–164. doi: 10.5697/oc.51-2.147
Piwosz, K., Walkusz, W., Hapter, R., Wieczorek, P., Hop, H., and Wiktor, J. (2009). Comparison of productivity and phytoplankton in a warm (Kongsfjorden) and a cold (Hornsund) Spitsbergen fjord in mid-summer 2002. Polar Biol. 32, 549–559. doi: 10.1007/s00300-008-0549-2
Platt, T., and Denman, K. (1978). The structure of pelagic ecosystems. Rapports Proce Verbaux Re’unions Conseil Int. Pour l’Exp. Mer 173, 60–65.
Promińska, A., Falck, E., and Walczowski, W. (2018). Interannual variability in hydrography and water mass distribution in Hornsund, an Arctic fjord in Svalbard. Polar Res. 37:1495546. doi: 10.1080/17518369.2018.1495546
R Core Team (2013). R: A Language and Environment for Statistical Computing. Vienna: R Foundation for Statistical Computing.
Sagan, S., and Darecki, M. (2018). Inherent optical properties and particulate matter distribution in summer season in waters of Hornsund and Kongsfjordenen, Spitsbergen. Oceanologia 60, 65–75. doi: 10.1016/j.oceano.2017.07.006
Saloranta, T. M., and Svendsen, H. (2001). Across the Arctic front west of Spitsbergen: high-resolution CTD sections from 1998–2000. Polar Res. 20, 177–184. doi: 10.3402/polar.v20i2.6515
Schlitzer, R. (2018). Ocean Data View. Available online at: https://odv.awi.de (accessed June 3, 2020).
Schultes, S., and Lopes, R. M. (2009). Laser optical plankton counter and zooscan intercomparison in tropical and subtropical marine ecosystems. Limnol. Oceanogr. Methods 7, 771–784. doi: 10.4319/lom.2009.7.771
Scott, C. L., Falk-Petersen, S., Sargent, J. R., Hop, H., Lønne, O. J., and Poltermann, M. (1999). Lipids and trophic interactions of ice fauna and pelagic zooplankton in the marginal ice zone of the Barents Sea. Polar Biol. 21, 65–70. doi: 10.1007/s003000050335
Scott, C. L., Kwasniewski, S., Falk-Petersen, S., and Sargent, J. R. (2000). Lipids and life strategies of Calanus finmarchicus, Calanus glacialis and Calanus hyperboreus in late autumn, Kongsfjorden, Svalbard. Polar Biol. 23, 510–516. doi: 10.1007/s003000000114
Sheldon, R. W., Prakash, A., and Sutcliffe, W. Jr. (1972). The size distribution of particles in the ocean 1. Limnol. Oceanogr. 17, 327–340. doi: 10.4319/lo.1972.17.3.0327
Simon, M., Grossart, H. P., Schweitzer, B., and Ploug, H. (2002). Microbial ecology of organic aggregates in aquatic ecosystems. Aqua. Microb. Ecol. 28, 175–211. doi: 10.3354/ame028175
Smith, R. W., Bianchi, T. S., Allison, M., Savage, C., and Galy, V. (2015). High rates of organic carbon burial in fjord sediments globally. Nat. Geosci. 8, 450–453. doi: 10.1038/ngeo2421
Søreide, J. E., Hop, H., Falk-Petersen, S., Gulliksen, B., and Hansen, E. (2003). Macrozooplankton communities and environmental variables in the Barents Sea marginal ice zone in late winter and spring. Mar. Ecol. Prog. Ser. 263, 43–64. doi: 10.3354/meps263043
Sprules, W. G., and Barth, L. E. (2016). Surfing the biomass size spectrum: some remarks on history, theory, and application. Can. J. Fish. Aqua. Sci. 73, 477–495. doi: 10.1139/cjfas-2015-0115
Stemmann, L., and Boss, E. (2012). Plankton and particle size and packaging: from determining optical properties to driving the biological pump. Ann. Rev. Mar. Sci. 4, 263–290. doi: 10.1146/annurev-marine-120710-100853
Stemmann, L., Eloire, D., Sciandra, A., Jackson, G. A., Guidi, L., Picheral, M., et al. (2008). Volume distribution for particles between 3.5 to 2000 μm in the upper 200 m region of the south pacific gyre. Biogeosciences 5, 299–310. doi: 10.5194/bg-5-299-2008
Stoecker, D. K., Sieracki, M. E., Verity, P. G., Michaels, A. E., Haugen, E., Burkill, P. H., et al. (1994). Nanoplankton and protozoan microzooplankton during the JGOFS north Atlantic bloom experiment: 1989 and 1990. J. Mar. Biol. Assoc. U.K. 74, 427–443. doi: 10.1017/S0025315400039448
Straneo, F., and Heimbach, P. (2013). North Atlantic warming and the retreat of Greenland’s outlet glaciers. Nature 504, 36–43. doi: 10.1038/nature12854
Stübner, E. I., Søreide, J. E., Reigstad, M., Marquardt, M., and Błachowiak-Samołyk, K. (2016). Year-round meroplankton dynamics in high-Arctic, Svalbard. J. Plankton Res. 38, 522–536. doi: 10.1093/plankt/fbv124
Svendsen, H., Beszczynska-Møller, A., Hagen, J. O., Lefauconnier, B., Tverberg, V., Gerland, S., et al. (2002). The physical environment of Kongsfjorden – Krossfjorden, an Arctic fjord system in Svalbard. Polar Res. 21, 133–166. doi: 10.1111/j.1751-8369.2002.tb00072.x
Symon, C., Arris, L., and Heal, B. (2005). Arctic Climate Impact Assessment: ACIA. Cambridge: Cambridge University Press.
Trudnowska, E., Basedow, S. L., and Blachowiak-Samolyk, K. (2014). Mid-summer mesozooplankton biomass, its size distribution, and estimated production within a glacial Arctic fjord (Hornsund, Svalbard). J. Mar. Syst. 137, 55–66. doi: 10.1016/j.jmarsys.2014.04.010
Trudnowska, E., Da̧browska, A. M., Boehnke, R., Zaja̧czkowski, M., and Blachowiak-Samolyk, K. (2020a). Particles, protists, and zooplankton in glacier-influenced coastal svalbard waters. Estuar. Coast. Shelf Sci. 242:106842. doi: 10.1016/j.ecss.2020.106842
Trudnowska, E., Gluchowska, M., Beszczynska-Möller, A., Blachowiak-Samolyk, K., and Kwasniewski, S. (2016). Plankton patchiness in the polar front region of the west spitsbergen shelf. Mar. Ecol. Prog. Ser. 560, 1–18. doi: 10.3354/meps11925
Trudnowska, E., Sagan, S., and Błachowiak-Samołyk, K. (2018). Spatial variability and size structure of particles and plankton in the Fram Strait. Prog. Oceanogr. 168, 1–12. doi: 10.1016/j.pocean.2018.09.005
Trudnowska, E., Sagan, S., Kwasniewski, S., Darecki, M., and Blachowiak-Samolyk, K. (2015). Fine-scale zooplankton vertical distribution in relation to hydrographic and optical characteristics of the surface waters on the Arctic shelf. J. Plankton Res. 37, 120–133. doi: 10.1093/plankt/fbu087
Trudnowska, E., Stemmann, L., Blachowiak-Samołyk, K., and Kwasniewski, S. (2020b). Taxonomic and size structures of zooplankton communities in the fjords along the Atlantic water passage to the Arctic. J. Mar. Syst. 204:103306. doi: 10.1016/j.jmarsys.2020.103306
Urbanski, J. A., Stempniewicz, L., Wêsławski, J. M., Dragańska-Deja, K., Wochna, A., Goc, M., et al. (2017). Subglacial discharges create fluctuating foraging hotspots for sea birds in tidewater glacier bays. Sci. Rep. 7:43999. doi: 10.1038/srep43999
Utermöhl, H. (1958). Zur vervollkommnung der quantitativen phytoplankton-methodik. Mitt. Int. Ver. Theor. Angew. Limnol. 9, 1–38. doi: 10.1080/05384680.1958.11904091
Vaqué, D., Blough, H. A., and Duarte, C. M. (1997). Dynamics of ciliate abundance, biomass and community composition in an oligotrophic coastal environment (NW Mediterranean). Aquat. Microb. Ecol. 12, 71–83. doi: 10.3354/ame012071
Vihtakari, M. (2019). PlotSvalbard: PlotSvalbard – Plot research data from Svalbard on maps. R Package Version 0.8.5. Available online at: https://github.com/MikkoVihtakari/PlotSvalbard (accessed February 4, 2020).
Walczowski, W., and Piechura, J. (2011). Influence of the West spitsbergen current on the local climate. Int. J. Climatol. 31, 1088–1093. doi: 10.1002/joc.2338
Wassmann, P., Kosobokova, K. N., Slagstad, D., Drinkwater, K. F., Hopcroft, R. R., Moore, S. E., et al. (2015). The contiguous domains of Arctic ocean advection: trails of life and death. Prog. Oceanogr. 139, 42–65. doi: 10.1016/j.pocean.2015.06.011
Wassmann, P., Slagstad, D., and Ellingsen, I. H. (2019). Advection of Mesozooplankton into the Northern Svalbard Shelf Region. Available online at: https://munin.uit.no/handle/10037/16195 (accessed August 14, 2019).
Weslawski, J. M., Koszteyn, J., Zajaczkowski, M., Wiktor, J., and Kwasniewski, S. (1995). “Fresh water in Svalbard fjord ecosystems,” in Ecology of Fjords and Coastal Waters, eds H. R. Skjoldal, C. Hopkins, K. E. Erikstad, and H. P. Leinaas (Amsterdam: Elsevier Science), 229–241.
Weslawski, J. M., Pedersen, G., Petersen, S. F., and Porazinski, K. (2000). Entrapment of macroplankton in an Arctic fjord basin, Kongsfjorden, Svalbard. Oceanologia 42, 57–69.
Weydmann, A., Carstensen, J., Goszczko, I., Dmoch, K., Olszewska, A., and Kwasniewski, S. (2014). Shift towards the dominance of boreal species in the Arctic: inter-annual and spatial zooplankton variability in the west spitsbergen current. Mar. Ecol. Prog. Ser. 501, 41–52. doi: 10.3354/meps10694
Wiedmann, I., Reigstad, M., Marquardt, M., Vader, A., and Gabrielsen, T. M. (2016). Seasonality of vertical flux and sinking particle characteristics in an ice-free high arctic fjord—different from subarctic fjords? J. Mar. Syst. 154, 192–205. doi: 10.1016/j.jmarsys.2015.10.003
Wishner, K., Durbin, E., Durbin, A., Macaulay, M., Winn, H., and Kenney, R. (1988). Copepod patches and right whales in the Great South channel off New England. Bull. Mar. Sci. 43, 825–844.
Włodarska-Kowalczuk, M., Szymelfenig, M., and Zajączkowski, M. (2007). Dynamic sedimentary environments of an Arctic glacier-fed river estuary (Adventfjorden, Svalbard). II: Meio-and macrobenthic fauna. Estuar. Coast. Shelf Sci. 74, 274–284. doi: 10.1016/j.ecss.2007.04.017
Keywords: particles, plankton, spatial patterns, Arctic, Isfjorden, glaciers, Atlantification
Citation: Szeligowska M, Trudnowska E, Boehnke R, Dąbrowska AM, Wiktor JM, Sagan S and Błachowiak-Samołyk K (2020) Spatial Patterns of Particles and Plankton in the Warming Arctic Fjord (Isfjorden, West Spitsbergen) in Seven Consecutive Mid-Summers (2013–2019). Front. Mar. Sci. 7:584. doi: 10.3389/fmars.2020.00584
Received: 09 February 2020; Accepted: 23 June 2020;
Published: 17 July 2020.
Edited by:
David Murphy, University of South Florida, United StatesReviewed by:
Aaron True, University of Michigan, United StatesKusum Komal Karati, Centre for Marine Living Resources and Ecology (CMLRE), India
Copyright © 2020 Szeligowska, Trudnowska, Boehnke, Dąbrowska, Wiktor, Sagan and Błachowiak-Samołyk. This is an open-access article distributed under the terms of the Creative Commons Attribution License (CC BY). The use, distribution or reproduction in other forums is permitted, provided the original author(s) and the copyright owner(s) are credited and that the original publication in this journal is cited, in accordance with accepted academic practice. No use, distribution or reproduction is permitted which does not comply with these terms.
*Correspondence: Marlena Szeligowska, lena@iopan.pl