Biophysical Drivers of Zooplankton Variability on the Scotian Shelf Observed Using Profiling Electric Gliders
 Gennavieve S. Ruckdeschel
 Kimberley T. A. Davies
 Tetjana Ross
- 1Department of Oceanography, Dalhousie University, Halifax, NS, Canada
- 2Department of Biological Sciences, University of New Brunswick, Saint John, NB, Canada
- 3Institute of Ocean Sciences, Fisheries and Oceans Canada, Sidney, BC, Canada
Variation in water mass transport is a key driver of variability in zooplankton ecology. Data distribution (e.g., sparseness) is often an important factor limiting robust delineation of zooplankton-water mass associations. Mobile autonomous profiling gliders can help address the sparseness issue because gliders can sample across water mass domains spanning tens to hundreds of kilometers at high frequency during a single deployment. The goal of our study was to research the use of gliders as a tool to increase the spatiotemporal scale and robustness of zooplankton-water mass datasets. An autonomous ocean glider was deployed in Roseway Basin, Scotian Shelf, Canada for 2 months along a set of transects that crossed two water masses, a cold-fresh coastal water mass, and a warm-salty continental slope water mass. Zooplankton backscatter was measured with a single frequency Imagenex 300 kHz hydroacoustic echosounder mounted to the underside of the glider at an angle of 26°, such that it was directed vertically downward on the glider downcast. During the deployment, an unusual basin flushing event occurred, where the slope water mass that is typically present in the deep water of Scotian Shelf basins was almost completely replaced by coastal water at all depths. This unique event offered an opportunity to study how extreme changes in water mass affected zooplankton distribution. The impact of basin flushing on both diel- and non-diel-vertically migrating zooplankton communities within the basin was investigated using General Linear Models. The analysis demonstrated some key relationships exist among zooplankton acoustic scattering layers, water mass properties, and basin bathymetry. Zooplankton backscatter was higher in the slope water mass, and declined substantially during the basin flushing event, suggesting that coastal water is not zooplankton habitat for either community. Spatial gradients in the extent of flushing provided local refuge for zooplankton within one margin of the Basin. These patterns would be challenging to measure using conventional shipboard surveys. Our study provides guidance on the use of gliders to supplement shipboard research on biophysical coupling in the plankton, which is of value as the use of gliders for this purpose is proliferating.
Introduction
Zooplankton are the primary food-source for fish, marine mammals, and seabirds (Calbet, 2001; Turner, 2004), and their productivity impacts global biogeochemical cycling (Hays, 2003; Ringelberg, 2009). The role of this group in trophic ecology is often understated (Mitra et al., 2014), which may be attributed to the difficulty of collecting empirical zooplankton abundance data, especially over the large space and time scales needed to relate these measurements to key regional and global ocean processes. Since the life cycles of pelagic zooplankton can be quite long (order weeks to years), their distribution and abundance varies strongly due to advective transport of their water mass “habitats” by major ocean current systems (Prairie et al., 2012). Characterizing the impacts of advective water mass transport on zooplankton ecology is thus an important objective of biological oceanography worldwide (e.g., Pace et al., 1992; Keister et al., 2011; Chiba et al., 2013; Hunt et al., 2016; Spear et al., 2019).
Empirical studies of biophysical advective transport rely on concurrent spatial measurements of zooplankton and their fluid environments. The creation of autonomous ocean observing systems and improvements to remote sensing technologies have together advanced the ability to make these measurements over large space and time scales (Prairie et al., 2012). Mobile profiling ocean gliders are unique platforms used to measure the distribution and abundance of high biomass pelagic zooplankton, such as euphausiids and copepods, that are detectable by glider-mounted hydroacoustic sensors (Guihen et al., 2014; Benoit-Bird et al., 2018; Ohman et al., 2019). With deployments that can last several months, profiling gliders can produce rich multivariate datasets derived from high-resolution 3-D spatial measurements over flight paths extending hundreds of kilometers (Webb et al., 2001; Rudnick, 2016; Testor et al., 2019). This technology has proven suitable for quantifying relationships between zooplankton and mesoscale features of large current systems such as fronts (e.g., the California Current, Powell and Ohman, 2015). The combination of endurance and high-resolution mobile sampling is the gliders’ key advantage over other platforms. However, there are very few studies that have yet explored the application of this technology for studying the influence of water mass transport on zooplankton ecology.
The Northwest Atlantic Large Marine Ecosystem (NALME) is a high biomass – low diversity ecosystem characterized by several dominant species of euphausiid and large copepod taxa (e.g., Thyssanoessa spp., Meganyctyphanes spp., and Calanus spp.). The Scotian Shelf within the NALME is a highly productive region where the Labrador Current (LC), Gulf Stream (GS), and the coastally trapped Nova Scotia Coastal Current (NSCC) form the dominant large ocean current system (Smith et al., 1978; Loder, 1998; Hannah et al., 2001; Lumpkin and Speer, 2003; Ohashi et al., 2009; Wu et al., 2012; Brickman et al., 2016). The dynamics of this system have first-order effects on the transport of water masses and planktonic biomass at seasonal to annual time scales (Smith, 1989; Sameoto and Herman, 1992; Petrie and Yeats, 2000). The region also experiences large-scale regime-shifts in fish and zooplankton community compositions at inter-decadal time scales, with water mass advection playing key roles in this process (Frank et al., 2011; Greene et al., 2013; Sinclair et al., 2015). Characterizing the influence of water mass transport on zooplankton ecology in this region may provide helpful context for explaining the shifts and their impacts on zooplanktivorous predators.
Cross-shelf water mass exchange across the Scotian Shelf has been shown to have significant impacts on the distribution of zooplankton communities that are associated with coastal, shelf or off-shelf water masses (Tremblay and Roff, 1983). Tremblay and Roff (1983) first demonstrated that inshore copepod species on the Scotian Shelf occurred in a cold-fresh water mass habitat transported along the coast by the NSCC, whereas offshore species were associated with a warm-salty continental slope water habitat that intrudes onto the shelf periodically. In a study of the same region, Davies et al. (2014) found that biomass of deep dormant Calanus copepods were virtually absent from the cold-fresh NSCC water (which was separated by a strong front from copepod-replete slope water) suggesting active avoidance of the coastal water mass by certain life stages. Krumhansl et al. (2018) similarly found the coastal water avoidance in this species at stations spanning the Northwest Atlantic Shelf. Thus, it is reasonable to hypothesize that the exchange of slope and shelf water by the Scotian Shelf current system should impact both the distribution and abundance of zooplankton communities. Volume transport of cold-fresh water by the NSCC varies annually and seasonally (winter maximum) partly in response to meltwater runoff variation from the Saint Lawrence River (Dever et al., 2016). Studies of zooplankton-water mass associations in this region typically rely on vertical profile-sampling from vessels across grids of oceanographic stations that can be sparsely distributed relative to water mass space. Thus, it has proven very challenging to robustly address the influence of water mass dynamics on zooplankton biomass or community structure in this and other regions of the ocean. There is a need for tools that can supplement net sampling and vessel-based sampling of zooplankton in their water mass habitats.
Many zooplankton taxa in the Scotian Shelf undergo diel- and/or ontogenetic- vertical migration, and this behavior influences transport in vertically structured physical environments (e.g., Simard and Lavoie, 1999; Lavoie et al., 2000; Cotté and Simard, 2005). The Nova Scotia Coastal Current is a buoyant plume that, on the Scotian Shelf, is dominant inshore in the upper layer (30–50 m) whereas slope water is dominant in shelf basins and offshore below 100 m, and the two water masses are spatially separated by a large front (Dever et al., 2016). Each of these depth-layers and masses exhibit distinct circulation patterns. Vertically migrating zooplankton may, in some locations, pass through one, the other, or both water masses and thus experience different circulation patterns. Further, where cross-shelf water mass exchange is stronger at a particular depth, it can cause the zooplankton community gradient to be shifted in the vertical plane (Tremblay and Roff, 1983). Thus, in the study of biophysical transport in the Scotian Shelf current system, it is important to consider the vertical structure in both biology and physics, which can readily be measured at the relevant scales using ocean gliders.
The Ocean Tracking Network has deployed electric gliders on the Scotian Shelf since 2011 to resolve the spatial structure and seasonal along-shelf transport by the Nova Scotia Coastal Current (Dever et al., 2016) as well as to investigate environmental drivers of the spring phytoplankton bloom across this current (Ross et al., 2017). During 2015, we equipped one of these gliders with a single-frequency 300 kHz echosounder to measure acoustic backscatter from zooplankton. In this paper, we explore the use of glider-derived echosounder and physical oceanographic data in a habitat modeling framework to investigate the impact of cross-shelf water mass exchange on the ecology of acoustically inferred zooplankton communities that differ in their diel-vertical migration behavior.
Materials and Methods
As an aid to the reader, terms and abbreviations used in the remainder of the text are provided for reference in Table 1.
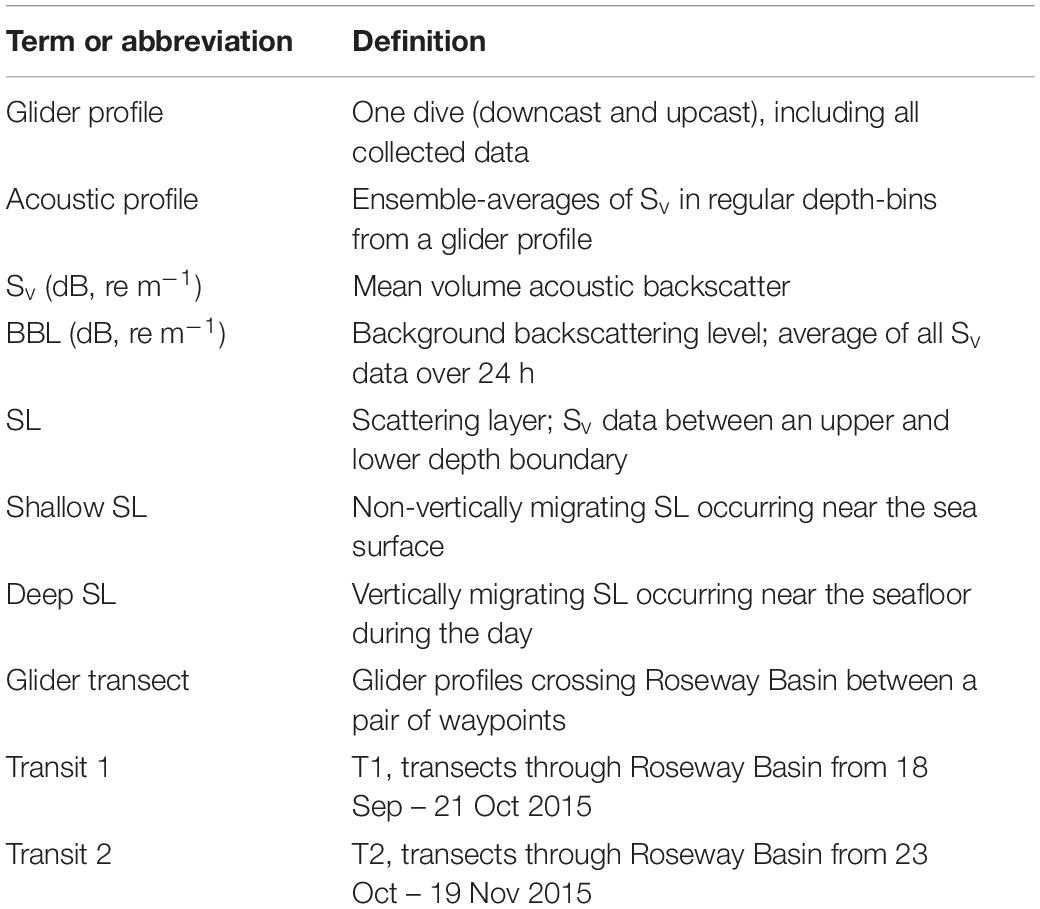
Table 1. Definitions of terms and abbreviations used in the text.
Instrumentation
A Slocum electric glider (G2 model, Teledyne-Webb Research, Schofield et al., 2007) powered by non-rechargeable lithium batteries was used for this study. The glider profiled the water column between ca. 5 m below the surface and ca. 5 m above the seafloor in a saw-tooth pattern with an average horizontal speed of 0.3 m s–1 and a dive angle of 22–26 degrees. The glider surfaced at approximately 2-h intervals, completing four profiles between surfacings, to communicate geopositional data via Iridium satellite and, if needed, receive commands from shore. The glider was equipped with an unpumped Seabird SBE41 conductivity-temperature-depth sensor (CTD) that sampled at 1 Hz, which resulted in profile data with a vertical resolution of ∼ 0.5 m. A downward-looking 300 kHz Imagenex 853 echosounder with 10° beamwidth was integrated into the science bay at an angle of 26° so the transducer face pointed vertically downward on the glider downcast. The echosounder recorded data at 1 Hz and stored data in 0.5 m range bins (0–100 m range). The echosounder was duty-cycled to record data only during downcasts, therefore all datasets used in this paper were collected only on downcasts. Data from both CTD and echosounder were stored onboard the glider and were not transmitted in real time.
Study Area
Roseway Basin is a shallow (180-m) depression located on the western Scotian Shelf southwest of Browns Bank (Figure 1A). The Basin is characterized by stronger bathymetric gradients along the southeast and northwest margins or sills, and smaller gradients that lead into channels along the northeast and southwest sills. Deep water in the Basin is typically comprised primarily of Warm and salty Slope Water (WSW), while cold and fresh Cabot Strait Water (CSW) is typically present on the northern Basin sill, closer to the coast (Davies et al., 2013, 2014).
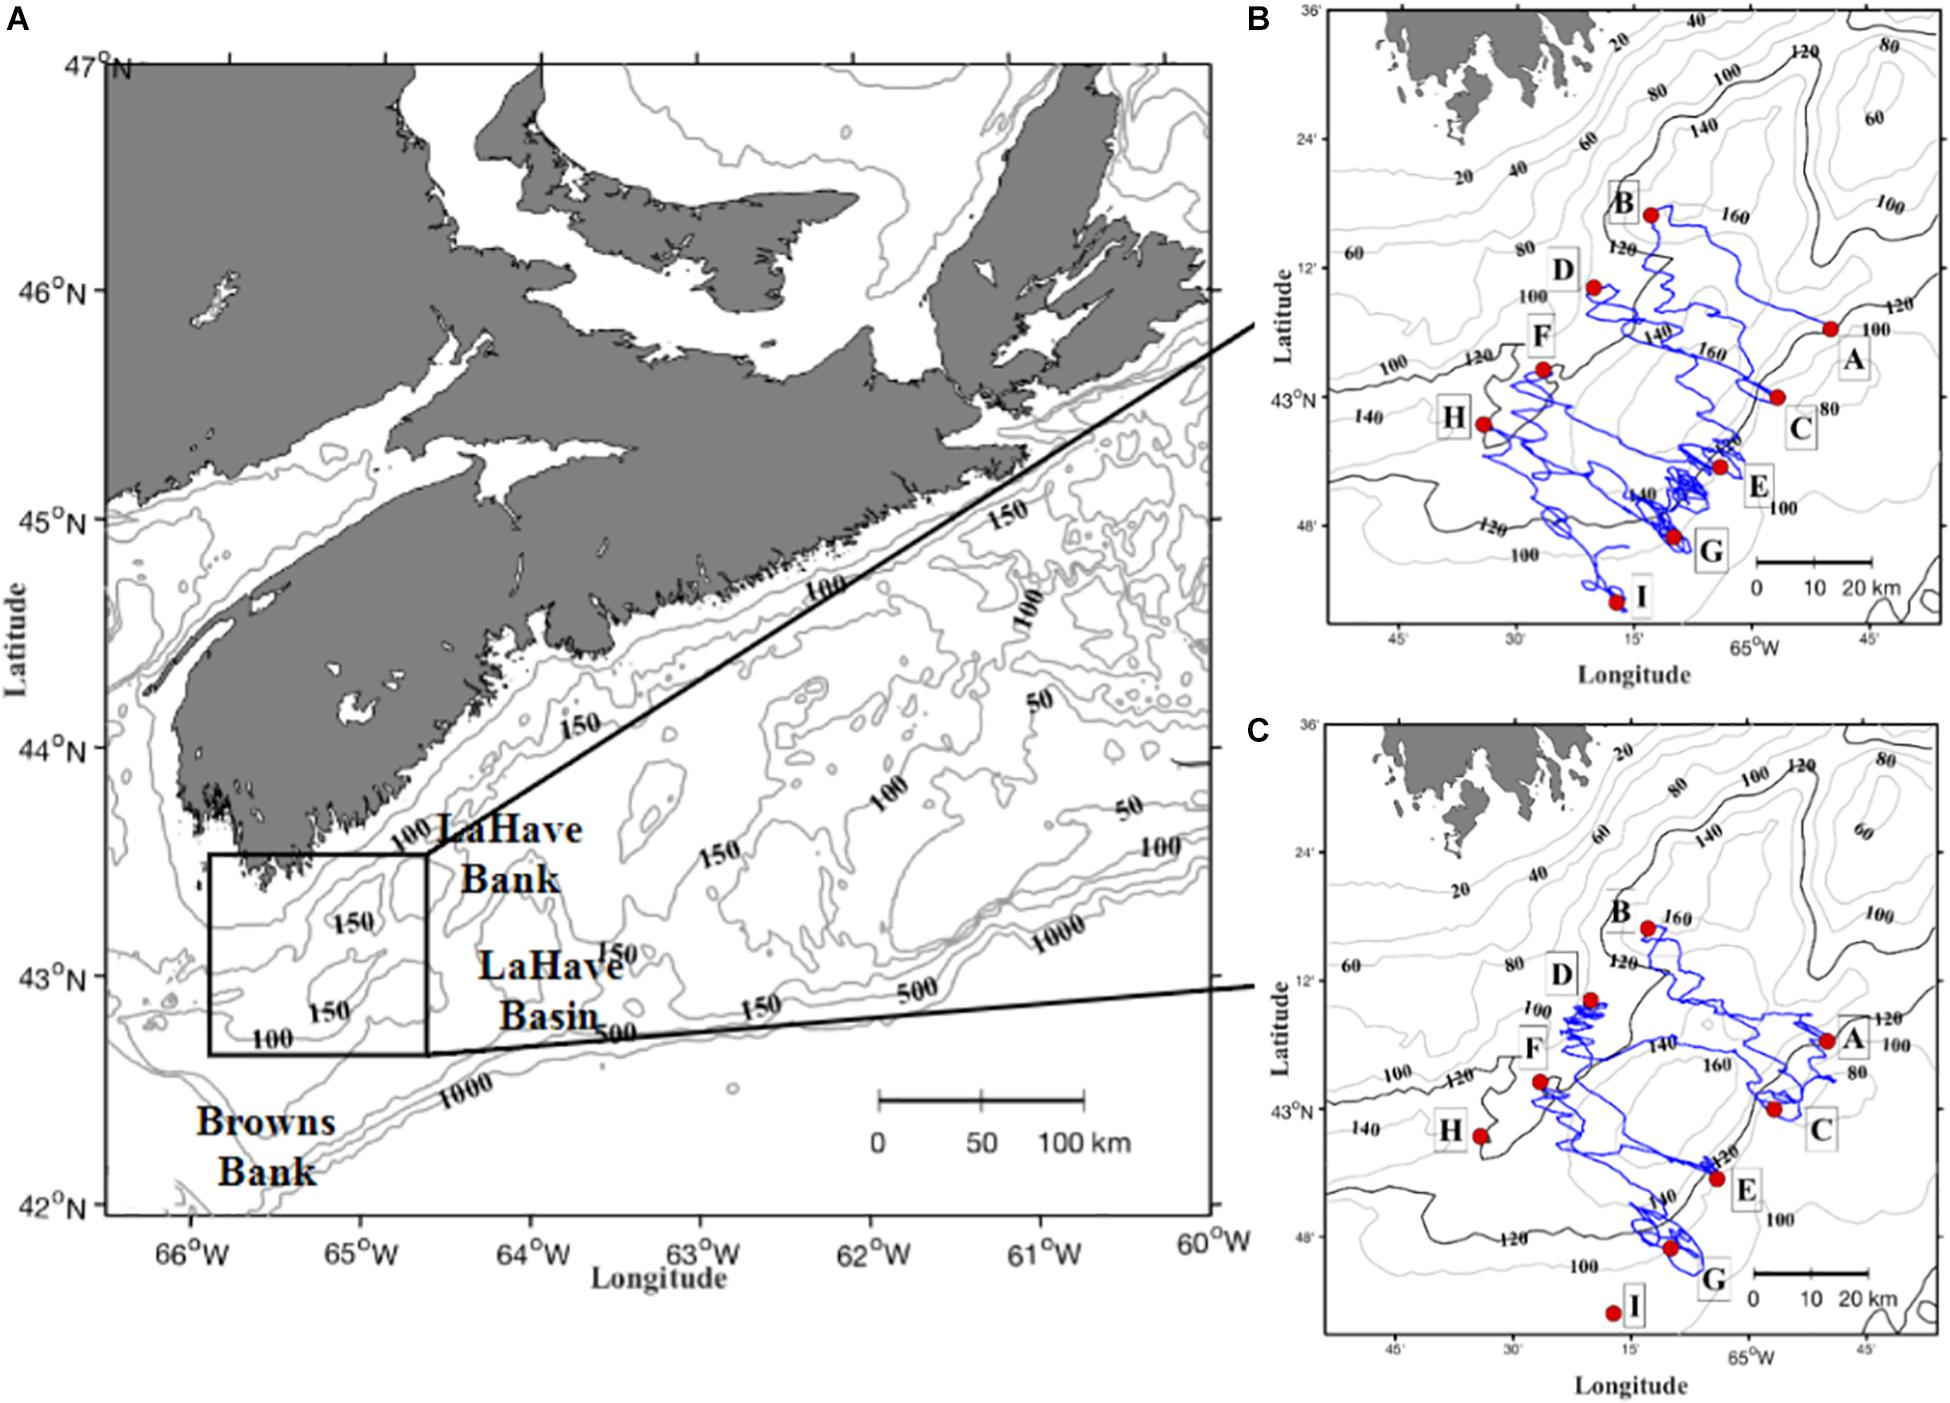
Figure 1. Location of Roseway Basin on the Scotian Shelf (A), and detailed basin bathymetry with survey waypoints (A-I; red circles) and realized glider track for first (B) and second (C) glider transits. The 120 m isobath is shown in bold in (B,C) to indicate the boundary of the basin margin or sill.
Glider Survey
The survey plan consisted of eight NW-SE cross-basin transects connecting waypoints A-I in Figure 1B. Transects were oriented cross-shelf to repeatedly transit across the probable spatial boundary of the coastal NSCC water mass identified in Davies et al. (2014). The glider transited this plan twice collecting a total of 2,335 on-transect profiles in 58 survey days. Transit-1 was 32 days in duration (18 September – 21 October 2015) and collected 1,281 profiles (Figure 1B). Transit-2 was 26 days in duration (23 October to 19 November) collecting 1,054 profiles (Figure 1C). The transects connecting waypoints G, H, and I were not surveyed during transit 2 because the glider batteries were exhausted earlier than expected. The glider paths between waypoints meandered because the slow-moving glider was pushed off the straight lines by strong rotary tidal currents. Full dataset available by request from: ceotr.ocean.dal.ca
Acoustic Data Processing
Archived echosounder data were subsampled from 1 to 0.1 Hz (i.e., from every ping to every 10th ping) temporal resolution and only at ranges between 0.5 and 50 m for analysis. Voltage data (V) were then converted to mean volume backscattering strength (Sv, dB re m–1) according to the sonar equation (e.g., Medwin and Clay, 1997):
Where α is the acoustic attenuation at 300 kHz in dB m–1 (−0.09 dB m–1 for water of 10°C; Francois and Garrison, 1982), GAIN is the gain setting applied to the echosounder (40 dB), and Calcoeff is the calibration coefficient (−2 dB), obtained via a post-deployment standard target calibration with 10 mm and 38.1 mm tungsten-carbide spheres in a 10-m deep tank using the method outlined in Vagle et al. (1996). Values below the empirically calculated range-dependent noise floor of the echosounder were removed and data from each glider downcast (i.e., all data collected in the same physical space, but at different ranges from the glider) were averaged in linear space to produce a single Sv profile per downcast with 0.5 m vertical resolution.
Volume scattering strength data from bins deeper than 45 m with Sv values exceeding −20 dB were flagged to identify and remove the seafloor echo from each profile. These data were retained as a separate seafloor depth variable. Flagged bins plus 3 m of data above that depth were removed from each profile because the seafloor echo was often strong enough to contaminate adjacent bins in the water column. Bins with data greater than −55 dB were set to zero as these are assumed to represent noise and bubbles at the surface as well as echoes from fish. This threshold was defined based on the strongest Sv observed in echograms containing vertically migrating layers that indicated zooplankton (Supplementary Figure S2).
Scattering Layer Identification Algorithm
When measured acoustically, zooplankton often appear as discrete, vertically constrained layers in the water column, and are generally known as scattering layers (hereafter, SLs). An algorithm was developed to identify and isolate these biological SLs from the echosounder dataset. First, background backscatter level (BBL, dB) was derived to quantify the intensity that would be present if backscatter was homogeneous throughout the water column (i.e., no SLs present). The BBL was used as a reference to determine the presence of SLs. BBL was calculated for each profile to be the average Sv over all depths and glider profiles collected within a sliding temporal window of ±12 h of the profile being analyzed.
This procedure allowed the identification of SL boundaries in every glider profile, regardless of variability in BBL among survey days. The interval of 12 h before and after each profile acted as a low-pass filter to retain the diel-vertical migration (DVM) signal.
The original “unsmoothed” dataset was smoothed with a 2-D moving average filter with 5-m and 2-profile resolution (creating a “smoothed” dataset). The top and bottom boundary of SLs were defined within each profile as the depths (m) where the gradient in backscatter intensity first fell either above or below that of the BBL [e.g., the depth (d) where ∂ (Sv(jt) – BBL(jt))/∂d = 0]. Using this definition, as the algorithm moved from the top (shallowest depth) to the bottom (deepest depth) of each profile, an upper SL boundary is where the difference moves from negative to positive, and a lower SL boundary is where the difference moves from positive to negative. Any SLs with upper and lower boundaries less than 1 m apart were likely due to noise in the Sv data, and therefore were omitted from further analysis. Additionally, because vertical gaps can be present in large SLs that span multiple glider profiles (Reid et al., 2000), if more than one layer was identified within a profile and these layers were separated by less than the maximum gap distance (≤20 m SLs shallower than 50 m1, ≤40 m for SLs deeper than 50 m), they were combined as a single layer. Finally, each pair of upper and lower SL boundaries, including the data points of the boundaries themselves, were used to calculate the SL thickness (m), and the average and integrated Sv intensity from the unsmoothed Sv data. These last two descriptive metrics reflect variation in the mean concentration of scatterers (average Sv) and variation in the total biomass of scatterers present in each SL (integrated Sv).
Selection of Acoustic Data for Statistical Analysis
Two vertically discrete SLs were consistently observed each day, one shallow and one deep, whereas a single shallow SL was consistently observed at night (Figure 2). We interpret this pattern as representing two communities of zooplankton differentiated behaviorally into animals that diel-vertically migrate and animals that do not. Only profiles collected during daylight (civil sunrise to civil sunset) hours were used because the goal of the study was to characterize the relative changes in concentration and environmental associations of each community. Nighttime acoustic data were removed from the analysis because the two communities co-occurred in space and were therefore not differentiable using a single frequency sensor. During daylight, the deep SL represents the diel-vertically migrating community which presumably is at depth to avoid predators, whereas the shallow SL represents the non-diel-vertically migrating community.
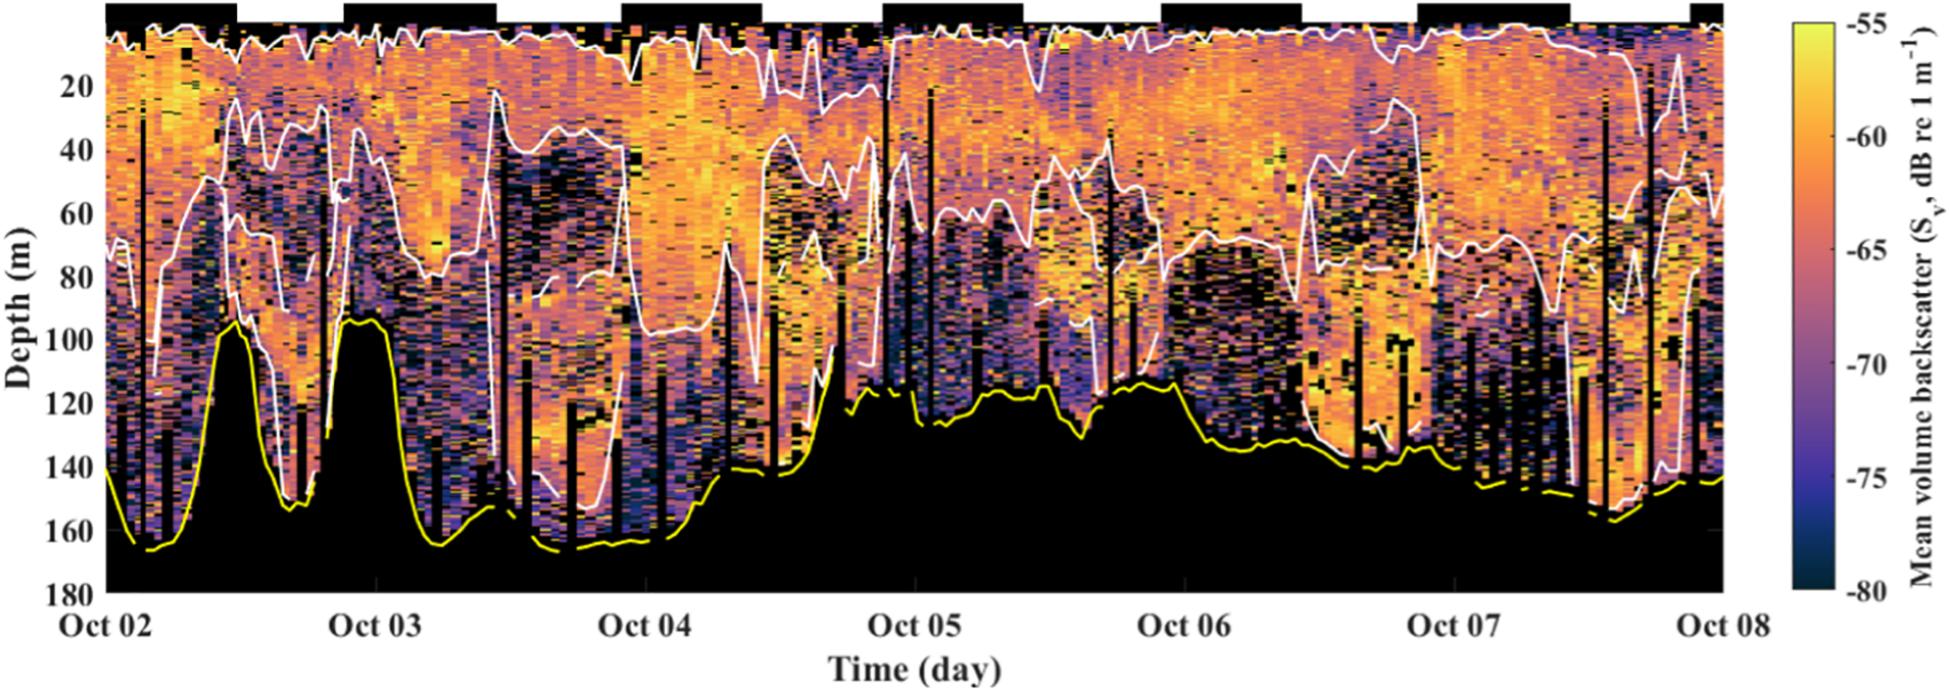
Figure 2. Echogram of Sv from 300 profiles taken during the first transit of Roseway Basin from 2 to 8 October 2015. Shallow and deep SLs are indicated with white lines; the acoustically derived depth of the seafloor is indicated with a yellow line. Black indicates no data (i.e., vertical bars are early inflections made by the glider or depths below the seafloor). Bars at the top of the panel show periods of day (white) and night (black).
Occasionally (in 3% or less of all profiles) the glider altimeter registered a false seafloor detection and the glider made an early inflection. This can result in partial sampling of an SL and erroneous statistics calculated across an SL. Early inflections were identified and removed if two conditions were met: (1) SL boundary for the ith acoustic profile was >10 m shallower than the boundaries in both adjacent profiles (i-1 and i + 1), and (2) the glider depth for the ith profile was not deeper than the ith SL boundary. The latter condition prevents falsely flagging natural variation in the SLs as an early inflection. Further, 8% of daytime profiles required manual corrections. In almost all cases this entailed removing a thin (<10 m thick) mid-water SL that occurred outside of the defined deep SL, that was not continuous with either the shallow migrating or the deep migrating SLs. The average and integrated SL metrics for both SLs were calculated within each profile, and the daily average values of these two measures were used in statistical comparisons with environmental data.
CTD and Positional Data Processing
Conservative temperature (T,°C) and absolute salinity (S, g kg–1) data from the CTD were depth-averaged into regular 0.5 m bins, and georeferenced with profile-averaged time, latitude, longitude and distance from shore (km). An empirical correction for thermal lag was applied to the salinity data because unpumped CTDs can suffer from hysteresis across strong thermal gradients in the water column. This step resulted in the removal of ∼ 20% of salinity profiles from the full dataset that could not be corrected by the algorithm [following the procedure in Garau et al. (2011)]. We then calculated 10 m vertical averages and selected the 90–100 m depth interval to represent variation in deep water mass properties that were removed as much as possible from the seasonal cycle in solar heating. The CTD and positional data used for analysis matched the daytime profiles selected from the acoustic dataset, and to maintain comparability between datasets, these were also averaged by 24-h survey day.
Observations of Zooplankton Community Composition From BIONESS Net Tow Data
Depth-structured zooplankton net samples were collected using the Bedford Institute of Oceanography Net and Environmental Sampling System (BIONESS; Sameoto et al., 1980) by the vessel CCGS Hudson in Roseway Basin on 9 October 2015 in the vicinity of the deployed glider. Tows were completed at two stations located 3.5 km apart over the southern Basin sill; the first station was collected near the 155 m isobath, and the second station near the 140 m isobath (Supplementary Figure S1). Both tows were collected at night; station R01 was sampled between 1:15–1:24 am ADT, and station R02 between 3:05–3:16 am ADT. Specific processing details for the net tow data are presented in the Supplement (Supplementary Section S1).
Statistical Analysis
We modeled the habitat of deep and shallow zooplankton SLs using redundancy analyses (RDA; Legendre and Legendre, 1998). RDA is a method of direct gradient analysis that summarizes dominant modes of variability in a dataset by using ordination (via principle component analysis, PCA) to construct canonical axes for fitted values (from multiple regression) for both predictor and response variables. Response variables were average Sv and layer thickness in the shallow and deep zooplankton SLs, respectively. Integrated Sv was not included in the RDAs because this descriptive metric is derived from the average Sv and layer thickness, and so is dependent on these two variables. Predictor variables included deep water mass properties as the 90–100 m averages of temperature (°C) and salinity (g kg–1), distance from the coast (km), and the acoustically derived depth of the seafloor (m). We constructed tri-plots with type II scaling for Transit 1 and Transit 2 separately to visualize the results of the RDAs, where the angles between vectors representing each variable show the correlations among all variables included in the analysis. Prior to the application of each RDA, each included variable was standardized and variance inflation factors (VIFs) were calculated to detect possible collinearity. Following Carruthers et al. (2008), collinearity was ruled out for all included variables, as no VIF exceeded a value of 5. Frequency distributions also showed that no variable suffered from any large departures from a normal distribution. To assess the fit of each RDA model, we used the adjusted coefficient of determination (), the total probability value for the RDA run (p), and the probability values from a 1,000-iteration permutation test for correlation between each canonical axis and predictor variable.
Next, to investigate spatial and temporal variation in the zooplankton descriptive SLs, we used analysis of variance (ANOVA) with a set of two-level factors: glider transit (Transit 1 vs Transit 2), bathymetric region (Sill region vs. Basin region; relative to the 100 m isobath) and cross-basin region (Shoreward vs. Seaward relative to the basin’s center-point). Separate ANOVAs were run for all SL three descriptive metrics (average Sv, integrated Sv, and layer thickness) to assess how these varied over the same factors of time and space. A sensitivity analysis showed that the models were sensitive to sample size, and so only the two-way interactions among glider transit, bathymetric region, and across-basin regions were included in the analysis. We report relative changes in average and integrated Sv in the ANOVAs based on linearized data. This allows the results to be expressed in terms of relative change in average concentration (from average Sv) and total biomass of scatterers (from integrated Sv). The associated reported errors are the linearized standard errors following standard propagation of uncertainty.
Results
Glider Flight Characteristics
The glider’s pitch (tilt relative to horizontal), roll (orientation relative to vertical), and depth beneath the surface throughout a dive impact volume backscattering averages calculated from the glider echosounder, and these three flight characteristics are summarized in Figure 3. A consistent but weak bias was present in both the glider’s pitch and roll during the survey. Pitch remained close to, but slightly less than, 26 degrees throughout the survey. The glider’s roll experienced a modest increase throughout the survey from around −2.5 to −2.0 degrees (tilted slightly counter-clockwise when looking at the tail). Median depths beneath the surface throughout the survey ranged between ∼45–90 m. The relatively low bias in both the glider’s pitch and roll, coupled with there being no dramatic difference between transits for either characteristic indicates that calculated values of volume backscatter from the glider echosounder are comparable between transits.
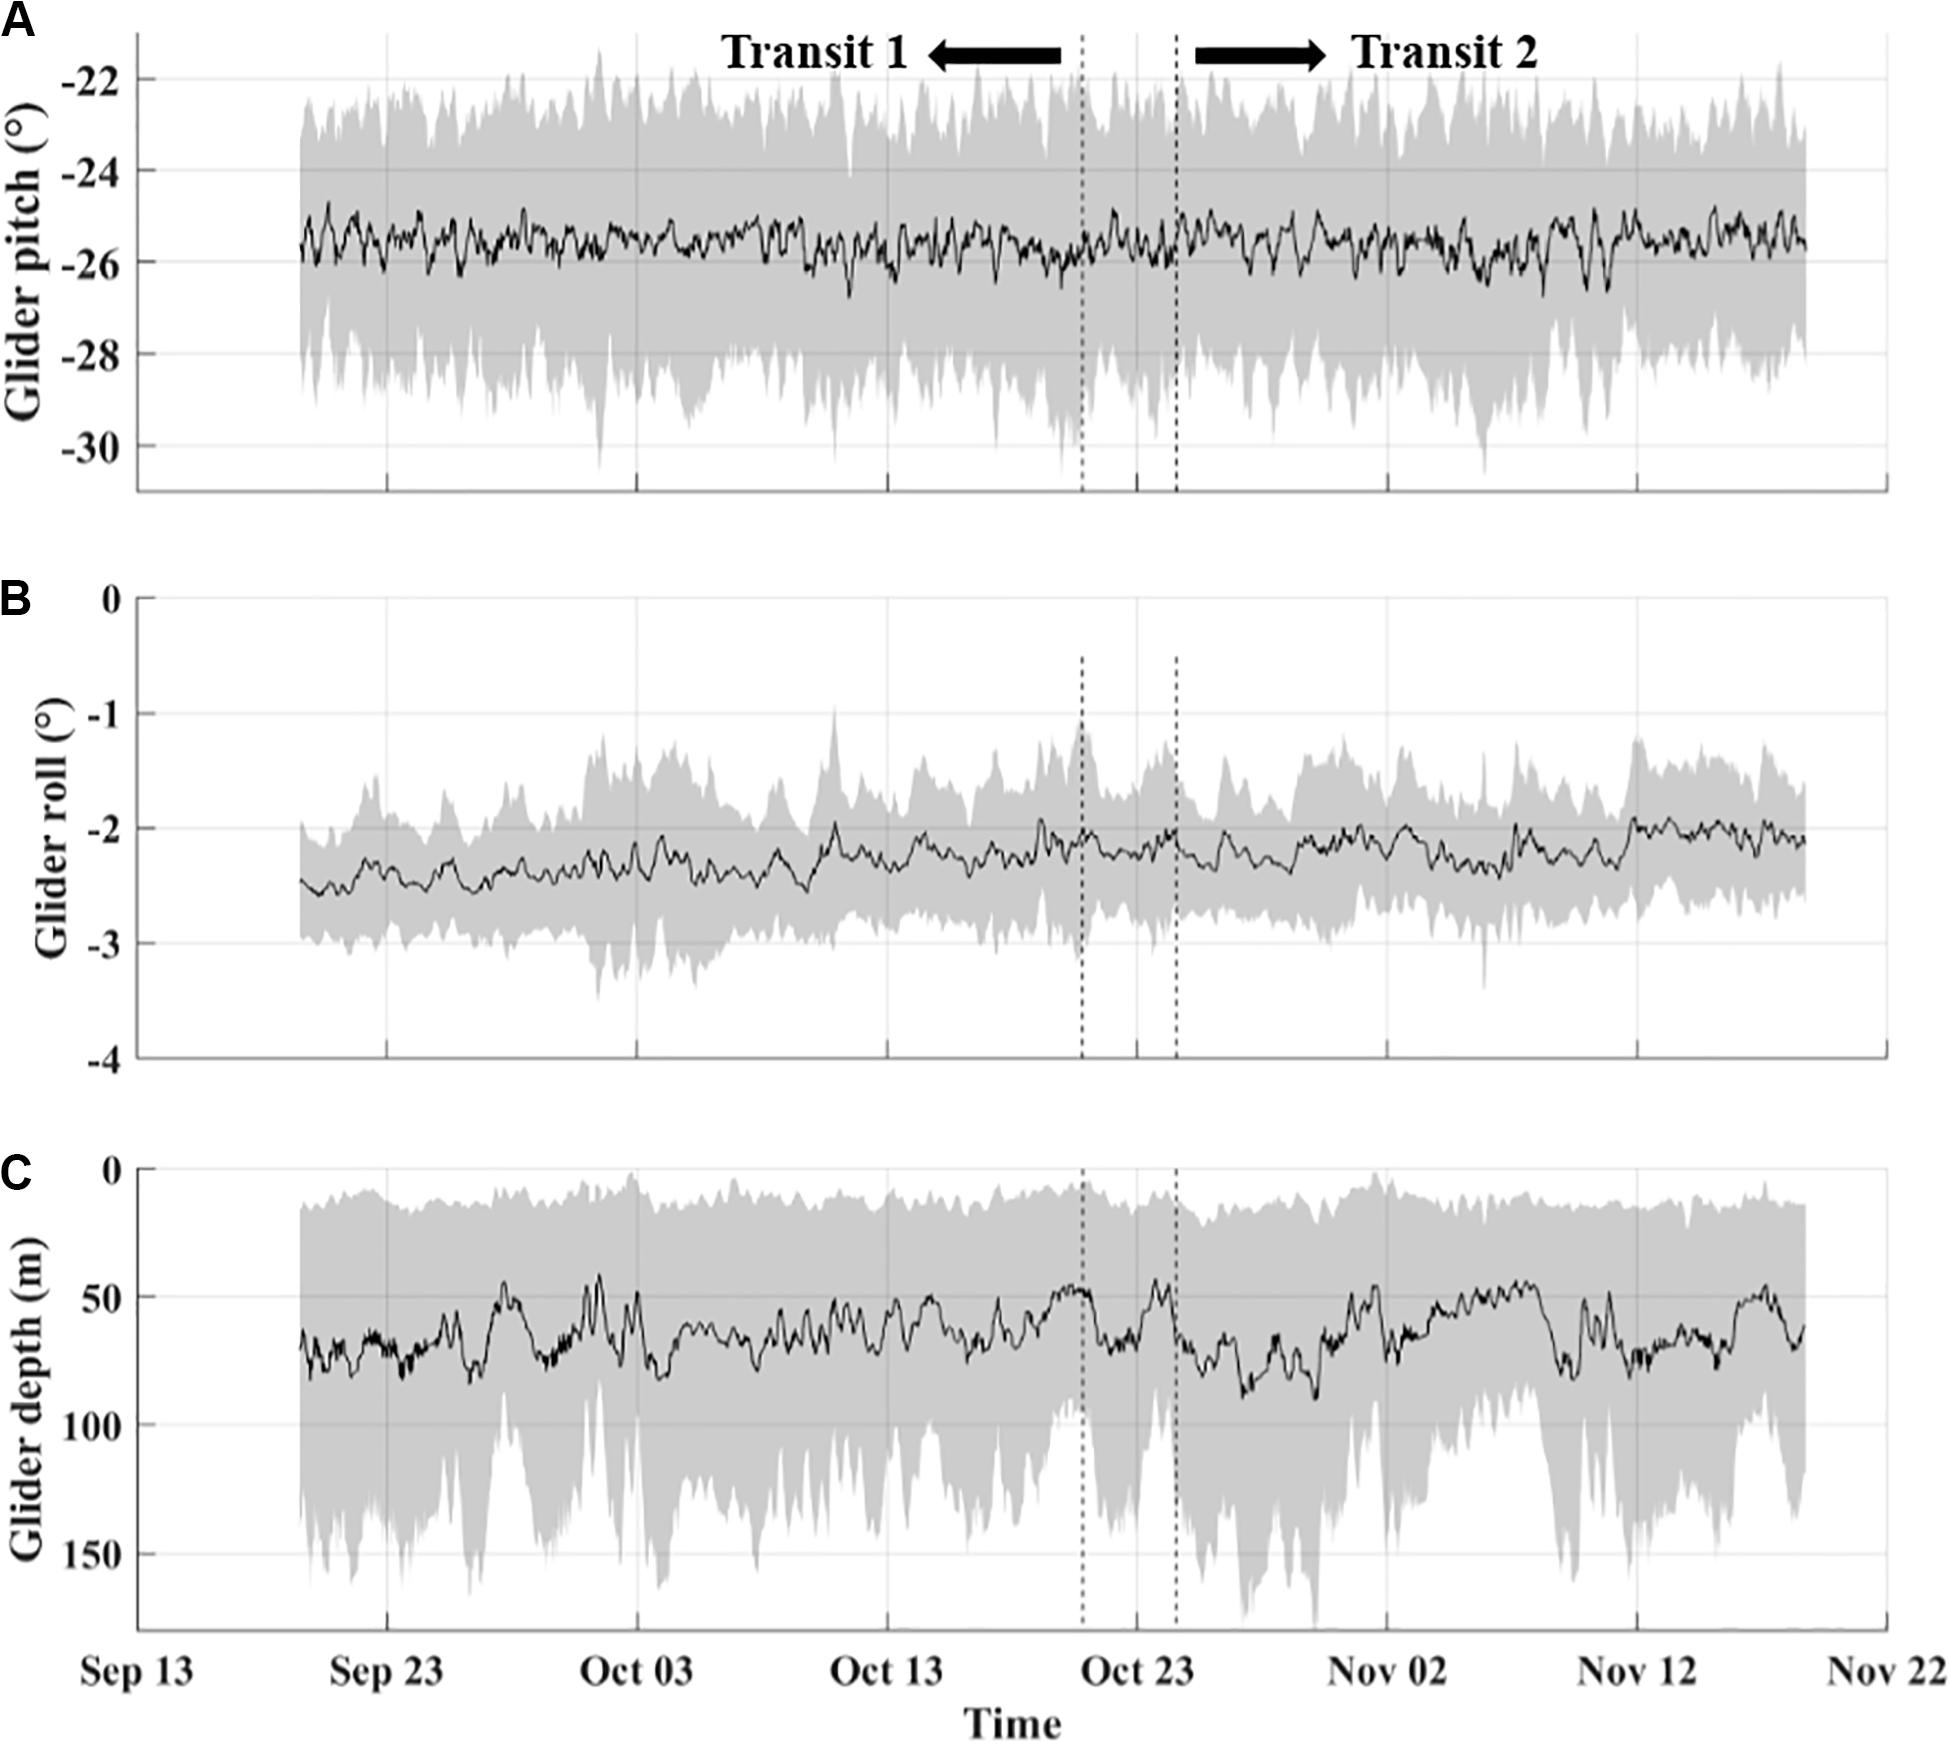
Figure 3. Time series of glider pitch in degrees from horizontal (A), roll in degrees from vertical (B), and median depth in meters (C) during flight throughout the survey in Roseway Basin. Gray regions indicate standard deviations for panels (A,B) and maximum/minimum depths for panel (C). Data shown is linearly interpolated with a window of 10 profiles.
Variation in Water Mass Properties
During the 2014, 2016, and 2017 sampling years, a consistent pattern of seasonal water density variation occurred during the summer to autumn period, where denser warm-salty slope-influenced water was replaced by cooler water. The glider encountered unusually low-density water in Roseway Basin during fall 2015 (Figure 4A), making this survey unique among the other sampling years (2014, 2016, and 2017). Examples are discussed for the 50–100 m depth range, but similar changes were observed throughout the water column. During most of the 2015 survey water densities (σt; kg m–3) were consistently at or below 25 kg m–3 within this depth range. In contrast, σtranged from 25 to 26.2 kg m–3 between August and December in 2014, 2016, and 2017. σt of 25 kg m–3 or lower were only occasionally encountered in the other survey years in that depth range for periods of no longer than several days.
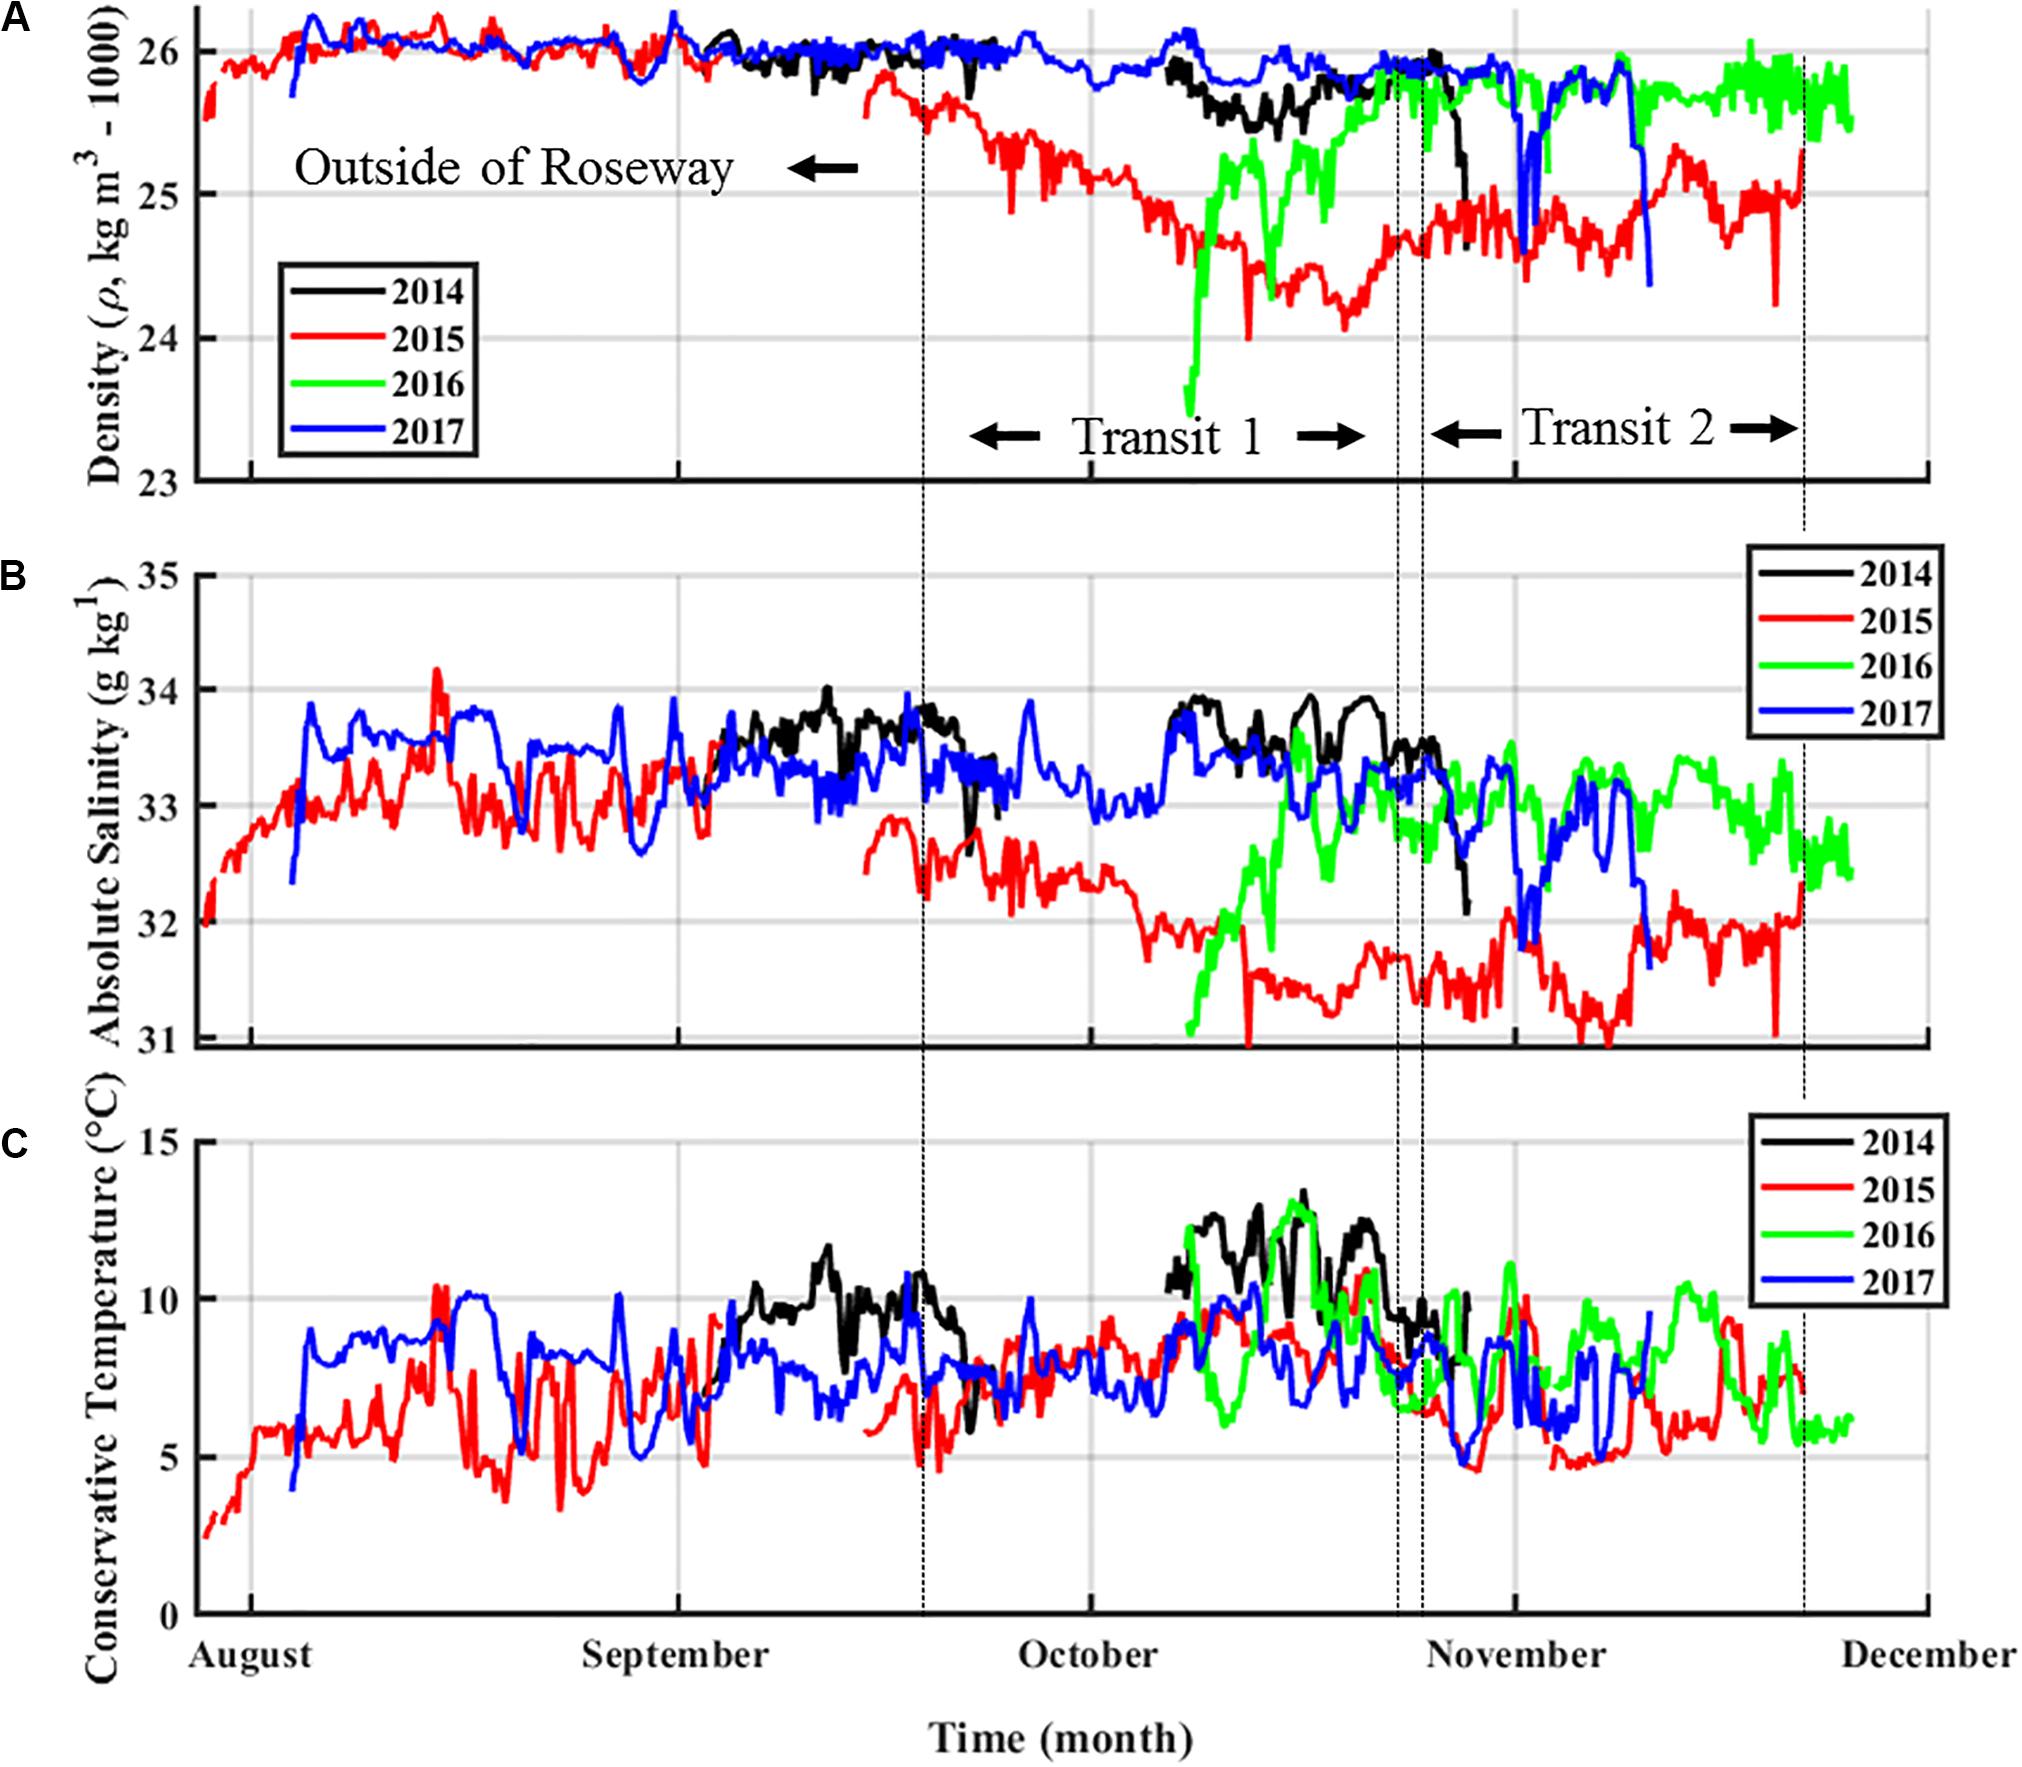
Figure 4. Time series of water density (σt, kg m–3, A), absolute salinity (g kg–1, B), and conservative temperature (°C, C) from August through November from 4 years of glider-based observations in or near Roseway Basin (2014–2017). The red line shows the 2015 survey data. Data is the hourly average from 50–100 m. Vertical dashed lines delineate (from left to right) data outside of Roseway Basin, from Transit 1, and from Transit 2 for the 2015 glider survey only.
When first deployed in 2015, the glider encountered a steady decline in σt (from 25.8 to 24.0 kg m–3) spanning 31 days during Transit 1. Values of σt ≤ 25 kg m–3 then persisted for approximately 33 days through to the end of Transit 2. These low σt were driven by low salinities, which is clearly visible in time series of these properties (i.e., contrast Figure 4B with Figure 4C). Salinity in 2015 followed the same trend as σt, freshening by more than one unit below typical values (∼32 g kg–1 in 2015 vs. ∼33–34 g kg–1 in other years), while variation in temperature (T,°C) was consistent with the range observed in other years (e.g., between ∼5–12°C). The transition toward lower density water at depth throughout Roseway Basin suggests some event caused a fresh water mass to flush the more typical warm-salty continental slope water from the deep basin during fall 2015. Temperature-salinity diagrams clearly show that each transit contained two endmembers: a lighter, fresher endmember and a denser, saltier endmember (Figure 5). Approximate signatures for endmembers in Transit 1 were T = 7.8°C, S = 31.8 g kg–1, and T = 7.7°C, S = 33.9 g kg–1; and for Transit 2 approximate endmember signatures were T = 4.6°C, S = 31.5 g kg–1, and T = 8.8°C, S = 33.3 g kg–1. These signatures are consistent with coastal current and slope water, respectively. During the survey, water throughout the basin and at all depths became generally fresher (by ∼0.3–0.6 g kg–1), and temperatures in mid-depths from around 100–120 m (Figures 5A,B) and closer to shore (Figures 5C,D) became markedly cooler (by ∼3°C). Additionally, the glider measured a cross-shelf spatial gradient in both salinity and temperature, with warmer, saltier water (indicative of continental slope-influenced water) occurring toward the offshore, and cooler, fresher water (indicative of shelf-influenced water) occurring toward the coast (Figures 5C,D). This spatial distribution of temperature-salinity signatures further supports the presence of slope-influenced and shelf-influenced water masses in Roseway Basin.
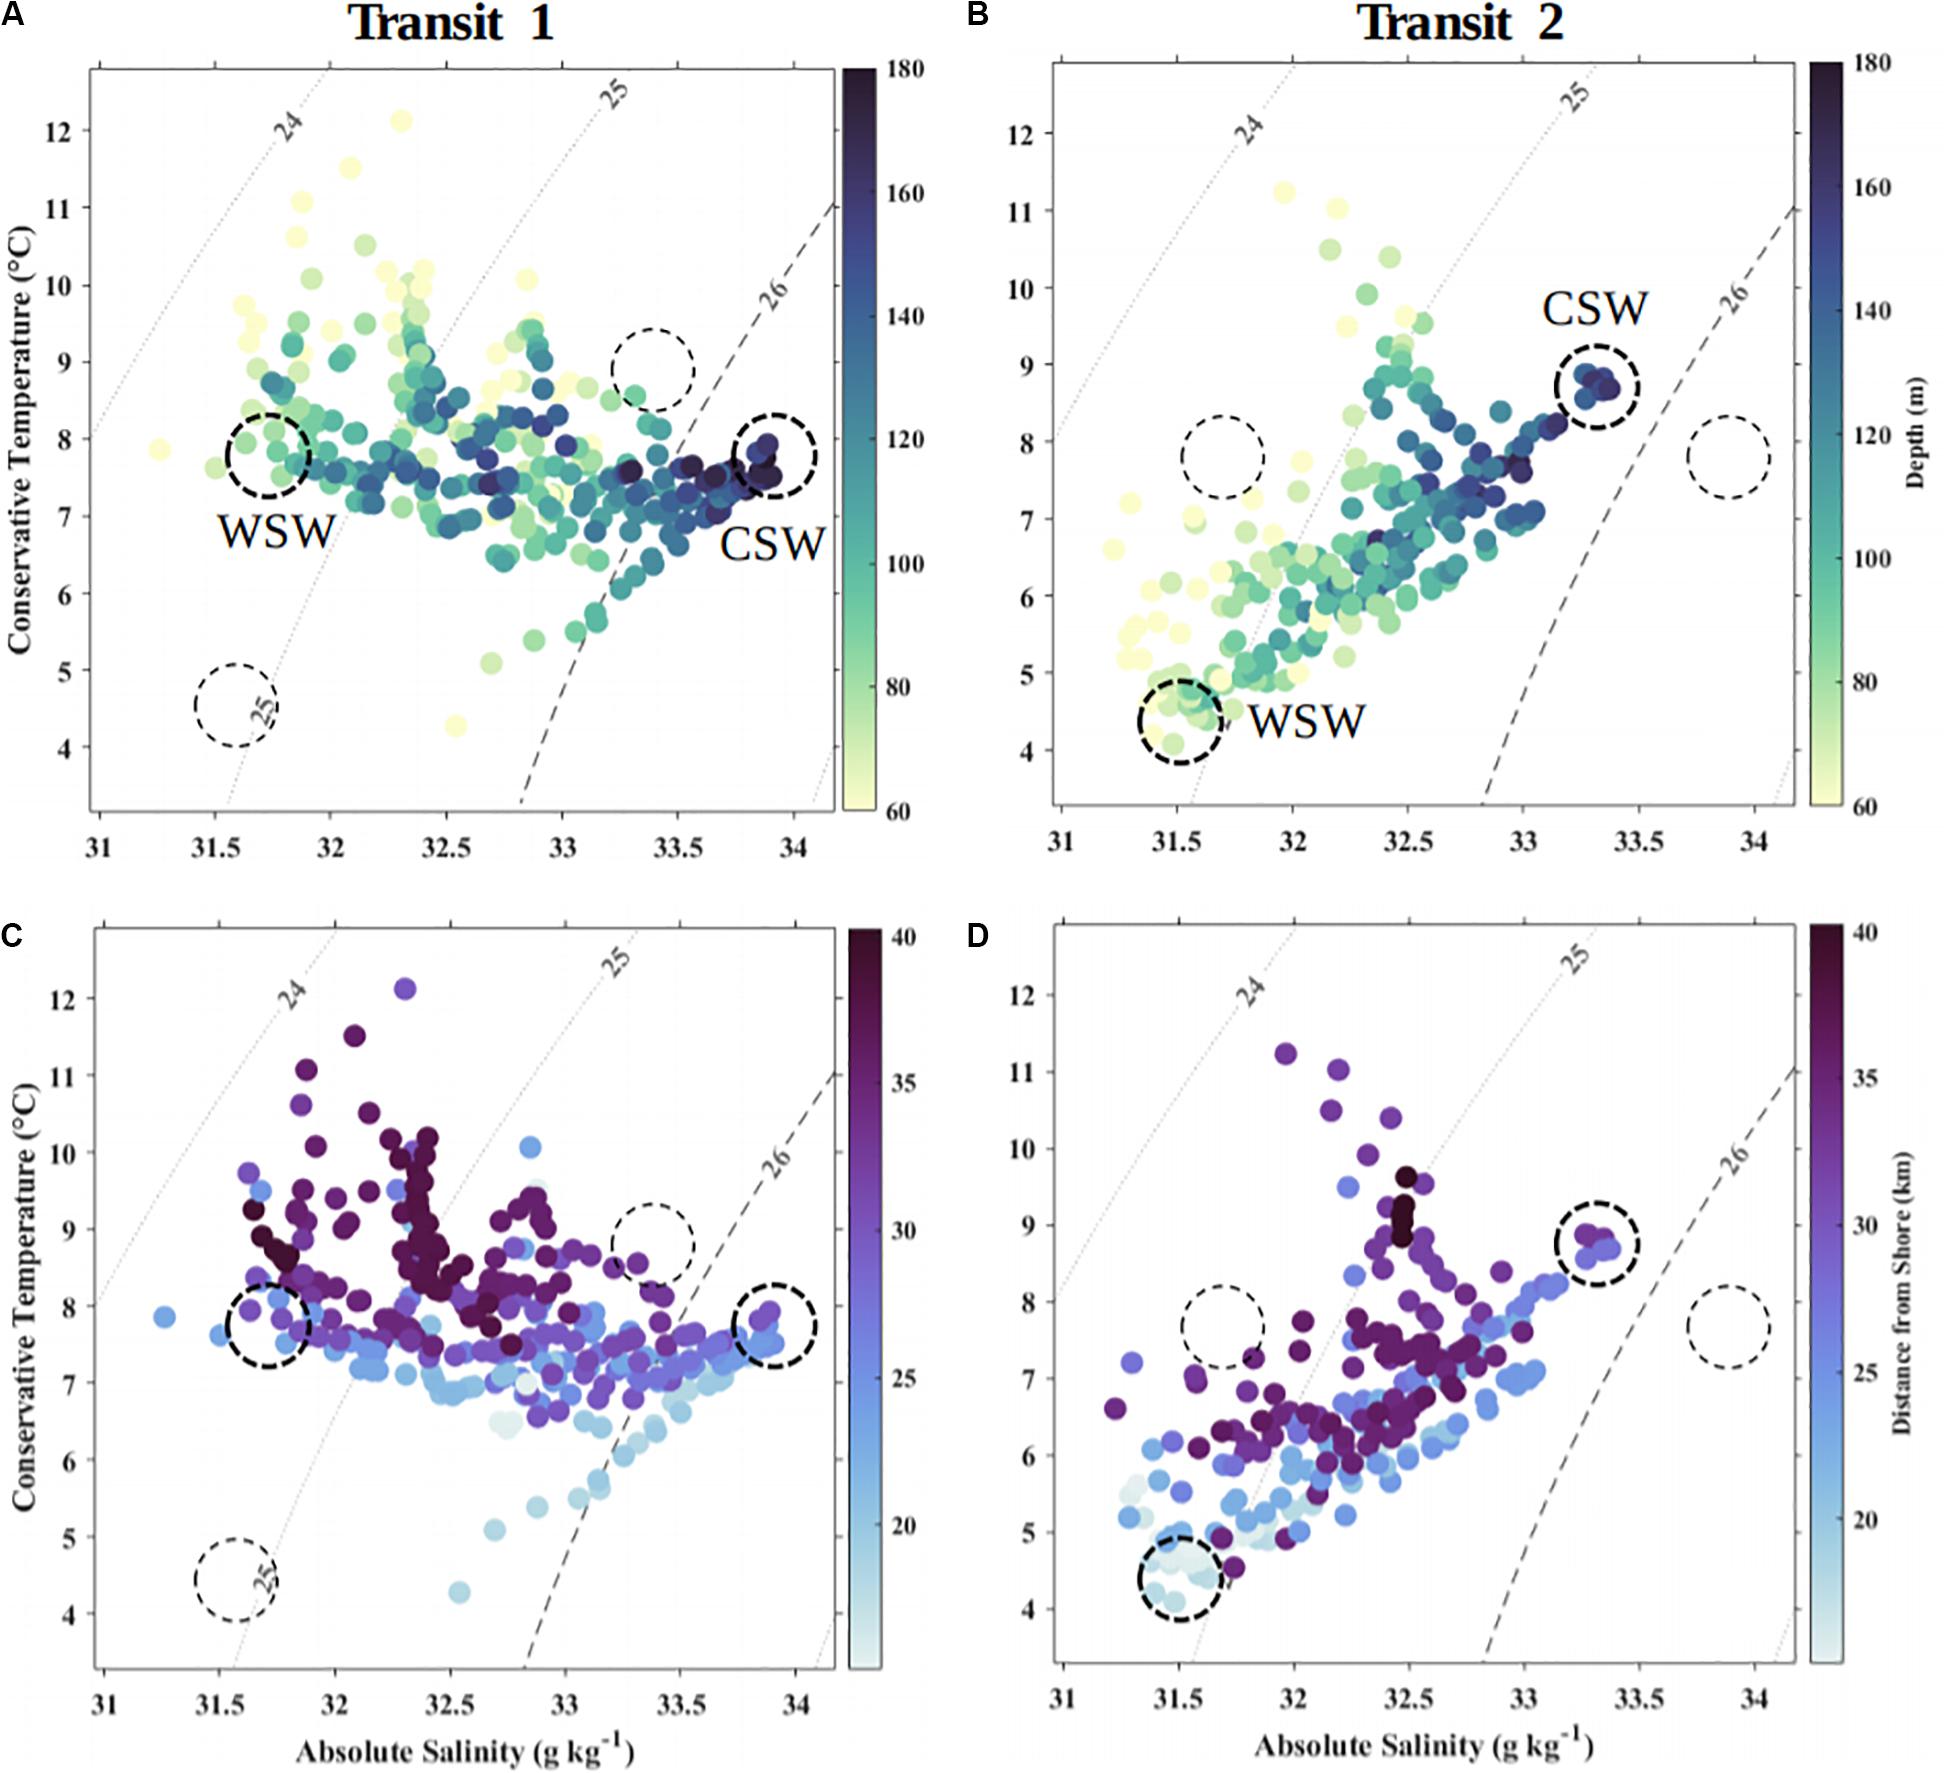
Figure 5. Temperature-salinity diagrams showing variation in seafloor depth (A,B) and across-shelf distance (C,D) between transit 1, September–October 2015 (A,C), and transit 2, October–November 2015 (B,D). Data are daily averages over 10 m vertical bins. Basin sill depth is approximately at the 100 m isobath. Data from depths <60 m are not shown to remove the seasonal atmospheric cooling signal. Water masses referred to in text (WSW and CSW) are indicated with dashed circles; bold dashes indicate the endmembers for the transit shown.
Zooplankton Community Composition
Across both stations sampled by the net tows, euphausiids (by biomass) and copepods (by abundance) were the dominant taxa. Six euphausiid species were found in the net samples: Meganyctiphanes norvegica, Thysanoessa inermis, T. raschii, Euphausia krohnii, T. longicaudata, and Nematoscelis megalops. Euphausiid concentrations at both stations ranged between 0 and 9 ind m–3 among nets. Large copepods (>1.5 mm prosome length) included Calanus finmarchicus stages IV-V and stage VI females, C. hyperboreus stages III-IV, and Metridia sp. Small copepods (≤1.5 mm prosome length) primarily included C. finmarchicus stages I-III, Oithona sp., Paracalanus sp., Pseudocalanus sp., Centropages typicus, and Clausocalanus sp. Concentrations of large copepods ranged from ∼ 35–560 ind m–3, and concentrations of small copepods ranged from ∼ 10–1,030 ind m–3 over both stations and among nets. Other zooplankton groups potentially important to the study (e.g., potential to contribute significantly to acoustic backscatter) included amphipods (Themisto compressa and Parathemisto sp.) and pteropods (Limacina sp.). These other zooplankton groups ranged in concentration from ∼ 0–60 ind m–3 over both stations and among nets. Tables of enumerated taxa counts by net for each BIONESS sampling station are provided in the Supplement (Supplementary Tables S1, S2).
Biomass estimates were made by comparing the net tow abundances to the acoustic observations of the glider (Ruckdeschel, 2017), but these contained considerable uncertainty due to a lack of daytime net tow data that would allow us to distinguish between the two migrating communities of zooplankton.
Modeling the Physical Habitat of Zooplankton
Water mass properties and bathymetry explained a significant portion of variation in SL average Sv and layer thickness in the redundancy analyses (RDAs) for each glider transit (Figure 6, summary parameters and p-values in Table 2). Moreover, the included variables were differently associated with each SL type depending on Transit. The first two canonical axes (CA1 and CA2) explained 34.4% of variation in SL metrics in Transit 1 (T1), and 39.8% of total variation in Transit 2 (T2). Additionally, the first canonical axis in both RDAs accounted for considerably more total variation in the data (T1: 24.2%, T2: 27.1%) than the second canonical axis (T1: 10.2%, T2: 12.7%).
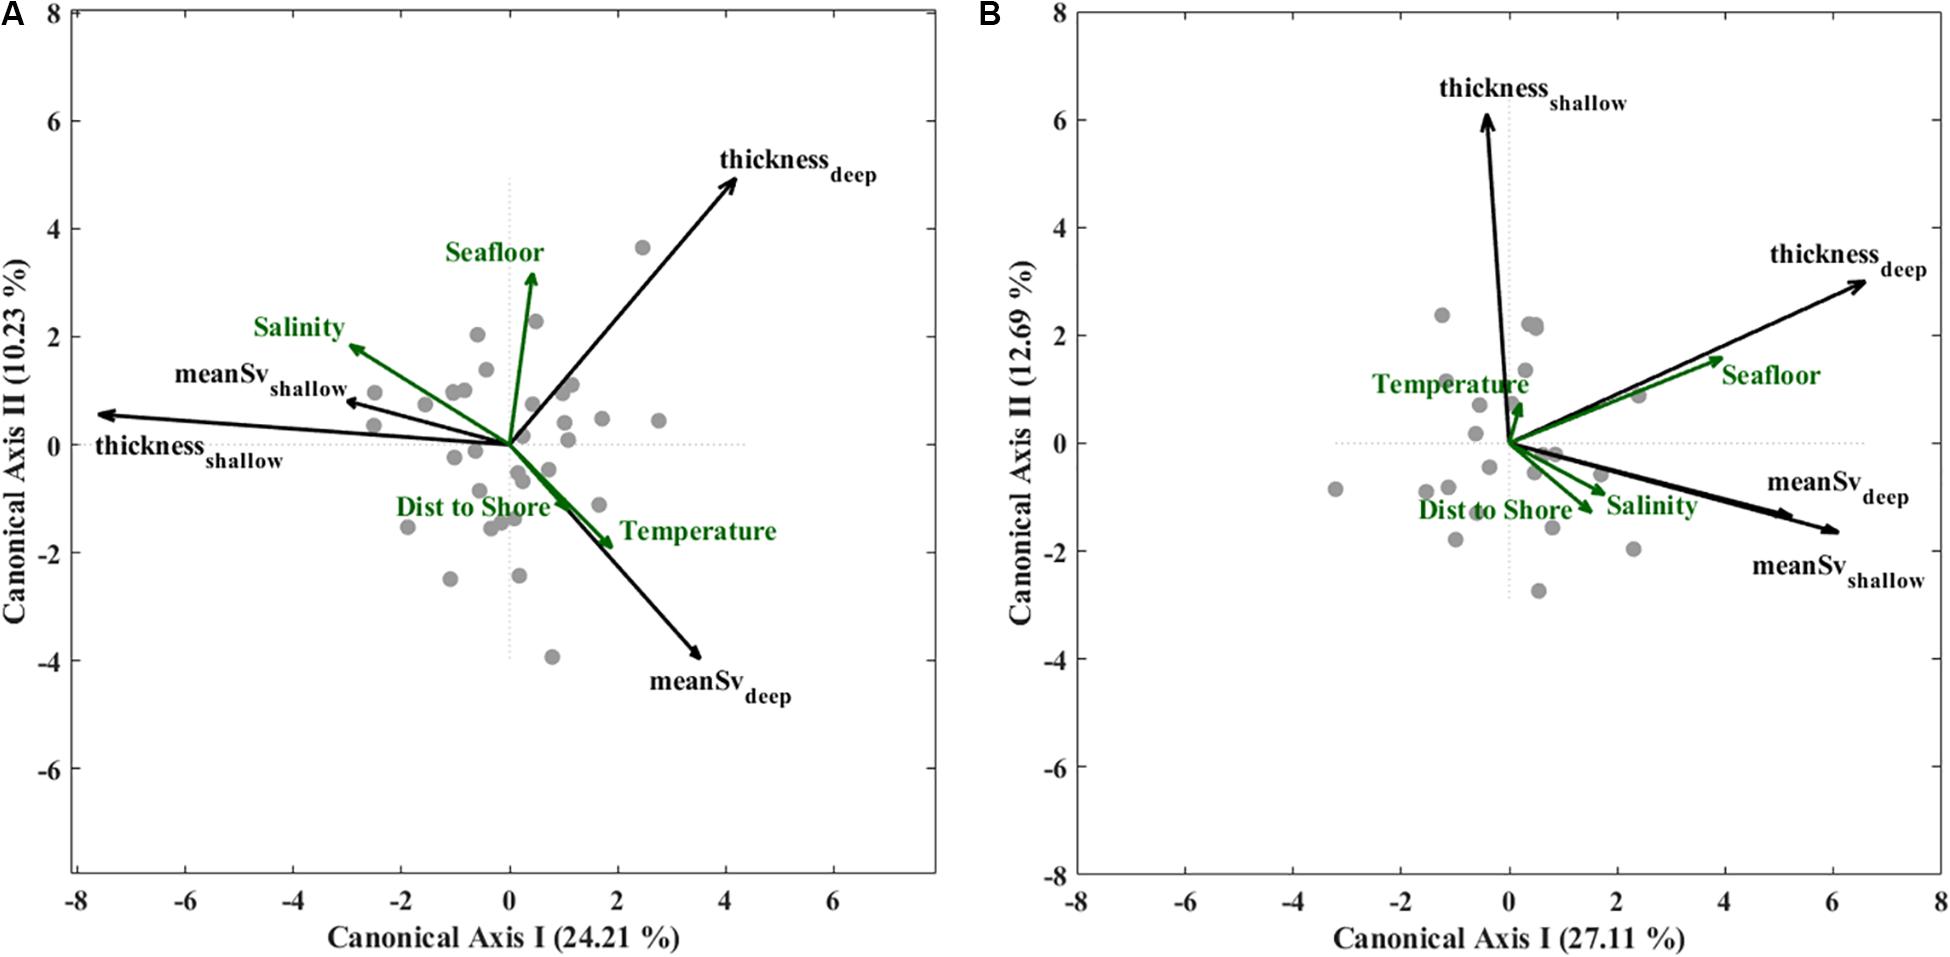
Figure 6. Ordination plots for transit 1 (A) transit 2 (B) of results from redundancy analysis (RDA) for the first two canonical axes applied to two SL descriptive metrics: average Sv (dB re 1 m–1) and integrated Sv (dB layer–1) for shallow and deep SLs (black vector arrows); and for glider-derived environmental variables: deep salinity (g kg–1) and temperature (°C) from 90 to 100 m depth, seafloor depth (m), and across-basin position (km) (green vector arrows). Site scores are shown as gray points in the ordination space.
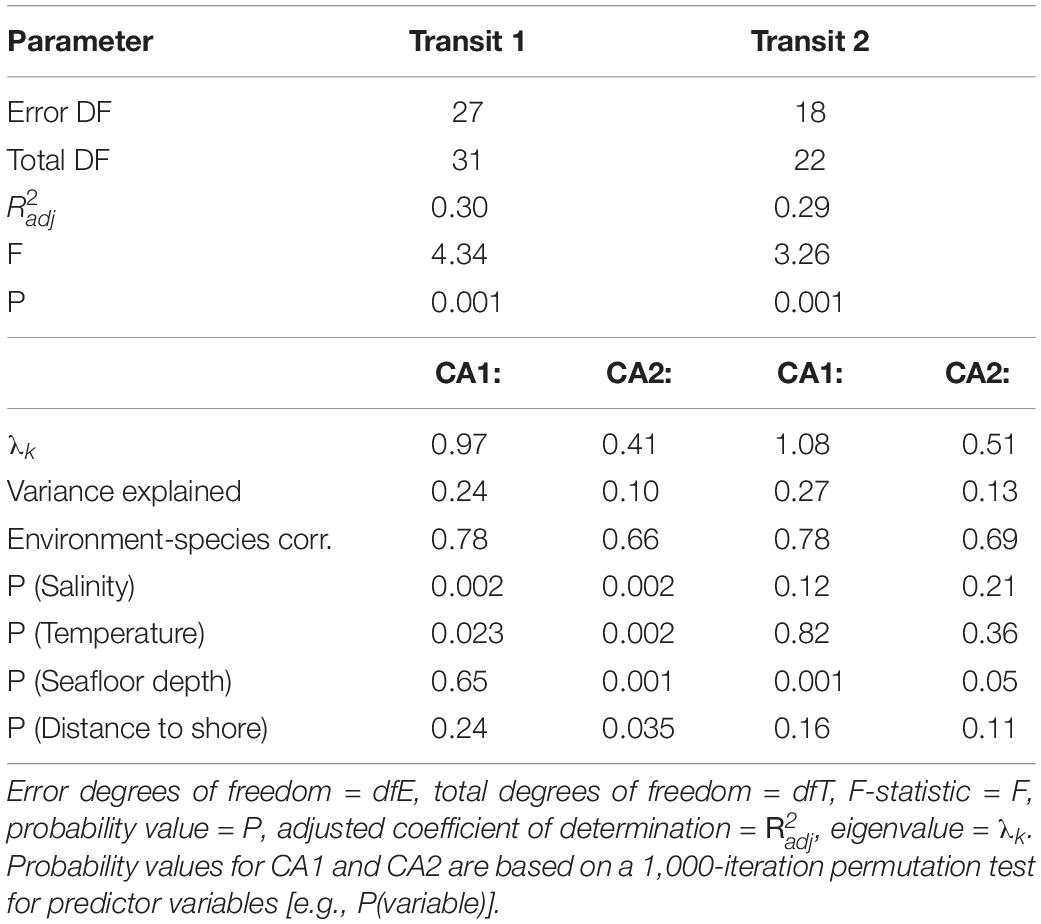
Table 2. Ordination results from the first two canonical axes (CA1 and CA2) for redundancy analyses (RDA) on two descriptive metrics of shallow and deep SLs: average Sv strength (dB re 1 m–1), scattering layer thickness (m); and on for four glider-derived environmental variables: salinity (g kg–1) and temperature (°C) from the 90 to 100 m depth range, seafloor depth (m), and distance to shore (km).
During T1, temperature and salinity were the strongest predictors of SL metrics, and deep and shallow SLs exhibited opposite associations with these two water mass properties (Figure 6A). Bathymetry and cross-shelf distance were less important but still significant on CA2 (Table 2). Shallow SLs were thicker and contained higher average Sv in cooler, saltier water, and did not co-vary with seafloor depth or distance from shore. In contrast, deep SLs contained higher average Sv in warmer, fresher water, and tended to be thicker over deeper bathymetry and at greater cross-shelf distances. Both SL types had higher average Sv when layers were thicker, indicating that integrated Sv (representative of total biomass) would also show similar associations with physical variables.
In T2, the associations between physical variables and SLs were markedly different than those in T1, where variation in seafloor depth was the only significant predictor of variation in SL metrics for both SL depth-levels (Figure 6B). Average Sv in deep and shallow SLs were both highest over deeper bathymetry and neither are well predicted by variation in water mass properties or cross-shelf position. The associations between physical variables and shallow SL metrics were reversed in T2 relative to T1, that is, shallow SLs covaried in the same (rather than opposite) direction as deep SLs with physical variables. Deep SLs still tended to have increased average Sv when layers were thicker, but changes in the average Sv for shallow SLs was not reflected as a change in thickness. This suggests that seafloor depth should also follow increased total biomass in deep layers, but not for shallow layers during T2.
Spatiotemporal Variation in Zooplankton Acoustic Backscatter
Significant variation in SL metrics occurred between glider transits and spatially within each transit (Two-way ANOVA, Table 3 and Figure 7). When the SL types were looked at together as water column-mean and -integrated Sv (hereafter mean Sv and integrated Sv), mean Sv significantly decreased by 40 ± 10% (p < 0.001, Figures 7A,B) and integrated Sv decreased by 50 ± 10% (p < 0.001, Figure 7E) between the first and second transit (T1 and T2). Integrated Sv did not vary significantly between transits and spatial region (Figure 7D), but contrastingly, a pair of two-way interactions diagnosed spatial variation in mean Sv for both bathymetric region (Sill vs. Basin; Figure 7A) and cross-basin region (Seaward vs. Shoreward; Figure 7B). Specifically, mean Sv declined significantly more on the Sill (4.6 ± 0.9-fold decline) than in the Basin (1.4 ± 0.1-fold decline, Transit × Bathymetry p < 0.001, Figure 7A). During T1, mean Sv was not statistically different between Seaward and Shoreward regions, whereas during T2 Sv in the Seaward region was marginally higher than Shoreward (Transit × Region p = 0.03, Figure 7B).
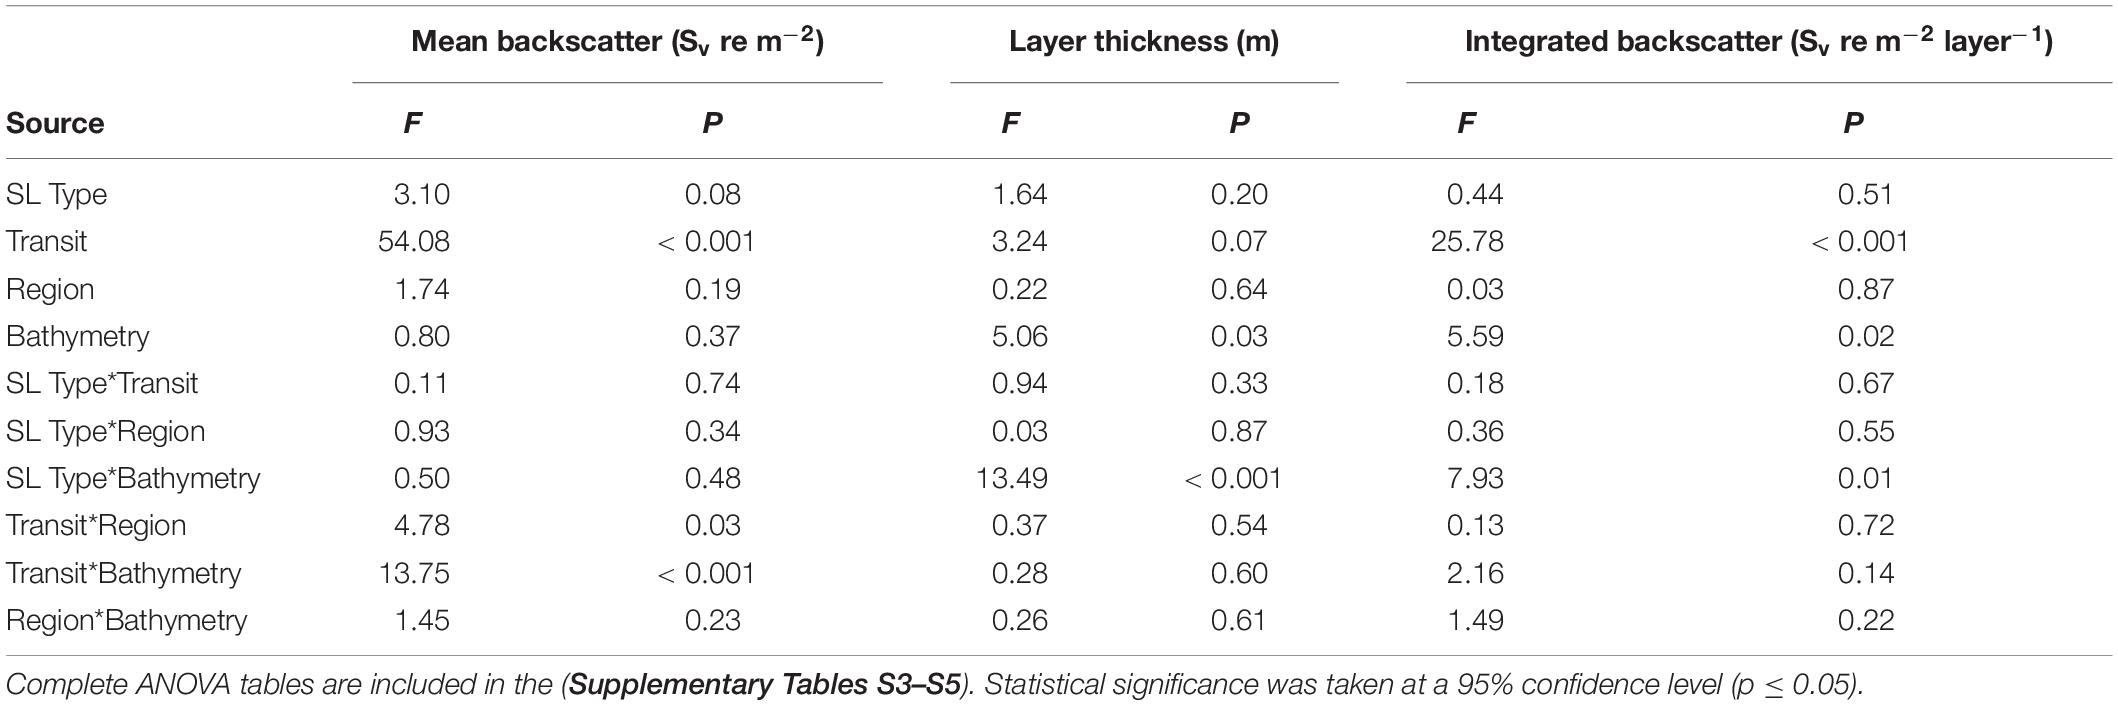
Table 3. ANOVA summary with F-statistics and probability values for three descriptive metrics of shallow and deep SL types for factors of SL type, across-shelf region, bathymetric region, and glider transit.
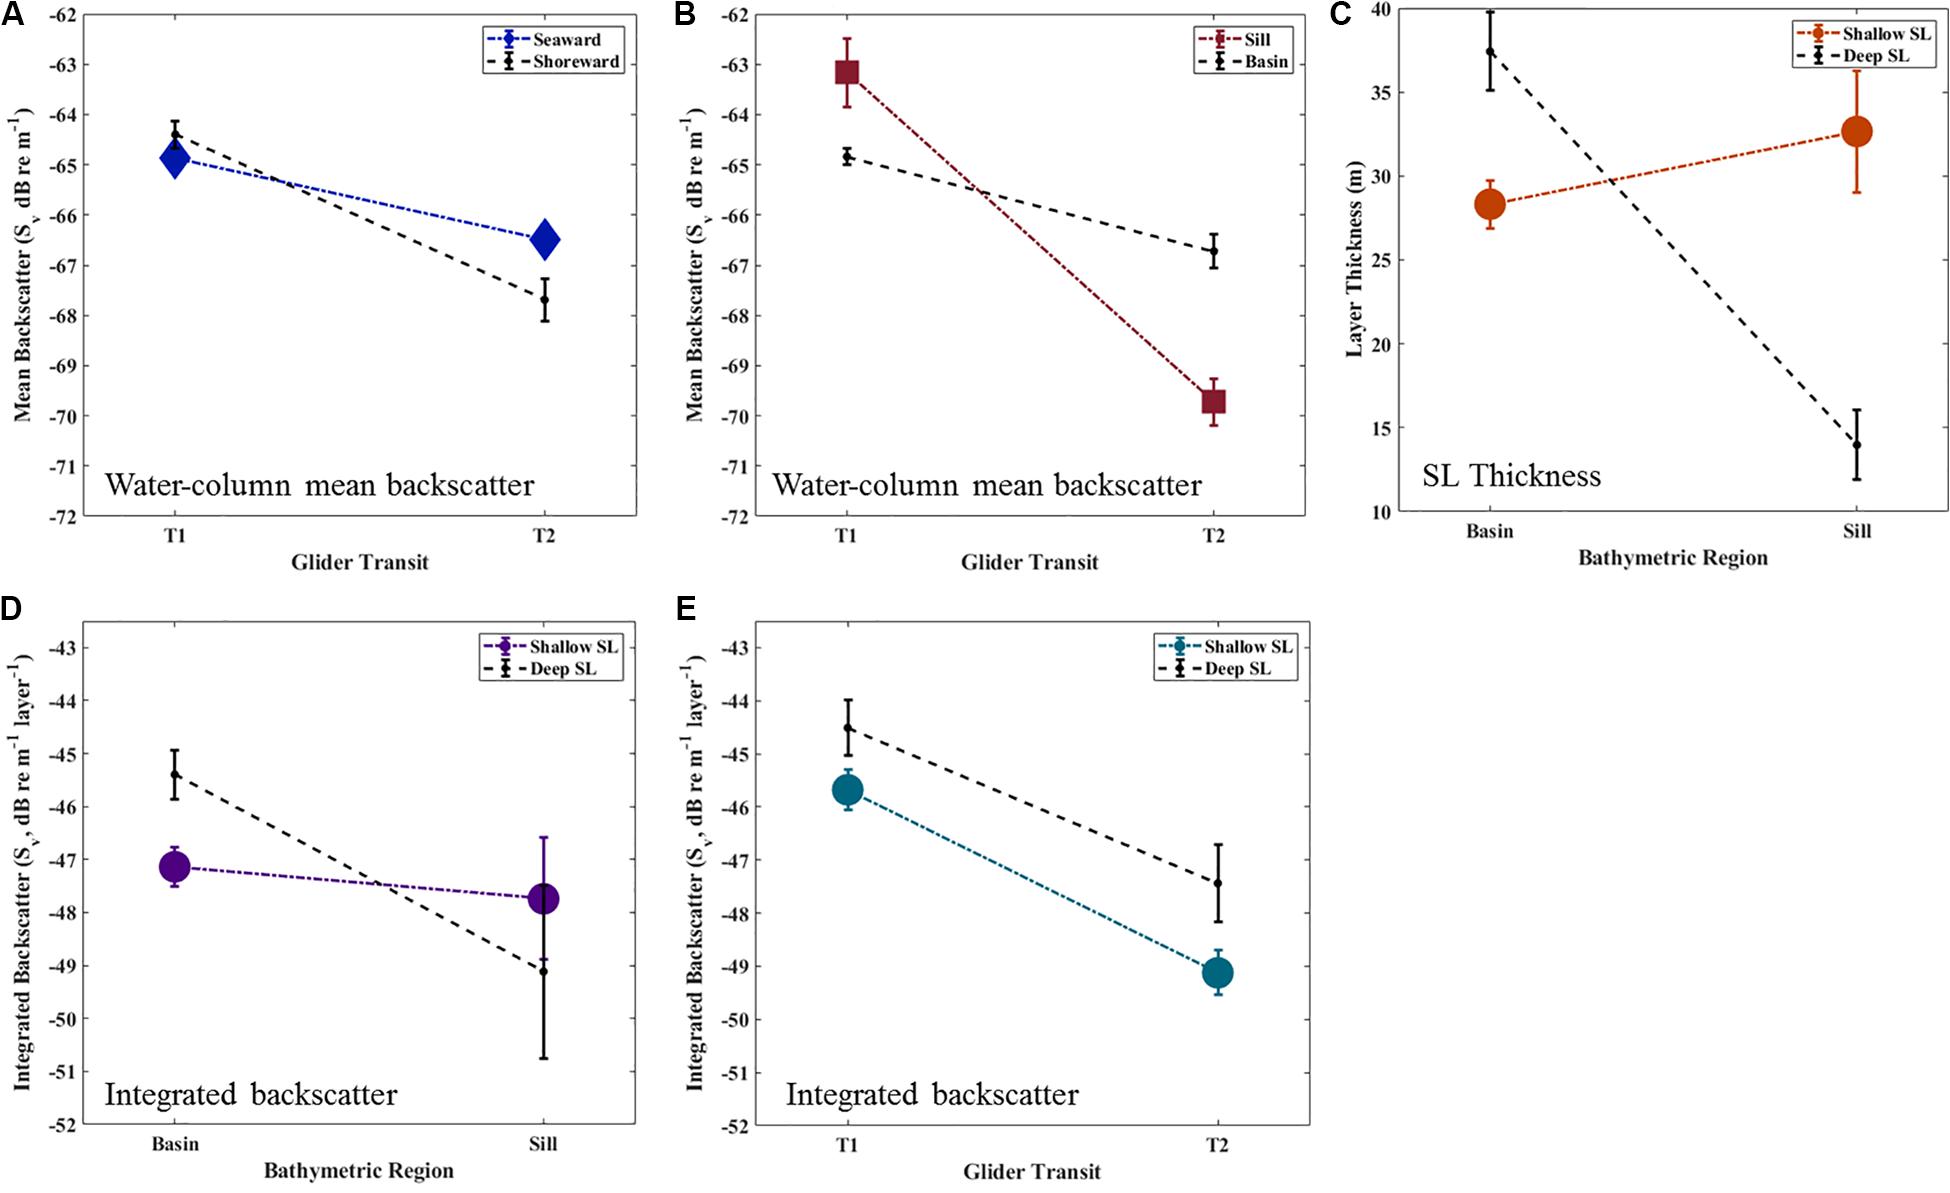
Figure 7. Significant two-way interactions (A–D) and significant within-transit difference (E) with standard error for mean backscatter (Sv, dB re 1 m–1; panels (A,B); averaged over SL type, giving the water column mean), SL thickness (m; C), and integrated backscatter (Sv, dB layer–1; D,E).
When looked at as individual SL types, the primary difference between the shallow and deep SL was variation between bathymetric regions of the basin that were consistent throughout the survey. Specifically, the shallow SL did not significantly vary in either thickness or integrated Sv between Sill and Basin regions between transits, whereas the deep SL tended to be thicker and have higher levels of integrated backscatter in the Basin than over the Sill (Transit × Bathymetry p < 0.01, Figures 7C,D). Within the Basin, the deep SL was 1.3 ± 0.1-fold thicker and contained 1.6 ± 0.2-fold higher integrated Sv than the shallow SL (Figure 7D). In contrast, deep SLs over the sill were only 40 ± 10% thicker and contained 80 ± 30% higher integrated backscatter than shallow SLs in this same region.
Discussion
Variation in Water Mass Composition
Glider surveys during 2014, summer 2015, 2016, and 2017 showed a consistent pattern of evolution of water density in Roseway basin, where the deep basin was initially filled with warm-salty and relatively dense slope water and a gradual decrease in density occurred during the summer to autumn period. During fall 2015, however, a stronger than usual decrease in water density occurred as cooling and freshening throughout the basin. This pattern may result from interannual variability in atmospheric and hydrographic processes that influence characteristics of the Nova Scotia coastal current as observed by the studies discussed below or changes in the path of the coastal current so that it exerted a stronger influence on Roseway Basin.
The North Atlantic Oscillation (NAO) may go some way to explaining the interannual differences in bottom water temperatures in Roseway Basin, but it cannot explain the extremely low deep water densities observed in 2015 (Figure 4). The NAO index measures the strength of winter westerly winds over the Northwest Atlantic, with high values of the index indicating warmer than normal temperature distributions in deep waters across the Western Scotian Shelf into the Gulf of Maine (Petrie, 2007). In 2015 the NAO index was the highest value recorded in the history of the record to date (Hebert et al., 2016). However, given the approximately 1.5 to 2 year lag between the NAO and its effect on the Scotian Shelf (Greene and Pershing, 2003), the relatively average NAO value in 2013 would suggest little effect of NAO on bottom water density in Roseway Basin in 2015. In Fall 2016 and Summer 2017, the temperature was warmer than in other years (Figure 4), which may be influenced by the NAO.
Given that the low bottom water densities were driven primarily by lower than average salinity, variability in the St. Lawrence freshet may be a bigger influence on the 2015 bottom waters in Roseway Basin. The spring freshet is a seasonal hydrographic feature of the NS coastal current that is impacted by the NAO index and winter sea ice coverage. The freshet is essentially a pulse of freshwater runoff from the springtime ice melt in the St. Lawrence River and its river tributaries (Banks, 1966; Galbraith et al., 2013) that typically arrives over the western Scotian Shelf around October (Smith, 1983; Dever et al., 2016). Air temperatures over the Gulf of St. Lawrence (GoSL) during winter 2015 were markedly below normal, leading to a thick surface mixed layer in the GoSL and slightly thicker than normal sea ice cover in the region (Galbraith et al., 2016). Although the timing and strength of the freshet was near-normal, it was colder and the run-off season was longer (Galbraith et al., 2016). Thus, the freshet in 2015 could be expected to present as an unusually long-lasting pulse of cold, fresh, low density water carried in the NS coastal current at downstream locations along the shelf, and this is consistent with the flushing event we observed in Roseway Basin during the fall 2015 survey.
It is, however, the fact that this freshet water appears to have displaced the deep water in Roseway Basin in October of 2015 (Figure 4), and not the properties of the freshet, that sets 2015 apart. This flushing of the deep waters in Roseway Basin has not been observed before, in previous studies (Smith, 1989; Hannah et al., 2001; Patrician and Kenney, 2010; Davies et al., 2014), nor by the gliders in other years (Figure 4). However, cross-shelf spatial variation in the strength of the NS current is consistent with other studies. The NS coastal current at the Halifax Line (HL) has been characterized as extending between 25–75 km offshore (Dever et al., 2016), and as Roseway Basin lies about 120 km downstream from the HL, the current’s influence might broaden over the basin. It appears that, unlike in 2008 when Davies et al. (2014) observed the coastal current wrapping around the margins of the basin, in 2015, likely due to variabilities in current paths, the coastal current penetrated into the deep waters of the basin, causing the freshening and decrease in density we observed in the deep mid-basin.
Zooplankton Community Composition
Characterizing the taxonomic composition of each SL is important for interpreting possible ecological impacts from changes in zooplankton biomass in Roseway Basin, or from any other glider deployment anywhere in the world. The difference in diel vertical migration (DVM) behavior between the deep SL (hereafter, migrating community) and shallow SL (hereafter, non-migrating community) immediately suggests a difference in taxonomic composition between the SL types. Moreover, the opposite water mass associations detected by the RDA, where the non-migrating community was associated with saltier slope-influenced water and the migrating community with the fresher shelf-influenced water, further supports this idea. Additional clues on community composition come from night-time net tows that were collected during the glider’s first transit of the Basin (see Supplementary Tables S1, S2). The tows contained a zooplankton assemblage consistent with that of the literature for common taxa on the western Scotian Shelf (e.g., Corey and Milne, 1987; Cochrane et al., 1991; Johnson et al., 2010), where the most abundant taxa were the dominant representatives of acoustically detectable zooplankton, which included Calanoid copepods, euphausiids, isopods, and pteropods, along with other less-abundant and less acoustically detectable groups (e.g., gelatinous plankton, chaetognaths, and the larvae and eggs of various taxa). Because the migrating community joins the non-migrating community in the surface waters at night, night-time net tow data alone cannot distinguish between distinct communities. By combining the information on migration behavior, net tow data, and water mass associations, several inferences can be made about possible community composition for each zooplankton community.
First, for the migrating community of zooplankton, because all acoustically dominant zooplankton taxa collected in the net samples are known to perform DVM (Supplementary Table S6), the migrating community of zooplankton is likely composed predominately of euphausiids, amphipods, pteropods, and non-diapausing copepods (although these last would contribute little to the total acoustic signal due to their small size). Additionally, and consistent with the migrating community’s association with shelf water in the RDA, the NS coastal current is known to contain high densities of euphausiids, particularly M. norvigica and T. raschii from the outflow from the St. Lawrence Estuary (Simard and Lavoie, 1999; Lavoie et al., 2000). Therefore, the association with fresher, shelf-influenced water also suggests that euphausiids are likely to be important components of the migrating zooplankton community.
It is difficult to infer the community composition of the non-migrating community of zooplankton because the dominant zooplankton taxa collected in the net tows are all known to perform DVM. Several possibilities are that it contains concentrations of either (1) juvenile or (2) reproductively active (non-migrating) M. norvegica, (3) non-migrating ichthyoplankton (e.g., fish larvae), or (4) other non-migrating zooplankton taxa. Regarding the first two possibilities, juvenile M. norvegica tend to inhabit shallower depths than larger adults and have been known to form surface swarms (Brown et al., 1979), however, there is little information for the specific vertical distributions and migration behaviors of these younger age-classes (Kaartvedt, 2010). In addition to smaller euphausiids that may not have begun exhibiting DVM behavior, reproductively active M. norvegica have been observed in highly concentrated (estimated >10 k individuals m–3) non-migrating surface layers in the late summer and early fall in the nearby Bay of Fundy (Nicol, 1984). For the third possibility, the proportionately small size of ichthyoplankton swim bladders may not have presented strong enough individual scattering targets to be filtered out during acoustic data processing. Also, while low abundances of fish larvae were present in the net tows, strong net avoidance behavior is common, such that net samples can give gross underestimates of in situ concentrations. The most likely taxa, if ichthyoplankton are a component of the shallow SL, are capelin and myctophids (lanternfish), which are abundant across the Scotian Shelf (Sameoto, 1982; Halliday et al., 2015). However, most marine ichthyoplankton are known to perform some form of DVM (Neilson and Perry, 1990), and while some evidence shows an association between ichthyoplankton concentrations and saltier (e.g., slope-influenced) water (see Reiss et al., 2000), water mass associations for these particular taxa are not well understood. Facing these difficulties, daytime net sampling is needed to make confident inferences about the membership of the non-migrating zooplankton community.
Hypotheses to Explain Basin-Scale Spatiotemporal Patterns in Zooplankton Communities
Returning to the low-density basin flushing event, the associations and spatiotemporal patterns revealed by the habitat analysis suggest two aspects of a mechanism that can explain the variation observed in both zooplankton communities. First, the coincident timing of the significant decrease in backscatter across both the migrating and non-migrating communities of zooplankton and the low-density basin flushing event implies that previously resident slope-influenced water and the associated zooplankton (in terms of both abundance and biomass) within was flushed from the Basin and replaced with coastal water containing lower zooplankton abundances. And second, because both zooplankton communities experienced a similar decrease (ca. 50% loss of concentration each), advection appears to have been a driver of variation in both diel- and non-diel vertically migrating communities, regardless of their vertical position. Advective transport in the NS coastal current is a well-established vector for transporting zooplankton biomass over the Scotian Shelf from the Cabot Straight to the Gulf of Maine in its flow (Herman et al., 1991; Sameoto and Herman, 1992). Other processes that could explain the strong decrease in zooplankton backscatter include (1) seasonal variation in DVM behavior by different zooplankton taxa (see review by Frost, 1988) and (2) seasonal mortality due to the life history characteristics (i.e., Roe and Griffiths, 1993). However, for (1) we see no change in the background backscatter level or strong difference in the decrease between migrating and migrating communities; and for (2) this pattern typically occurs over the course of a season, rather than in a matter of weeks. Given the similarity in reduced backscatter for both communities and the period over which the change took place, advective transport is the most likely driver of this pattern of variation.
Second, spatial variation in where and how much the backscatter from each zooplankton community decreased suggests that the Basin may act as a spatial refuge, at least for the migrating community of zooplankton, as it is deeper than the surrounding shelf and also due to its position offshore of the typical path of the NS coastal current on the shelf. The vertical and horizontal components of the hypothesis, which we propose to explain the spatial variation in reduced zooplankton backscatter during a basin flushing event, are illustrated conceptually in Figure 8. The two components are (1) effects of deep bathymetry sheltering vertical migrants from flushing during daytime, and (2) that weaker coastal current at greater distance from shore also flushes fewer of these migrating animals. We’ll treat these aspects separately, starting with the vertical gradient in current strength.
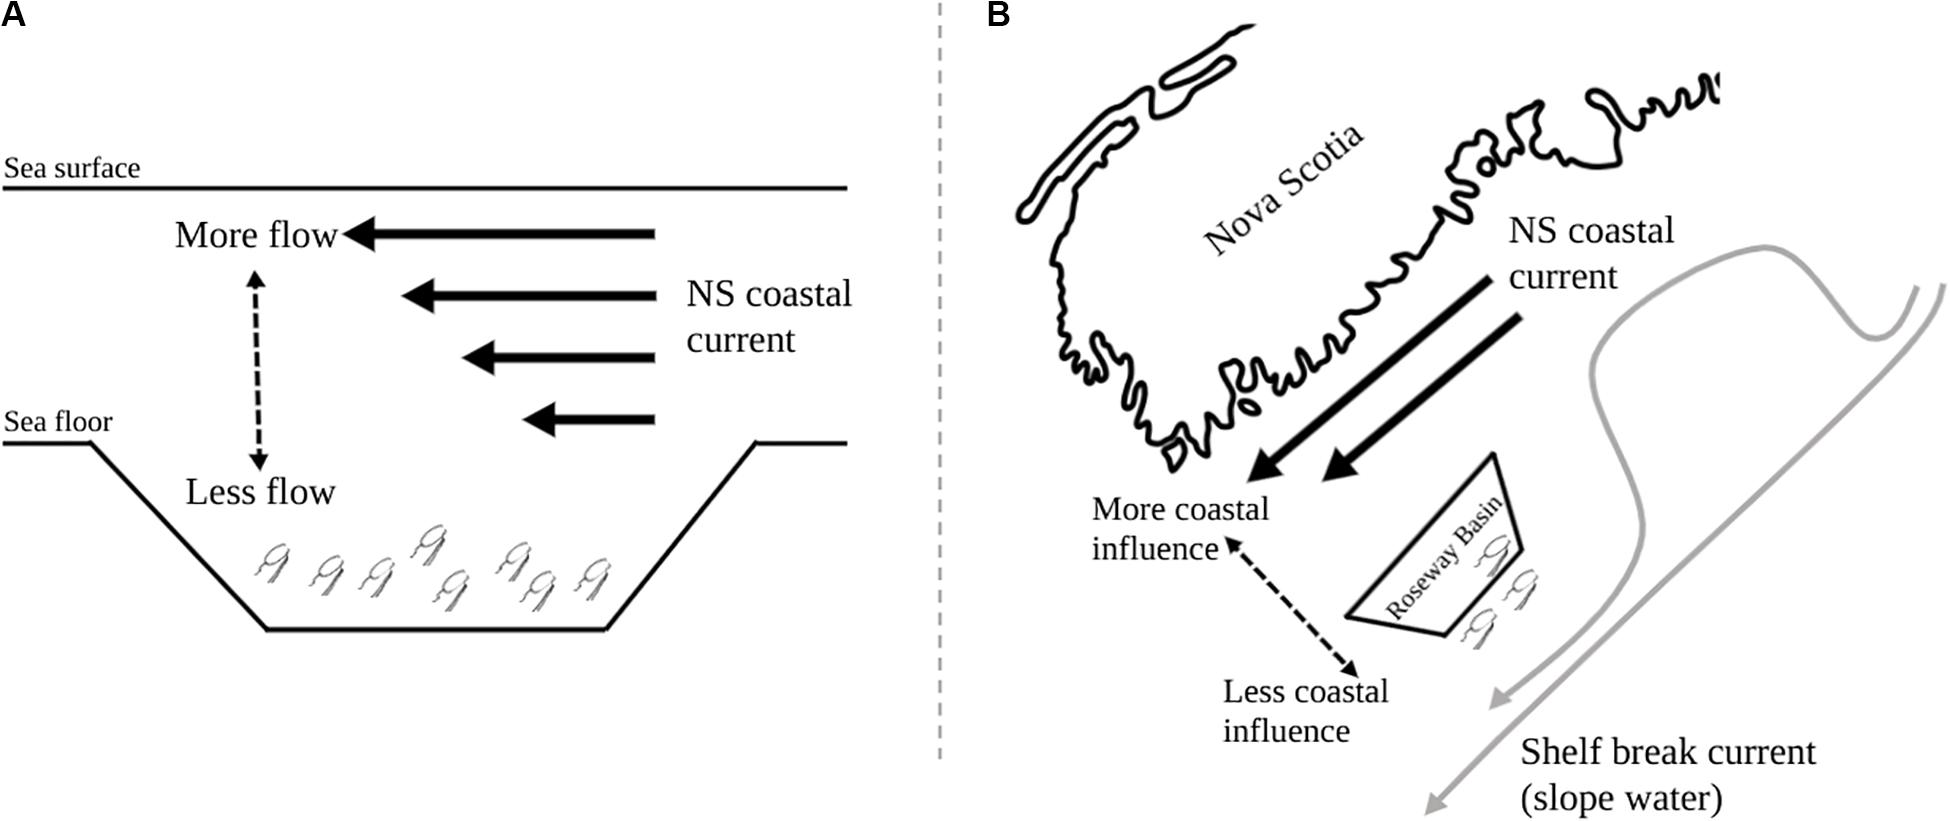
Figure 8. Conceptual diagram of the NS coastal current over Roseway Basin showing (A) the vertical gradient in current strength where stronger flow is in surface waters, and (B) the horizontal gradient in current strength where stronger flow occurs closer to shore.
The effects of stratified flow on the horizontal distributions of vertically migrating zooplankton is a long-known process (Hardy and Gunther, 1935). Multiple studies have found that zooplankton can be retained in basins on the Scotian Shelf (i.e., Herman et al., 1991; Baumgartner et al., 2003), and more generally associations are well-established between zooplankton concentrations and distributions in relation to abrupt topography, larger sill features, and strong hydrographic gradients that occur at types of features [see review by Genin (2004)]. Turning to the present study, the habitat analysis showed that seafloor depth was an important positive predictor of stronger zooplankton backscatter and thicker scattering layers throughout the glider survey, especially for the migrating zooplankton community. Before the flushing event, zooplankton backscatter between the shallow sill and over the deep basin was comparable. After the flushing event, however, the highest levels of backscatter were found over the deep basin. The non-migrating community could be expected to experience a greater effect of advection from the NS current than the migrating community due to the inability to access the deep-basin refuge where current strength is reduced. While the survey-wide decrease in backscatter across both migrating and non-migrating zooplankton communities was similar, the levels of backscatter across bathymetric regions was more uniform for the non-migrating community than for the migrating community, which is consistent with the above expectation of how non-migrators would respond to the flushing event.
In addition to the deep basin region acting as a vertical spatial refuge for migrating zooplankton, it may also act as a horizontal refuge due to the circulation patterns on the shelf. There was greater change in the mean backscatter of both zooplankton communities over the shoreward side of the basin throughout the flushing event, but again this effect was particularly strong for the migrating community. A cross-shelf gradient in the influence of the coastal current is consistent with the idea that this current flows mostly along the coast and the shelf break current flows mostly along the shelf break, with only occasional excursions into Roseway Basin. If the change in water properties comes from an excursion of the coastal current into Roseway Basin, its effect would be felt most strongly on the shoreward side.
Conclusion
The 2015 glider survey sets a baseline for ongoing seasonal and interannual glider surveys in Roseway Basin and the surrounding Scotian Shelf region. Our observations raise several ecologically relevant questions and testable hypotheses to motivate these future studies. It is important to determine if the water mass associations for each zooplankton community and the apparent retention of the vertical migrating community persist at scales of a season or longer. Therefore, repeated sampling with comparable datasets of Roseway Basin and other locations across the shelf over longer periods of time and at other times of year are needed. Moreover, because many zooplankton predators direct their foraging efforts at specific zooplankton taxa, further investigation is required to verify the taxonomic composition of the migrating and non-migrating zooplankton communities. Though the retention of vertically migrating zooplankton within Roseway Basin is at the relatively small, mesoscale, it holds relevance to the carbon cycling and biogeochemistry in the wider northwest Atlantic region. With this in mind, the relationships identified through the habitat analysis could be used to predict zooplankton concentrations and distributions in Roseway Basin and potentially other locations on the Scotian Shelf, as well as in predictive modeling for locations where net samples or acoustic surveys are not feasible. To that end, the use of modeling, such as the analysis presented here, to ecologically contextualize the glider data holds the potential to be a powerful tool for future work in the Scotian Shelf region and beyond.
Data Availability Statement
The raw data supporting the conclusions of this article will be made available by the authors, without undue reservation.
Author Contributions
GR performed all the data analysis and prepared the manuscript text. KD and TR provided assistance with data analysis, and provided feedback and assistance with finishing the manuscript text. All authors contributed to the article and approved the submitted version.
Funding
This research was made possible through funding from the Marine Environmental Observation Prediction and Response Network (MEOPAR) to the Whale Habitat and Listening Experiment (WHaLE). Funding for the research presented here was also provided by the Transatlantic Graduate Research School (TOSST) in support of the graduate work of GR.
Conflict of Interest
The authors declare that the research was conducted in the absence of any commercial or financial relationships that could be construed as a potential conflict of interest.
Acknowledgments
The authors wish to acknowledge the tireless support of the Ocean Tracking Network glider team, including Richard Davis, Adam Comeau, Sue L’Orsa, Brad Covey, and Fred Whoriskey during the glider missions described here. The authors also extend special thanks to the Department of Fisheries and Oceans for providing the supplementary zooplankton net data from the 2015 Atlantic Zone Monitoring Program (AZMP) cruise.
Supplementary Material
The Supplementary Material for this article can be found online at: https://www.frontiersin.org/articles/10.3389/fmars.2020.00627/full#supplementary-material
Footnotes
- ^ This depth cut-off was selected because shallow SLs typically did not occur deeper, and the shallower max gap values is less than that applied to deeper data because deep SLs tended to be more heterogenous.
References
Banks, R. E. (1966). The cold layer in the Gulf of St. Lawrence. J. Geophys. Res. 71, 1603–1610. doi: 10.1029/jz071i006p01603
Baumgartner, M. F., Cole, T. V., Clapham, P. J., and Mate, B. R. (2003). North Atlantic right whale habitat in the lower Bay of Fundy and on the SW Scotian Shelf during 1999-2001. Mar. Ecol. Prog. Ser. 264, 137–154. doi: 10.3354/meps264137
Benoit-Bird, K. J., Patrick, W. T., Waluk, C. M., Barth, J. A., Wangen, I., McGill, P., et al. (2018). Equipping an underwater glider with a new echosounder to explore ocean ecosystems. Limnol. Oceanogr. Methods 16, 734–749. doi: 10.1002/lom3.10278
Brickman, D., Wang, Z., and DeTracey, B. (2016). Variability of current streams in Atlantic Canadian waters: a model study. Atmos. Ocean 54, 218–229. doi: 10.1080/07055900.2015.1094026
Brown, R. G. B., Barker, S. P., and Gaskin, D. E. (1979). Daytime surface swarming by meganyctiphanes norvegica (M. sars)(Crustacea, Euphausiacea) off brier island, bay of fundy. Can. J. Zool. 57, 2285–2291. doi: 10.1139/z79-297
Calbet, A. (2001). Mesozooplankton grazing effect on primary production: a global comparative analysis in marine ecosystems. Limnol. Oceanogr. 46, 1824–1830. doi: 10.4319/lo.2001.46.7.1824
Carruthers, E., Lewis, K., McCue, T., and Westley, P. (2008). Generalized Linear Models: Model Selection, Diagnostics, And Overdispersion. St. John’s City: Memorial University of Newfoundland.
Chiba, S., Di Lorenzo, E., Davis, A., Keister, J. E., Taguchi, B., Sasai, Y., et al. (2013). Large-scale climate control of zooplankton transport and biogeography in the kuroshio-oyashio extension region. Geophys. Res. Lett. 40, 5182–5187. doi: 10.1002/grl.50999
Cochrane, N. A., Sameoto, D., Herman, A. W., and Neilson, J. (1991). Multiple-frequency acoustic backscattering and zooplankton aggregations in the inner Scotian Shelf basins. Can. J. Fish. Aquat. Sci. 48, 340–355. doi: 10.1139/f91-046
Corey, S., and Milne, W. R. (1987). Recurrent groups of zooplankton in the Bay of Fundy and southwest Nova Scotia regions, Canada. Can. J. Zool. 65, 2400–2405. doi: 10.1139/z87-361
Cotté, C., and Simard, Y. (2005). Formation of dense krill patches under tidal forcing at whale feeding hot spots in the St. Lawrence Estuary. Mar. Ecol. Prog. Ser. 288, 199–210. doi: 10.3354/meps288199
Davies, K. T., Ross, T., and Taggart, C. T. (2013). Tidal and subtidal currents affect deep aggregations of right whale prey, Calanus spp., along a shelf-basin margin. Mar. Ecol. Prog. Ser. 479, 263–282. doi: 10.3354/meps10189
Davies, K. T., Taggart, C. T., and Smedbol, R. K. (2014). Water mass structure defines the diapausing copepod distribution in a right whale habitat on the Scotian Shelf. Mar. Ecol. Prog. Ser. 497, 69–85. doi: 10.3354/meps10584
Dever, M., Hebert, D., Greenan, B. J. W., Sheng, J., and Smith, P. C. (2016). Hydrography and coastal circulation along the Halifax Line and the connections with the Gulf of St. Lawrence. Atmos. Ocean 54, 199–217. doi: 10.1080/07055900.2016.1189397
Francois, R. E., and Garrison, G. R. (1982). Sound absorption based on ocean measurements. Part II: boric acid contribution and equation for total absorption. J. Acoust. Soc. Am. 72, 1879–1890. doi: 10.1121/1.388673
Frank, K. T., Petrie, B., Fisher, J. A., and Leggett, W. C. (2011). Transient dynamics of an altered large marine ecosystem. Nature 477:86. doi: 10.1038/nature10285
Frost, B. W. (1988). Variability and possible adaptive significance of diel vertical migration in Calanus pacificus, a planktonic marine copepod. Bull. Mar. Sci. 43, 675–694.
Galbraith, P. S., Chassé, J., Caverhill, C., Nicot, P., Gilbert, D., Pettigrew, B., et al. (2016). Physical Oceanographic Conditions in the Gulf of St. Lawrence in 2015. DFO Can. Sci. Advis. Sec. Res. Doc. 2016/056. v + 90 p. Available online at: http://www.dfo-mpo.gc.ca/csas-sccs/Publications/ResDocs-DocRech/2016/2016_056-eng.pdf (accessed April 10, 2020).
Galbraith, P. S., Chassé, J., Gilbert, D., Larouche, P., Brickman, D., Pettigrew, B., et al. (2013). Physical Oceanographic Conditions in the Gulf of St. Lawrence in 2012. Thousand Oaks, CA: Canadian Science Advisory Secretariat.
Garau, B., Ruiz, S., Zhang, W. G., Pascual, A., Heslop, E., Kerfoot, J., et al. (2011). Thermal lag correction on Slocum CTD glider data. J. Atmos. Ocean. Technol. 28, 1065–1071. doi: 10.1175/jtech-d-10-05030.1
Genin, A. (2004). Bio-physical coupling in the formation of zooplankton and fish aggregations over abrupt topographies. J. Mar. Syst. 50, 3–20. doi: 10.1016/j.jmarsys.2003.10.008
Greene, C. H., Meyer-Gutbrod, E., Monger, B. C., McGarry, L. P., Pershing, A. J., Belkin, I. M., et al. (2013). Remote climate forcing of decadal-scale regime shifts in Northwest Atlantic shelf ecosystems. Limnol. Oceanogr. 58, 803–816. doi: 10.4319/lo.2013.58.3.0803
Greene, C. H., and Pershing, A. J. (2003). The flip-side of the North Atlantic oscillation and modal shifts in slope-water circulation patterns. Limnol. Oceanogr. 48, 319–322. doi: 10.4319/lo.2003.48.1.0319
Guihen, D., Fielding, S., Murphy, E. J., Heywood, K. J., and Griffiths, G. (2014). An assessment of the use of ocean gliders to undertake acoustic measurements of zooplankton: the distribution and density of Antarctic krill (Euphausia superba) in the Weddell Sea. Limnol. Oceanogr. 12, 373–389. doi: 10.4319/lom.2014.12.373
Halliday, R. G., Clark, K. J., and Themelis, D. E. (2015). The biology of Benthosema glaciale and Ceratoscopelus maderensis (Myctophidae) in the Slope Sea off Nova Scotia, Canada. J. Northw. Atl. Fish. Sci. 47, 75–89.
Hannah, C. G., Shore, J. A., Loder, J. W., and Naimie, C. E. (2001). Seasonal circulation on the western and central scotian shelf. J. Phys. Oceanogr. 31, 591–615. doi: 10.1175/1520-0485(2001)031<0591:scotwa>2.0.co;2
Hardy, A. C., and Gunther, E. R. (1935). The plankton of the South Georgia whaling grounds and adjacent waters, 1926-27. Discov. Rep. 11:456.
Hays, G. C. (2003). A review of the adaptive significance and ecosystem consequences of zooplankton diel vertical migrations. Hydrobiologia 503, 163–170. doi: 10.1023/b:hydr.0000008476.23617.b0
Hebert, D., Pettipas, R., Brickman, D., and Dever, M. (2016). Meteorological, sea ice and physical oceanographic conditions on the Scotian Shelf and in the Gulf of Maine during 2015. DFO Can. Sci. Advis. Sec. Res. Doc. 2016/083. v + 49 p. Available online at: https://waves-vagues.dfo-mpo.gc.ca/Library/40575214.pdf (accessed April 10, 2020).
Herman, A. W., Sameoto, D. D., Shunnian, C., Mitchell, M. R., Petrie, B., and Cochrane, N. (1991). Sources of zooplankton on the Nova Scotia shelf and their aggregations within deep-shelf basins. Continent. Shelf Res. 11, 211–238. doi: 10.1016/0278-4343(91)90066-f
Hunt, G. L. Jr., Drinkwater, K. F., Arrigo, K., Berge, J., Daly, K. L., Danielson, S., et al. (2016). Advection in polar and sub-polar environments: Impacts on high latitude marine ecosystems. Prog. Oceanogr. 149, 40–81. doi: 10.1016/j.pocean.2016.10.004
Johnson, C., Curtis, A., Pepin, P., and Runge, J. (2010). Spatial patterns in zooplankton communities and their seasonal variability in the northwest Atlantic. Atlant. Zone Monitor. 9, 27–31.
Kaartvedt, S. (2010). Diel vertical migration behaviour of the northern krill (Meganyctiphanes norvegica Sars). Adv. Mar. Biol. 57, 255–275. doi: 10.1016/b978-0-12-381308-4.00009-1
Keister, J. E., Di Lorenzo, E., Morgan, C. A., Combes, V., and Peterson, W. T. (2011). Zooplankton species composition is linked to ocean transport in the Northern California current. Glob. Chang. Biol. 17, 2498–2511. doi: 10.1111/j.1365-2486.2010.02383.x
Krumhansl, K. A., Head, E. J., Pepin, P., Plourde, S., Record, N. R., Runge, J. A., et al. (2018). Environmental drivers of vertical distribution in diapausing Calanus copepods in the Northwest Atlantic. Prog. Oceanogr. 162, 202–222. doi: 10.1016/j.pocean.2018.02.018
Lavoie, D., Simard, Y., and Saucier, F. J. (2000). Aggregation and dispersion of krill at channel heads and shelf edges: the dynamics in the Saguenay-St. Lawrence Marine Park. Can. J. Fish. Aquat. Sci. 57, 1853–1869. doi: 10.1139/f00-138
Loder, J. W. (1998). The coastal ocean off northeastern North America: a large-scale view. Sea 11, 105–138.
Lumpkin, R., and Speer, K. (2003). Large-scale vertical and horizontal circulation in the North Atlantic Ocean. J. Phys. Oceanogr. 33, 1902–1920. doi: 10.1175/1520-0485(2003)033<1902:lvahci>2.0.co;2
Medwin, H., and Clay, C. S. (1997). Fundamentals of Acoustical Oceanography. Cambridge, MA: Academic press.
Mitra, A., Castellani, C., Gentleman, W. C., Jónasdóttir, S. H., Flynn, K. J., Bode, A., et al. (2014). Bridging the gap between marine biogeochemical and fisheries sciences; configuring the zooplankton link. Prog. Oceanogr. 129, 176–199. doi: 10.1016/j.pocean.2014.04.025
Neilson, J. D., and Perry, R. I. (1990). Diel vertical migrations of marine fishes: an obligate or facultative process? Adv. Mar. Biol. 26, 115–168. doi: 10.1016/s0065-2881(08)60200-x
Nicol, S. (1984). Population structure of daytime surface swarms of the euphausiid Meganyctiphanes norvegica in the Bay of Fundy. Mar. Ecol. Prog. Ser. Oldendorf. 18, 241–251. doi: 10.3354/meps018241
Ohashi, K., Sheng, J., Thompson, K. R., Hannah, C. G., and Ritchie, H. (2009). Numerical study of three-dimensional shelf circulation on the Scotian Shelf using a shelf circulation model. Continent. Shelf Res. 29, 2138–2156. doi: 10.1016/j.csr.2009.08.005
Ohman, M. D., Davis, R. E., Sherman, J. T., Grindley, K. R., Whitmore, B. M., Nickels, C. F., et al. (2019). Zooglider: an autonomous vehicle for optical and acoustic sensing of zooplankton. Limnol. Oceanogr. 17, 69–86. doi: 10.1002/lom3.10301
Pace, M. L., Findlay, S. E., and Lints, D. (1992). Zooplankton in advective environments: the Hudson River community and a comparative analysis. Can. J. Fish. Aquat. Sci. 49, 1060–1069. doi: 10.1139/f92-117
Patrician, M. R., and Kenney, R. D. (2010). Using the continuous plankton recorder to investigate the absence of North Atlantic right whales (Eubalaena glacialis) from the Roseway Basin foraging ground. J. Planktn. Res. 32, 1685–1695. doi: 10.1093/plankt/fbq073
Petrie, B. (2007). Does the North Atlantic oscillation affect hydrographic properties on the canadian atlantic continental shelf? Atmos. Ocean 45, 141–151. doi: 10.3137/ao.450302
Petrie, B., and Yeats, P. (2000). Annual and interannual variability of nutrients and their estimated fluxes in the Scotian Shelf-Gulf of Maine region. Can. J. Fish. Aquat. Sci. 57, 2536–2546. doi: 10.1139/f00-235
Powell, J. R., and Ohman, M. D. (2015). Changes in zooplankton habitat, behavior, and acoustic scattering characteristics across glider-resolved fronts in the Southern California current system. Prog. Oceanogr. 134, 77–92. doi: 10.1016/j.pocean.2014.12.011
Prairie, J. C., Sutherland, K. R., Nickols, K. J., and Kaltenberg, A. M. (2012). Biophysical interactions in the plankton: a cross-scale review. Limnol. Oceanogr. 2, 121–145. doi: 10.1215/21573689-1964713
Reid, D., Scalabrin, C., Petitgas, P., Masse, J., Aukland, R., Carrera, P., et al. (2000). Standard protocols for the analysis of school based data from echo sounder surveys. Fish. Res. 47, 125–136. doi: 10.1016/s0165-7836(00)00164-8
Reiss, C. S., Panteleev, G., Taggart, C. T., Sheng, J., and DeYoung, B. (2000). Observations on larval fish transport and retention on the Scotian Shelf in relation to geostrophic circulation. Fish. Oceanogr. 9, 195–213. doi: 10.1046/j.1365-2419.2000.00139.x
Ringelberg, J. (2009). Diel Vertical Migration Of Zooplankton In Lakes And Oceans: Causal Explanations And Adaptive Significances. Berlin: Springer.
Roe, H. S. J., and Griffiths, G. (1993). Biological information from an acoustic Doppler current profiler. Mar. Biol. 115, 339–346. doi: 10.1007/bf00346352
Ross, T., Craig, S. E., Comeau, A., Davis, R., Dever, M., and Beck, M. (2017). Blooms and subsurface phytoplankton layers on the Scotian shelf: insights from profiling gliders. J. Mar. Syst. 172, 118–127. doi: 10.1016/j.jmarsys.2017.03.007
Ruckdeschel, G. (2017). Euphausiid Ecology And Water Mass Associations In Roseway Basin Measured From An Ocean Glider. Masters thesis, Dalhousie University, Halifax Regional Municipality.
Rudnick, D. L. (2016). Ocean research enabled by underwater gliders. Ann. Rev. Mar. Sci. 8, 519–541. doi: 10.1146/annurev-marine-122414-033913
Sameoto, D. D. (1982). Zooplankton and micronekton abundance in acoustic scattering layers on the Nova Scotian slope. Can. J. Fish. Aquat. Sci. 39, 760–777. doi: 10.1139/f82-104
Sameoto, D. D., and Herman, A. W. (1992). Effect of the outflow from the Gulf of St. Lawrence on Nova Scotia shelf zooplankton. Can. J. Fish. Aquat. Sci. 49, 857–869. doi: 10.1139/f92-096
Sameoto, D. D., Jaroszynski, L. O., and Fraser, W. B. (1980). BIONESS, a new design in multiple net zooplankton samplers. Can. J. Fish. Aquat. Sci. 37, 722–724. doi: 10.1139/f80-093
Schofield, O., Kohut, J., Aragon, D., Creed, L., Graver, J., Haldeman, C., et al. (2007). Slocum gliders: robust and ready. J. Field Robot. 24, 473–485. doi: 10.1002/rob.20200
Simard, Y., and Lavoie, D. (1999). The rich krill aggregation of the Saguenay-St. Lawrence marine park: hydroacoustic and geostatistical biomass estimates, structure, variability, and significance for whales. Can. J. Fish. Aquat. Sci. 56, 1182–1197. doi: 10.1139/f99-063
Sinclair, M., Power, M., Head, E., Li, W. K., McMahon, M., Mohn, R., et al. (2015). Eastern Scotian Shelf trophic dynamics: a review of the evidence for diverse hypotheses. Prog. Oceanogr. 138, 305–321. doi: 10.1016/j.pocean.2015.09.005
Smith, P. C. (1983). The mean and seasonal circulation off southwest Nova Scotia. J. Phys. Oceanogr. 13, 1034–1054. doi: 10.1175/1520-0485(1983)013<1034:tmasco>2.0.co;2
Smith, P. C. (1989). Seasonal and interannual variability of current, temperature and salinity off southwest Nova Scotia. Can. J. Fish. Aquat. Sci. 46, s4–s20. doi: 10.1139/f89-275
Smith, P. C., Petrie, B., and Mann, C. R. (1978). Circulation, variability, and dynamics of the Scotian Shelf and slope. J. Fish. Board Canada 35, 1067–1083. doi: 10.1139/f78-170
Spear, A., Duffy-Anderson, J., Kimmel, D., Napp, J., Randall, J., and Stabeno, P. (2019). Physical and biological drivers of zooplankton communities in the Chukchi Sea. Polar Biol. 42, 1107–1124. doi: 10.1007/s00300-019-02498-0
Testor, P., DeYoung, B., Rudnick, D. L., Glenn, S., Hayes, D., Lee, C., et al. (2019). OceanGliders: a component of the integrated GOOS. Front. Mar. Sci. 6:422. doi: 10.3389/fmars.2019.00422
Tremblay, M. J., and Roff, J. C. (1983). Community gradients in the Scotian Shelf zooplankton. Can. J. Fish. Aquat. Sci. 40, 598–611. doi: 10.1139/f83-079
Turner, J. T. (2004). The importance of small planktonic copepods and their roles in pelagic marine food webs. Zool. Stud. 43, 255–266.
Vagle, S., Foote, K. G., Trevorrow, M. V., and Farmer, D. M. (1996). A technique for calibration of monostatic echosounder systems. IEEE J. Ocean. Eng. 21, 298–305. doi: 10.1109/48.508160
Webb, D. C., Simonetti, P. J., and Jones, C. P. (2001). SLOCUM: an underwater glider propelled by environmental energy. IEEE J. Ocean. Eng. 26, 447–452. doi: 10.1109/48.972077
Keywords: zooplankton, water mass, slocum glider, scotian Shelf, habitat, biophysical coupling, hydroacoustics
Citation: Ruckdeschel GS, Davies KTA and Ross T (2020) Biophysical Drivers of Zooplankton Variability on the Scotian Shelf Observed Using Profiling Electric Gliders. Front. Mar. Sci. 7:627. doi: 10.3389/fmars.2020.00627
Received: 24 April 2020; Accepted: 09 July 2020;
Published: 31 July 2020.
Edited by:
Hervé Claustre, Centre National de la Recherche Scientifique (CNRS), FranceReviewed by:
Anthony Bosse, Aix-Marseille Université, FranceGrace Saba, Rutgers, The State University of New Jersey, United States
Copyright © 2020 Ruckdeschel, Davies and Ross. This is an open-access article distributed under the terms of the Creative Commons Attribution License (CC BY). The use, distribution or reproduction in other forums is permitted, provided the original author(s) and the copyright owner(s) are credited and that the original publication in this journal is cited, in accordance with accepted academic practice. No use, distribution or reproduction is permitted which does not comply with these terms.
*Correspondence: Gennavieve S. Ruckdeschel, gs.ruckdeschel@gmail.com