Comparing Subsurface Seasonal Deoxygenation and Acidification in the Yellow Sea and Northern East China Sea Along the North-to-South Latitude Gradient
 Tian-qi Xiong1
  Qin-sheng Wei2,3
  Wei-dong Zhai1*
  Cheng-long Li1
  Song-yin Wang1
  Yi-xing Zhang1
  Shuo-jiang Liu1
  Si-qing Yu1
- 1Institute of Marine Science and Technology, Shandong University, Qingdao, China
- 2First Institute of Oceanography, Ministry of Natural Resources, Qingdao, China
- 3Laboratory for Marine Ecology and Environmental Science, Qingdao National Laboratory for Marine Science and Technology, Qingdao, China
To better understand the relationship between subsurface seasonal deoxygenation and acidification in the Yellow Sea and northern East China Sea (ECS), we examined carbonate system parameters and dissolved oxygen (DO) of seven field surveys conducted in 2017–2018, spanning all four seasons. Low pHT values of 7.71–7.80 and critically low aragonite saturation state (Ωarag) values of 1.07–1.40 along with undersaturated DO of mostly higher than 150 μmol O2 kg–1 occurred in the Yellow Sea Cold Water Mass area in summer and autumn, while hypoxic DO values of 49–63 μmol O2 kg–1 and extremely low pHT values of 7.68–7.74 as well as critically low Ωarag values of 1.21–1.39 were observed in the northern ECS in July 2018. At the beginning of warm-season stratification formation, the cold Yellow Sea waters had much higher DO but lower Ωarag values than those in relatively warmer ECS waters, while yearly initial pHT values rarely exhibited differences between the two coastal seas. During warm seasons, the central Yellow Sea accumulated respiration products beneath the thermocline in summer and autumn, while the northern ECS bottom waters preserved them only in summer. This study highlights fundamental roles of wintertime carbon dioxide (CO2) solubility along a north-to-south latitude gradient in the coastal acidification development. In comparison with the relatively low-latitude northern ECS subject to seasonal hypoxia, relatively high-latitude Yellow Sea exhibits higher CO2 solubility in winter and longer respiration-product accumulations in warm seasons, leading to lower Ωarag in the central Yellow Sea than those in the northern ECS. However, the present-day central Yellow Sea is free from hypoxia.
Key Points
• Wintertime air-sea re-equilibration, summertime respiration and autumnal upset dominate subsurface carbonate chemistry in coastal seas.
• High CO2 solubility together with respiration leads to high DIC:TAlk ratios and low aragonite saturation state in the central Yellow Sea.
• The northern East China Sea is subject to concurrent hypoxia and CO2 acidification in summer, while the Yellow Sea is free from hypoxia.
Introduction
The oceanic absorption of anthropogenic carbon dioxide (CO2) has lowered sea surface pH and calcium carbonate (CaCO3) mineral saturation state (Ω) as compared with the preindustrial era, known as ocean acidification (Caldeira and Wickett, 2003; Orr et al., 2005; Doney et al., 2009). Here pH is the negative logarithm of the sum of the concentrations of hydrogen (H+) and bisulfate (HSO4–) ions, i.e., total hydrogen ion concentration scale, pHT = -log10[H+]T, where [H+]T = [H+] + [HSO4–]. It affects chemical/biochemical properties of seawater, including chemical reactions, equilibrium conditions, and biological toxicity. Ω is defined as [Ca2+] × [CO32–]/Ksp∗, where [Ca2+] and [CO32–] are the concentrations of calcium and carbonate ions, respectively, and Ksp∗ is the apparent solubility product for either calcite or aragonite. The declines in pH and Ω could lead to CaCO3-undersaturated corrosive seawater conditions, affecting marine calcifying organisms and even the whole marine ecosystem (Fabry, 2008; Jin et al., 2015; Ravaglioli et al., 2020).
The anthropogenic CO2 invasion has resulted in a decrease in pH by 0.1 unit (Orr et al., 2005) and a decline in [CO32–] by 30% (Sabine et al., 2004) in the upper ocean since the industrial revolution. The present-day open ocean pHT was detected at 8.023 ± 0.004 in the tropical Central Pacific (6.4°N 162.4°W), at 8.074 ± 0.004 in the subtropical Eastern Pacific (33.5°N 122.5°W), and at 8.020 ± 0.008 at an Antarctic site (77.6°S 166.4°W) (Hofmann et al., 2011). In the Pacific Ocean, the present surface Ωarag values are 3–4.5 in low-latitude regions while only 1–2 in high-latitude regions (Feely et al., 2012). This latitude gradient of Ωarag is largely attributed to higher solubility of CO2 in colder seawaters of high-latitude regions. Moreover, seasonal aragonite undersaturation (i.e., Ωarag < 1) has already been observed in surface and shallow subsurface waters of some northern polar seas (Bates et al., 2009; Fabry et al., 2009; Qi et al., 2017).
Chemically, Ωarag > 1 indicates that the CaCO3 mineral of aragonite is stable in the seawater, while Ωarag < 1 indicates that the mineral is unstable. Although corals usually require much higher Ωarag of > 3.0 for optimal growth (Eyre et al., 2018; Yamamoto A. et al., 2012), many researchers regarded an Ωarag value of 1.5 as a critical threshold for marine shellfish development (Gruber et al., 2012; Ekstrom et al., 2015; Waldbusser et al., 2015), below which marine calcifying organisms may be under threat of acidified seawaters. On the Chinese side of the North Yellow Sea, the net community calcification rate in subsurface waters declined to zero when the Ωarag value reached the critical level of 1.5–1.6 (Li, 2019; Li and Zhai, 2019).
In productive coastal zones, algae and other biogenic particles decompose in subsurface waters. Their respiration and/or remineralization processes consume dissolved oxygen (DO) and release a great deal of CO2 into subsurface waters, leading to more rapid seawater acidification in coastal seas, compared with the open ocean (Feely et al., 2010; Cai et al., 2011; Melzner et al., 2013; Jiang et al., 2019). Moreover, the respiration-induced seasonal acidification is subject to uneven distributions of seawater temperature, salinity and alkalinity in coastal seas. For example, transregional carbonate studies along the U.S. East Coast have indicated that its northeast shelf region is more susceptible to CO2 acidification than the southern region, along with a north-to-south increasing gradient in total alkalinity (TAlk) and limited geographical variation in dissolved inorganic carbon (DIC) (Wang et al., 2013; Wanninkhof et al., 2015). Exposure, sensitivity and adaptive capacity to the acidification driven by atmospheric CO2 absorption and local amplifiers (i.e., eutrophication, upwelling of CO2-riched waters and input of river water with low [Ca2+] and subsequently Ωarag) were also assessed and compared throughout the U.S. coastal regions (Ekstrom et al., 2015). Along China’s coasts, so far, the latitude gradient of coastal acidification and its controlling mechanisms are unclear because previous studies have been primarily confined to individual coastal seas (e.g., Cao et al., 2011; Chou et al., 2013a; Zhai, 2018). Ocean environments along China’s coasts also exhibit complex local geological and hydrological characteristics, such as contrasting bottom topography, residence time and monsoon-driven coastal currents (e.g., Su and Yuan, 2005; Chen, 2009; Men and Liu, 2015).
In this study, we examined carbonate system parameters in the Yellow Sea and northern East China Sea (ECS) during 2017–2018, spanning all four seasons. For the first time, a north-to-south gradient of carbonate system parameters in contrasting coastal seas along China’s east coast was revealed. Together with hydrological data and DO measurements, the regional differentiation of the respiration-induced coastal acidification in the two coastal seas were investigated. This study provides the best understanding so far of the relationship between subsurface seasonal deoxygenation and acidification in the two coastal seas of both ecological and economic importance, which will assist future predictions of marine environmental changes under ocean acidification in the coming decades.
Materials and Methods
Study Area
The Yellow Sea and ECS, located on the China eastern shelf, are two major marginal seas of the western North Pacific. The boundary of the two coastal seas lies between the northern corner of the Changjiang Estuary and Jeju Island (Figure 1A). The Yellow Sea is surrounded by mainland China to the west and the Korea Peninsula to the east. It is geographically divided into two basins, i.e., the North Yellow Sea and the South Yellow Sea. The former is connected to the Bohai Sea to the west, and the latter to the ECS to the south. The North Yellow Sea has an area of ∼7 × 10⁴ km2 with an average water depth of ∼38 m, while the South Yellow Sea has an area of ∼30 × 104 km2 with an average water depth of ∼44 m. The more open ECS has a larger area of ∼77 × 104 km2 with an average water depth of ∼370 m. The ECS inner shelf within the 50 m isobaths is quite broad. The climatic variations are primarily dominated by the East Asian Monsoon, with the rain-bearing southwest monsoon prevailing in summer (from June to early September) and a strong northeast monsoon lasting in winter (from December to early March of the next year, Chen, 2009).
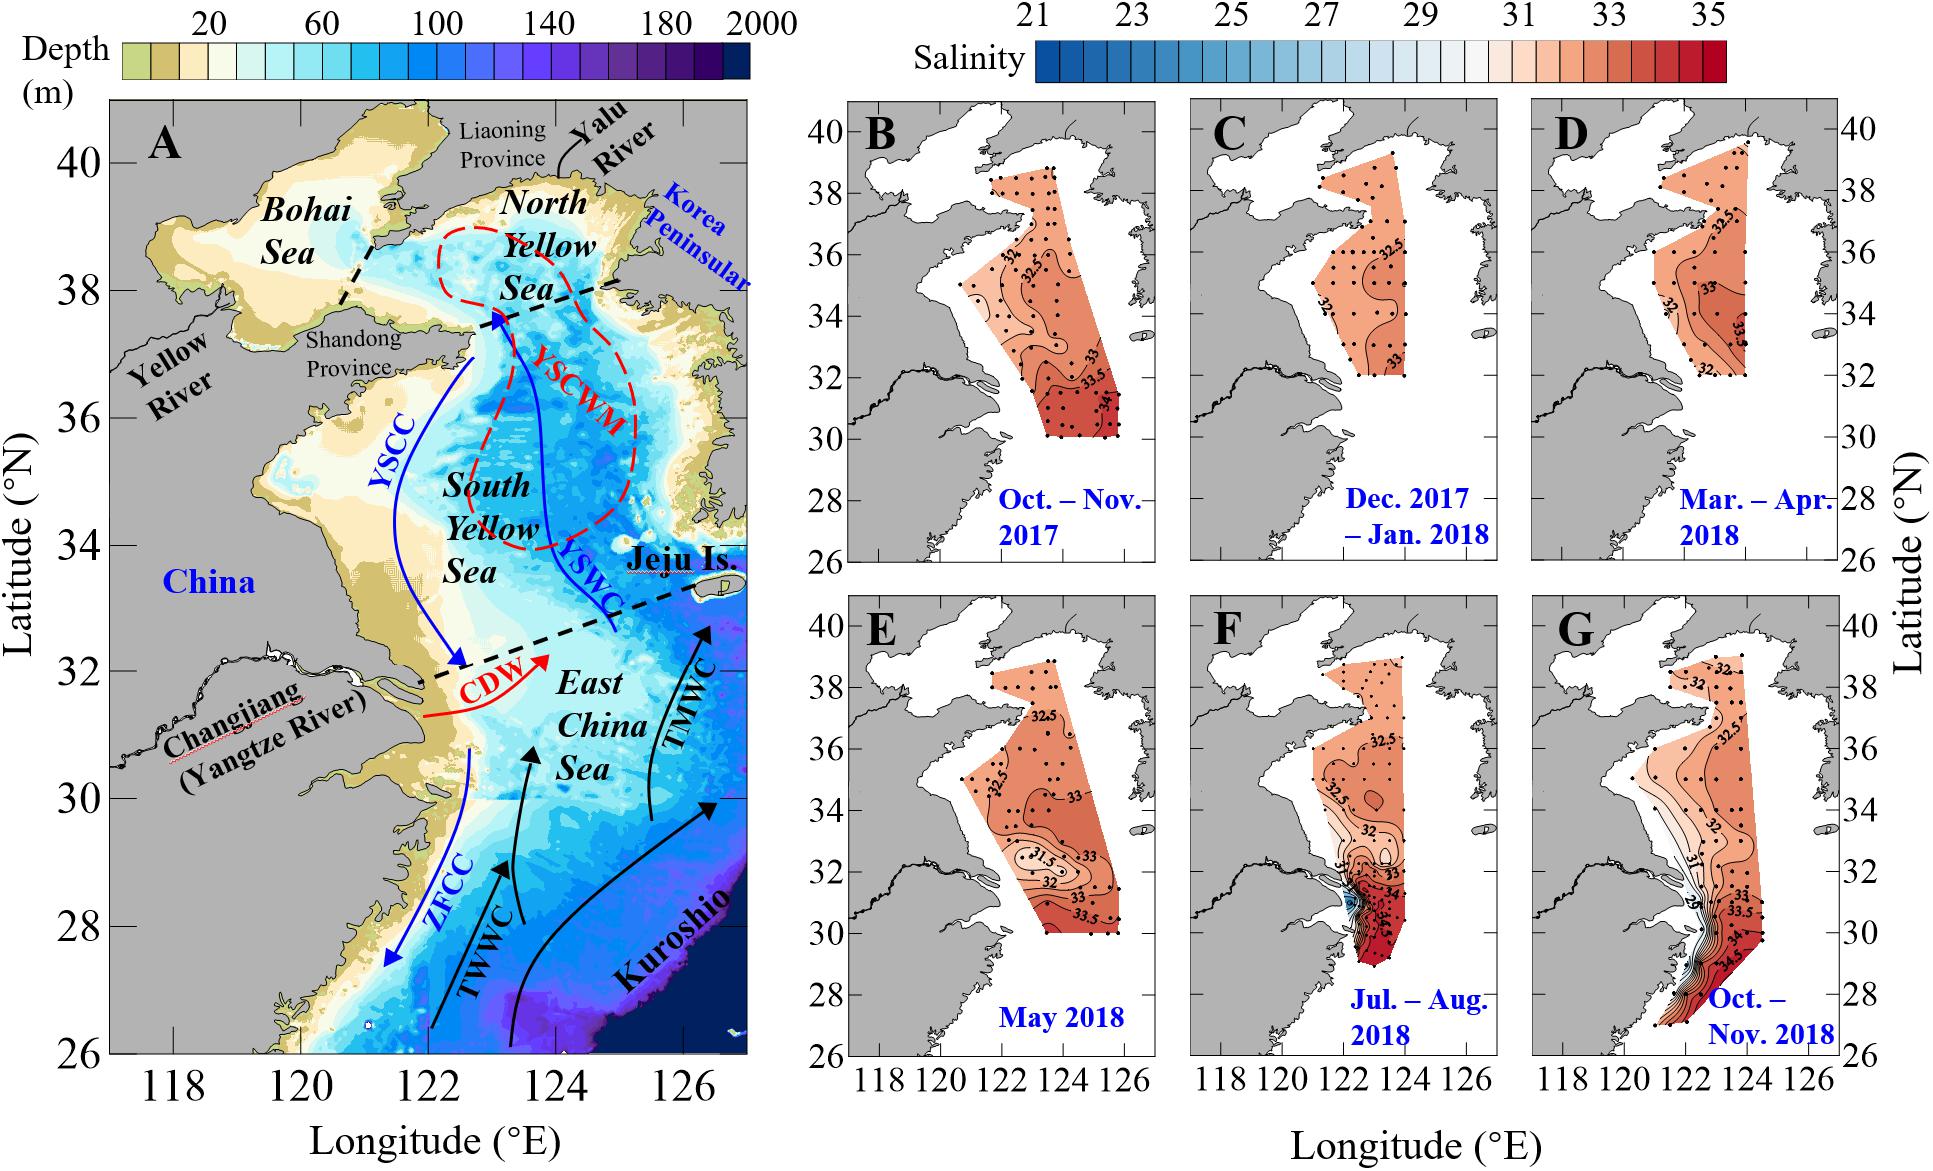
Figure 1. Maps showing (A) the circulation and depth contour in the Yellow Sea and East China Sea, and (B–G) sampling sites together with our bottom-water salinity data during our seasonal mapping cruises in 2017–2018. In (A), boundaries among the Bohai Sea, North Yellow Sea, South Yellow Sea and East China Sea are shown as dashed black lines. The year-round Kuroshio, TsushiMa Warm Current (TMWC) and TaiWan Warm Current (TWWC) are sketched with black arrows. The wintertime Yellow Sea Coastal Current (YSCC), Yellow Sea Warm Current (YSWC) and Zhejiang-Fujian Coastal Current (ZFCC) are sketched with blue arrows. The summertime Changjiang Dilute Water (CDW) and Yellow Sea Cold Water Mass (YSCWM) are sketched with the red arrow and the dashed red circle, respectively.
Both of the ECS and the Yellow Sea are connected to the North Pacific via the Kuroshio intrusion, including those Kuroshio-derived currents such as the TaiWan Warm Current (TWWC), the TsushiMa Warm Current (TMWC), and the Yellow Sea Warm Current (YSWC). Moreover, they are subject to freshwater discharges from the Changjiang and Yalu Rivers (Figure 1A), as well as several monsoon-driving coastal currents, including the northeastward-moving Changjiang Diluted Water (CDW) from late spring to early autumn, and the southward-moving Yellow Sea Coastal Current (YSCC) and Zhejiang-Fujian Coastal Current (ZFCC) in winter and early spring.
The Yellow Sea is semi-enclosed. Its summertime hydrography is characterized by a pronounced stratification in its deeper regions. A cold pool with water temperatures of 5–11°C, the Yellow Sea Cold Water Mass (YSCWM), develops under the thermocline from late spring to autumn as the remnant of the previous winter cooling (Miao et al., 1990; Zhai et al., 2014b). The wintertime hydrography in the Yellow Sea is characterized by the southward-moving YSCC and the northward-moving YSWC (Figure 1A). The YSWC is considered to be a compensating current to the monsoon-driven coastal current (Yuan et al., 2008), transporting warm and saline waters into the Yellow Sea. Based on 228Ra/226Ra measurements, the Yellow Sea hydraulic residence time has been estimated to be 5–6 years, while the residence time may only be 2–3 years or shorter on the ECS shelf (Nozaki et al., 1991; Men and Liu, 2015).
TAlk in the Yalu River is only 320–800 μmol kg–1 (Zhai et al., 2014b, 2015), approximately 1000 μmol kg–1 lower than the Changjiang TAlk value (1500–1900 μmol kg–1, Xiong et al., 2019). As illustrated by Chen and Wang (1999) and Zhai et al. (2014a), the ECS offshore waters originate from the Kuroshio tropical water. The latter has a typical TAlk value of 2293 μmol kg–1 and the DIC value of 1994 μmol kg–1 (with the DIC:TAlk ratio of < 0.9) at a salinity of 34.9 (Chen and Wang, 1999). By comparison, the TAlk values in the semi-enclosed Yellow Sea were usually detected in a compact range of 2290 ± 25 μmol kg–1 (Zhai, 2018). In the North Yellow Sea, a usual water mixing model has been reported by Zhai et al. (2014b), i.e.,
where 320 (μmol kg–1) represents the low TAlk feature of the mixture of rainwater and freshwater discharged from the Yalu River.
Sampling and Analyses
In this study, seven field surveys were conducted on the Chinese side of the Yellow Sea and the northern ECS during 2017–2018 (Supplementary Table S1), spanning a wet summer (July–August 2018) and a dry winter (December 2017–January 2018), as well as those transitional seasons of spring (March–May 2018) and autumn (October–November 2017 and October–November 2018) (Figures 1B–G and Supplementary Figure S1A).
Water samples were collected at two to seven different depths (including sea surface and the bottom water) using a rosette of 10 or 12 Niskin bottles, integrated with Conductivity-Temperature-Depth/Pressure (CTD) sensor packages. The ancillary data of in situ temperature (after the International Temperature Scale of 1990) and salinity (after the Practical Salinity Scale of 1978) were obtained primarily using the calibrated CTD sensor packages (SBE-19 plus in our October–November 2017 and May 2018 cruises, and SBE-911 plus during the other cruises, Sea-Bird Scientific, Bellevue, WA, United States). During the summertime estuarine survey conducted in July 2018, salinity values of discrete samples were also measured using a calibrated WTW’s TetrCon925 probe.
DO samples were collected, fixed and titrated aboard following the Winkler procedure at an overall uncertainty level of <0.5%. A small quantity of sodium azide (NaN3) was added during subsample fixation to remove possible interferences from nitrites (Wong, 2012). The DO saturation (DO%) was calculated from field-measured DO concentration divided by the DO concentration at equilibrium with the atmosphere which was calculated from temperature, salinity and local air pressure, as per the Benson and Krause (1984) equation. To quantify the effect of net community metabolism, apparent oxygen utilization (AOU) was also calculated by subtracting the field-measured DO concentration from the air-equilibrated DO. Assuming the water starts with a fully saturated state, and ignoring effects of air-sea exchange and water mixing, an AOU > 0 implies net community respiration, while an AOU < 0 implies net community production.
Water samples for DIC and TAlk analyses were also collected aboard. As recommended by Huang et al. (2012), water samples for DIC and TAlk were stored in 60 mL borosilicate glass bottles (for DIC, bubble free) and 140 mL high-density polyethylene bottles (for TAlk). There were no statistical differences between the measuring results from the above-mentioned sample storing procedure and from those procedure suggested by Dickson et al. (2007). Following filling procedure in Dickson et al. (2007), we filled these triple-rinsed sample bottles of DIC and TAlk smoothly from the bottom, and then immediately added 50 μL of saturated mercuric chloride (HgCl2). Finally, water samples for DIC and TAlk were sealed and preserved at room temperature until determination. Note that the volume of saturated HgCl2 added to the DIC samples exceeded the upper limit of recommended range (0.02–0.05% by volume), but was still below the maximum amount, i.e., 0.1% by volume (Dickson et al., 2007). Both DIC and TAlk samples were unfiltered but allowed to settle before measurement, although filtration techniques suitable for these samples were reported earlier by Bockmon and Dickson (2014). DIC was measured by an infrared CO2 detector-based DIC analyzer (AS-C3, Apollo SciTech Inc., United States), and TAlk was determined at 25°C by the Gran acidimetric titration using a semi-automated titrator (AS-ALK2, Apollo SciTech Inc., United States). DIC and TAlk determinations were referred to Certificated Reference Materials (CRM) from Andrew G. Dickson’s lab at Scripps Institution of Oceanography at a precision of ± 2 μmol kg–1 (Dickson et al., 2007; Zhai et al., 2014b).
Calculation of Other Carbonate System Parameters
Seawater fugacity of CO2 (fCO2), pHT and Ωarag were calculated from seawater temperature, salinity, and measured DIC and TAlk using the software CO2SYS.XLS (Version 24) (Pelletier et al., 2015), which is an updated version of the original CO2SYS.EXE (Lewis and Wallace, 1998). This program has been favorably evaluated by Orr et al. (2015) in a study comparing 10 packages of carbonate calculation program. The Millero et al. (2006) dissociation constants of carbonic acid were used in the calculation because they cover much broader applicable ranges of temperature (0–50°C) and salinity (0–50). The Dickson (1990) dissociation constant was used for HSO4– ion. The phosphate and silicate values required by the program were usually unavailable and replaced by zero. The Ca2+ concentrations were assumed to be proportional to salinity as presented in Millero (1979) and the values of apparent solubility product for aragonite (Ksp∗arag) were taken from Mucci (1983).
To assess the quality of the carbonate system data, we calculated pH data using the National Bureau of Standards scale (pHNBS) based on field-measured DIC and TAlk values. These data were compared with field-measured pHNBS data (see collection and analysis of pHNBS samples in Supplementary Material). Most measured and calculated values were consistent at a deviation level of ± 0.05 pH (Supplementary Figure S2A). To examine the possible existences of organic alkalinity in coastal waters within our study area, we also calculated TAlk values from field-measured DIC and pHNBS data. Most measured TAlk data and calculated results were consistent with each other at a deviation level of ± 20 μmol kg–1 (Supplementary Figure S2B). This deviation level was reasonably higher than the precision of TAlk determination (± 2 μmol kg–1). These comparisons suggested that the measured and calculated results of the carbonate system parameters were reliable. Due to accidentally insufficient addition of HgCl2, the North Yellow Sea DIC samples collected in April 2018 were damaged before determination. The relevant DIC data were calculated from field-measured TAlk and pHNBS.
To quantify the effect of net community metabolism on DIC, we calculated the air-equilibrated DIC (corresponding to a mean air-equilibrated fCO2 value of 415 ± 5 μatm during our seasonal cruises conducted in 2017–2018) from corresponding field-measured seawater temperature, salinity and TAlk (Zhai, 2018). The air-equilibrated fCO2 was calculated from the flask analysis data of atmospheric CO2 mole fraction at the adjacent Tae-ahn Peninsula (TAP) site (36°44’N 126°08’E), which varied from 406 ppm (ppm = parts of CO2 per million dry air) in August to 419–421 ppm during January to May in 2017–2018 (Supplementary Figure S1B, data from NOAA/ESRL’s Global Monitoring Division)1, and corrected to the survey-based barometric pressure and 100% humidity at water temperature and salinity (Zhai et al., 2019). Similar to the definition of AOU (section “Sampling and Analyses”), the DIC departure from the air-equilibrated DIC was defined as the excess DIC (ExcessDIC). Assuming water starts with a fully saturated state, and ignoring effects of air-sea exchange, water mixing and CaCO3 precipitation/dissolution, an ExcessDIC > 0 means net community respiration, while an ExcessDIC < 0 implies net community production.
Results
Hydrological Settings
Generally, water temperature exhibited a north-to-south-increasing gradient from the North Yellow Sea, to the South Yellow Sea, and to the northern ECS in winter, spring and autumn (Supplementary Figures S3–S5). The only exception was sea surface temperature in summer, showing no latitude gradient in these sea areas. However, summertime temperature in subsurface and bottom waters exhibited a north-to-south-increasing gradient (Supplementary Figures S4, S5). During our winter and spring cruises, regionally survey-averaged temperatures were 4.8–7.8°C in the North Yellow Sea, 7.2–11.7°C in the South Yellow Sea and 9.6–16.7°C in the northern ECS (Table 1).
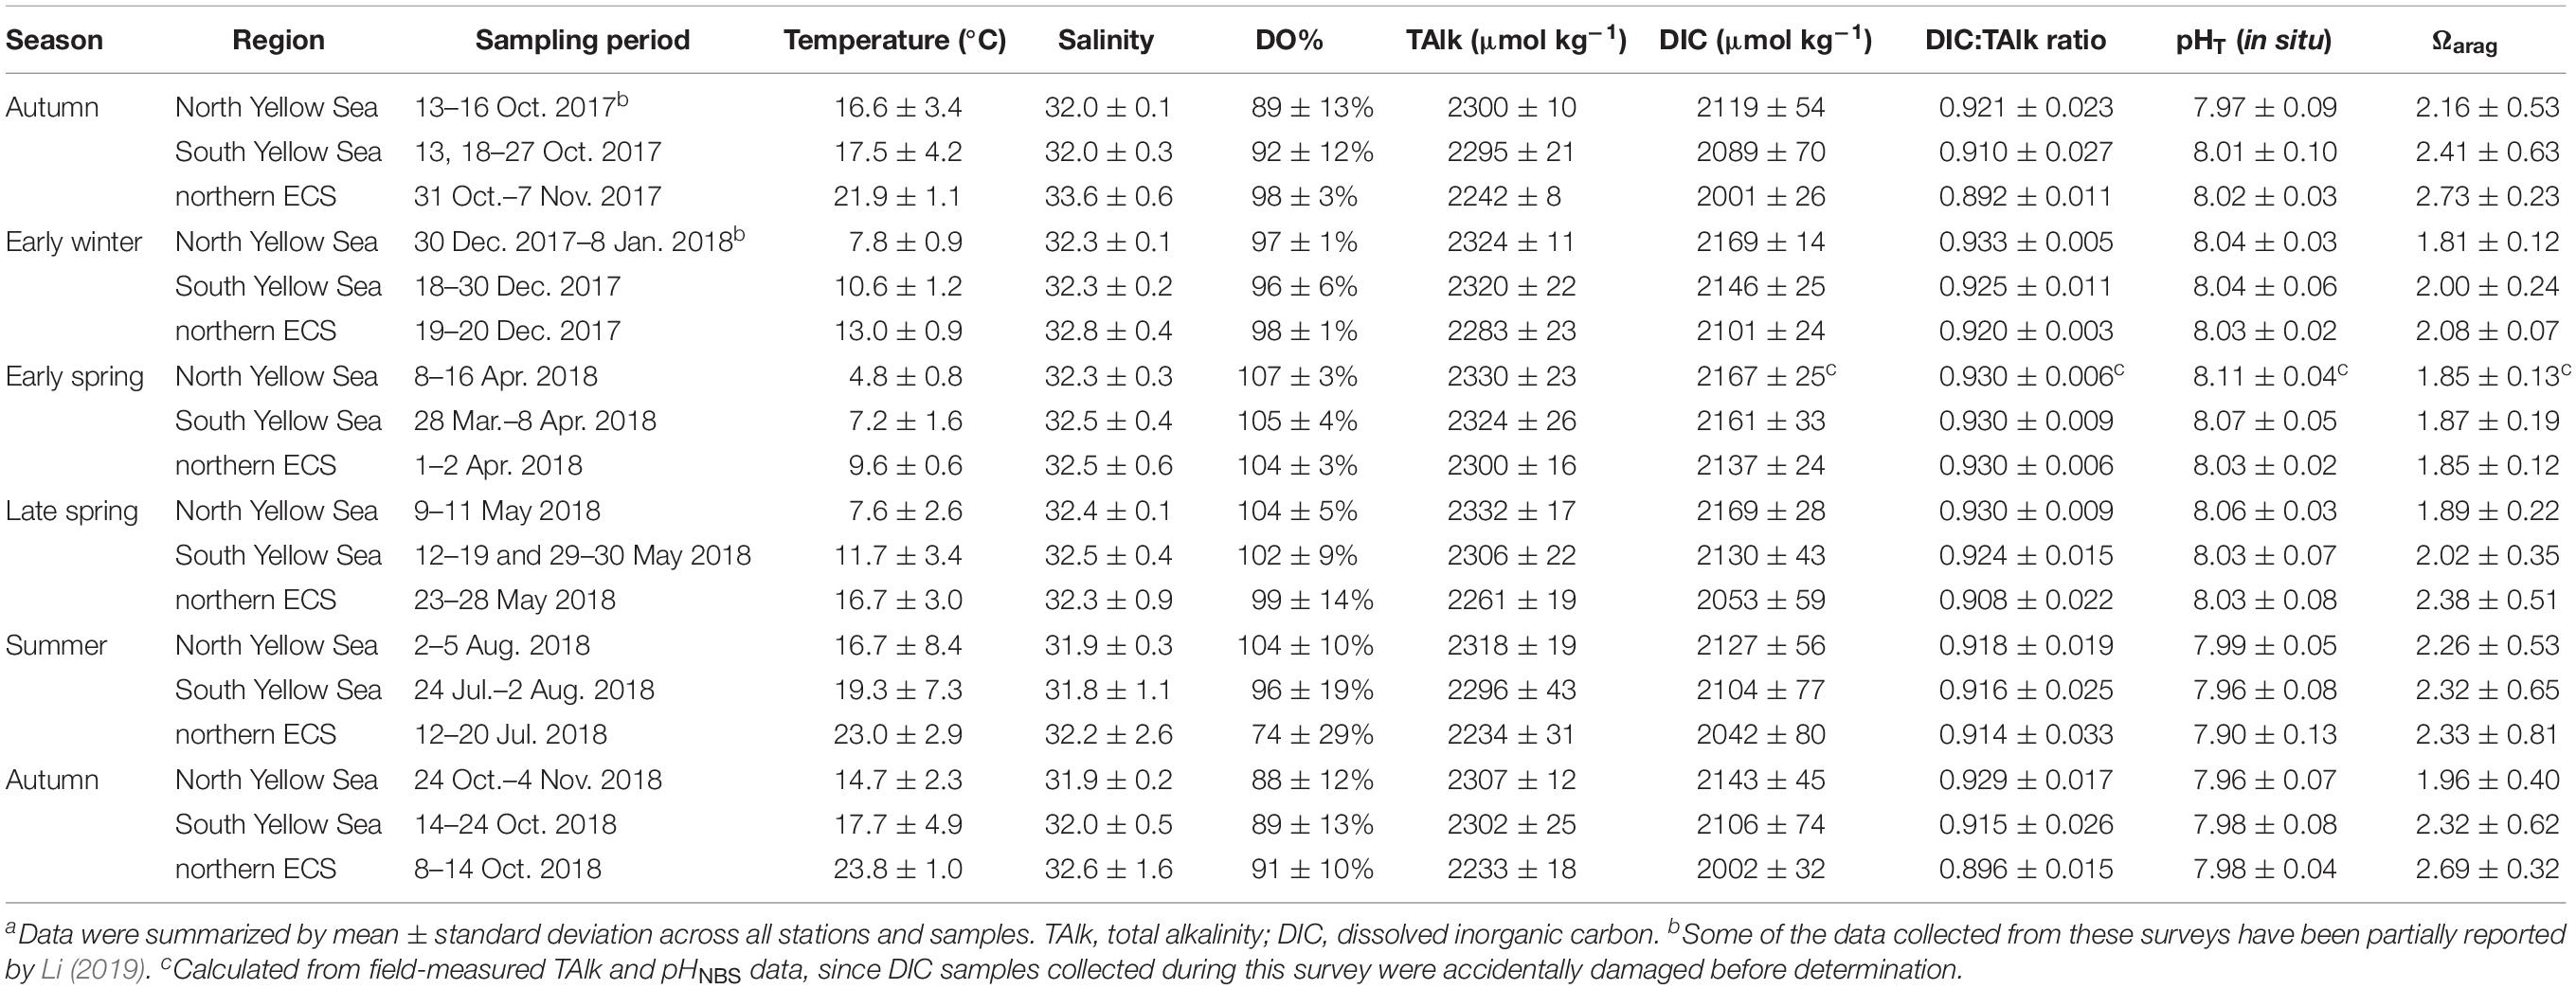
Table 1. Summary of field data of water temperature, salinity, DO saturation (DO%) and carbonate system parametersa.
Salinity also exhibited the north-to-south-increasing gradient, with annual mean values of 32.1 ± 0.3 in the North Yellow Sea, 32.2 ± 0.7 in the South Yellow Sea and 32.6 ± 1.9 in the northern ECS, based on data obtained from our seasonal cruises in 2017–2018. The Yellow Sea had relatively low salinity values and small salinity variations as compared with the northern ECS (Figures 1B–G, 2A–C). In the Yellow Sea, relatively high salinity values of > 32 dominated the whole study area in winter and spring (Figures 1C–E). In summer and autumn, the relatively high salinity values of > 32 still dominated bottom waters in the central Yellow Sea (Figures 1B,F–G), i.e., the summertime YSCWM area (Figure 1A). In the connection between the northern ECS and South Yellow Sea, several low salinity values of 29.7–31.5 were observed in late spring (Figure 1E), likely due to the offshore transport of the CDW. In summer, the CDW-affected sampling sites considerably increased, covering the northwestern ECS and the southern part of the South Yellow Sea (Figure 1F and Supplementary Figure S1A). In autumn, low salinity values of 26.1–30.5 were observed at nearshore stations in the ECS (Figure 1G), indicating the effect of the southward-moving ZFCC during this northeast monsoon-driven season (Figure 1A).
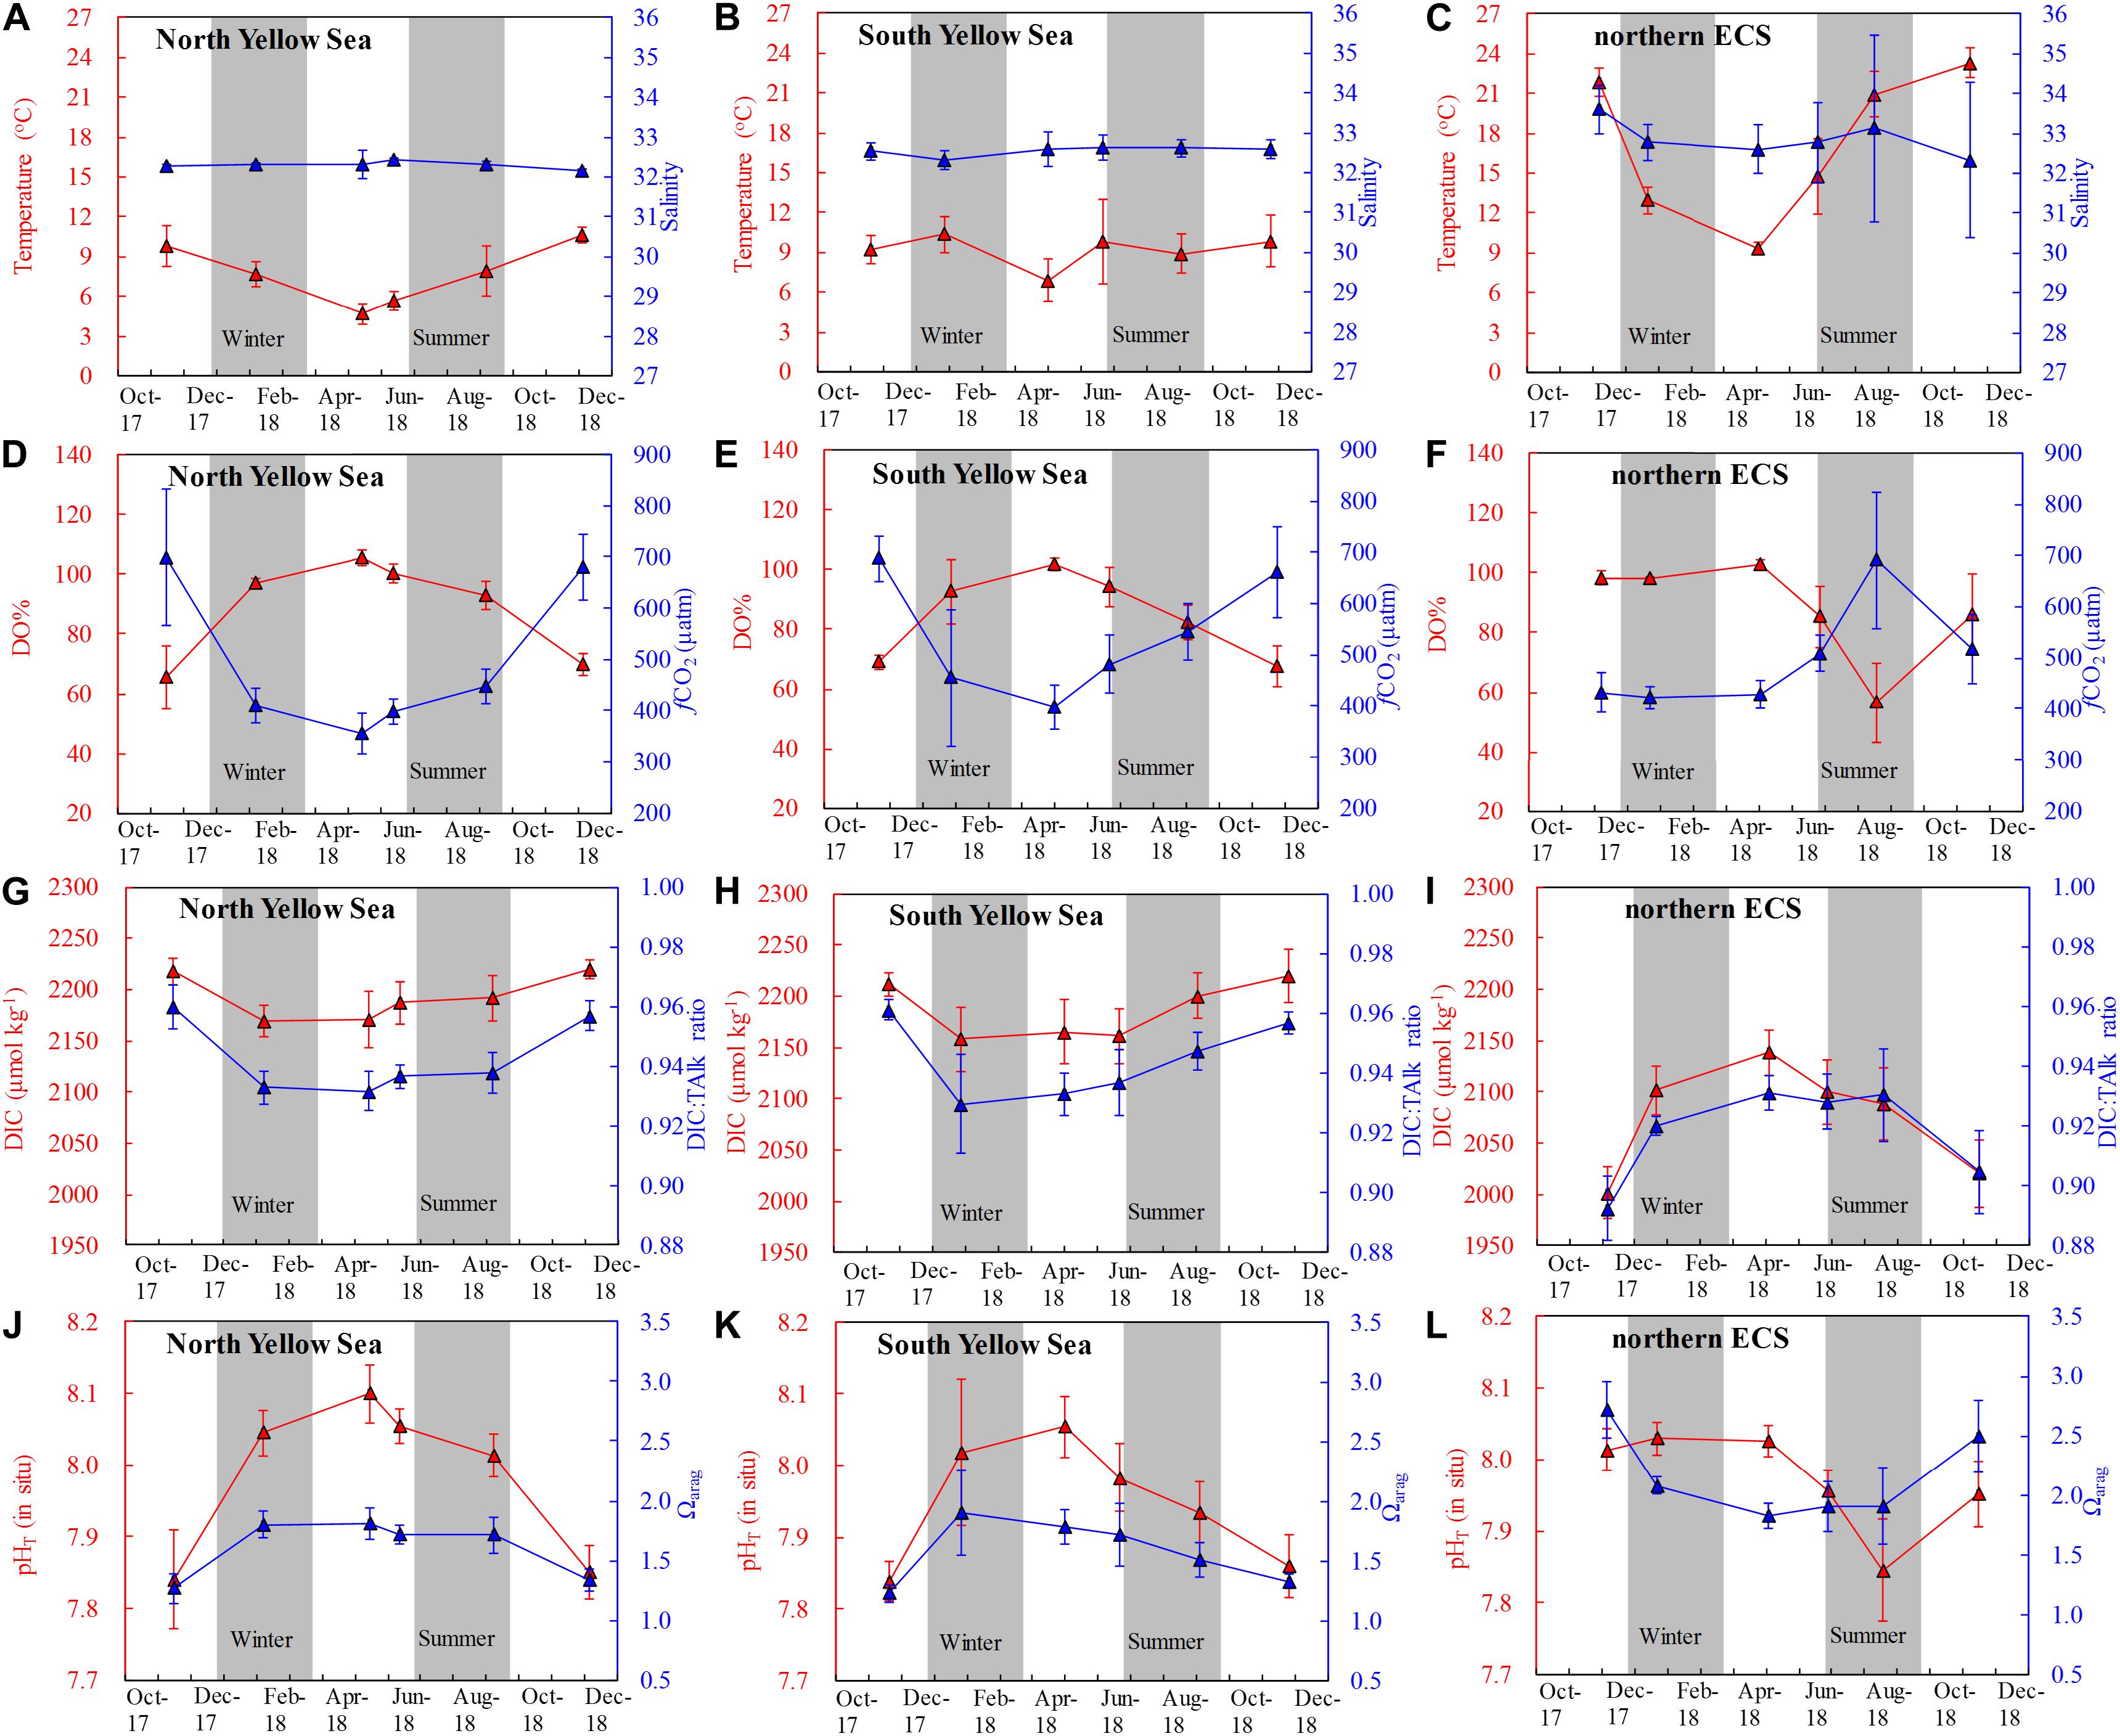
Figure 2. Time series of survey-averaged values of bottom-water (A–C) temperature and salinity, (D–F) DO saturation (DO%) and fugacity of CO2 (fCO2), (G–I) dissolved inorganic carbon (DIC) and DIC:TAlk ratio, and (J–L) pHT (in situ) and aragonite saturation state (Ωarag). TAlk = Total alkalinity. Data points in the Yellow Sea during summer to autumn are within the YSCWM. Error bars denote standard deviations.
In the Yellow Sea, significant thermoclines and stratification occurred in summer and autumn (Figures 3A–C), with mean surface temperatures of 26.7 ± 2.3°C and 19.2 ± 1.7°C in summer and autumn, respectively, and with mean bottom-water temperatures of 12.5 ± 6.2°C and 13.9 ± 4.7°C in summer and in autumn, respectively (Supplementary Figure S6). In the central Yellow Sea, subsurface water had quite low temperature of ∼9°C in warm seasons (Figures 2A,B), shaping the YSCWM area with large density difference between bottom and surface waters (ΔDensity) of ∼5 kg m–3 in summer and ∼2 kg m–3 in autumn (Figures 3A–C). Compared with the Yellow Sea, the northern ECS had relatively small bottom-surface temperature differences (26.1 ± 1.8°C versus 20.9 ± 1.7°C) and ΔDensity (3.7 ± 1.8 kg m–3) in summer, and nearly homogenous vertical profiles in autumn, except for several southeastern stations with bottom-water temperatures of 19.9–23.7°C and ΔDensity of 0.4–2.1 kg m–3 in October 2018 (Figures 3A–C and Supplementary Figure S6).
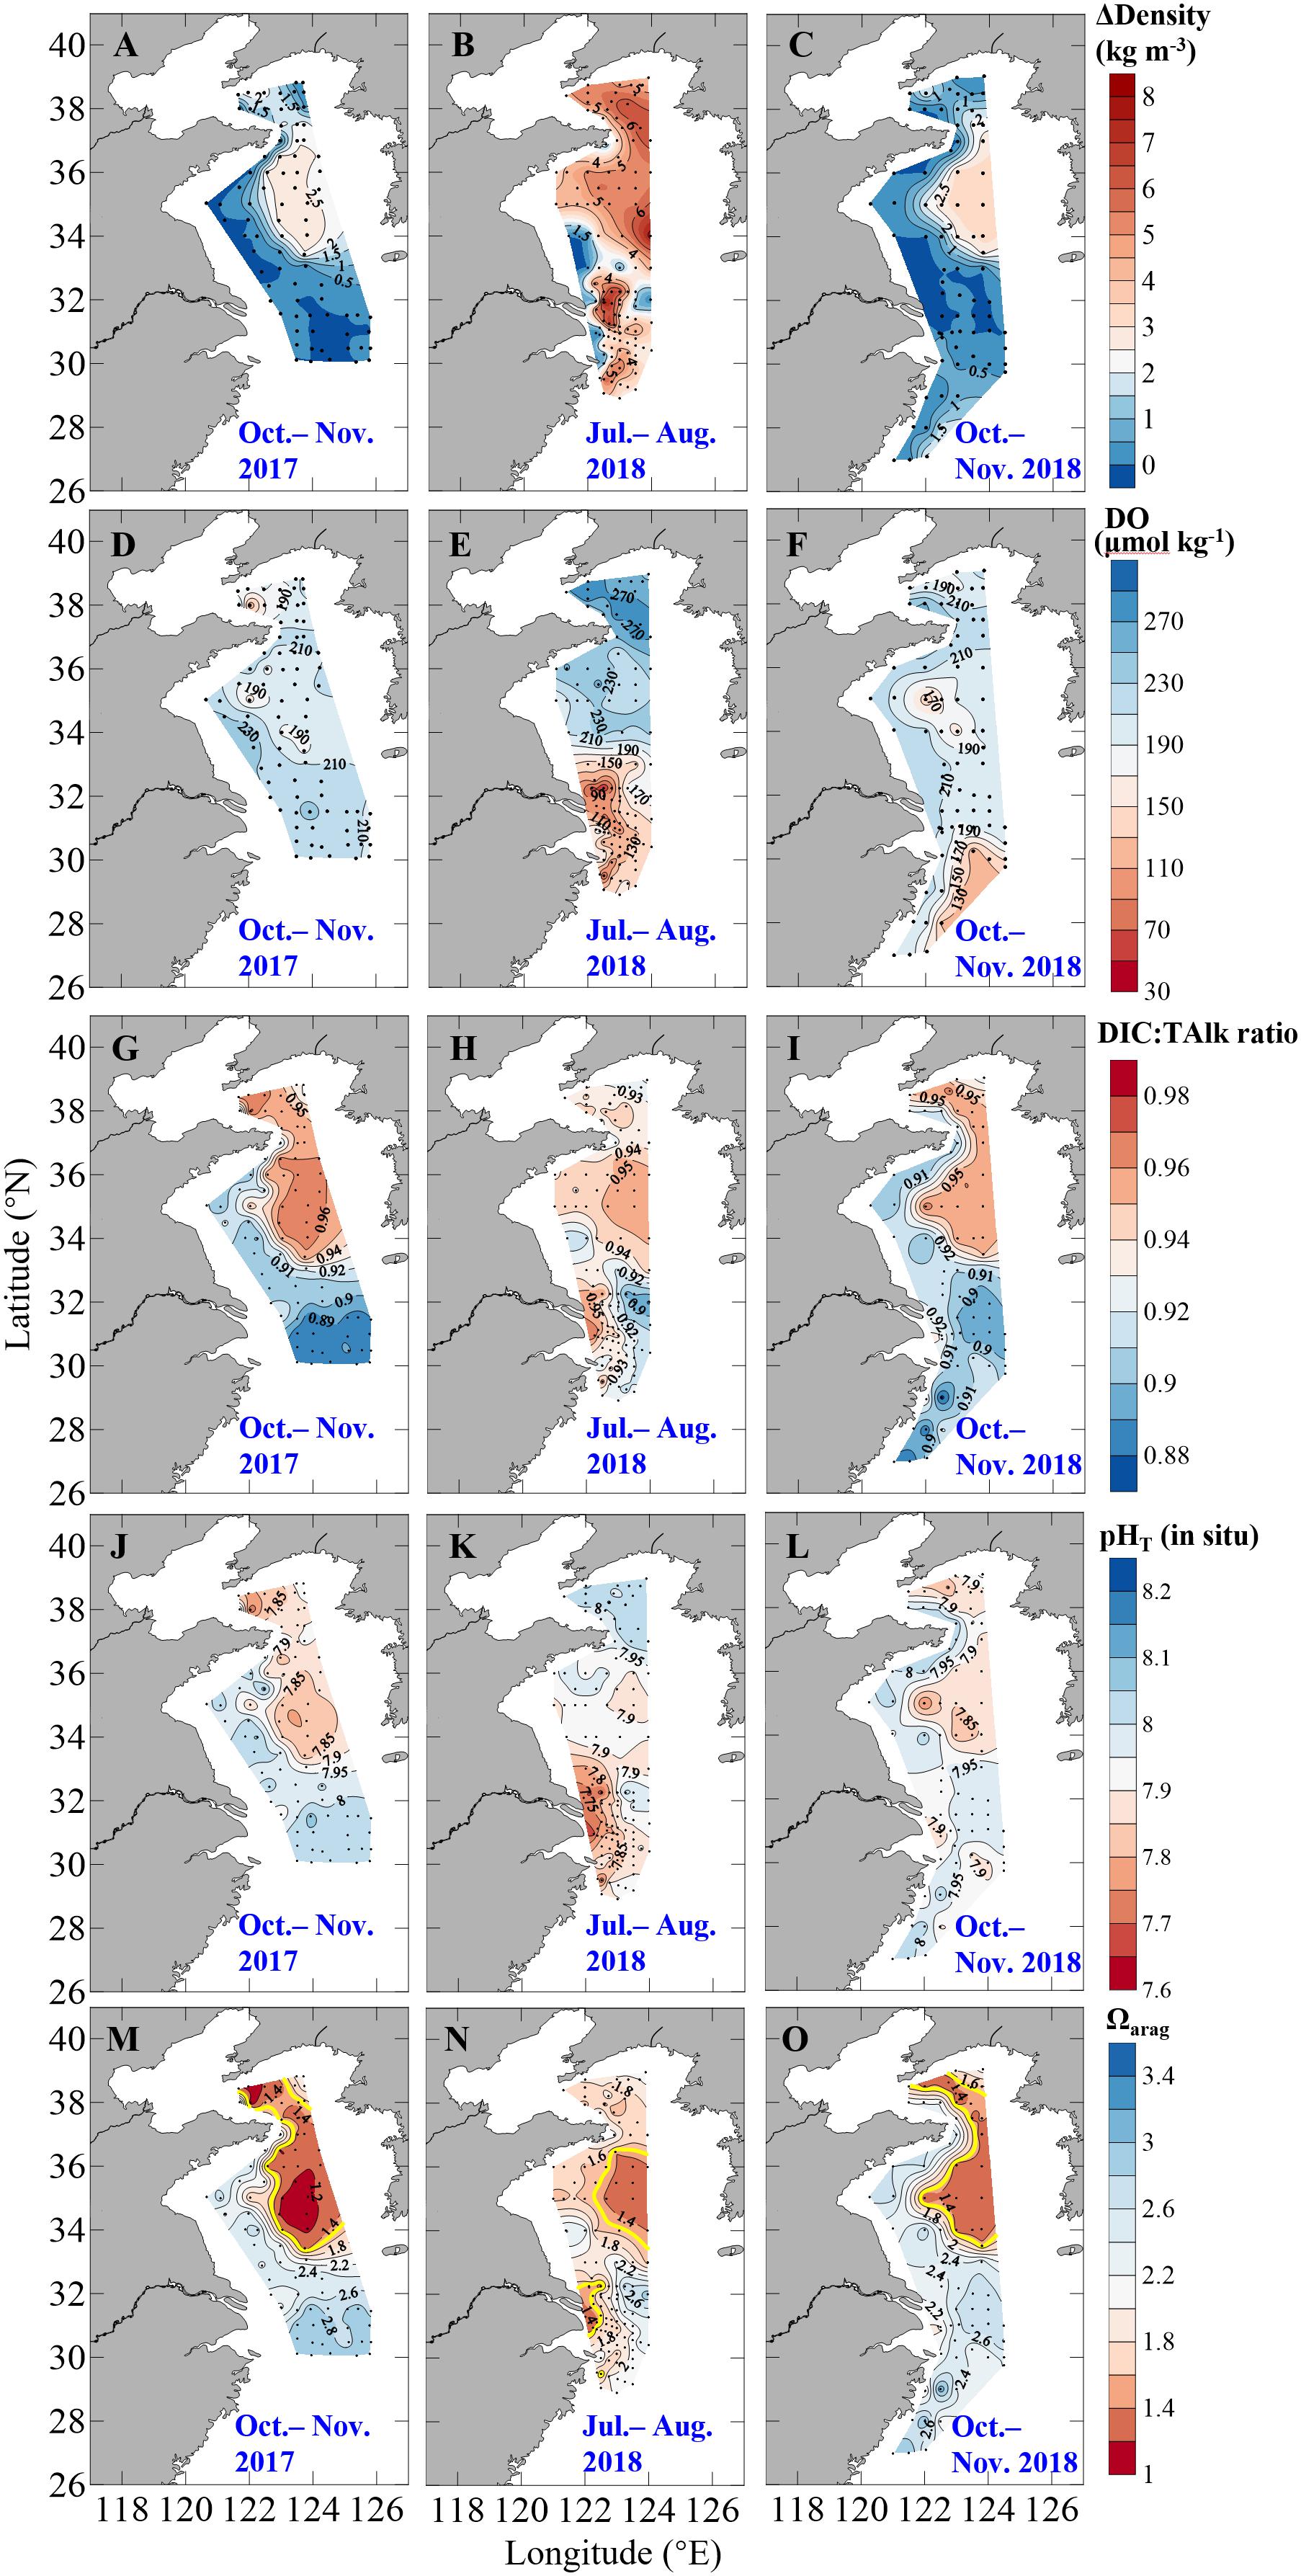
Figure 3. Distributions of (A–C) density difference between bottom and surface waters (ΔDensity), bottom-water (D–F) dissolved oxygen (DO), (G–I) DIC:TAlk ratio, (J–L) pHT (in situ), and (M–O) aragonite saturation state (Ωarag) in autumn 2017, summer 2018 and autumn 2018. In panels (M–O), contours of bottom-water critical Ωarag level of 1.5 are plotted as thick yellow lines.
DO and Carbonate System Parameters
DO, fCO2, and Apparent DO Depletion Rate
During our winter and spring cruises, most DO values were at ∼100% saturations, while fCO2 were close to the present-day air-equilibrated fCO2 of 415 μatm in the Yellow Sea and northern ECS (Table 1 and Figures 2D–F), suggesting a vertically well-mixed situation during cold seasons. Exceptions to this were observed in the central part of the South Yellow Sea in winter, where relatively low DO% of 65–72% and supersaturated fCO2 of 672–806 μatm occurred in bottom waters at four deep stations (Supplementary Figure S5). From late spring to autumn, the YSCWM bottom waters exhibited DO declines (from 97% or 285 μmol O2 kg–1 in late spring to 87% or 248 μmol O2 kg–1 in summer and 68% or 195 μmol O2 kg–1 in autumn) and fCO2 increases (from 440 μatm in late spring to 505 μatm in summer and 680 μatm in autumn) (Figures 2D,E, 3D–F). These low DO values in the YSCWM (mostly higher than 150 μmol O2 kg–1) were still above the threshold of hypoxia (i.e., <63 μmol O2 kg–1). The regional averaged apparent DO depletion rate in the YSCWM bottom waters was estimated to be 0.6 μmol O2 kg–1 d–1 from late spring to autumn (∼150 days).
In the northern ECS, summertime bottom-water DO% values were averaged at only 56 ± 13% (with a range of 21–84%, having the DO concentrations of 49–185 μmol O2 kg–1), while the autumnal bottom-water DO% increased to the air-equilibrated level (Figures 2F, 3D–F). The three summertime hypoxic stations (with DO values of 49–63 μmol O2 kg–1) off the Changjiang Estuary had extremely high fCO2 values of ∼1000 μatm (Supplementary Figure S5). Since water stratification in the northern ECS was intensified from late spring to summer (∼50 days), its bottom-water averaged apparent DO depletion rate (from 85% or 215 μmol O2 kg–1 in late spring to 56% or 126 μmol O2 kg–1 in summer) was estimated to be 1.8 μmol O2 kg–1 d–1.
In addition, moderately low bottom-water DO values of ∼140 μmol O2 kg–1 were also observed in autumn at several southeastern stations (Figure 3F), where water temperature was moderately low (∼22°C) (Supplementary Figure S6F), and salinity was quite high (∼34) (Figure 1G), likely resulted from the TWWC that intruded into the northern ECS (Figure 1A).
TAlk
Survey-averaged TAlk in the North Yellow Sea ranged between 2300 ± 10 μmol kg–1 and 2332 ± 17 μmol kg–1 (Table 1, with the annual mean of 2316 ± 19 μmol kg–1), while survey-averaged TAlk in the South Yellow Sea ranged between 2295 ± 21 μmol kg–1 and 2324 ± 26 μmol kg–1 (Table 1, with the annual mean of 2305 ± 31 μmol kg–1). In the northern ECS, however, relatively low TAlk values were observed, ranging from 2233 ± 18 μmol kg–1 to 2300 ± 16 μmol kg–1 (Table 1, with the annual mean of 2243 ± 28 μmol kg–1).
TAlk versus salinity showed different relationships in the three regions (Figures 4A–C). In the North Yellow Sea, TAlk versus salinity roughly followed Eq. (1), although TAlk data obtained from our five cruises in 2018 were 10–30 μmol kg–1 higher than those values predicted by salinity and Eq. (1). In the South Yellow Sea, however, quite complicated water mixing behaviors were involved (Figure 4B). In the northern ECS, many data points of TAlk versus salinity fairly followed a linear relationship (Figure 4C), i.e.,
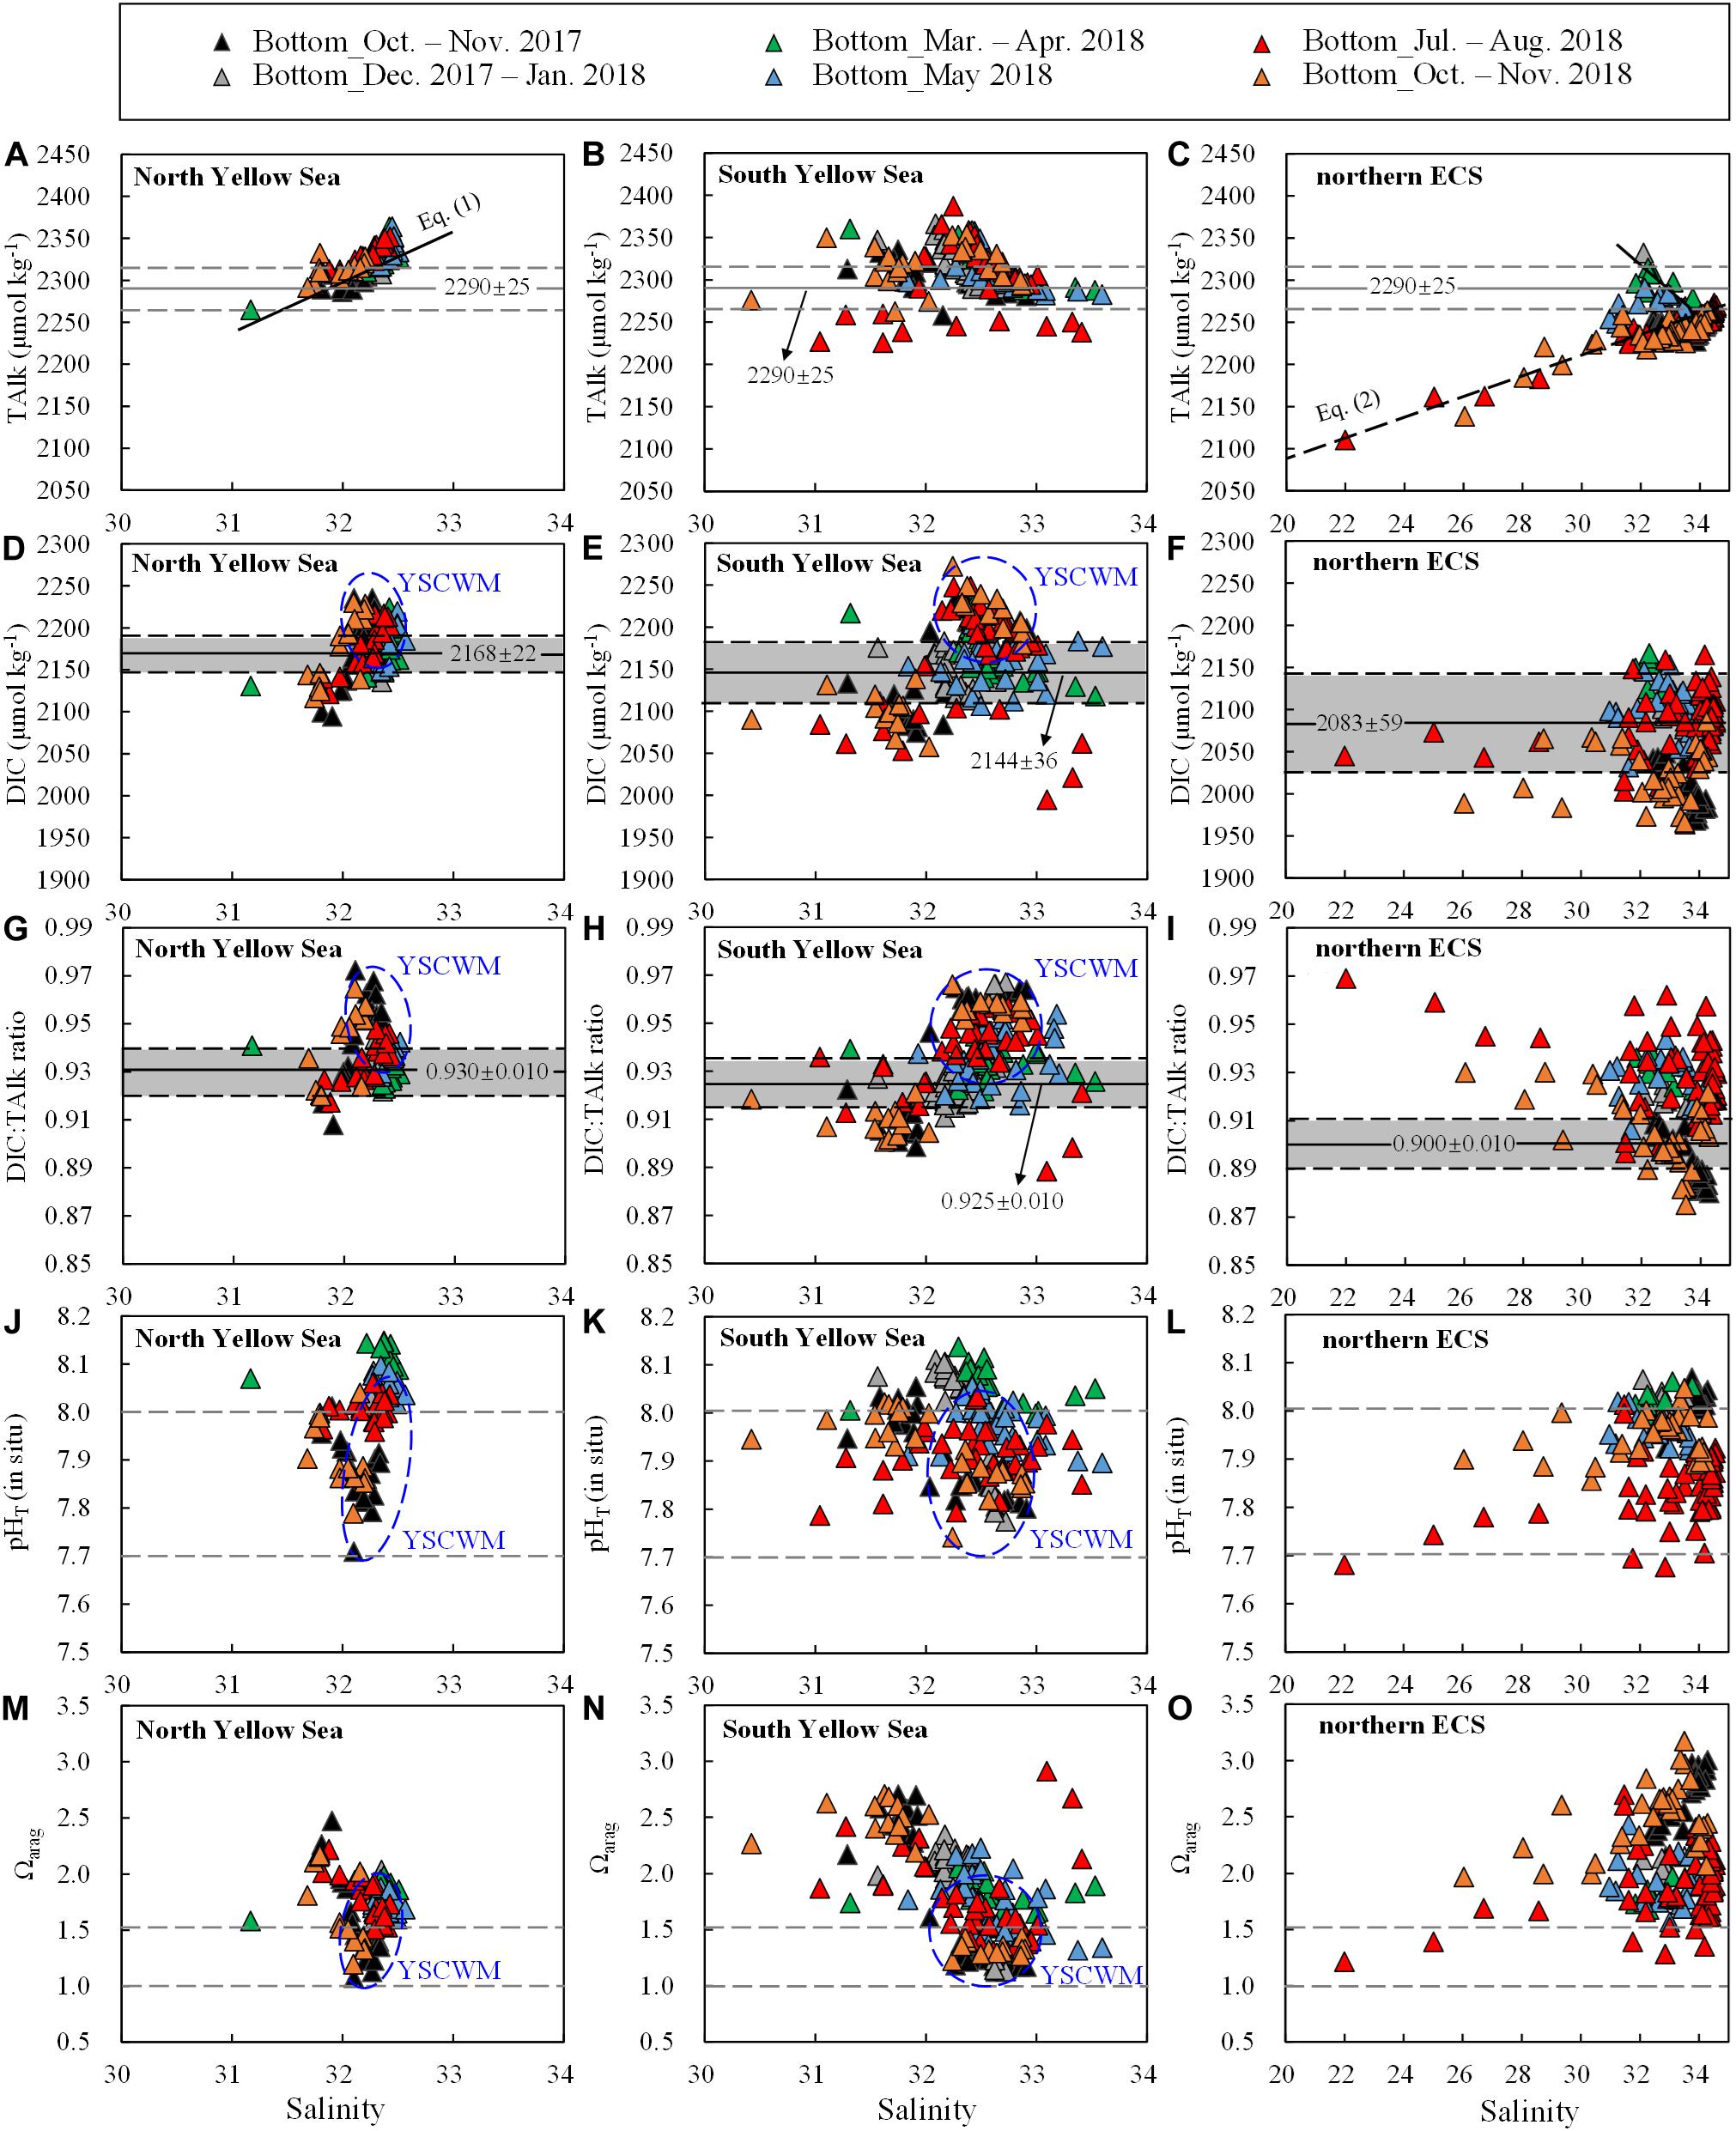
Figure 4. Bottom-water (A–C) TAlk, (D–F) DIC, (G–I) DIC:TAlk ratio, (J–L) pHT (in situ) and (m–o) Ωarag versus salinity. Data for the YSCWM are enclosed within blue ellipses. In (A–C), 2290 ± 25 μmol kg– 1 was the earlier usual value of TAlk in the Yellow Sea (Zhai et al., 2014b; Zhai, 2018). In (D–I), gray shaded areas represent mean ± SD of wintertime/springtime DIC or DIC:TAlk ratios in individual regions. In (J–L), the pHT of 8.0 is comparable with the present-day air-equilibrated pHT (corresponding to a mean air-equilibrated fCO2 value of 415 ± 5 μatm during our seasonal cruises in 2017–2018), while the pHT of 7.7 shows the doubled concentration of total hydrogen ions. In (M–O), the Ωarag of 1.5 shows a critical value that the net community CaCO3 dissolution occurs in the North Yellow Sea (Li, 2019; Li and Zhai, 2019), while the Ωarag of 1.0 indicates the critical value for the ideal aragonite dissolution.
Equation (2) indicated a two-endmember water mixing between the Changjiang freshwater (S = 0, TAlk = 1850 μmol kg–1) and the ECS offshore waters (S = 34.9, TAlk = 2266 μmol kg–1), as derived from our July 2018 cruise conducted off the Changjiang Estuary (Figure 1). This linear relationship also roughly characterized several ECS nearshore stations (along the China’s east coast) sampled during our autumn 2018 cruise, with quite low salinity values of 26.0–30.5 (Figure 1G) and TAlk values of 2138–2229 μmol kg–1 (Figure 4C), indicating that the southward-moving ZFCC was closely coupled with the CDW (Figure 1A). In winter and spring, however, quite high TAlk values of 2283–2333 μmol kg–1 at moderate salinity values of 31.3–32.8 were observed in the northern ECS (Figure 4C), showing the intrusion of the northeast monsoon−driven YSCC (Figure 1A).
DIC and DIC:TAlk Ratio
The Yellow Sea exhibited higher DIC values than the northern ECS (Figures 2G,H versus Figure 2I). Annual mean DIC values were 2145 ± 47 μmol kg–1 in the North Yellow Sea, 2119 ± 65 μmol kg–1 in the South Yellow Sea, and 2031 ± 65 μmol kg–1 in the northern ECS. Wintertime and springtime DIC values in the North Yellow Sea were averaged at 2168 ± 22 μmol kg–1 (Figure 4D), while wintertime and springtime DIC values in the South Yellow Sea were averaged at 2144 ± 36 μmol kg–1 (Figure 4E). In the Yellow Sea, DIC data showed greater vertical variations in summer and autumn than in winter and spring (Supplementary Figures S3–S5), and the YSCWM had relatively high DIC values of 2150–2270 μmol kg–1 in summer and autumn (Figures 4D,E). In the northern ECS, the low DIC values of this study of 1650–1950 μmol kg–1 were observed in the summertime ECS surface waters (Supplementary Figure S7F), while the ECS bottom-water DIC values were mostly 2050–2150 μmol kg–1 in summer (Figure 4F).
The Yellow Sea usually had higher DIC:TAlk ratios than the northern ECS (Figures 2G–I). From early winter to late spring, survey-averaged DIC:TAlk ratio in the North Yellow Sea ranged between 0.930 ± 0.009 and 0.933 ± 0.005 (Table 1), usually at 0.930 ± 0.010 (Figure 4G), while survey-averaged DIC:TAlk ratio in the South Yellow Sea varied from 0.924 ± 0.016 to 0.930 ± 0.009 (Table 1), usually at 0.925 ± 0.010 (Figure 4H). In the YSCWM (with salinity of > 32 and temperature of < 12°C), bottom-water DIC:TAlk ratios increased to 0.944 ± 0.008 in summer and 0.959 ± 0.005 in autumn (Figures 3G–I, 4G,H). In early winter, several very high bottom-water DIC:TAlk ratio values of 0.958–0.967 (Figure 4H) were observed at the four deep stations in the central South Yellow Sea, together with DO% of 65–72% and fCO2 of 672–806 μatm (Supplementary Figure S5).
In the northern ECS, survey-averaged DIC:TAlk ratio values in early winter (0.920 ± 0.003) and early spring (0.930 ± 0.006) were much higher than the usual ratio of ∼0.9 in the ECS offshore waters (Table 1), but quite close to the usual DIC:TAlk ratio of wintertime and springtime Yellow Sea waters (Figures 2G–I). This was likely because the YSCC transported the Yellow Sea waters into the northern ECS during the northeast monsoon season (Figure 1A). In late spring, the ECS DIC:TAlk ratio tended to show limited vertical gradient, with surface values of 0.891 ± 0.013 (Supplementary Figure S7I) and bottom-water values of 0.928 ± 0.009 (Figure 4I). In general, the ECS bottom waters increased their DIC:TAlk ratio values to 0.930–0.970 in summer, and then declined to < 0.9 in autumn (Figures 3G–I). At several nearshore stations affected by the ZFCC and those southeastern stations likely affected by the TWWC intrusion, relatively high bottom-water DIC:TAlk ratio values of 0.920–0.930 were also revealed during our autumn 2018 cruise (Figures 3I, 4I).
Bottom-Water AOU and Excess DIC From Late Spring to Autumn
In late spring, both bottom-water AOU and ExcessDIC varied around 0 in the North Yellow Sea (Figure 5A), while the South Yellow Sea bottom-water AOU and ExcessDIC were 17 ± 18 μmol kg–1 and 22 ± 18 μmol kg–1, respectively (Figure 5B). In summer and autumn, the YSCWM AOU increased to summertime 38 ± 21 μmol kg–1 and autumnal 91 ± 15 μmol kg–1, while the YSCWM ExcessDIC increased to summertime 28 ± 20 μmol kg–1 and autumnal 71 ± 16 μmol kg–1 (Figures 5A,B). It is worthwhile to note that the AOU values in the YSCWM area were rarely higher than 110 μmol kg–1.
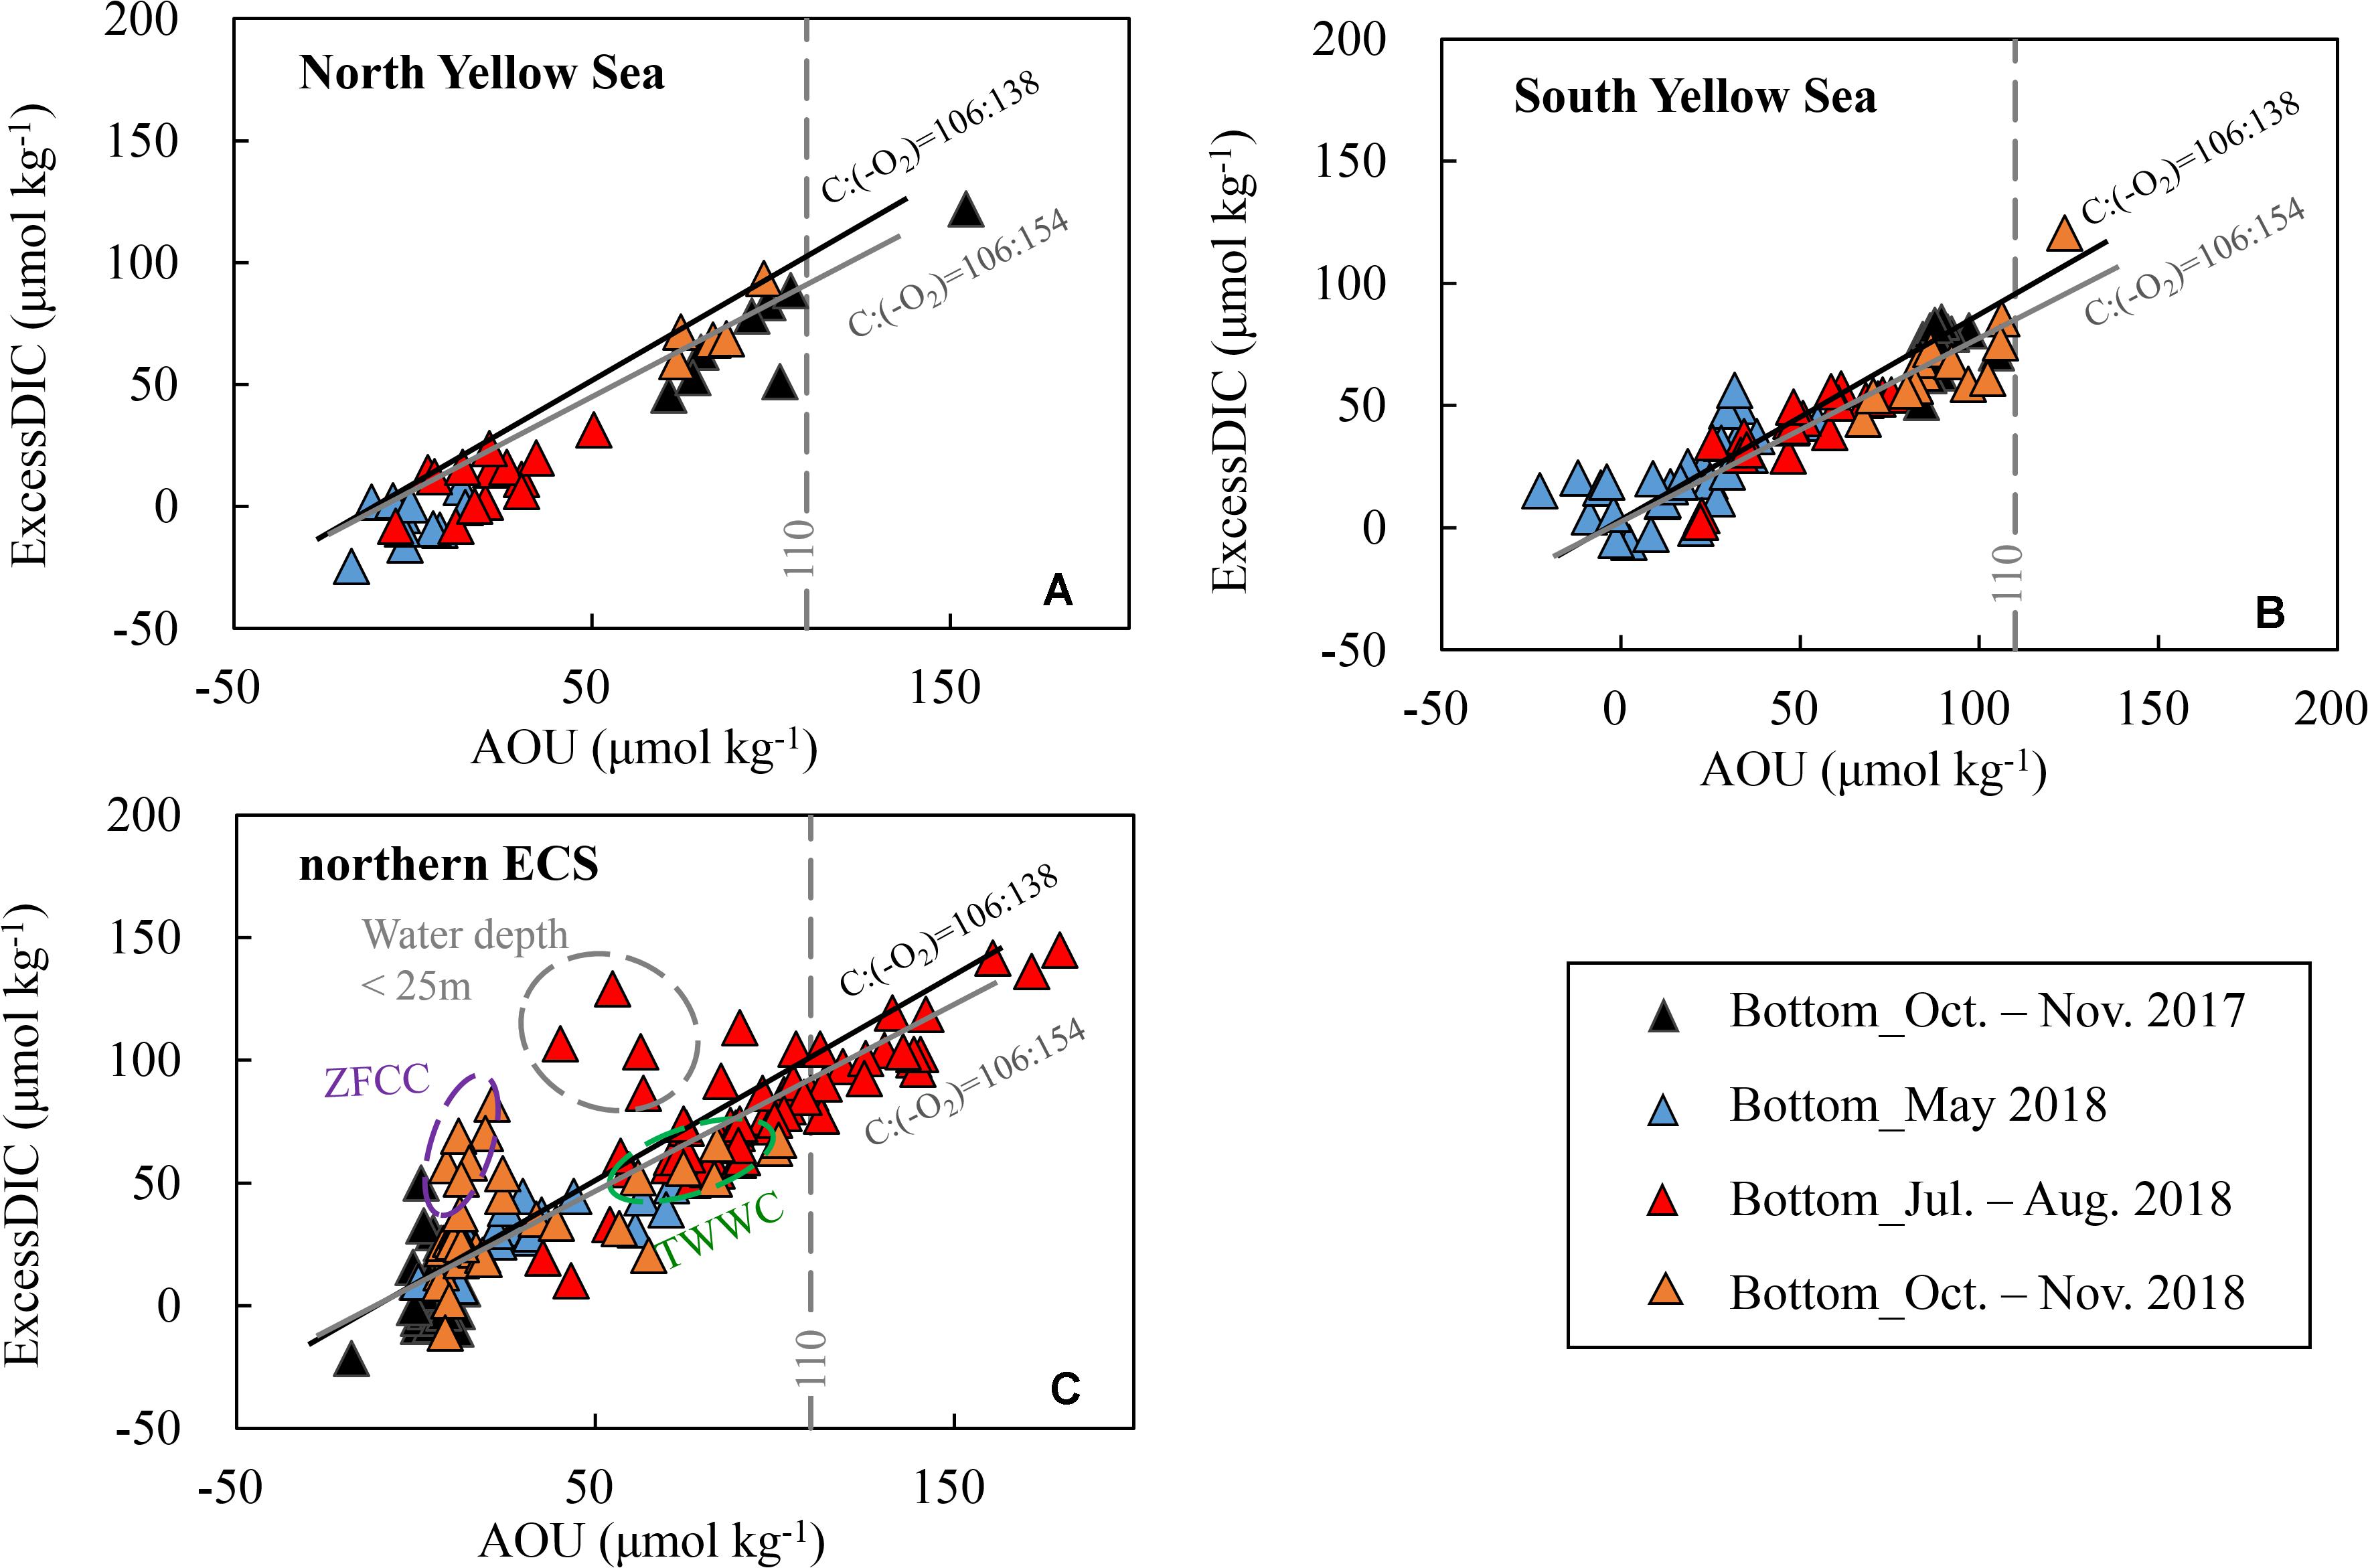
Figure 5. Bottom-water excess dissolved inorganic carbon (ExcessDIC) versus apparent oxygen utilization (AOU) in late spring, summer and autumn. ExcessDIC was defined as the departure from the air-equilibrated DIC (corresponding to a mean atmospheric fCO2 level of 415 ± 5 μatm during our seasonal cruises in 2017–2018). The solid black line exhibits the traditional Redfield ratio, i.e., ΔC:Δ(–O2) = 106:138 (Redfield et al., 1963), and the solid gray line indicates the more recent estimation of ΔC:Δ(–O2) = 106:154 (Hedges et al., 2002). Plots of (A) the North Yellow Sea and (B) South Yellow Sea during summer and autumn are within the YSCWM. In panel (C), several summer plots in the northern East China Sea (ECS) deviated from the Redfield line, as enclosed by gray dashed ellipse, are at shallow sampling sites with water depth of < 25 m. ZFCC = Zhejiang-Fujian Coastal Current in winter and early spring, while TWWC = TaiWan Warm Current.
In the northern ECS, bottom-water AOU and ExcessDIC increased from moderate levels (AOU = 36 ± 23 μmol kg–1, ExcessDIC = 33 ± 12 μmol kg–1) in late spring to very high levels (AOU = 98 ± 31 μmol kg–1, ExcessDIC = 83 ± 27 μmol kg–1) in summer, and declined to relatively low levels (AOU = 11 ± 16 μmol kg–1, ExcessDIC = 20 ± 24 μmol kg–1) in autumn (Figure 5C). Different from the Yellow Sea situation that only a few sampling sites had extremely high AOU values of more than 110 μmol kg–1, nearly one third of our ECS sampling sites were occupied with the extremely high AOU values of 110–179 μmol kg–1 in summer (Figure 5C). The southward-moving ZFCC (observed at nearshore stations with low salinity of < 31) was characterized by AOU of nearly 0 but high ExcessDIC of 40–80 μmol kg–1, while the northward-upwelling TWWC (observed at southeastern offshore stations with high salinity of > 34) was characterized by both high AOU (60–100 μmol kg–1) and high ExcessDIC (50–65 μmol kg–1) (Figure 5C).
Seasonal Variations in pHT and Ωarag
In the Yellow Sea, wintertime and springtime pHT and Ωarag were generally homogenous, while pHT and Ωarag displayed vertical gradient in summer and autumn. Its early-winter pHT and Ωarag were 8.04 ± 0.05 and 1.94 ± 0.22, respectively, while its early-spring pHT and Ωarag were 8.08 ± 0.05 and 1.86 ± 0.16, and the late-spring pHT and Ωarag were 8.04 ± 0.06 and 1.98 ± 0.34 (Table 1). During our summer and autumn cruises, surface pHT ranged between 7.98 ± 0.07 and 8.04 ± 0.05 (Supplementary Figures S7M,N), while surface Ωarag varied from 2.58 ± 0.30 to 3.00 ± 0.36 (Supplementary Figures S7P,Q). The YSCWM pHT decreased to 7.97 ± 0.05 in summer (mostly lower than the present-day air-equilibrated level of 8.0–8.1) and 7.85 ± 0.04 in autumn. Note that very low pHT values of 7.71–7.80 occurred in the YSCWM in autumn (Figures 4J,K), suggesting that the concentration of total hydrogen ions should be twice the present-day air-equilibrated level of 8.0–8.1. The YSCWM Ωarag declined to 1.59 ± 0.18 in summer and 1.28 ± 0.09 in autumn (Figures 2J,K). Its autumnal lowest Ωarag value of 1.07 was detected in the northern area of the YSCWM (Figure 4M), which was even close to the critical value for the ideal aragonite dissolution. Even in early winter, very low bottom-water pHT values of 7.77–7.85 (Figure 4K) and Ωarag values of 1.13–1.29 (Figure 4N) were also observed at the four deep stations (in the central South Yellow Sea) mentioned in section “DIC and DIC:TAlk Ratio.”
In the northern ECS, the early-winter pHT and Ωarag were averaged at 8.03 ± 0.02 and 2.08 ± 0.07, respectively, and the early-spring pHT and Ωarag were averaged at 8.03 ± 0.02 and 1.85 ± 0.12, respectively (Table 1). In late spring, the ECS bottom-water pHT and Ωarag were averaged at 7.96 ± 0.03 and 1.90 ± 0.21, respectively (Figure 2L), while its surface pHT and Ωarag were averaged at 8.09 ± 0.05 (Supplementary Figure S7O) and 2.80 ± 0.30 (Supplementary Figure S7R), respectively. In summer, the ECS bottom-water pHT and Ωarag were averaged at 7.85 ± 0.07 and 1.91 ± 0.32, respectively (Figure 2L), while the surface pHT and Ωarag were averaged at 7.99 ± 0.16 (Supplementary Figure S7O) and 2.99 ± 0.99 (Supplementary Figure S7R), respectively. Near the riverine mouth of Changjiang, quite low summertime bottom-water pHT values of 7.68–7.74 and Ωarag values of 1.21–1.39 were observed at five stations (Figures 3K,N, 4L,O). Three of these seriously acidified stations (pHT 7.68–7.71; Ωarag 1.28–1.39) suffered from summertime hypoxia (with DO values of 49–63 μmol O2 kg–1), while the other two stations (pHT 7.68 and 7.74; Ωarag 1.21 and 1.39) were very shallow (with water depth of ∼10 m) and vertically well-mixed. In autumn, most pHT and Ωarag in the northern ECS increased to nearly air-equilibrated values of ∼8.00 and ∼2.60 (Figures 2–3), except for several stations likely affected by the ZFCC and the TWWC intrusion, where low pHT values of 7.86–7.99 and low Ωarag values of 1.97–2.60 were detected (Figures 4L,O).
Discussion
Processes Driving Seasonal Variations of Bottom-Water DIC, pHT, and Ωarag
Dynamics of DIC, pHT, and Ωarag in coastal zones are subject to multi-drivers, including coastal upwelling (Feely et al., 2008), riverine freshwater inputs (Salisbury et al., 2008; Rheuban et al., 2019; Xiong et al., 2019), vertical and lateral water mixing (Wang et al., 2013; Wanninkhof et al., 2015), and metabolic processes (Feely et al., 2010). In addition to these drivers, the seasonal temperature variability also affects the carbonate chemistry (Zhai et al., 2014b). In an open system, the temperature effect on carbonate system parameters includes the internal thermodynamic equilibrium shift and the air-sea CO2 exchange caused by the solubility change (Xue et al., 2017; Cai et al., 2020). These two temperature effects tend to cancel each other out for pHT, but to enhance each other for Ωarag because of the dominant role of gas equilibrium (Cai et al., 2020).
To illuminate the temperature effect on seasonal changes of carbonate system parameters, air-equilibrated DIC, DIC:TAlk ratio, pHT and Ωarag values (corresponding to a mean air-equilibrated fCO2 value of 415 ± 5 μatm in 2017–2018) in the Yellow Sea and northern ECS were plotted against the seawater temperature. Both of air-equilibrated DIC and DIC:TAlk ratio increased as temperature decreased (Figures 6A–C,E–G). However, air-equilibrated pHT varied limitedly with temperature change (Figures 6I–K), whereas air-equilibrated Ωarag decreased as temperature decreased (Figures 6M–O).
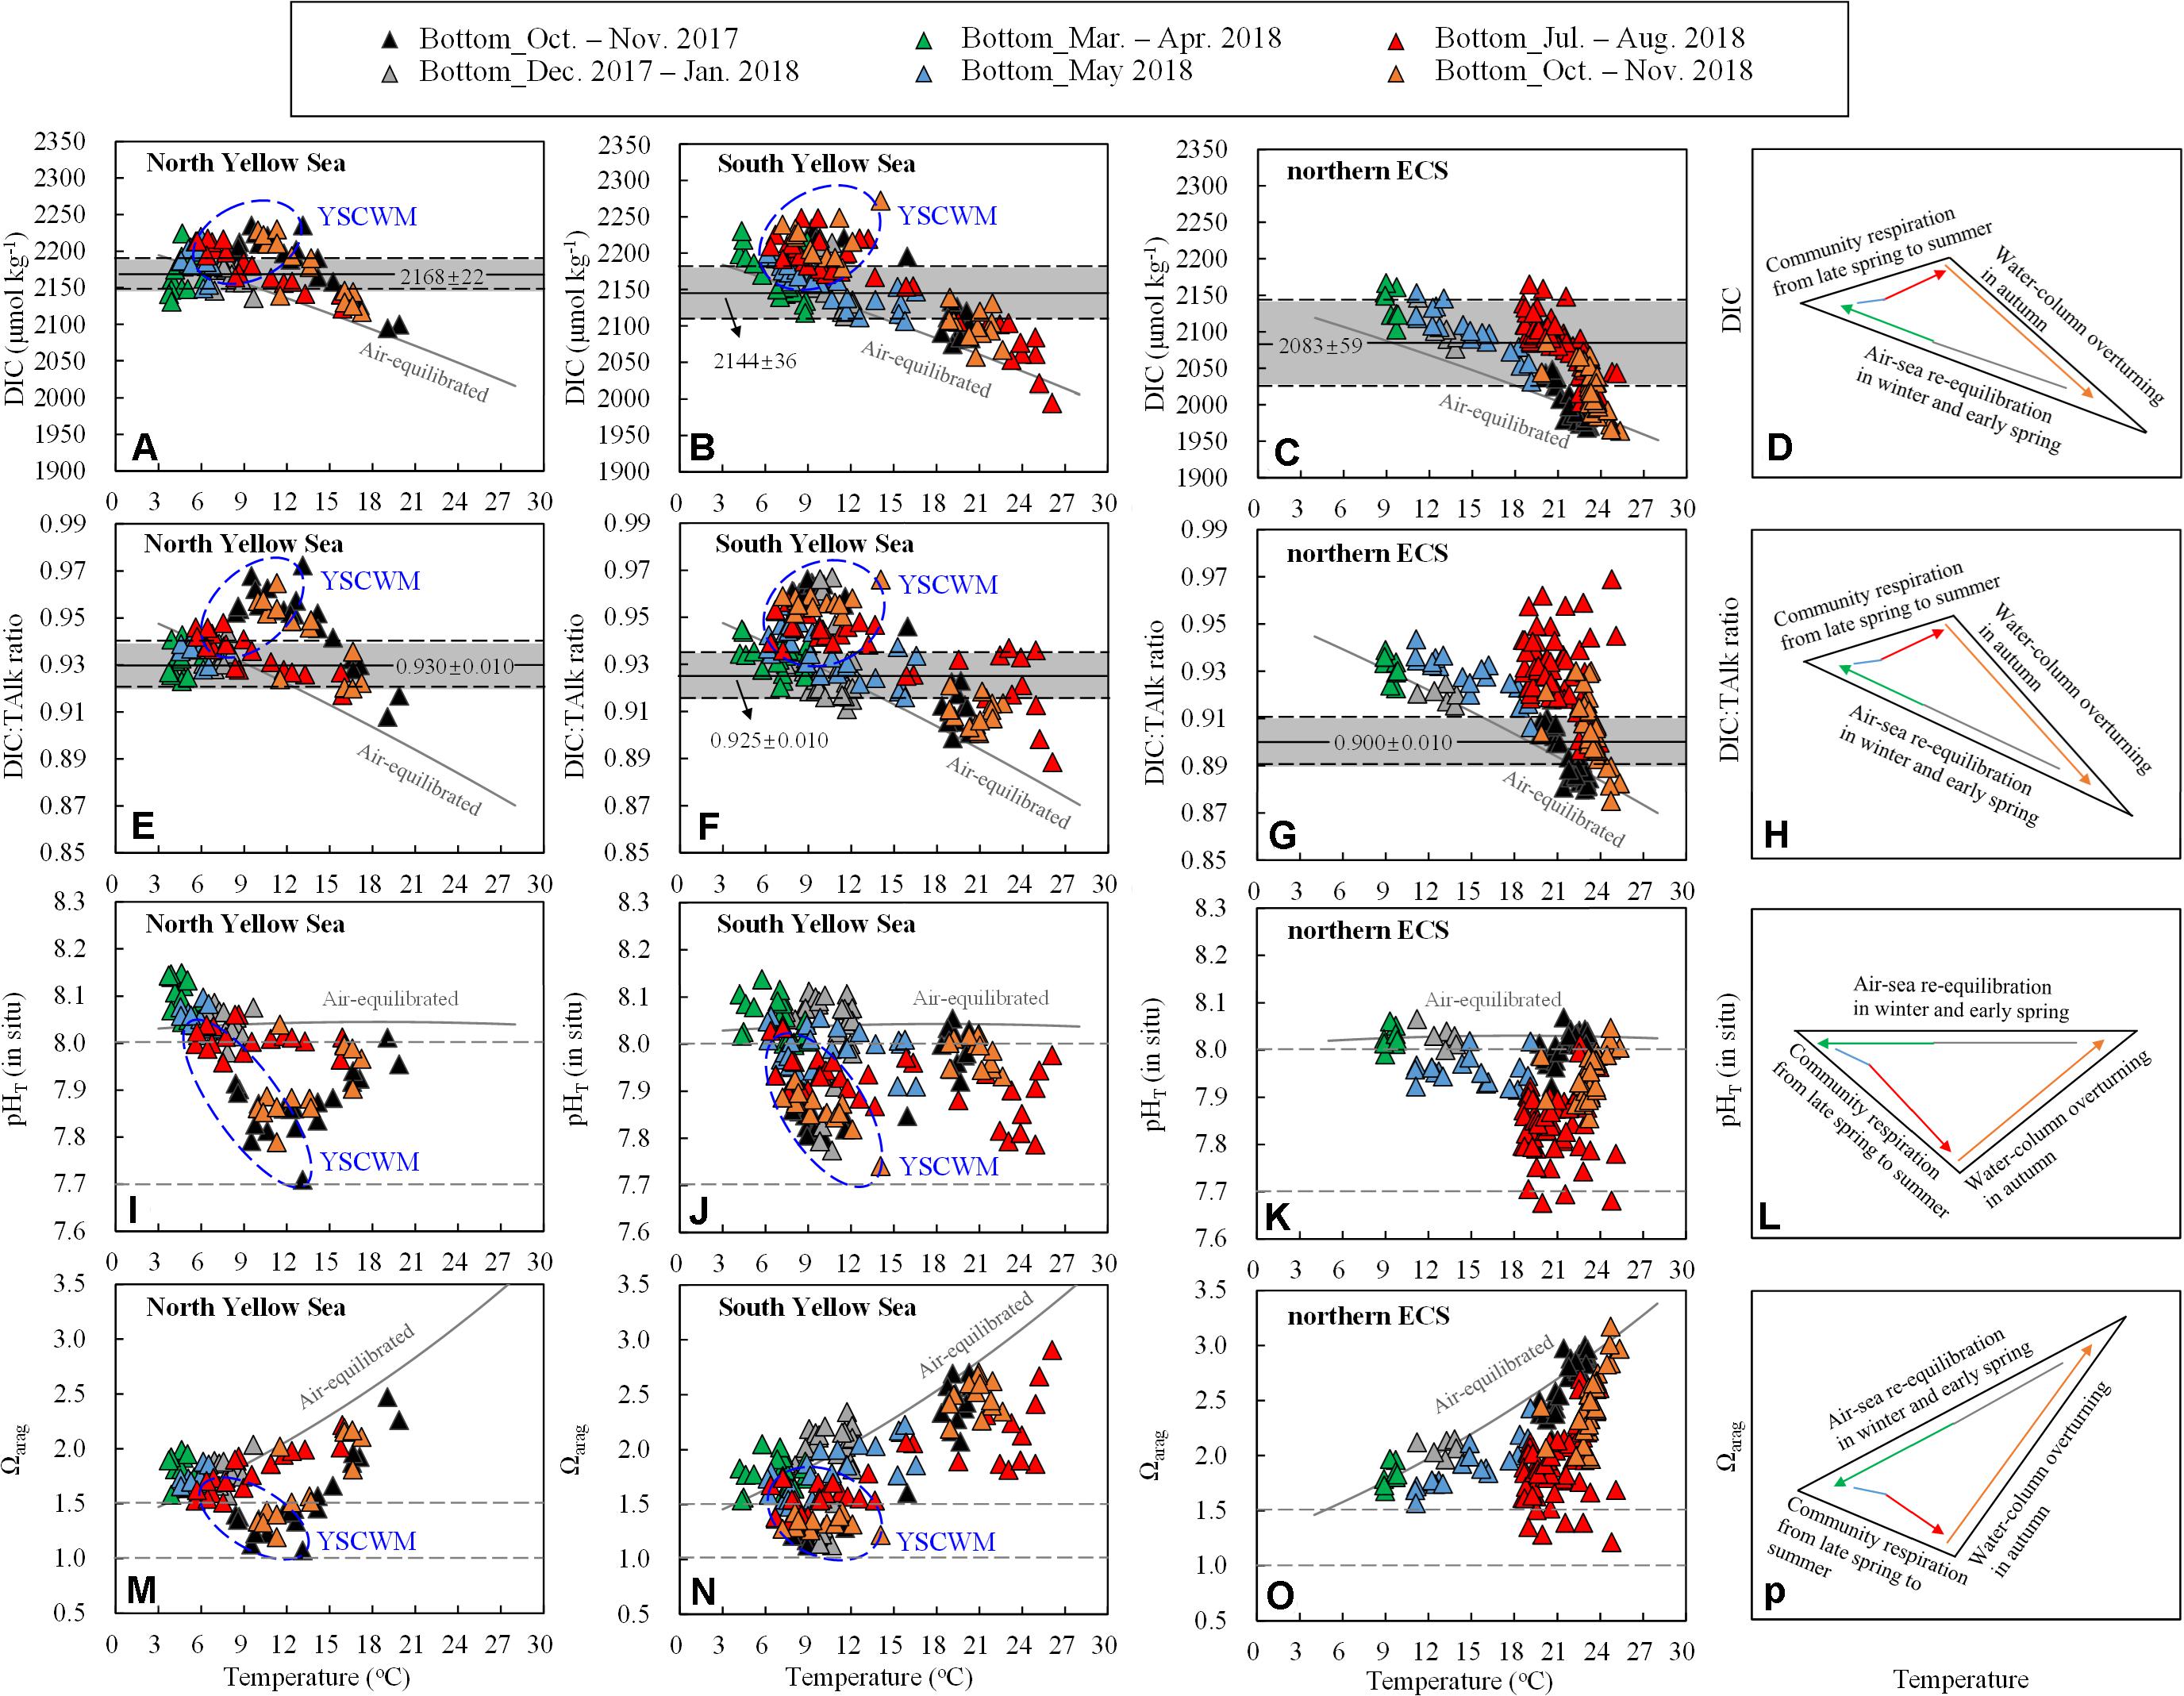
Figure 6. Bottom-water (A–C) DIC, (E–G) DIC:TAlk ratio, (I–K) pHT (in situ), and (M–O) Ωarag versus temperature. Solid gray curves are air-equilibrated levels of bottom-water DIC, DIC:TAlk ratio, pHT and Ωarag (corresponding to a mean air-equilibrated fCO2 value of 415 ± 5 μatm during our seasonal cruises in 2017–2018) at mean salinity and TAlk in the North Yellow Sea (salinity = 32.1, TAlk = 2316 μmol kg– 1), South Yellow Sea (salinity = 32.2, TAlk = 2305 μmol kg– 1) and northern ECS (salinity = 33.0, TAlk = 2243 μmol kg– 1). Data for the YSCWM are enclosed within a blue ellipse. In (A–C) and (E–G), gray shaded areas represent mean ± SD of wintertime/springtime DIC and DIC:TAlk ratios in the North Yellow Sea, in the South Yellow Sea, and in the northern ECS. Major processes controlling seasonal variations of bottom-water (D) DIC, (H) DIC:TAlk ratio, (L) pHT (in situ) and (P) Ωarag are also sketched.
Wintertime Re-equilibration
In shallow waters away from upwelling systems, the carbonate system within the water column re-equilibrated with atmospheric CO2 every year between winter and spring (Figures 2D–F). Comparing field-measured carbonate system parameters in the two coastal seas with their air-equilibrated levels, wintertime and springtime carbonate system parameters mostly varied around the corresponding air-equilibrated levels (Figure 6), showing the dominant role of air-sea re-equilibration at the beginning of warm-season stratification formation. At the four deep stations within the central South Yellow Sea, however, the early-winter DIC and DIC:TAlk ratio were much higher than their air-equilibrated values (Figures 6B,F), while the early-winter pHT and Ωarag were substantially lower than their air-equilibrated values (Figures 6J,N). Supersaturated bottom-water fCO2 values of 672–806 μatm were also detected at these four stations, despite their vertical profiles of temperature and salinity were nearly homogenous (Supplementary Figures S3–S5). This is because that a longer period of time of 25–100 days was needed for the CO2-rich waters to equilibrate with the atmosphere (Zhai et al., 2014b; Li and Zhai, 2019). In the North Yellow Sea, the early-spring pHT (8.10 ± 0.04) and Ωarag (1.81 ± 0.13) were slightly higher than those air-equilibrated levels estimated at a low temperature of 5°C (Figures 6I,M). This was likely because water-cooling lowered fCO2 to form an undersaturated level of ∼350 μatm in April 2018 (Figure 2D). The similarly springtime undersaturated fCO2 has been observed earlier in the North Yellow Sea in May 2011 and May 2012 (Zhai et al., 2014b).
Summertime Respiration Beneath Thermoclines
In summer, most bottom-water DIC and DIC:TAlk ratio in the Yellow Sea and northern ECS were higher than their air-equilibrated levels (Figures 6A–C,E–G). In the YSCWM waters, summertime DIC addition and DIC:TAlk ratio increase relative to the corresponding air-equilibrated values were 10–50 μmol kg–1 and 0.1–0.2, respectively (Figures 6A,B,E,F). In comparison, the northern ECS showed much greater summertime increases in bottom-water DIC and DIC:TAlk ratio, which were 50–100 μmol kg–1 and 0.2–0.7 over the air-equilibrated values (Figures 6C,G). An abundant supply of sinking organic matter induced by the eutrophic Changjiang plume and summertime strong stratification were key factors forming and maintaining very high bottom-water DIC and pCO2 in the ECS shelf waters in summer (Chou et al., 2009, 2013b). It is worthwhile to note that several warm southern stations in the South Yellow Sea also exhibited very high DIC:TAlk ratio (∼0.93) relative to their air-equilibrated levels (∼0.89) at seawater temperature of >20°C (Figure 6F), likely due to the northeastward-flowing CDW in summer (Xu et al., 2016; Zhai, 2018).
To reveal the possible source processes dominating these DIC additions, we plotted bottom-water DIC additions relative to the corresponding air-equilibrated levels (i.e., ExcessDIC) against AOU (Figure 5). In both of the YSCWM and the northern ECS, ExcessDIC versus AOU was reasonably in agreement with the stoichiometry of marine phytoplankton organic matter oxidation, including the traditional Redfield ratio, i.e., ΔC:Δ(–O2) = 106:138, and the more recent estimation of ΔC:Δ(–O2) = 106:154 (Hedges et al., 2002). The ΔC:Δ(–O2) ratio of 106/154 falls in the range of marine phytoplankton respiration quotients of 106/140 and 106/160 recommended by Anderson (1995) and Sarmiento and Gruber (2006). These facts indicate that both bottom-water DIC additions and DO depletions were dominated by the community respiration beneath thermoclines.
In the ECS shallow areas where wind-driven collapse of water stratification occasionally occurred (Figure 3B), the bottom-water ventilation might bias the relationship of ExcessDIC and AOU (Figure 5C) due to the slower re-equilibration of CO2 than O2 (Zeebe and Wolf-Gladrow, 2001). In the South Yellow Sea and northern ECS, some late-spring plots also followed the Redfield line (Figures 5B,C), likely due to an earlier start of metabolic processes in warm southern waters, as supported by those sinking biogenic particles induced by frequent springtime blooms in the outer Changjiang Estuary and the South Yellow Sea (He et al., 2013).
The summertime increases in bottom-water DIC and DIC:TAlk ratio suppressed the Ωarag (Figure 8), while the bottom-water pHT declines in summer and/or autumn (Figures 6I–K) also mirrored the seasonal increases in bottom-water DIC (Figures 6A–C) and DIC:TAlk ratio (Figures 6E–G). Therefore, the community respiration under thermoclines was mainly responsible for summertime and/or autumnal low pHT and Ωarag in these regions.
In comparison to the Yellow Sea, the northern ECS exhibited greater increases in bottom-water DIC and DIC:TAlk ratio in summer, thereby leading to larger decreases in the bottom-water pHT and Ωarag (Figure 6). It is worthwhile to note that summertime bottom-water pHT values in the northern ECS were lower than those in the Yellow Sea (Figures 6I–K), while summertime bottom-water Ωarag values were roughly comparable in the two coastal seas (Figures 6M–O). The latter was partially caused by the lower yearly initial Ωarag in the colder Yellow Sea waters in winter and spring (section “Wintertime Re-equilibration Naturally Preconditions the Water Column”).
Autumnal Collapse of Thermoclines and the Water-Column Overturning
In typical autumn months (October and November), the seasonal stratification was usually weakened and even collapsed, except for the central Yellow Sea and a small ECS region affected by the TWWC intrusion (Figures 3A,C). Correspondingly, the earlier CO2-rich and DO-depleted subsurface and/or bottom waters tended to approach their air-equilibrated levels (Figure 6). The similar autumn CO2-releasing process has been reported earlier in the northern ECS (Shim et al., 2007; Zhai and Dai, 2009; Guo et al., 2015).
In summary, three primary processes controlled seasonal variations of bottom-water DIC, DIC:TAlk ratio, pHT and Ωarag in the Yellow Sea and northern ECS (Figures 6D,H,L,P). The air-sea re-equilibration played a fundamental role in wintertime carbonate system parameters. In summer, the community respiration beneath thermoclines dominated the increases in bottom-water DIC and DIC:TAlk ratio and the declines in bottom-water pHT and Ωarag. Moreover, the autumnal collapse of thermoclines driven by cooling-induced water-column overturning or episodic wind-driven mixing events led to bottom-water ventilation, causing these carbonate system parameters to approach their air-equilibrated levels.
Comparison With Other Studies Relating to Seasonal Acidification in the Yellow Sea and the Northern East China Sea
In the Yellow Sea, respiration-induced declines in subsurface pHT, Ωarag and DO from spring to autumn were first reported by Zhai et al. (2014b). Low pHT values of 7.79–7.90, low Ωarag values of 1.13–1.40 and low DO% of 57–66% dominated subsurface waters of the central North Yellow Sea in autumn 2011 (Zhai et al., 2014b). During a summer flood in 2013, the community respiration coupled with freshwater dilution contributed to the occurrence of corrosive waters (Ωarag < 1) along the north coast of the North Yellow Sea, near the Yalu River estuary (Zhai et al., 2015). Stratification was an important factor affecting the accumulation of respiration-induced CO2 in the Yellow Sea, especially in the YSCWM (Xu et al., 2018). The respiration-induced CO2 was accumulated during summer and autumn in the YSCWM-dominated area, leading to one third of the surveyed areas in the Yellow Sea to have pHT < 7.9 and Ωarag < 1.5 in subsurface and bottom waters (Zhai, 2018). Also, a significant DO depletion occurred in the summertime and autumnal YSCWM, with the lowest DO% of 45% observed in autumn (Xu et al., 2016; Zhai, 2018). In addition, the bottom water on the Korean side of the South Yellow Sea was already undersaturated with aragonite (with DO% of ∼60%) in autumn (Choi et al., 2020), presumably due to ocean dumping of organic materials in the central Yellow Sea (Choi et al., 2020).
In the northern ECS off the Changjiang Estuary, low pHT values of ∼7.8 and low Ωarag values of ∼1.5 have been reported earlier in its summertime hypoxic zone (Cai et al., 2011; Wang B. et al., 2017). The term hypoxia refers to a DO threshold of lower than 2 mg L–1, that is, 63 μmol O2 L–1 or approximately 30% saturation (Dauer et al., 1992; Rabalais et al., 2010). The summertime hypoxic area in the ECS was estimated at greater than 12,000 km2 (or 432 km3 volume, Chen et al., 2007), which was comparable to the largest coastal hypoxic zones observed in the world (Diaz, 2001; Fennel and Testa, 2019). To date, aragonite undersaturation has not been observed in the northern ECS, although the lowest summertime bottom-water Ωarag value in the outer Changjiang Estuary has showed an alarming decline in recent years from 1.70 in July 2009 (Chou et al., 2013a) to 1.52 in July 2016 and to 1.39 in July 2017 (Xiong et al., 2019). Chou et al. (2013a) predicted that the combination of intensifying eutrophication and increasing atmospheric CO2 would push the bottom water of the Changjiang plume area toward undersaturated with respect to aragonite (Ωarag ∼0.8) by the end of this century.
The integrated results of these fragmented studies have suggested that the present-day lowest bottom-water Ωarag in the Yellow Sea was usually lower than that in the northern ECS. The Yellow Sea might be more vulnerable than the adjacent ECS shelf to the potentially negative effects of CO2 acidification (Zhai et al., 2014b). However, the difference in behaviors of bottom-water DO depletion and CO2 acidification between the two coastal seas was not investigated in previous studies.
In this new research, the lowest regional bottom-water Ωarag values were detected at 1.07 in the Yellow Sea and 1.21 in the northern ECS (Figures 6M–O), which were generally in agreement with the previous results. However, the lowest bottom-water pHT and Ωarag in the northern ECS observed in this study (7.68 and 1.21 in July 2018) were lower than those reported in previous studies. This might suggest that the respiration-induced CO2 acidification was developing rapidly in the northern ECS bottom waters off the Changjiang Estuary. Note that our results of this study were based on a latest transregional investigation, spanning all four seasons. Seasonal evolutions and controls of bottom-water DO and carbonate system parameters in both the Yellow Sea and northern ECS were detailed in this study (Figures 2, 6). Moreover, the different behaviors of bottom-water DO depletion and CO2 acidification in the two coastal seas will be discussed in section “Different Behaviors of Bottom-Water DO Depletion and CO2 Acidification in the Two Contrasting Coastal Seas.”
Different Behaviors of Bottom-Water DO Depletion and CO2 Acidification in the Two Contrasting Coastal Seas
The community respiration beneath thermoclines induces both DO depletions and CO2 accumulations, thus depressing bottom-water pHT and Ωarag. The following stoichiometric relationships (assuming the usual Redfield ratio) were used to characterize this respiration-driven process:
All acid-base conversions were based on the dominant species in the saline aquatic environment at a pH of ∼8.
The coastal hypoxia is usually associated with the respiration-induced CO2 acidification (Cai et al., 2011; Melzner et al., 2013). However, the Yellow Sea bottom-water DO values were always much higher than the threshold for hypoxia, despite the occurrence of seasonal acidification (Figures 7A,B,D,E). In contrast, the northern ECS off the Changjiang Estuary is a well-documented summertime hypoxic zone (e.g., Li et al., 2002; Zhu et al., 2011). In the ECS hypoxic zone, quite low pHT values of ∼7.7 and critically low Ωarag values of < 1.5 were observed in summer (Figures 7C,F).
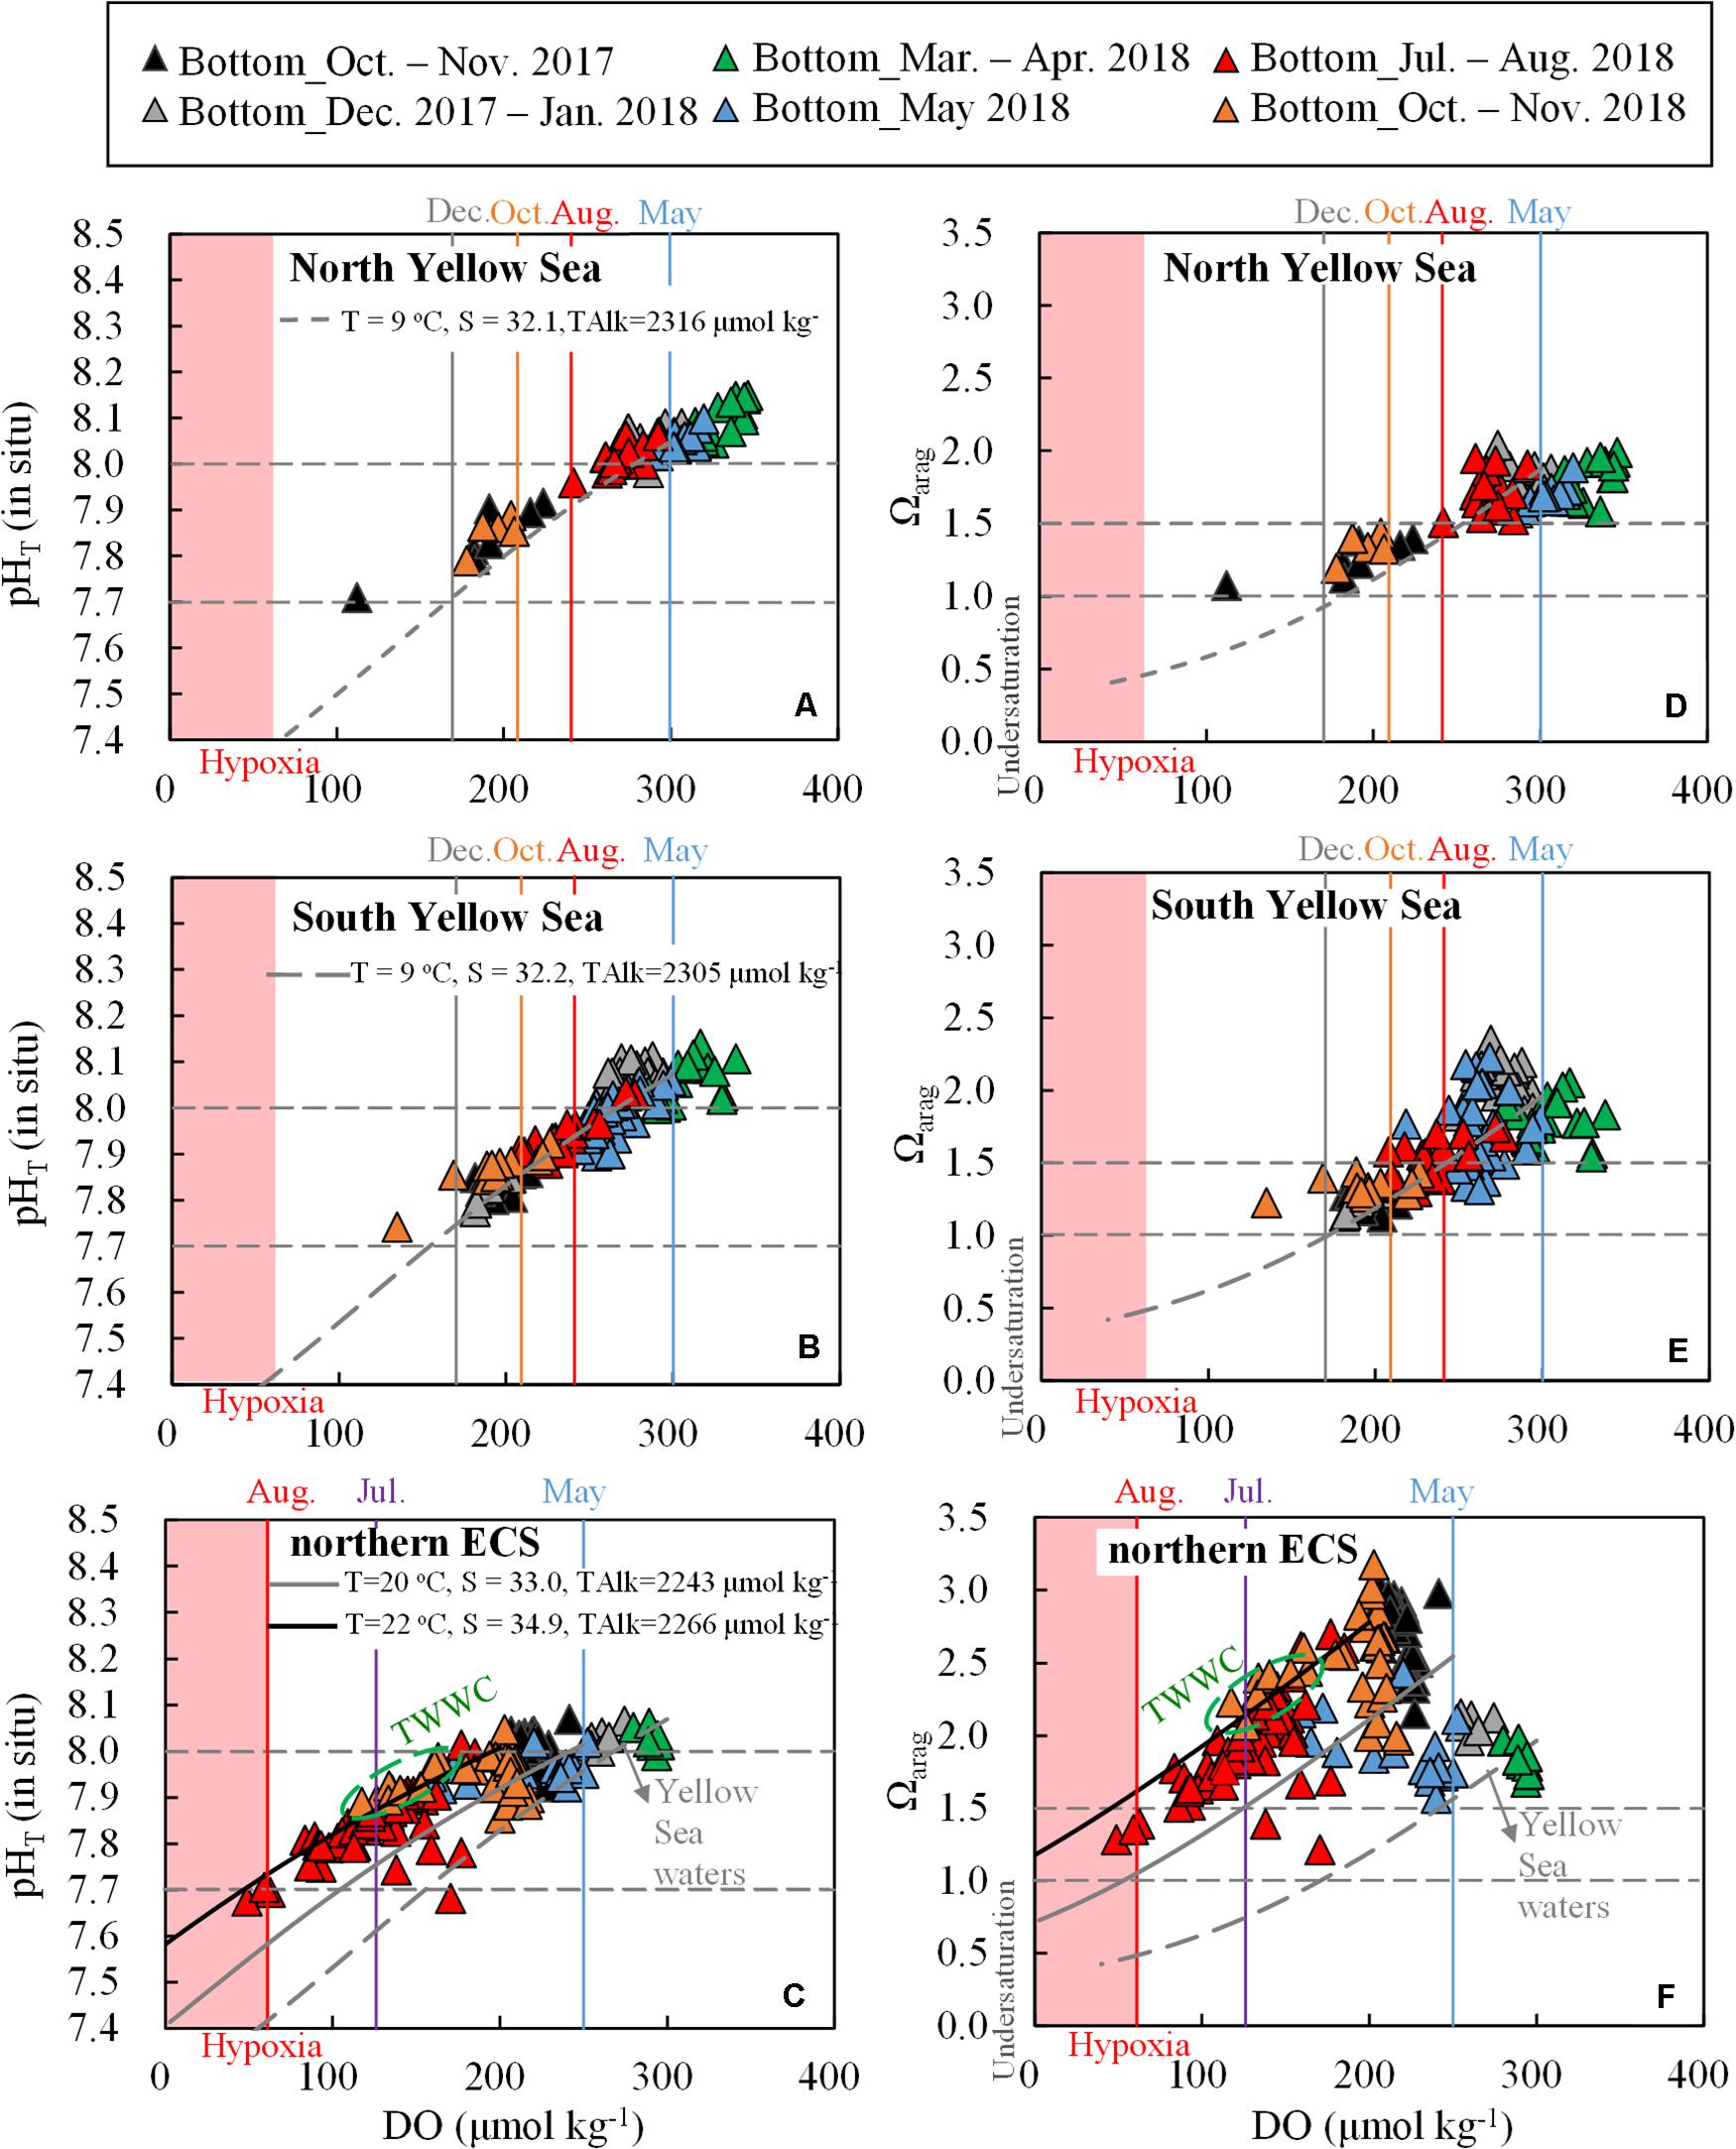
Figure 7. (A–C) Bottom-water pHT (in situ) versus DO and (D–F) Ωarag versus DO. Shaded pink areas represent hypoxia (DO < 63 μmol O2 kg– 1). Data points in the Yellow Sea during summer to autumn are within the YSCWM. Black and gray curves represent respiration-induced pHT and Ωarag changes, based on the Redfield equation and the corresponding net DO consumption rates in the Yellow Sea (0.6 μmol O2 kg– 1 d– 1) and northern ECS (2 μmol O2 kg– 1 d– 1). During calculation, starting conditions for the North Yellow Sea were DO = 300 μmol kg– 1, DIC:TAlk ratio = 0.930; starting conditions for the South Yellow Sea were DO = 300 μmol kg– 1, DIC:TAlk ratio = 0.925; starting conditions for the northern ECS were DO = 250 μmol kg– 1, DIC:TAlk ratio = 0.900, while for the ECS offshore waters (affected by the TWWC) were DO = 200 μmol kg– 1, DIC:TAlk ratio = 0.890. The impact of respiration on TAlk (ΔTAlk:ΔDIC = –17/106) was also included.
To investigate the different behaviors of bottom-water DO depletion and CO2 acidification in the Yellow Sea and the northern ECS, we compared their yearly initial conditions and respiration processes, and then modeled seasonal changes in bottom-water DO, pHT and Ωarag in the two contrasting coastal seas.
Wintertime Re-equilibration Naturally Preconditions the Water Column
At the beginning of the warm-season stratification formation, yearly initial DO values (i.e., air-equilibrated wintertime/springtime values) in cold Yellow Sea waters (∼300 μmol kg–1 at 9°C) were higher than those in the warmer northern ECS waters (∼250 μmol kg–1 at 20°C) (Figure 7). The yearly initial pHT values in the two coastal seas were similar (8.0–8.1, Figures 7A–C), whereas yearly initial DIC:TAlk ratio and Ωarag values were quite different. The Yellow Sea had higher yearly initial DIC:TAlk ratio (0.925–0.930) and lower yearly initial Ωarag values (1.8–1.9) than those in the northern ECS (DIC:TAlk ratio ∼0.9 and Ωarag ∼2.5) (Figures 6E–G, 7D–F).
In these cold seasons that were free from community respiration, the north-to-south decreasing gradient of yearly initial DIC:TAlk ratio was dominated by the CO2 solubility. Seawater CO2 solubility increased with the decrease of temperature (Weiss, 1974), resulting in lower [CO32–] and Ωarag in colder waters compared with warmer waters. Note that the internal temperature effect only accounts for < 5% of the variations in Ωarag (Zhai et al., 2014b). With respect to pHT, however, the CO2-dissolving induced [H+] increase in cold waters was greatly canceled out by the [H+] decrease due to the internal temperature effect of pH (Yamamoto S. et al., 2012; Cai et al., 2020). Therefore, the yearly initial pHT varied minimally along the north-to-south latitude gradient. Even over diverse ecosystems found between the poles and tropics, the air-equilibrated pHT values changed limitedly in a narrow range of 8.020–8.074 (Hofmann et al., 2011). In a word, the air-equilibrated Ωarag was much more sensitive to seawater temperature than the air-equilibrated pHT. Wintertime re-equilibration naturally preconditioned the water column to have different yearly initial values of DO, pHT, Ωarag and DIC:TAlk ratio.
Different Respiration Rates and Duration
Not only yearly initial values of DO and carbonate system parameters, but also respiration rates and duration were quite different between the two coastal seas. The Yellow Sea (especially within the YSCWM) showed higher bottom-water AOU in autumn than in summer (Figures 5A,B). In the northern ECS, bottom-water AOU reached the maximum value in summer and then sharply declined in autumn (Figure 5C). Although the respiration duration beneath thermoclines in the northern ECS was shorter than the Yellow Sea, nearly one third of summertime bottom-water AOU values (with a range of 113–179 μmol kg–1) in northern ECS was about 24–97% higher than autumnal bottom-water AOU values in the Yellow Sea (91 ± 15 μmol kg–1). Also, the bottom-water averaged apparent DO depletion rate in the northern ECS (1.8 μmol O2 kg–1 d–1) were about three times higher than that in the Yellow Sea (0.6 μmol O2 kg–1 d–1), indicating a much higher net community respiration rate in the northern ECS as compared to the Yellow Sea.
In the Yellow Sea, the low bottom-water averaged apparent DO depletion rate of 0.6 μmol O2 kg–1 d–1 was comparable to the net community respiration rate previously observed in the northern area of the YSCWM (Zhai et al., 2014b; Li and Zhai, 2019). In the northern ECS, however, its bottom-water averaged apparent DO depletion rate of 1.8 μmol O2 kg–1 d–1 was lower than the lower limit of field-measured community respiration rates (∼3 μmol O2 kg–1 d–1) on the basis of DO decreasing in dark incubation experiments (Chen et al., 2006; Zhu et al., 2016). A quick formation of bottom-water hypoxia was observed off the Changjiang Estuary within only 6 days after a typhoon disturbance (Wang B. et al., 2017), equivalent to an extremely high DO drawdown rate of 22 μmol O2 kg–1 d–1. Both bottle incubation results and the field data deduction suggest that the northern ECS should have relatively high net community respiration rates in its summertime oxygen-depleted bottom waters. However, the central Yellow Sea accumulated respiration products beneath the thermocline in summer and autumn, while the northern ECS bottom waters preserved them only in summer.
Coupling of Bottom-Water DO Depletion and CO2 Acidification
To further explore the differentiation of bottom-water DO depletion and CO2 acidification in the Yellow Sea and northern ECS, seasonal changes in bottom-water DO, pHT and Ωarag were modeled based on Eq. (3) and different yearly initial values and respiration rates in the two coastal seas. When the respiration-induced DO depletion process started, DIC changed according the traditional Redfield ratio, i.e., ΔDIC:ΔAOU = 106:138, and the impact of respiration on TAlk (ΔTAlk:ΔDIC = –17/106) was also considered. During calculation, as detailed above, yearly initial conditions in the North Yellow Sea were DO = 300 μmol O2 kg–1, DIC:TAlk ratio = 0.930; in the South Yellow Sea, yearly initial DO = 300 μmol O2 kg–1, yearly initial DIC:TAlk ratio = 0.925; in the northern ECS, yearly initial DO = 250 μmol O2 kg–1, yearly initial DIC:TAlk ratio = 0.900. The net community respiration rates were assumed to be 0.6 μmol O2 kg–1 d–1 in the Yellow Sea and 2 μmol O2 kg–1 d–1 in the northern ECS. Temperature, salinity and TAlk were set to the mean value in bottom waters in the given region: T = 9°C, S = 32.1, and TAlk = 2316 μmol kg–1 in the North Yellow Sea; T = 9°C, S = 32.1, and TAlk = 2305 μmol kg–1 in the South Yellow Sea; T = 20°C, S = 33.0, and TAlk = 2243 μmol kg–1 in the northern ECS. The effect of mixing with the northeast-monsoon-driven ZFCC was not included (affected only several nearshore stations, Figure 1G), while the effect of the year-round TWWC intrusion was included. Starting conditions for the TWWC-affected offshore waters were DO = 200 μmol kg–1 and DIC:TAlk ratio = 0.890.
Field-measured bottom-water pHT versus DO and Ωarag versus DO reasonably followed those Redfield lines in both the Yellow Sea and northern ECS (Figure 7). The Redfield-based coupling of DO depletion and CO2 acidification suggested again that both pHT and Ωarag declines in the two coastal seas were controlled by the community respiration beneath thermoclines. At those low-oxygen levels, the Yellow Sea data showed consistently lower bottom-water pHT and Ωarag values than those in the northern ECS (Figure 7). It is worthwhile to note that field-measured observations in the northern ECS fell between the local reaction in the northern ECS (solid gray curves) and the TWWC-affected reaction (solid black curves, Figures 7C,F), suggesting the both the local respiration and the TWWC intrusion influenced DO and carbonate system parameters in the northern ECS.
In summary, the Yellow Sea had higher yearly initial DO values, higher yearly initial DIC:TAlk ratio but lower yearly initial Ωarag values than those in the northern ECS. However, yearly initial pHT values exhibited only a few differences between the two coastal seas. The different behaviors of yearly initial pHT and Ωarag were consistent with their different responses to the temperature variability. Moreover, higher CO2 solubility together with the respiration-induced CO2 additions resulted in the colder Yellow Sea waters to have higher DIC:TAlk ratio and thus lower Ωarag as compared with those in warm northern ECS waters. Assuming that the DIC:TAlk ratio difference (0.025) between 0.925 in wintertime/springtime Yellow Sea waters (Figure 6F) and a typical open-ocean seawater DIC:TAlk ratio of 0.900 (Figure 6G) was only induced by CO2 solubility difference, and considering the excellent linear relationship between bottom-water Ωarag and DIC:TAlk ratio, the contribution of the yearly initial high CO2 solubility to summertime low Ωarag in the Yellow Sea (with the averaged DIC:TAlk ratio of 0.944 in summer, section “DIC and DIC:TAlk Ratio”) was estimated to be 0.025/0.044 × 100% = 57%. Similarly, the contribution of the yearly initial high CO2 solubility to autumnal low Ωarag in the Yellow Sea (with the averaged DIC:TAlk ratio of 0.959 in autumn, section “DIC and DIC:TAlk Ratio”) was estimated to be 0.025/0.059 × 100% = 42%.
Concurrent Hypoxia and CO2 Acidification in the Northern ECS off Changjiang Estuary
In 2018, we observed concurrent hypoxia (DO 49–63 μmol O2 kg–1) and CO2 acidification (pHT 7.68–7.71, Ωarag 1.28–1.39) at three sampling sites in the northern ECS off the Changjiang Estuary in the middle of July, although the modeling prediction suggested that the bottom-water hypoxia (DO 61 μmol O2 kg–1) and CO2 acidification (pHT 7.59, Ωarag 1.05) should concurrently occur in early August (Figures 7C,F). Apart from the intensive respiration rates (section “Different Respiration Rates and Duration”), the excess DO decline was likely attributed to those non-local drivers of summertime hypoxia in the northern ECS bottom waters, such as the TWWC intrusion (Figures 7C,F, Wei et al., 2015; Wang B. et al., 2017) and the nearshore upwelling of the Kuroshio branch (Yang et al., 2011, 2012, 2013; Qian et al., 2017). Sediment oxygen consumption may also contribute to the hypoxia formation in the northern ECS (Zhang et al., 2017; Zhou et al., 2017).
In the Yellow Sea, declines in DO, pHT, and Ωarag in the Yellow Sea were much less than those in the northern ECS (Figure 7). Especially the modeled October DO in Yellow Sea was ∼150 μmol O2 kg–1 higher than the modeled August DO in the northern ECS. Even if the water stratification could have lasted in the central Yellow Sea (maintaining the YSCWM) until December, the modeling prediction of bottom-water DO in December (170 μmol O2 kg–1) would be still quite high, despite that extremely low pHT and Ωarag values (7.73 and 0.96, respectively) would dominate the YSCWM in this early winter month. The modeled results in December were comparable with those field-measured values at the four deep stations (in the central South Yellow Sea) during our early winter survey (Figures 7B,E). Therefore, the seasonal hypoxia that usually associated with the respiration-induced coastal CO2 acidification did not occur in the present-day central Yellow Sea.
Recently, studies relating the concurrency of bottom hypoxia and CO2 acidification were conducted in many other coastal zones. For example, summertime hypoxia and acidification (pH < 7.7) covered almost one-third of an aquaculture area in southern nearshore waters of the North Yellow Sea (Zhang et al., 2018). In the central Bohai Sea, the near-hypoxic (DO < 90 μmol O2 kg–1) and concurrent low pHT (∼7.7) and Ωarag (∼1.3) were observed in late summer (Zhai et al., 2019; Song et al., 2020). In the northern South China Sea shelf, summertime low pH values were mainly measured nearshore in the hypoxic zone, along with relatively high DIC concentrations (Zhao et al., 2020). In the hypoxic zone of the northern Gulf of Mexico, the lowest bottom DO value obtained in summer 2010 (only at 11 μmol O2 kg–1) matched with the lowest pHT (7.60) and Ωarag (1.63) values (Hu et al., 2017). Even in the Chesapeake Bay, both anoxia and the production of hydrogen sulfide (H2S) were observed in summertime subsurface waters (with pHT < 7.6, Cai et al., 2017). Diverging from all the above-mentioned situations, in the well-buffered Corpus Christi Bay located along the Texas coast, relatively high pHT (>7.8) and Ωarag (>2.6) values were revealed in its summertime hypoxia zone (McCutcheon et al., 2019). The high buffering capacity in the Corpus Christi Bay was attributed to abundant seagrass meadows and the strong evaporation that introduced low pCO2, high pHT and Ωarag waters (McCutcheon et al., 2019). Hence, the concurrent occurrence of coastal hypoxia and CO2 acidification does not always hold true in all situations. Such issues are worthy of further investigation in order to be better understood.
Correlations Between Bottom-Water Ωarag Versus DIC and DIC:TAlk Ratio
We also found that bottom-water Ωarag was negatively correlated with DIC (Figures 8A–C). The correlations in the Yellow Sea and northern ECS roughly fit in with several ideal relationships between Ωarag and DIC that were estimated using CO2SYS.XLS. During simulation, regional mean TAlk with standard deviation (Table 1 and Figures 4A–C) and typical wintertime and springtime DIC:TAlk ratio (Table 1 and Figures 6E–G) were set for starting conditions, while fixed regional mean salinity and temperature were used (Figures 2A–C). At a given DIC, Ωarag decreased along with TAlk decrease. An early-spring plot near the Yalu river estuary with moderately low TAlk value of 2265 μmol kg–1 deviated from the three ideal relationships in the North Yellow Sea (Figure 8A). Also, several summertime plots affected by the CDW with low TAlk values of 2110–2183 μmol kg–1 and autumnal plots affected by the ZFCC with low TAlk values of 2138–2185 μmol kg–1 deviated from the two ideal relationships in the northern ECS (Figure 8C).
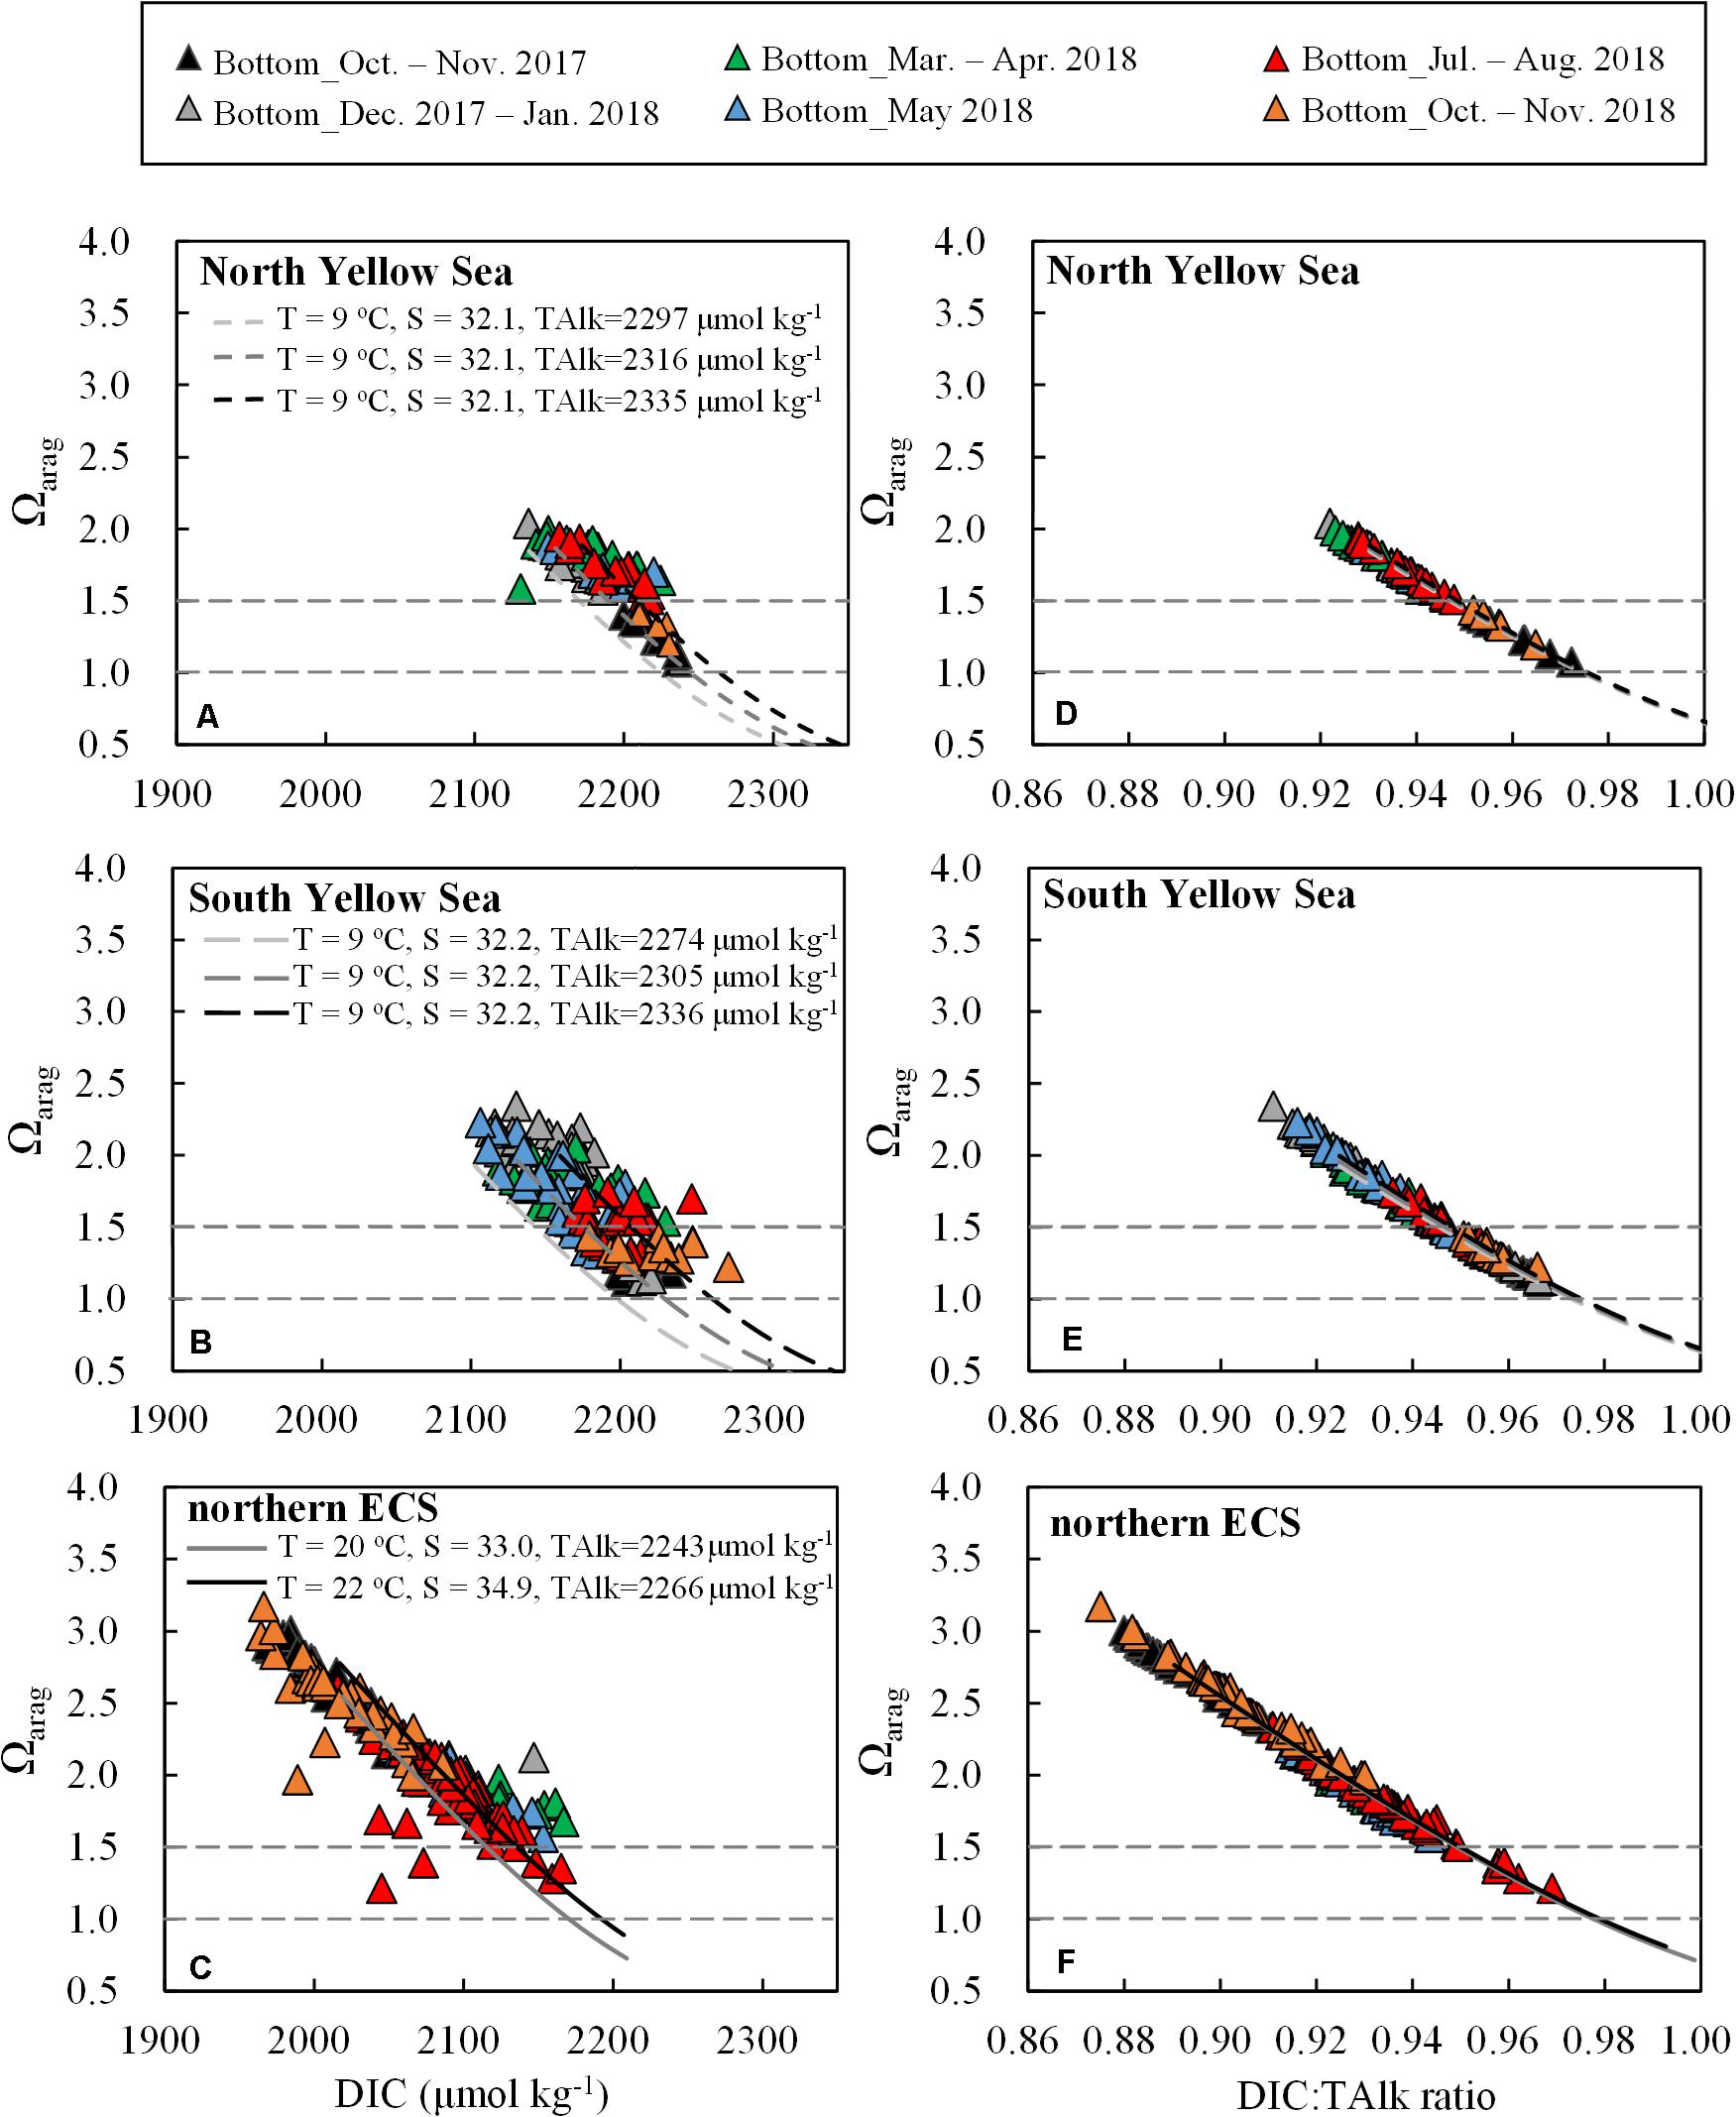
Figure 8. Plots of bottom-water Ωarag versus (A–C) DIC and (D–F) DIC:TAlk ratio. Black and gray curves represent ideal relationships between Ωarag versus DIC and DIC:TAlk ratio using CO2SYS.XLS. During calculation, starting condition for the North Yellow Sea was DIC:TAlk ratio = 0.930; starting condition for the South Yellow Sea was DIC:TAlk ratio = 0.925; starting condition for the northern ECS was DIC:TAlk ratio = 0.900, while for the ECS offshore waters was DIC:TAlk ratio = 0.890. The impact of respiration on TAlk (ΔTAlk:ΔDIC = –17/106) was included.
By comparison, the correlation between Ωarag and DIC:TAlk ratio (Figures 8D–F) was much tighter than that between Ωarag and DIC. This was because that DIC and TAlk were inversely related to Ωarag with higher DIC decreasing Ωarag and higher TAlk increasing Ωarag in seawater (Wanninkhof et al., 2015). Seawater DIC:TAlk ratio, by definition, could reflect the fraction of free CO2 in the DIC pool (Cai et al., 2020), which essentially determined Ωarag. When more CO2 was dissolved in seawater (solubility and/or respiration induced CO2 additions) as indicated by higher DIC:TAlk ratio, more CO32– ions were titrated, resulting in lower Ωarag values. On condition that the DIC:TAlk ratio varied between 0.83 and 0.95, the correlation was expressed linearly as Ωarag = –24.08 × (DIC:TAlk)+24.3 (r = 0.992, n = 832), exhibiting little differences among those diverse waters involved in this study (Supplementary Figure S8). It might suggest that DIC:TAlk ratio was a qualified indicator of Ωarag in seawater, even in contrasting coastal waters.
Summary and Implications
Seasonal variations and the controls of bottom-water carbonate system parameters and DO in the Yellow Sea and northern ECS were examined in this study. Wintertime air-sea re-equilibration, summertime respiration under thermoclines and autumnal water-column overturning are three primary processes controlling seasonal variations in these parameters. At the beginning of warm-season stratification formation, the colder Yellow Sea waters had higher DO values but lower Ωarag values than those in the relatively warmer northern ECS waters, while yearly initial pHT values were similar in the two coastal seas. During warm seasons, the Yellow Sea accumulated respiration products under the thermocline in summer and autumn, while the northern ECS bottom waters preserved them only in summer. Higher CO2 solubility together with the respiration-induced CO2 additions caused the colder Yellow Sea waters to have higher DIC:TAlk ratio and thus lower Ωarag as compared with those in warm northern ECS waters. The seasonal hypoxia that usually associated with the respiration-induced coastal CO2 acidification did not occur in the central Yellow Sea. In contrast, the summertime hypoxia and CO2 acidification concurrently occurred in the northern ECS.
We could also evaluate how seawater acidity ([H+]) in the Yellow Sea and northern ECS along the north-to-south latitude gradient respond to coastal acidification, considering starting conditions for the North Yellow Sea (T = 6°C, S = 32.1, TAlk = 2316 μmol kg–1, DIC:TAlk = 0.930), for the South Yellow Sea (T = 9°C, S = 32.1, TAlk = 2305 μmol kg–1, DIC:TAlk = 0.925), and for the northern ECS (T = 17°C, S = 33.0, TAlk = 2243 μmol kg–1, DIC:TAlk = 0.900). These starting conditions were those late spring levels in the given regions when water stratification was just formed. For an increase of seawater fCO2 of 1 μatm, [H+] increased by 1.97 × 10⁻⁵ μmol kg–1 in the North Yellow Sea, by 1.94 × 10⁻⁵ μmol kg–1 in the South Yellow Sea and by 1.90 × 10⁻⁵ μmol kg–1 in the northern ECS, indicating a north-to-south decline in the sensitivity to coastal acidification stresses, related to atmospheric CO2 intrusion and/or community respiration induced CO2 addition. A similar north-to-south-decreasing gradient along the U.S. East Coast and Gulf of Mexico has been reported by Wang et al. (2013) based on a summertime cross-shelf observation. The [H+] increase related to an increase of seawater fCO2 of 1 μatm has been estimated to be 2.0 × 10⁻⁵ μmol kg–1 in the Gulf of Maine, 11% greater than that in the Gulf of Mexico (1.8 × 10⁻⁵ μmol kg–1). The northeastern U.S. shelf waters appear more susceptible to CO2 acidification than their southern counterparts, likely due to relatively low temperature and thus high CO2 solubility in the northeastern regions. Recent studies have predicted that waters unfavorable to calcification will exist year round in the subsurface waters within northern shelf waters along China’s and U.S. eastern coasts, i.e., the North Yellow Sea (Li and Zhai, 2019) and Gulf of Maine (Wang Z. A. et al., 2017), by the middle of the century under the future ocean acidification. Consequently, cold northern shelf waters appear to be more vulnerable to the potentially negative effects of ocean acidification. In the future, more studies are needed to quantify ecological responses of different coastal zones to those acidification pressures, particularly in the relatively colder northern shelf waters.
Data Availability Statement
The mapping dataset of dissolved oxygen and carbonate system parameters reported in this study is available at figshare.com via doi: 10.6084/m9.figshare.12630335.
Author Contributions
WZ designed the research and performed one of the field surveys. TX performed three field surveys and analyzed the data set and drafted an early version of the manuscript. QW, CL, and YZ separately performed the other field surveys. SW, SL, SY, TX, and CL contributed to the data collection. All authors contributed to discussion and revision of the manuscript.
Conflict of Interest
The authors declare that the research was conducted in the absence of any commercial or financial relationships that could be construed as a potential conflict of interest.
Funding
This research was jointly supported by the State Key R&D project of China (Grant No. 2016YFA0601103), the National Natural Science Foundation of China (Grant Nos. 91751207 and 41876085) and the Basic Scientific Fund of the National Public Research Institutes of China (Grant No. GY0219JH01). Sampling surveys were separately supported by the National Natural Science Foundation of China (via Ship−time Sharing Projects during the Open Research Cruises conducted in the Bohai and Yellow Seas in 2017 and 2018 onboard R/V Dongfanghong 2 with Cruise Numbers of NORC2017-01 and NORC2018-01, and in the Changjiang Estuary in 2018 onboard R/V Kexue 3 with the Cruise Number of NORC2018-03), the Yellow Sea Fisheries Research Institute of Chinese Academy of Fishery Sciences (onboard R/V Beidou), and the First Institute of Oceanography, Ministry of Natural Resources, China (onboard R/V Xiangyanghong 18).
Supplementary Material
The Supplementary Material for this article can be found online at: https://www.frontiersin.org/articles/10.3389/fmars.2020.00686/full#supplementary-material
Footnotes
References
Anderson, L. A. (1995). On the hydrogen and oxygen content of marine phytoplankton. Deep Sea Res. Part I Oceanogr. Res. Pap. 42, 1675–1680. doi: 10.1016/0967-0637(95)00072-E
Bates, N. R., Mathis, J. T., and Cooper, L. W. (2009). Ocean acidification and biologically induced seasonality of carbonate mineral saturation states in the western Arctic Ocean. J. Geophys. Res. 114:C11007. doi: 10.1029/2008JC004862
Benson, B. B., and Krause, D. (1984). The concentration and isotopic fractionation of oxygen dissolved in fresh water and seawater in equilibrium with the atmosphere. Limnol. Oceanogr. 29, 620–632. doi: 10.4319/lo.1984.29.3.0620
Bockmon, E. E., and Dickson, A. G. (2014). A seawater filtration method suitable for total dissolved inorganic carbon and pH analyses. Limnol. Oceanogr. Methods 12, 191–195. doi: 10.4319/lom.2014.12.191
Cai, W.-J., Hu, X.-P., Huang, W.-J., Murrell, M. C., Lehrter, J. C., Lohrenz, S. E., et al. (2011). Acidification of subsurface coastal waters enhanced by eutrophication. Nat. Geosci. 4, 766–770. doi: 10.1038/ngeo1297
Cai, W.-J., Huang, W.-J., Lutherlll, G. W., Pierrot, D., Li, M., Testa, J., et al. (2017). Redox reactions and weak buffering capacity lead to acidification in the Chesapeake Bay. Nat. Commun. 8:369.
Cai, W.-J., Xu, Y.-Y., Feely, R. A., Wanninkhof, R., Jönsson, B., Alin, S. R., et al. (2020). Controls on surface water carbonate chemistry along North American ocean margins. Nat. Commun. 11:2691. doi: 10.1038/s41467-020-16530-z
Caldeira, K., and Wickett, M. E. (2003). Oceanography: anthropogenic carbon and ocean pH. Nature 425:365. doi: 10.1038/425365a
Cao, Z. M., Dai, M. H., Zheng, N., Wang, D. L., Li, Q., Zhai, W. D., et al. (2011). Dynamics of the carbonate system in a large continental shelf system under the influence of both a river plume and coastal upwelling. J. Geophys. Res. 116:G02010. doi: 10.1029/2010JG001596
Chen, C.-C., Chiang, K. P., Gong, G. C., Shiah, F. K., Tseng, C. M., and Liu, K. K. (2006). Importance of planktonic community respiration on the carbon balance of the East China Sea in summer. Glob. Biogeochem. Cycles 20:GB4001. doi: 10.1029/2005GB002647
Chen, C.-C., Gong, G.-C., and Shiah, F.-K. (2007). Hypoxia in the East China Sea: one of the largest coastal low-oxygen areas in the world. Mar. Environ. Res. 64, 399–408. doi: 10.1016/j.marenvres.2007.01.007
Chen, C. T. A. (2009). Chemical and physical fronts in the Bohai, Yellow and East China seas. J. Mar. Syst. 78, 394–410. doi: 10.1016/j.jmarsys.2008.11.016
Chen, C. T. A., and Wang, S. L. (1999). Carbon, alkalinity and nutrient budget on the East China Sea continental shelf. J. Geophys. Res. 104, 20675–20686. doi: 10.1029/1999JC900055
Choi, Y., Cho, S., and Kim, D. (2020). Seasonal variation in aragonite saturation states and the controlling factors in the southeastern Yellow Sea. Mar. Pollut. Bull. 150:110695. doi: 10.1016/j.marpolbul.2019.110695
Chou, W.-C., Gong, G.-C., Hung, C. C., and Wu, Y. H. (2013a). Carbonate mineral saturation states in the East China Sea: present conditions and future scenarios. Biogeosciences 10, 6453–6467. doi: 10.5194/bg-10-6453-2013
Chou, W.-C., Gong, G.-C., Cai, W.-J., and Tseng, C.-M. (2013b). Seasonality of CO2 in coastal oceans altered by increasing anthropogenic nutrient delivery from large rivers: evidence from the Changjiang-East China Sea system. Biogeosciences 10, 3889–3899. doi: 10.5194/bg-10-3889-2013
Chou, W.-C., Gong, G.-C., Sheu, D. D., Jan, S., Hung, C.-C., and Chen, C.-C. (2009). Reconciling the paradox that the heterotrophic waters of the East China Sea shelf act as a significant CO2 sink during the summertime: evidence and implications. Geophys. Res. Lett. 36:L15607. doi: 10.1029/2009GL038475
Dauer, D. M., Rodi, A. J., and Ranasinghe, J. A. (1992). Effects of low dissolved oxygen events on the macrobenthos of the lower Chesapeake Bay. Estuaries 15, 384–391. doi: 10.2307/1352785
Diaz, R. J. (2001). Overview of hypoxia around the world. J. Environ. Qual. 30, 275–281. doi: 10.2134/jeq2001.302275x
Dickson, A. G. (1990). Standard potential of the reaction: AgCl(s) + 1/2H2(g) = Ag(s) + HCl(aq), and the standard acidity constant of the ion HSO4- in synthetic sea water from 273.15 to 318.15 K. J. Chem. Thermodyn. 22, 113–127. doi: 10.1016/0021-9614(90)90074-Z
Dickson, A. G., Sabine, C. L., and Christian, J. R. (2007). Guide to Best Practices for Ocean CO2 Measurements PICES. (Sidney: North Pacific Marine Science Organization), 1–191.
Doney, S. C., Fabry, V. J., Feely, R. A., and Kleypas, J. A. (2009). Ocean acidification: the other CO2 problem. Annu. Rev. Mar. Sci. 1, 169–192. doi: 10.1146/annurev.marine.010908.163834
Ekstrom, J. A., Suatoni, L., Cooley, S. R., Pendleton, L. H., Waldbusser, G. G., Cinner, J. E., et al. (2015). Vulnerability and adaptation of US shellfisheries to ocean acidification. Nat. Clim. Change 5, 207–214. doi: 10.1038/nclimate2508
Eyre, B. D., Cyronak, T., Drupp, P., De Carlo, E. H., Sachs, J. P., and Andersson, A. J. (2018). Coral reefs will transition to net dissolving before end of century. Science 359, 908–911. doi: 10.1126/science.aao1118
Fabry, V. J. (2008). Marine calcifiers in a high-CO2 ocean. Science 320, 1020–1022. doi: 10.1126/science.1157130
Fabry, V. J., McClintock, J. B., Mathis, J. T., and Grebmeier, J. M. (2009). Ocean acidification at high latitudes: the bellwether. Oceanography 22, 160–171. doi: 10.5670/oceanog.2009.105
Feely, R. A., Alin, S. R., Newton, J., Sabine, C. L., Warner, M., Devol, A., et al. (2010). The combined effects of ocean acidification, mixing, and respiration on pH and carbonate saturation in an urbanized estuary. Estuar. Coast. Shelf Sci. 88, 442–449. doi: 10.1016/j.ecss.2010.05.004
Feely, R. A., Sabine, C. L., Byrne, R. H., Millero, F. J., Dickson, A. G., Wanninkhof, R., et al. (2012). Decadal changes in the aragonite and calcite saturation state of the Pacific Ocean. Glob. Biogeochem. Cycles 26:GB3001. doi: 10.1029/2011GB00415
Feely, R. A., Sabine, C. L., Hernandez-Ayon, J. M., Ianson, D., and Hales, B. (2008). Evidence for upwelling of corrosive “acidified” water onto the continental shelf. Science 320, 1490–1492. doi: 10.1126/science.1155676
Fennel, K., and Testa, J. M. (2019). Biogeochemical controls on coastal hypoxia. Annu. Rev. Mar. Sci. 11, 105–130. doi: 10.1146/annurev-marine-010318-095138
Gruber, N., Hauri, C., Lachkar, Z., Loher, D., Frölicher, T. L., and Plattner, G. K. (2012). Rapid progression of ocean acidification in the California current system. Science 337, 220–223. doi: 10.1126/science.1216773
Guo, X. H., Zhai, W. D., Dai, M. H., Zhang, C., Bai, Y., Xu, Y., et al. (2015). Air-sea CO2 fluxes in the East China Sea based on multiple-year underway observations. Biogeosciences 12, 5495–5514. doi: 10.5194/bg-12-5495-2015
He, X. Q., Bai, Y., Pan, D. L., Chen, C. T. A., Cheng, Q., Wang, D. F., et al. (2013). Satellite views of the seasonal and interannual variability of phytoplankton blooms in the eastern China seas over the past 14 yr (1998–2011). Biogeosciences 10, 4721–4739. doi: 10.5194/bg-10-4721-2013
Hedges, J. I., Baldock, J. A., Gélinas, Y., Lee, C., Peterson, M. L., and Wakeham, S. G. (2002). The biochemical and elemental compositions of marine plankton: a NMR perspective. Mar. Chem. 78, 47–63. doi: 10.1016/S0304-4203(02)00009-9
Hofmann, G. E., Smith, J. E., Johnson, K. S., Send, U., Levin, L. A., Micheli, F., et al. (2011). High-frequency dynamics of ocean pH: a multi-ecosystem comparison. PLoS One 6:e28983. doi: 10.1371/journal.pone.0028983
Hu, X. P., Li, Q., Huang, W. J., Chen, B. S., Cai, W. J., Rabalais, N. N., et al. (2017). Effects of eutrophication and benthic respiration on water column carbonate chemistry in a traditional hypoxic zone in the Northern Gulf of Mexico. Mar. Chem. 194, 33–42. doi: 10.1016/j.marchem.2017.04.004
Huang, W. J., Wang, Y. C., and Cai, W. J. (2012). Assessment of sample storage techniques for total alkalinity and dissolved inorganic carbon in seawater. Limnol. Oceanogr. Methods 10, 711–717. doi: 10.4319/lom.2012.10.711
Jiang, Z. P., Cai, W. J., Chen, B. S., Wang, K., Han, C. H., Roberts, B. J., et al. (2019). Physical and biogeochemical controls on pH dynamics in the Northern Gulf of Mexico during summer hypoxia. J. Geophys. Res. Oceans 124, 5979–5998. doi: 10.1029/2019JC015140
Jin, P., Wang, T. F., Liu, N. N., Dupont, S., Beardall, J., Boyd, P. W., et al. (2015). Ocean acidification increases the accumulation of toxic phenolic compounds across trophic levels. Nat. Commun. 6:8714. doi: 10.1038/ncomms9714
Lewis, E., and Wallace, D. W. R. (1998). Program devEloped for CO2 System Calculations, ORNL/CDIAC-105. Oak Ridge, TN: Oak Ridge National Laboratory.
Li, C. L. (2019). A Comparative Study of Seasonal Acidification in Southern Nearshore and Central Offshore Waters of the North Yellow Sea (in Chinese). Master’s thesis, Shandong University, Jinan.
Li, C. L., and Zhai, W. D. (2019). Decomposing monthly declines in subsurface-water pH and aragonite saturation state from spring to autumn in the North Yellow Sea. Cont. Shelf. Res. 185, 37–50. doi: 10.1016/j.csr.2018.11.003
Li, D. J., Zhang, J., Huang, D. J., Wu, Y., and Liang, J. (2002). Oxygen depletion off the Changjiang (Yangtze River) Estuary. Sci. China Ser. D 45, 1137–1146. doi: 10.1360/02yd9110
McCutcheon, M. R., Staryk, C. J., and Hu, X. P. (2019). Characteristics of the carbonate system in a semiarid estuary that experiences summertime hypoxia. Estuar. Coast. 42, 1509–1523. doi: 10.1007/s12237-019-00588-0
Melzner, F., Thomsen, J., Koeve, W., Oschlies, A., Gutowska, M. A., Bange, H. W., et al. (2013). Future ocean acidification will be amplified by hypoxia in coastal habitats. Mar. Biol. 160, 1875–1888. doi: 10.1007/s00227-012-1954-1
Men, W., and Liu, G. S. (2015). Distribution of 226Ra and the residence time of the shelf water in the Yellow Sea and the East China Sea. J. Radioanal. Nucl. Chem. 303, 2333–2344. doi: 10.1007/s10967-014-3749-y
Miao, J. B., Liu, X. Q., and Xue, Y. (1990). Study on the formational mechanism of the Northern Yellow (Huanghai) Sea Cold Water Mass (I)–Solution of the model (in Chinese). Sci. China Ser. B 12, 1311–1321.
Millero, F. J. (1979). The thermodynamics of the carbonate system in seawater. Geochim. Cosmochim. Acta 43, 1651–1661. doi: 10.1016/0016-7037(79)90184-4
Millero, F. J., Graham, T. B., Huang, F., Bustos-Serrano, H., and Pierrot, D. (2006). Dissociation constants of carbonic acid in sea water as a function of salinity and temperature. Mar. Chem. 100, 80–94. doi: 10.1016/j.marchem.2005.12.001
Mucci, A. (1983). The solubility of calcite and aragonite in seawater at various salinities, temperatures, and one atmosphere total pressure. Am. J. Sci. 283, 780–799. doi: 10.2475/ajs.283.7.780
Nozaki, Y., Tsubota, H., Kasemsupaya, V., Yashima, M., and Ikuta, N. (1991). Residence times of surface water and particle-reactive 210Pb and 210Po in the East China and Yellow seas. Geochim. Cosmochim. Acta 55, 1265–1272. doi: 10.1016/0016-7037(91)90305-O
Orr, J. C., Epitalon, J. M., and Gattuso, J. P. (2015). Comparison of ten packages that compute ocean carbonate chemistry. Biogeosciences 12, 1483–1510. doi: 10.5194/bg-12-1483-2015
Orr, J. C., Fabry, V. J., Aumont, O., Bopp, L., Doney, S. C., Feely, R. A., et al. (2005). Anthropogenic ocean acidification over the twenty-first century and its impacts on calcifying organisms. Nature 437, 681–686. doi: 10.1038/nature04095
Pelletier, G. J., Lewis, E., and Wallace, D. W. R. (2015). CO2SYS.XLS: A Calculator for the CO2 System in Seawater for Microsoft Excel/VBA, Version 24. Olympia, WA: Washington State Department of Ecology.
Qi, D., Chen, L. Q., Chen, B. S., Gao, Z. Y., Zhong, W. L., Feely, R. A., et al. (2017). Increase in acidifying water in the western Arctic Ocean. Nat. Clim. Change 7, 195–199. doi: 10.1038/nclimate3228
Qian, W., Dai, M. H., Xu, M., Kao, S. J., Du, C. J., Liu, J. W., et al. (2017). Non-local drivers of the summer hypoxia in the East China Sea off the Changjiang Estuary. Estuar. Coast. Shelf Sci. 198, 393–399. doi: 10.1016/j.ecss.2016.08.032
Rabalais, N. N., Díaz, R. J., Levin, L. A., Turner, R. E., Gilbert, D., and Zhang, J. (2010). Dynamics and distribution of natural and human-caused hypoxia. Biogeosciences 7, 585–619. doi: 10.5194/bg-7-585-2010
Ravaglioli, C., Lardicci, C., Pusceddu, A., Arpe, E., Bianchelli, S., Buschi, E., et al. (2020). Ocean acidification alters meiobenthic assemblage composition and organic matter degradation rates in seagrass sediments. Limnol. Oceanogr. 65, 37–50. doi: 10.1002/lno.11246
Redfield, A. C., Ketchum, B. H., and Richards, F. A. (1963). “The influence of organisms on the composition of sea-water,” in The Sea: ideas and Observations on Progress in the Study of the Seas, 2nd Edn, ed. M. N. Hill (New York, NY: Interscience Publishers), 26–77.
Rheuban, J. E., Doney, S. C., McCorkle, D. C., and Jakuba, R. W. (2019). Quantifying the effects of nutrient enrichment and freshwater mixing on coastal ocean acidification. J. Geophys. Res. Oceans 124, 9085–9100. doi: 10.1029/2019JC015556
Sabine, C. L., Feely, R. A., Gruber, N., Key, R. M., Lee, K., Bullister, J. L., et al. (2004). The oceanic sink for anthropogenic CO2. Science 305, 367–371. doi: 10.1126/science.1097403
Salisbury, J., Green, M., Hunt, C., and Campbell, J. (2008). Coastal acidification by rivers: a threat to shellfish– EOS Trans. Am. Geophys. Union 89, 513–528. doi: 10.1029/2008EO500001
Sarmiento, J. L., and Gruber, N. (2006). Ocean Biogeochemical Dynamics. Princeton, NJ: Princeton University Press, 116.
Shim, J., Kim, D., Kang, Y. C., Lee, J. H., Jang, S.-T., and Kim, C.-H. (2007). Seasonal variations in pCO2 and its controlling factors in surface seawater of the northern East China Sea. Cont. Shelf Res. 27, 2623–2636. doi: 10.1016/j.csr.2007.07.005
Song, G. S., Zhao, L., Chai, F., Liu, F. F., Li, M. T., and Xie, H. X. (2020). Summertime oxygen depletion and acidification in Bohai Sea, China. Front. Mar. Sci. 7:252. doi: 10.3389/fmars.2020.00252
Su, J. L., and Yuan, Y. L. (2005). Hydrology of Chinese Coastal Waters. Beijing: China Ocean Press, 367.
Waldbusser, G. G., Hales, B., Langdon, C. J., Haley, B. A., Schrader, P., Brunner, E. L., et al. (2015). Saturation-state sensitivity of marine bivalve larvae to ocean acidification. Nat. Clim. Change 5, 273–280. doi: 10.1038/NCLIMATE2479
Wang, B., Chen, J. F., Jin, H. Y., Li, H. L., Huang, D. J., and Cai, W. J. (2017). Diatom bloom-derived bottom water hypoxia off the Changjiang estuary, with and without typhoon influence. Limnol. Oceanogr. 62, 1552–1569. doi: 10.1002/lno.10517
Wang, Z. A., Lawson, G. L., Pilskaln, C. H., and Maas, A. E. (2017). Seasonal controls of aragonite saturation states in the Gulf of Maine. J. Geophys. Res. Oceans 122, 372–389. doi: 10.1002/2016JC012373
Wang, Z. A., Wanninkhof, R., Cai, W. J., Byrne, R. H., Hu, X. P., Peng, T. H., et al. (2013). The marine inorganic carbon system along the Gulf of Mexico and Atlantic coasts of the United States: insights from a transregional coastal carbon study. Limnol. Oceanogr. 58, 325–342. doi: 10.4319/lo.2013.58.1.0325
Wanninkhof, R., Barbero, L., Byrne, R., Cai, W. J., Huang, W. J., Zhang, J. Z., et al. (2015). Ocean acidification along the Gulf Coast and East Coast of the USA. Cont. Shelf. Res. 98, 54–71. doi: 10.1016/j.csr.2015.02.008
Wei, Q. S., Wang, B. D., Chen, J. F., Xia, C. S., Qu, D. P., and Xie, L. P. (2015). Recognition on the forming-vanishing process and underlying mechanisms of the hypoxia off the Yangtze River estuary. Sci. China Earth Sci. 58, 628–648. doi: 10.1007/s11430-014-5007-0
Weiss, R. F. (1974). Carbon dioxide in water and seawater: the solubility of a non-ideal gas. Mar. Chem. 2, 203–215. doi: 10.1016/0304-4203(74)90015-2
Wong, G. T. F. (2012). Removal of nitrite interference in the Winkler determination of dissolved oxygen in seawater. Mar. Chem. 130, 28–32. doi: 10.1016/j.marchem.2011.11.003
Xiong, T. Q., Liu, P. F., Zhai, W. D., Bai, Y., Liu, D., Qi, D., et al. (2019). Export flux, biogeochemical effects, and the fate of a terrestrial carbonate system: from Changjiang (Yangtze River) Estuary to the East China Sea. Earth Space Sci. 6, 2115–2141. doi: 10.1029/2019EA000679
Xu, X. M., Zang, K. P., Huo, C., Zheng, N., Zhao, H. D., Wang, J. Y., et al. (2016). Aragonite saturation state and dynamic mechanism in the southern Yellow Sea, China. Mar. Pollut. Bull. 109, 142–150. doi: 10.1016/j.marpolbul.2016.06.009
Xu, X. M., Zheng, N., Zang, K. P., Huo, C., Zhao, H. D., Mu, J. L., et al. (2018). Aragonite saturation state variation and control in the river-dominated marginal BoHai and Yellow seas of China during summer. Mar. Pollut. Bull. 135, 540–550. doi: 10.1016/j.marpolbul.2018.07.032
Xue, L., Cai, W. J., Sutton, A. J., and Sabine, C. (2017). Sea surface aragonite saturation state variations and control mechanisms at the Gray’s Reef time-series site off Georgia, USA (2006–2007). Mar. Chem. 195, 27–40. doi: 10.1016/j.marchem.2017.05.009
Yamamoto, A., Kawamiya, M., Ishida, A., Yamanaka, Y., and Watanabe, S. (2012). Impact of rapid sea-ice reduction in the Arctic Ocean on the rate of ocean acidification. Biogeosciences 9, 2365–2375. doi: 10.5194/bg-9-2365-2012
Yamamoto, S., Kayanne, H., Terai, M., Watanabe, A., Kato, K., Negishi, A., et al. (2012). Threshold of carbonate saturation state determined by CO2 control experiment. Biogeosciences 9, 1441–1450. doi: 10.5194/bg-9-1441-2012
Yang, D. Z., Yin, B. S., Liu, Z. L., Bai, T., Qi, J. F., and Chen, H. Y. (2012). Numerical study on the pattern and origins of Kuroshio branches in the bottom water of southern East China Sea in summer. J. Geophys. Res. 117:C02014. doi: 10.1029/2011JC007528
Yang, D. Z., Yin, B. S., Liu, Z. L., and Feng, X. R. (2011). Numerical study of the ocean circulation on the East China Sea shelf and a Kuroshio bottom branch northeast of Taiwan in summer. J. Geophys. Res. 116:C05015. doi: 10.1029/2010JC006777
Yang, D. Z., Yin, B. S., Sun, J. C., and Zhang, Y. (2013). Numerical study on the origins and the forcing mechanism of the phosphate in upwelling areas off the coast of Zhejiang province, China in summer. J. Mar. Syst. 123-124, 1–18. doi: 10.1016/j.jmarsys.2013.04.002
Yuan, D. L., Zhu, J. R., Li, C. Y., and Hu, D. X. (2008). Cross-shelf circulation in the Yellow and East China Seas indicated by MODIS satellite observations. J. Marine Syst. 70, 134–149. doi: 10.1016/j.jmarsys.2007.04.002
Zeebe, R. E., and Wolf-Gladrow, D. (2001). CO2 in Seawater: Equilibrium, Kinetics, Isotopes, Vol. 65. (Amsterdam: Elsevier), 1–346.
Zhai, W. D. (2018). Exploring seasonal acidification in the Yellow Sea. Sci. China Earth Sci. 61, 647–658. doi: 10.1007/s11430-017-9151-4
Zhai, W.-D., and Dai, M.-H. (2009). On the seasonal variation of air-sea CO2 fluxes in the outer Changjiang (Yangtze River) Estuary, East China Sea. Mar. Chem. 117, 2–10. doi: 10.1016/j.marchem.2009.02.008
Zhai, W. D., Zang, K. P., Huo, C., Zheng, N., and Xu, X. M. (2015). Occurrence of aragonite corrosive water in the North Yellow Sea, near the Yalu River estuary, during a summer flood. Estuar. Coast. Shelf Sci. 166, 199–208. doi: 10.1016/j.ecss.2015.02.010
Zhai, W. D., Zhao, H. D., Su, J. L., Liu, P. F., Li, Y. W., and Zheng, N. (2019). Emergence of summertime hypoxia and concurrent carbonate mineral suppression in the central Bohai Sea, China. J. Geophys. Res. Biogeosci. 124, 2768–2785. doi: 10.1029/2019JG005120
Zhai, W. D., Chen, J. F., Jin, H. Y., Li, H. L., Liu, J. W., He, X. Q., et al. (2014a). Spring carbonate chemistry dynamics of surface waters in the northern East China Sea: water mixing, biological uptake of CO2, and chemical buffering capacity. J. Geophys. Res. Oceans 119, 5638–5653. doi: 10.1002/2014JC009856
Zhai, W. D., Zheng, N., Huo, C., Xu, Y., Zhao, H. D., Li, Y. W., et al. (2014b). Subsurface pH and carbonate saturation state of aragonite on the Chinese side of the North Yellow Sea: seasonal variations and controls. Biogeosciences 11, 1103–1123. doi: 10.5194/bg-11-1103-2014
Zhang, H. Y., Zhao, L., Sun, Y., Wang, J. N., and Wei, H. (2017). Contribution of sediment oxygen demand to hypoxia development off the Changjiang Estuary. Estuar. Coast. Shelf Sci. 192, 149–157. doi: 10.1016/j.ecss.2017.05.006
Zhang, Y., Gao, X. L., Guo, W. D., Zhao, J. M., and Li, Y. F. (2018). Origin and dynamics of dissolved organic matter in a mariculture area suffering from summertime hypoxia and acidification. Front. Mar. Sci. 5:325. doi: 10.3389/fmars.2018.00325
Zhao, Y. Y., Liu, J., Uthaipan, K., Song, X., Xu, Y., He, B. Y., et al. (2020). Dynamics of inorganic carbon and pH in a large subtropical continental shelf system: interaction between eutrophication, hypoxia, and ocean acidification. Limnol. Oceanogr. 65, 1359–1379. doi: 10.1002/lno.11393
Zhou, F., Chai, F., Huang, D. J., Xue, H. J., Chen, J. F., Xiu, P., et al. (2017). Investigation of hypoxia off the Changjiang Estuary using a coupled model of ROMS-CoSiNE. Prog. Oceanogr. 159, 237–254. doi: 10.1016/j.pocean.2017.10.008
Zhu, Z. Y., Hu, J., Song, G. D., Wu, Y., Zhang, J., and Liu, S. M. (2016). Phytoplankton-driven dark plankton respiration in the hypoxic zone off the Changjiang Estuary, revealed by in vitro incubations. J. Mar. Syst. 154, 50–56. doi: 10.1016/j.jmarsys.2015.04.009
Keywords: coastal acidification, hypoxia, carbon dioxide solubility, community respiration, Yellow Sea, northern East China Sea
Citation: Xiong T, Wei Q, Zhai W, Li C, Wang S, Zhang Y, Liu S and Yu S (2020) Comparing Subsurface Seasonal Deoxygenation and Acidification in the Yellow Sea and Northern East China Sea Along the North-to-South Latitude Gradient. Front. Mar. Sci. 7:686. doi: 10.3389/fmars.2020.00686
Received: 28 May 2020; Accepted: 28 July 2020;
Published: 18 August 2020.
Edited by:
Nina Bednarsek, Southern California Coastal Water Research Project, United StatesReviewed by:
Stephen F. Gonski, University of Delaware, United StatesWen-Chen Chou, National Taiwan Ocean University, Taiwan
Jianzhong Su, Xiamen University, China
Copyright © 2020 Xiong, Wei, Zhai, Li, Wang, Zhang, Liu and Yu. This is an open-access article distributed under the terms of the Creative Commons Attribution License (CC BY). The use, distribution or reproduction in other forums is permitted, provided the original author(s) and the copyright owner(s) are credited and that the original publication in this journal is cited, in accordance with accepted academic practice. No use, distribution or reproduction is permitted which does not comply with these terms.
*Correspondence: Wei-dong Zhai, wdzhai@126.com