Adsorption and Desorption of Organic Molecules From Thin Cellulose Films
 Elias Henögl
 Viktoria Haberl1
  Robert Schennach
- 1Institute of Solid-State Physics, Graz University of Technology, Graz, Austria
- 2CD-Laboratory for Mass Transport Through Paper, Graz University of Technology, Graz, Austria
The debate on the environmental effects of everyday packaging materials has long reached the scientific community. The quest is on to design cheap but also sustainable and eco-friendly packaging solutions. A hot contestant material within the application is the ever-present wood-based paper. In addition to meeting logistic requirements, paper packaging must protect the packaged goods from environmental influences, while keeping aroma molecules in the food. To quantify both aspects in depth, exploration of adsorption of organic molecules on paper is required. As paper is a rather complex material, adsorption and desorption experiments can be notoriously difficult to interpret. This paper will demonstrate that the adsorption of organic molecules on a cellulose surface can be investigated simply by using temperature programmed desorption (TPD) experiments. The experiments show that both non-polar and polar molecules (n-decane and deuterated methanol) readily adsorb onto cellulose films. During desorption one finds the polar molecule bound to the cellulose surface more heavily than the non-polar molecule.
Introduction
The discussion of benefits vs. environmental cost of packaging materials is constant. In this age of ever-rising environmental awareness, customers often reward “going green” and paper securely holds a spot at the forefront of the issue.
However, in order to be used as packaging material for food, paper has to fulfill a number of requirements. On one hand aroma molecules need to stay inside the food and on the other hand the package is put on to protect the food from environmental influences like oxygen or organic molecules that might trigger ripening or produce rotten flavors. With paper being a porous material, a key feature is the transport of molecules through the porous structure to gain insight and control over the aforementioned issues. One of the questions to be answered in this context is the extent to which molecules adsorb onto the walls of the pores. This makes adsorption studies of molecules on cellulosic surfaces all the more essential.
Literature research reveals a substantial number of studies on cellulosic materials in the wet state to remove pollutants from water (see e.g., Voisin et al., 2017). Also, the adsorption of polyelectrolytes on pulps has been investigated intensely (see e.g., Li et al., 2003; Neumann et al., 2018). The adsorption of smaller molecules has attracted less attention as was proven in a recent review (Lombardo and Thielemans, 2019). Adsorption of aromatic compounds onto cellulose has been studied by Perez et al. (2004). Benzophenone adsorption was studied by Mazeau and Vergelati (2002) and Congo red adsorption by Mazeau and Wyszomirski (2012). Naphtalin and Pyrene adsorption were investigated by Tozuka et al. (1998, 2002). Urea adsorption has been investigated by Chen et al. (2017), to mention just a few examples. However, these articles are not relevant for the field of food packaging. We are therefore specifically investigating the adsorption of small molecules from the gas phase onto cellulosic surfaces. Within this context dynamic vapor sorption has been studied extensively (see e.g., Xie et al., 2011). Usually such studies take place under equilibrium conditions. When adsorption of small molecules occurs in paper packaging, it is unlikely that equilibrium conditions apply. We are rather proposing to investigate the adsorption of small molecules under high vacuum conditions far from the equilibrium. Unfortunately, such measurements are impossible using paper samples, as the paper cannot be heated directly in a vacuum chamber. This is why we must employ a model system in our case thin cellulose films. Despite the fact that such thin cellulose films are produced out of cellulose II instead of cellulose I, which is found in paper, it was shown that these films are a useful replacement model system for paper (Rohm et al., 2014). Thin cellulose films have also been used before as substrates for water adsorption (see e.g., Niinivaara et al., 2015, 2016; Hakalahti et al., 2017) and sugar adsorption (Hoja et al., 2014).
Within this study we present the first high vacuum-based adsorption and temperature programmed desorption spectroscopy studies of n-decane and deuterated methanol on thin cellulose films.
Materials and Methods
Equipment and Control Systems
- Rotary vane pump:
Leybold TRIVAC D 25 B
- Turbo molecular pump & control system:
Oerlikon Leybold Vacuum, Turbovac type TMP151 & Turbo.Drive TD20 classic
- Quadrupole mass spectrometer & control software:
Balzers Prisma type QME 200 (CF DN40) & Quadstar 32-Bit
- Power supply:
HP DC Power Supply System 6261B
- Temperature control system
PID (Proportional-Integral-Derivative) controller in National Instruments LabVIEW 7.0
- Bayard-Alpert gauge & control system:
Leybold AG IE 414 (CF DN40) & IONIVAC IM 520
- Manual angle valve
Balzers EVA 025 H (KF DN25)
- Gas inlet valve
Pfeiffer Vacuum Gas Dosing Valve EVN 116 (KF DN16)
- Metal to glass connector doomed:
GMA-KF16-KGD-152-TD13 (KF DN16).
The TPD-System
The main vacuum chamber is a stainless steel six-way crossing. The pumping system consists of a turbo molecular pump, attached to the bottom side of the main chamber (see Figure 1), followed by a rotary vane pump not shown in Figure 1. The quadrupole mass spectrometer and the Bayard-Alpert gauge are mounted onto the left and onto the right side of the chamber. The gas inlet valve is attached to the rear side and connected to a glass container holding the liquid organic molecules (see Figure 1 rear view).
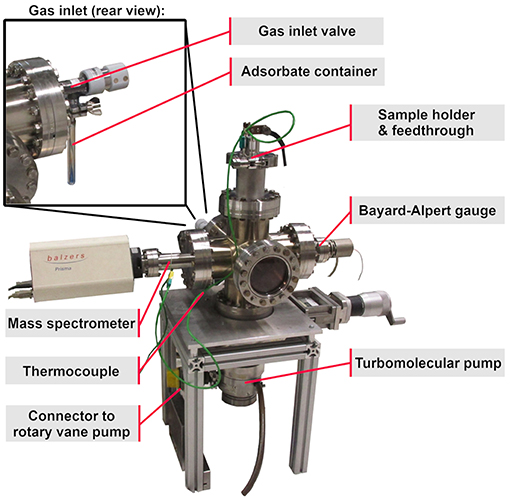
Figure 1. TPD-System, overview.
The top side of the six-way crossing is extended by an adapter to a DN63 CF-flange cover, which is fastened by a quick CF clamp chain providing faster sample change. The flange cover offers two electrical and one thermocouple feedthrough, as well as one borehole into the copper body of the cooling finger. The cooling finger, a hollow cylindrical copper piece, is mounted onto the inner side of this flange cover, extending down to the center of the chamber, merging into a flattened end piece, later referred to as the “sample holder” (Figure 2). Two sample holding benches are attached to this platform isolated by aluminum oxide spacers, which provide electrical isolation and heat conduction.
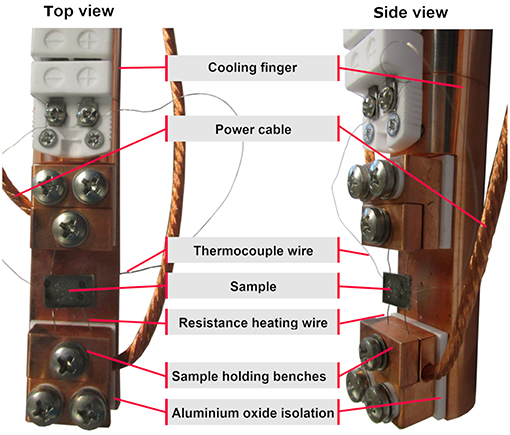
Figure 2. Sample holder of the TPD-System, top view and side view.
The sample substrate itself is a 1 × 1 cm stainless steel plate with two Ta wires for resistance heating and a K-Type thermocouple, spot welded to its backside. The substrate is mounted by clamping the heating wires into the sample holding benches, which are connected to the electrical feedthrough by copper cables.
In the middle section, the cooling finger also holds two aluminum oxide thermocouple mini connectors, which are plugged together. While the upper mini connector is permanently wired to the thermocouple feedthrough of the flange cover, the lower connector acts as a clamp board for the thermocouple wires coming from the backside of the sample (see Figure 2).
In order to increase the gas flow to the sample surface, a gas inlet pipe, which is connected to the gas inlet valve (see Figure 3), points at the sample surface at an angle of about 35° and ends at a distance of about 3 cm from the sample surface. The mass spectrometer is positioned exactly opposite to the sample surface at the same distance.
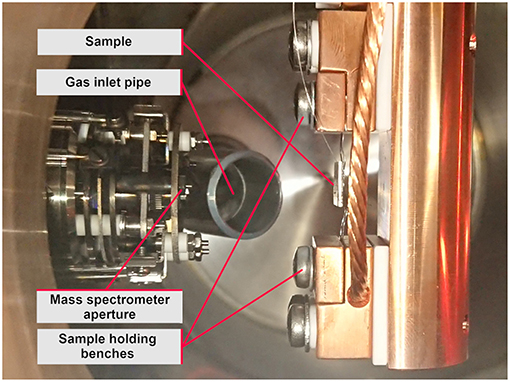
Figure 3. Vacuum chamber inside geometry.
Sample Preparation
The sample is prepared with the same standard procedure as proposed by Kontturi et al. (2003) and Rohm et al. (2014), with the substrate being coated by a thin cellulose film. The cellulose in question is trimethylsilyl cellulose (TMSC) with a degree of substitution of about 2.8 (Thüringisches Institut für Textil-und Kunstoff-Forschung e.V. (TITK), Germany) and dissolved in toluene with a concentration of about 1 mg/ml. The resulting solution is drop casted onto the polished metal surface of the sample and air-dried. Subsequently, a drop of 10% HCl is placed in a petri-dish and the sample is put right next to the HCl drop. The dish, including the sample setup is then covered with aluminum foil and left to react for 15 min.
According to Konturri and Djak this procedure results in a fully regenerated cellulose film with a thickness of about 50 nm (Kontturi et al., 2003; Djak et al., 2011). FTIR measurements of the films did not find any trimethylsilyl induced vibrations in the pure cellulose films. Mass 73 however, was found in thermal desorption which could correspond to the trimethyl silyl fragment. The amount of residual TMSC thus lies below the FTIR detection limit (~1 × 10¹³ molecules) and above the detection limit of mass spectroscopy. The film thickness of several other samples was also measured by AFM. Afterwards these AFM samples were no longer used for desorption experiments to avoid the influence of the scratches caused by the AFM thickness measurements on the desorption behavior.
The films are completely amorphous; which is why we do not expect to see a porous structure in them. During AFM investigations of such films (Ganser et al., 2014, 2016; Rohm et al., 2014) no indication of pores has been found. This indicates that the density should be close to the one of regenerated cellulose. Nevertheless, porosity and density of the films were not measured within this study.
Experimental Procedure
Evacuation
The sample is mounted into the sample holding benches and the thermocouple is connected (see above). The sample holder is inserted into the vacuum chamber and the temperature monitoring is started. The flange cover is fastened by the quick CF clamp chain and the vacuum chamber is evacuated to the base pressure of about 5 × 10⁻⁹ mbar. Due to the filaments of the mass-spectrometer and the Bayard-Alpert gauge, the temperature of the sample inside the vacuum chamber levels at 55°C while the evacuation is performed.
Residual Gas Analysis
A residual gas analysis is performed by recording a mass spectrum from mass 1 to mass 100 (such a mass spectrum is shown in the supporting information (SI Figure 1) for evaluation of the starting conditions and the vacuum quality.
Cooling
Liquid nitrogen (N2(l)) is now filled into the cooling finger repeatedly. Once the preset base temperature of the sample (−80°C) is reached, it is maintained by moderate, PID (Proportional-Integral-Derivative) controlled, resistance heating and further N2(l) cooling as needed.
Adsorption
The gas inlet valve is now opened carefully. Due to the vapor pressure at room temperature of the organic molecules inside the adsorbate container the vapor is dosed into the vacuum chamber. The sample is kept at −80°C during adsorption. The valve is adjusted until the inflow of the gaseous organic molecules and the pumping of the turbo molecular pump levels out at a steady state pressure of 5 × 10⁻⁶ mbar. This pressure is then maintained for a specified adsorption time of 6 min. After this time the gas inlet valve is closed quickly, and the chamber pressure returns to the base pressure.
Desorption
It takes about 1 min to reach the base pressure and the thermal desorption process is started from −80°C. The PID controller heats the sample with a heating rate of 1°C/s to the upper temperature limit of 600°C. During desorption the intensity signals of preset masses are continuously recorded in respect to time by the mass spectrometer. At the same time the sample temperature is recorded as a function of time. Each mass intensity is then replotted as a function of temperature. This represents a fairly typical setup for TPD measurements (see e.g., Hohenegger et al., 1998).
Since only a limited number of mass-intensities can be recorded in a row, each mass represents a characteristic fragment of a participating molecule: mass 57 for n-decane, mass 34 for deuterated methanol (D3COD), mass 44 for CO2, and mass 18 for H2O. While the first two masses are characteristic for the adsorbed species the latter two masses are characteristic for cellulose desorption.
Adsorbed Molecules
Aroma molecules usually are organic molecules with a rather high vapor pressure. One can encounter both polar and non-polar aroma molecules. To get a first idea about the adsorption behavior of such molecules on a cellulose thin film, we used n-decane as a non-polar molecule and deuterated methanol (D3COD) as a polar molecule. Both molecules were obtained in p.a. grade from Sigma Aldrich (deuterated methanol ≥99%, isotope purity ≥99.8 atom % D, n-decane ≥99.5 %) and were cleaned in situ via several freeze and thaw cycles. The molecular mass of n-decane is 142 amu and the vapor pressure at 30°C is 3.17 hPa, which proved sufficient for adsorption. As the used quadrupole mass spectrometer has a maximum mass of 100 amu we had to look at mass 57 for the n-decane. In the end, this also happened to be the highest peak in the n-decane mass spectrum. Mass 57 also is of rather low intensity in the mass spectrum of the desorbing cellulose film. The mass spectrum of n-decane can be found in the supporting information (SI Figure 2). The n-decane mass spectrum remained unchanged over time and shows no evidence of contamination with lower hydrocarbons. Nevertheless, traces of nonane and octane contamination cannot be completely ruled out.
The molecular mass of deuterated methanol is 36 amu. The highest peak in the mass spectrum of deuterated methanol is at 34 amu. In our TPD measurements we used this mass as indicator as it does neither interfere with the mass spectrum of the desorbing cellulose film nor with the n-decane. The mass spectrum of the deuterated methanol during exposure can be found in the supporting information (SI Figure 3) as well. The vapor pressure of deuterated methanol at 20°C is 129 hPa.
Results and Discussion
The exposed molecules not only adsorb onto the cellulose film, because adsorption is accomplished via the gas phase. Therefore, a series of blind experiments was conducted to ensure that the effects found only stem from the cellulose films. In the blind regimen the clean substrate films with and without adsorption of n-decane and deuterated methanol were tested. These three experiments clearly show desorption peaks differing from the ones presented here. Without prior gas adsorption onto the cellulose films one finds (see Figure 4) several fragments desorbing in the same temperature range as shown by the TPD spectra below.
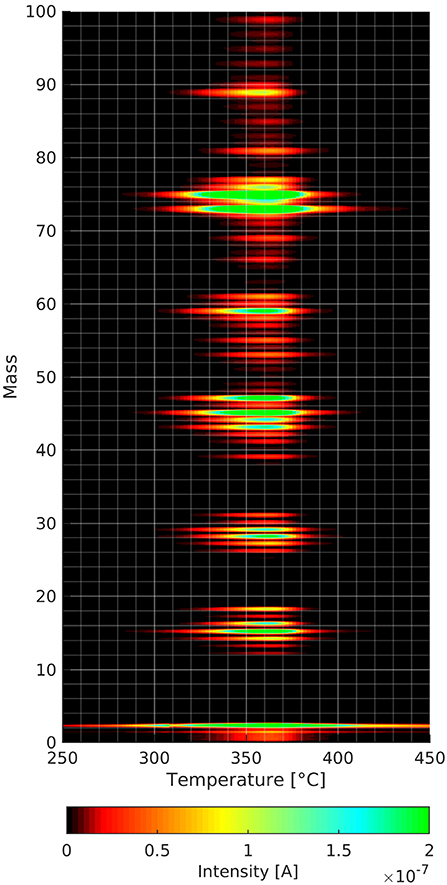
Figure 4. Mass spectra as a function of temperature of the cellulose film decomposition and desorption. The intensities of the different masses are linked to the color code.
Cellulose Desorption/Decomposition Fingerprint
Figure 4 shows the result of a TPD experiment with a cellulose film without prior gas adsorption. In the three-dimensional plot one can see that the maximum intensity of the cellulose desorption fragments occurs at about 360°C. This is a lower temperature than the ones for the other TPD spectra shown later. The heating rate in the aforementioned experiment is only 0.1°C/s as opposed to 1°C/s in all the other experiments. The lower heating rate became necessary as the acquisition of a complete mass spectrum from 0 to 100 amu takes much longer than the 4 individual masses in the other experiments shown later.
One can see in Figure 4 that both mass 18 and mass 44 desorb during cellulose decomposition and desorption. The most intense desorption peaks are at the masses 73 and 75 amu. While the peak at mass 73 fits to the trimethylsilyl group, one cannot explain mass 75 using this group as the Si isotope with mass 30 has only an occurrence of about 3%. Within this context, mass 75 could also stem from fragmentation of larger species that we are unable to detected due to the mass limitation (mass 100) of the mass spectrometer used. One can see several clusters of masses with a distance of about 10 amu, which is a common characteristic of mass spectra of organic molecules. Nevertheless, one needs to consider carefully which masses to track when doing thermal desorption experiments from cellulose films. This helps to distinguish the adsorbed species from the decomposing/desorbing cellulose film. We picked mass 57 for n-decane as this peak is the smallest of the cellulose peaks that could be used for n-decane. Deuterated methanol was employed, because its highest mass peak of 34 amu is not detected in the cellulose film desorption spectrum.
We also noted in preliminary experiments that heating to 150°C led to a marked change in the thin cellulose films shown by a significant change in the onset of the TPD spectra after repeated measurements on the same film (see SI Figure 4). In this work we present only data obtained with a virgin thin cellulose film. The desorption of the cellulose films is completed at about 600°C. Over time we found an accumulation of a carbon residue on the substrate, which was taken off by polishing the surface before film formation.
TPD-Spectra
The interpretation of TPD spectra in Surface Science follows the principle of microscopic equilibrium. An adsorbing species will thus take the same pathway during adsorption and desorption. As a reverse conclusion one can learn something about the adsorption process from desorption experiments (Somorjai, 1981). It has been shown that the shape of the desorption peak from a TPD experiment has a characteristic shape for desorption from both a multilayer for molecular desorption and for dissociative adsorption (Somorjai, 1981). Redhead proposed a simplified method to calculate the adsorption energy from the temperature at the peak maximum of a thermal desorption spectrum (Redhead, 1962). In this work we report adsorption energies for the adsorbed species calculated according to the Redhead formula. In any case one should keep in mind that this method was originally intended for simple molecule adsorption like CO or H2. Under which circumstances the Redhead method also applies to organic molecules has not yet been investigated. In the end, the values do provide at least an idea about the adsorption energy. Different adsorption energies are commonly connected to different adsorption sites on the surface. This connection is used throughout this paper.
n-Decane Desorption
The asymmetric peak shape with the steep trailing edge of the desorption peak as demonstrated by Figure 5 is a clear sign that the n-decane desorbs from a multilayer that was adsorbed at −80°C. The multilayer desorbs between about −70 and −52°C with an adsorption energy of about 60 kJ/mol. This value sits right between the heat of vaporization of 56 kJ/mol at −15°C (Carruth and Kobayashi, 1973) and 77 kJ/mol obtained by extrapolating the data from Majer and Scoboda (1985) to −70°C. This suggests that this desorption peak stems from a multilayer on the surface. Within the same temperature range also some desorption of CO2 can be seen as well, which most likely stems from adsorption from the residual gas during cooling and during n-decane adsorption. A closer look at the same temperature range also shows a water desorption peak (see Figure 6).
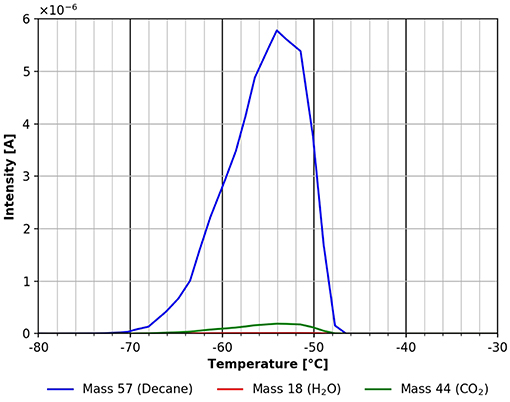
Figure 5. Desorption of n-decane (mass 57, blue), carbon dioxide (mass 44, green) and water (mass 18, red) between −80 and −30°C.
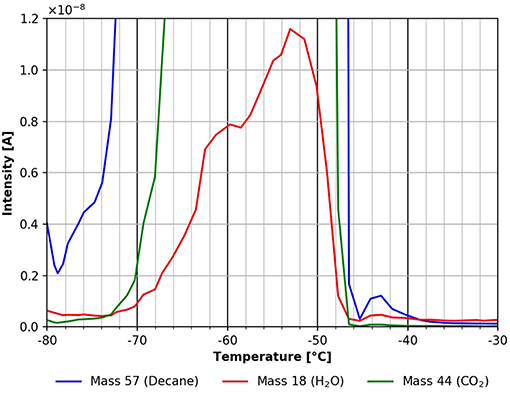
Figure 6. Zoom into the TPD spectrum shown in Figure 5. n-decane (mass 57, blue), carbon dioxide (mass 44, green), and water (mass 18, red).
The water desorption peak seen in the temperature range between −80 and about −52°C most likely is due to water adsorption from the residual gas during cooling and gas exposure. It might also partly stem from residual water in the cellulose film. To minimize the latter effect, the experiments shown here were only started when a background pressure of about 5 ×10⁻⁹ mbar was reached. The influence of the background pressure before adsorption is shown in the supporting information (SI Figure 5). Figure 6 also shows another desorption feature from n-decane and water with a maximum at about −43°C. Even though this peak is small, please note, that all the figures are derived directly from raw data without any smoothing. For this reason, all peaks discussed in this paper show a good signal to noise ratio and all the features discussed have been experimentally reproduced several times.
This feature is shown in more detail in Figure 7. The desorption peak at around −43°C clearly suggests a more strongly bound n-decane species. Using the Redhead formula this corresponds to a binding energy of about 70 kJ/mol. A small peak of CO2 and water is clearly visible in Figure 7 still, indicating that these species find similar adsorption sites on the cellulose surface.
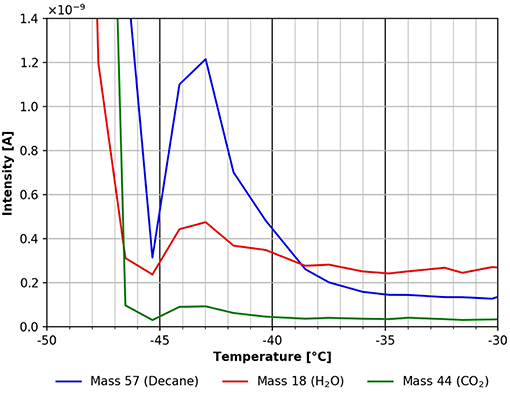
Figure 7. Zoom into the TPD spectrum shown in Figure 6. n-decane (mass 57, blue), carbon dioxide (mass 44, green), and water (mass 18, red).
Going to higher temperatures one finds a small and broad desorption feature of n-decane between about −40 and +14°C (see Figure 8) corresponding to an adsorption energy of about 160 kJ/mol. This characteristic is not present in the CO2 desorption trace, and is not clearly visible in the water desorption trace. The reason for the higher scattering in the data in Figure 8 could have been caused by a heating rate which was not perfectly linear in this temperature range.
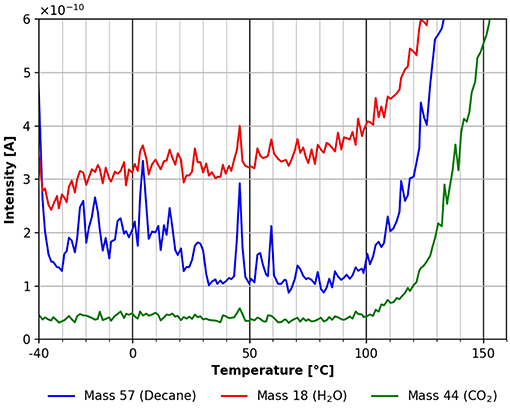
Figure 8. Desorption of n-decane (mass 57, blue), carbon dioxide (mass 44, green) and water (mass 18, red) in the temperature range between −40 and +160°C.
Figure 8 also shows that all three species start to desorb at different onset temperatures of about 80°C for water, 95°C for n-decane, and 100°C for CO2. This is also the onset of the desorption/degradation of the cellulose film, as can be seen in Figure 8. Another strong indication that the cellulose film undergoes significant changes during heating can be seen in the difference between the onset of the desorption after repeated adsorption and desorption cycles without preparing a new film shown in the supporting information (SI Figure 4).
The largest desorption peak in Figure 9 is the CO2 peak followed by the water peak. Surprisingly, there is significant n-decane desorption visible still. This peak can also originate in part from the decomposition/desorption of the cellulose film. Unfortunately, these two possibilities cannot be distinguished from each other at this time. As mentioned above, a fragment at mass 57 can be seen in Figure 4. There probably is a 4th adsorption site for n-decane with a binding energy of about 180 kJ/mol. The degradation of cellulose takes place at about the same temperature range too. These results show that non-polar molecules readily adsorb on cellulose surfaces at room temperature and above.
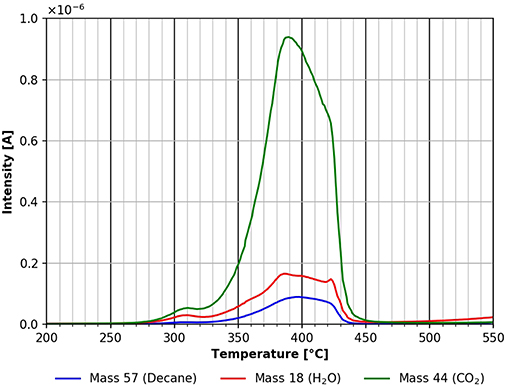
Figure 9. Desorption of n-decane (mass 57, blue), carbon dioxide (mass 44, green) and water (mass 18, red) in the temperature range between 200 and 550°C.
A comparison of Figures 9 and 10 shows that the final desorption of all species is influenced by the molecules adsorbed. In the case of n-decane adsorption three different desorption peaks for all three species investigated can be viewed in Figure 9. For deuterated methanol only one peak is observed in the same temperature region (Figure 10). This suggests, that the adsorbed species do have an influence on the cellulose decomposition and desorption.
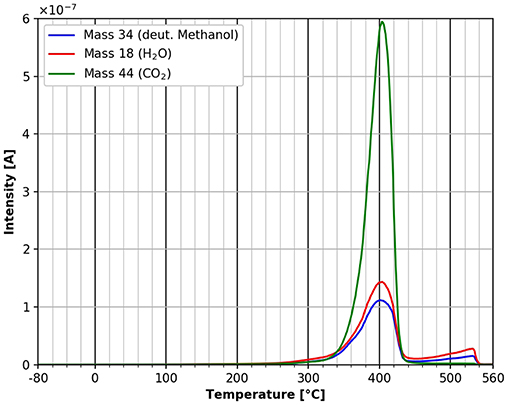
Figure 10. Desorption of deuterated methanol (mass 34, blue), carbon dioxide (mass 44, green) and water (mass 18, red) in the temperature range between −80 and 560°C.
Deuterated Methanol Desorption
Figure 10 shows the TPD spectrum from deuterated methanol over the whole temperature range. Evidently low temperature peaks are absent in this case. This is a strong indicator that the polar deuterated methanol is more strongly bound during adsorption than the n-decane. Nevertheless, the adsorption energy according to the Redhead equation is also about 180 kJ/mol. Clearly one has to keep in mind that the mass 57 desorption peak in the n-decane case is overlapping with mass 57 from cellulose desorption/decomposition, which is not the case in the deuterated methanol desorption. All the mass 57 desorption takes place at lower temperatures and therefore lower adsorption energies are completely missing in the deuterated methanol case. Additionally, there seems to be a marked influence of the main adsorbed molecule on the adsorption of water and CO2 from residual gas. The influence of the deuterated methanol on the cellulose film itself can be seen at the main peak at 400°C. In contrast to the n-decane case, there are no shoulders in the degradation/desorption peak after the adsorption of deuterated methanol. After adsorption of deuterated methanol, the small peak occurring at about 310°C after n-decane adsorption is missing, as well as the shoulders in the main desorption peak. We can also detect a small additional desorption of all three species at about 550°C, which was not seen after n-decane adsorption. Unfortunately, at this temperature an artifact of the copper sample holder cannot be ruled out completely.
The results presented in Figures 9, 10 show that the adsorption of polar molecules has a strong influence on the thin cellulose films, because the desorption spectra are significantly different.
Figure 11 shows the starting point of the TPD spectra after the adsorption of deuterated methanol in more detail. Water desorption starts at around −60°C. The fluctuations of the water desorption in this temperature range again is most likely due to small fluctuations in the linear heating rate. Interestingly, the desorption of deuterated methanol first starts at a temperature of about +40°C. This difference in desorption starting points between water and deuterated methanol can be attributed to different adsorption sites. Apparently, the methanol is more strongly bound to the cellulose film than the water. CO2 desorption starts at about +60°C, marking the start of cellulose decomposition and desorption.
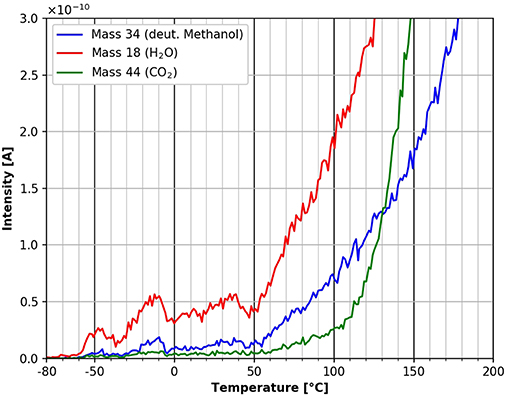
Figure 11. Zoom into the desorption of deuterated methanol (mass 34, blue), carbon dioxide (mass 44, green) and water (mass 18, red) in the temperature range between −80 and 200°C.
Conclusions
Within this study the adsorption and desorption of organic molecules on thin cellulose films was studied using temperature programmed desorption. It could be shown that the co-adsorption of water and CO2 from the residual gas is also influenced by the adsorbed molecules. All species have a marked influence on the decomposition/desorption of the cellulose films. From the results presented here, it becomes clear that both non-polar and polar molecules adsorb readily on a cellulose surface, with the polar molecule showing a higher binding energy.
Deuterated methanol shows a desorption peak at about 400°C and in the same temperature range cellulose desorption/decomposition takes place. As the adsorbed species desorb in the same range as the cellulose film the adsorption energy might actually be higher than the approximated 180 kJ/mol obtained from the Redhead equation.
In the future we plan to investigate different molecules as well as the possible influence of the cellulose film thickness on the adsorption and desorption of organic molecules.
Author Contributions
EH planned and built the vacuum chamber and made experiments. VH conducted initial experiments. JA conducted initial experiments. RS had the idea of the research, of the vacuum chamber setup, and supervised the students.
Conflict of Interest Statement
The authors declare that the research was conducted in the absence of any commercial or financial relationships that could be construed as a potential conflict of interest.
Acknowledgments
This work has been supported by the Christian Doppler Society, Austria. The financial support of the Austrian Federal Ministry for Digital and Economic Affairs and the National Foundation for Research, Technology and Development, Austria is gratefully acknowledged.
Supplementary Material
The Supplementary Material for this article can be found online at: https://www.frontiersin.org/articles/10.3389/fmats.2019.00178/full#supplementary-material
References
Carruth, G. F., and Kobayashi, R. (1973). Vapor pressure of normal paraffins ethane through n-decane from their triple points to about 10 mm mercury. J Chem Eng Data. 18, 115–126. doi: 10.1021/je60057a009
Chen, P., Nishiyama, Y., Wohlert, J., Lu, A., Mazeau, K., and Ismail, A. E. (2017). Translational entropy and dispersion energy jointly drive the adsorption of urea to cellulose. J. Phys. Chem. B 121, 2244–2251. doi: 10.1021/acs.jpcb.6b11914
Djak, M., Gilli, E., Kontturi, E., and Schennach, R. (2011). Thickness dependence of reflection-absorption infrared spectra of supported thin polymer films. Macromolecules 44, 1775–1778. doi: 10.1021/ma102905v
Ganser, C., Hirn, U., Rohm, S., Schennach, R., and Teichert, C. (2014). AFM nanoindentation of pulp fibers and thin cellulose films at varying relative humidity. Holzforschung 68, 53–60. doi: 10.1515/hf-2013-0014
Ganser, C., Niegelhell, K., Czibula, C., Chemelli, A., Teichert, C., Schennach, R., et al. (2016). Topography effects in AFM force mapping experiments on xylan-decorated cellulose thin films. Holzforschung 70, 1115–1123. doi: 10.1515/hf-2016-0023
Hakalahti, M., Faustini, M., Boissiere, C., Kontturi, E., and Tammelin, T. (2017). Interfacial mechanisms of water vapor sorption into cellulose nanofibril films as revealed by quantitative models. Biomacromolecules 18, 2951–2958. doi: 10.1021/acs.biomac.7b00890
Hohenegger, M., Bechtold, E., and Schennach, R. (1998). Coadsorption of oxygen and chlorine on Pt(111). Surf. Sci. 412/413, 184–191.
Hoja, J., Maurer, R. J., and Sax, A. F. (2014). Adsorption of glucose, cellobiose, and cellotetraose onto cellulose model surfaces. J Phys. Chemistry B 118, 9017–9027. doi: 10.1021/jp5025685
Kontturi, E., Thüne, P. C., and Niemantsverdriet, J. W. (2003). Novel method for preparing cellulose model surfaces by spin coating. Polymer 44, 3621–3625. doi: 10.1016/S0032-3861(03)00283-0
Li, H., Du, Y., and Xu, Y. (2003). Adsorption and complexation of chitosan wet-end additives in papermaking systems. J Appl Polymer Sci. 91, 2642–2648. doi: 10.1002/app.13444
Lombardo, S., and Thielemans, W. (2019). Thermodynamics of adsorption on nanocellulose surfaces. Cellulose 26, 249–279. doi: 10.1007/s10570-018-02239-2
Majer, V., and Scoboda, V. (1985). Enthalpies of vaporization of organic compounds: a critical review and data compilation. Blackwell Sci. Publications. 1985:300.
Mazeau, K., and Vergelati, C. (2002). Atomistic Modeling of the Adsorption of benzophenone onto cellulosic surfaces. Langmuir 18, 1919–1927. doi: 10.1021/la010792q
Mazeau, K., and Wyszomirski, M. (2012). Modelling of Congo red adsorption on the hydrophobic surface of cellulose using molecular dynamics. Cellulose 19, 1495–1506. doi: 10.1007/s10570-012-9757-6
Neumann, R. D., Berg, J. M., and Claesson, P. M. (2018). Direct measurement of surface forces in papermaking and paper coating systems. Nordic Pulp Paper Res. J. 8, 96–104. doi: 10.3183/npprj-1993-08-01-p096-104
Niinivaara, E., Faustini, M., Tammelin, T., and Kontturi, E. (2015). Water vapor uptake of ultrathin films of biologically derived nanocrystals: quantitative assessment with quartz crystal microbalance and spectroscopic ellipsometry. Langmuir 31, 12170–12176. doi: 10.1021/acs.langmuir.5b01763
Niinivaara, E., Faustini, M., Tammelin, T., and Kontturi, E. (2016). Mimicking the humidity response of the plant cell wall by using two-dimensional systems: the critical role of amorphous and crystalline polysaccharides. Langmuir 32, 2032–2040. doi: 10.1021/acs.langmuir.5b04264
Perez, D. D. S., Ruggiero, R., Morais, L. C., Machado, A. E. H., and Mazeau, K. (2004). Theoretical and experimental studies on the adsorption of aromatic compounds onto cellulose. Langmuir 20, 3151–3158. doi: 10.1021/la0357817
Redhead, P. A. (1962). Thermal desorption of gases. Vacuum 12, 203–211, doi: 10.1016/0042-207X(62)90978-8
Rohm, S., Hirn, U., Ganser, C., Teichert, C., and Schennach, R. (2014). Thin cellulose films as a model system for paper fibre bonds. Cellulose 21, 237–249. doi: 10.1007/s10570-013-0098-x
Somorjai, G. A. (1981). Chemistry in Two Dimensions: Surfaces. Ithaca, NY: Cornell University Press.
Tozuka, Y., Tashiro, E., Yonemochi, E., Oguchi, T., and Yamamoto, K. (2002). Solid-state fluorescence study of naphthalene adsorptionon porous material. J. Colloid Interface Sci. 248, 239–243. doi: 10.1006/jcis.2001.8142
Tozuka, Y., Yonemochi, E., Oguchi, T., and Yamamoto, K. (1998). Fluorometric studies of pyrene adsorptionon porous crystalline cellulose. J Colloid Interface Sci. 205, 510–515.
Voisin, H., Bergström, L., Liu, P., and Mathew, A. P. (2017). Nanocellulose-based materials for water purification. Nanomaterials 7:57. doi: 10.3390/nano7030057
Keywords: temperature programmed desorption, adsorption, desorption, cellulose films, paper
Citation: Henögl E, Haberl V, Ablasser J and Schennach R (2019) Adsorption and Desorption of Organic Molecules From Thin Cellulose Films. Front. Mater. 6:178. doi: 10.3389/fmats.2019.00178
Received: 18 January 2019; Accepted: 08 July 2019;
Published: 24 July 2019.
Edited by:
Eero Kontturi, Aalto University, FinlandReviewed by:
Andreas Mautner, University of Vienna, AustriaKoon-Yang Lee, Imperial College London, United Kingdom
Copyright © 2019 Henögl, Haberl, Ablasser and Schennach. This is an open-access article distributed under the terms of the Creative Commons Attribution License (CC BY). The use, distribution or reproduction in other forums is permitted, provided the original author(s) and the copyright owner(s) are credited and that the original publication in this journal is cited, in accordance with accepted academic practice. No use, distribution or reproduction is permitted which does not comply with these terms.
*Correspondence: Robert Schennach, robert.schennach@tugraz.at