 Yali Wang
 Nan Xu2,3†
 Chao Ye
 Liming Liu
 Jing Wu
- 1Wuxi Medical School, Jiangnan University, Wuxi, China
- 2State Key Laboratory of Food Science and Technology, Jiangnan University, Wuxi, China
- 3Carbohydrate Chemistry and Biotechnology, Ministry of Education, Jiangnan University, Wuxi, China
Actinoplanes sp. SE50/110 produces the α-glucosidase inhibitor acarbose, which is used to treat type 2 diabetes mellitus. To obtain a comprehensive understanding of its cellular metabolism, a genome-scale metabolic model of strain SE50/110, iYLW1028, was reconstructed on the bases of the genome annotation, biochemical databases, and extensive literature mining. Model iYLW1028 comprises 1028 genes, 1128 metabolites, and 1219 reactions. One hundred and twenty-two and eighty one genes were essential for cell growth on acarbose synthesis and sucrose media, respectively, and the acarbose biosynthetic pathway in SE50/110 was expounded completely. Based on model predictions, the addition of arginine and histidine to the media increased acarbose production by 78 and 59%, respectively. Additionally, dissolved oxygen has a great effect on acarbose production based on model predictions. Furthermore, genes to be overexpressed for the overproduction of acarbose were identified, and the deletion of treY eliminated the formation of by-product component C. Model iYLW1028 is a useful platform for optimizing and systems metabolic engineering for acarbose production in Actinoplanes sp. SE50/110.
Introduction
Type 2 diabetes mellitus is a chronic disease that affects more than 320 million people worldwide, it is the fourth or fifth leading cause of death in most developed countries, and its incidence is rising gradually (Federation, 2003). Additionally, complications from diabetes, such as coronary artery and peripheral vascular disease, stroke, diabetic neuropathy, amputations, renal failure, and blindness reduce people's quality of life (Federation, 2003). There are three kinds of effective drugs for treating type 2 diabetes mellitus: (1) biguanide, which increases the sensitivity to insulin; (2) sulfonylurea, which promotes the secretion of serum insulin, and (3) α-glucosidase inhibitors, such as acarbose and voglibose, which reduce the sugar concentration in the blood. Because of its advantages of mild and persistent therapeutic effects and lack of toxicity, the use of acarbose is increasingly favored for patients, especially for those who consume starchy foods as a staple.
Starting in 1990, the industrial production of acarbose was performed using improved derivatives of the wild-type producer Actinoplanes sp. SE50 (ATCC 31042; CBS 961.70). Since then, laborious, conventional mutagenesis and screening experiments were conducted to develop strains with higher acarbose production. Some strains with which acarbose were produced at the bench scale in recent years are listed in Table 1. Actinoplanes sp. SE50 was screened from soil by Bayer AG (Frommer et al., 1977), and other strains went through laborious, conventional mutagenesis and screening, followed by fermentation optimization (Choi and Shin, 2003; Wang et al., 2011; Xue et al., 2013; Cheng et al., 2014). Because maltose has been reported to be a moiety of acarbose, which was directly attached to dTDP-acarviose-7-P, and it worked as a carbon source, the carbon sources for Actinoplanes sp. CKD485-16, Actinoplanes sp. AC-N1, and Actinoplanes sp. ZJB-08196 were maltose and glucose. For Actinoplanes sp. SE50 and Actinoplanes sp. A56, carbon sources were starch and glucose, as maltose could be produced via the hydrolytic activity of the amylases AcbD and AcbE. It is worth noting that in strain Actinoplanes utahensis ZJB-08196, which was developed from Actinoplanes sp. through ion beam implantation, acarbose production reached 6606 mg/L after optimization of the medium composition and culture conditions (Wang et al., 2011), such as maintaining an elevated osmolality via intermittent feeding of necessary components (14.0 g/L maltose, 6.0 g/L glucose, and 9.0 g/L soybean meal, with feeding at 48, 72, 96, and 120 h and a feed volume of 5 mL) (Wang et al., 2012), as well as the addition of S-adenosylmethionine (12 h post-inoculation, 100 μmol/L S-adenosylmethionine) (Sun et al., 2012) and validamine (prior to inoculation, 20 mg/L) (Xue et al., 2013). It is the highest titer of fermentation by A. utahensis until now. Despite this, with the increasing population of diabetics, a higher acarbose yield is urgently required; however, some deficiencies limit improvements of acarbose production. (1) Conventional random mutation and screening, followed by optimization of media composition and culture conditions, often requires tremendous effort, and it has reached its limit. (2) Some metabolic mechanisms involved in the production of acarbose in Actinoplanes were unclear; thus, the major bottleneck in acarbose fermentation is still unknown. (3) Very little is known about the overexpression or knockout of gene targets to improve acarbose production at the system level. Therefore, a systematic understanding of physiological features and a global understanding of metabolism are greatly needed. In this regard, genome-scale metabolic model (GSMM) plays an important role in fermentation optimization and metabolic engineering.
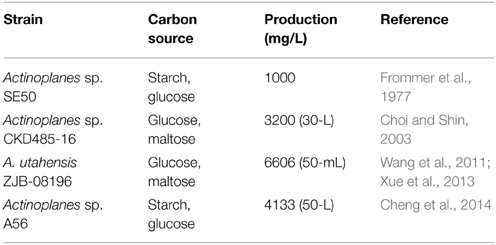
Table 1. Strains used to produce acarbose and the acarbose production.
Actinoplanes sp. SE50/110 is known to be the wild-type producer of the α-glucosidase inhibitor acarbose, and because its complete genome sequence is known (Schwientek et al., 2012), it is feasible to construct a GSMM, which enables us to obtain a comprehensive understanding of its global metabolism, thereby aiding the design of metabolic engineering strategies and decreasing the number of wet lab experiments. In this study, the first GSMM of Actinoplanes, iYLW1028, was constructed, and it was used to elucidate the physiological characteristics of Actinoplanes sp. SE50/110 in detail. Strategies to improve acarbose production were simulated based on model iYLW1028.
Materials and Methods
Model Reconstruction and Refinement
The availability of the whole genome of Actinoplanes sp. SE50/110 (Schwientek et al., 2012) enabled us to conduct the model reconstruction following the general process of GSMM reconstruction, which was performed as described previously (Zou et al., 2013). To construct this model, two methods were employed: (1) an auto-reconstructed model was generated from the Model-SEED database; (2) Bacillus megaterium WSH002 and a closely related species, Streptomyces coelicolor, were compared to Actinoplanes sp., and the reaction list was obtained through a local sequence similarity search (BLASTp). The three thresholds in BLASTp were an amino acid sequence identity ≥35%, an e-value ≤10−6, and a matching length ≥70% of the query sequence. Afterwards, the reaction list from the auto-reconstructed model and BLASTp were combined in Excel with the same format, which formed the draft model. Additionally, some reactions from the literature were supplemented into the draft model, and the biosynthesis pathway of acarbose was included. Public databases, such as KEGG, Metacyc, BiopathExplore, BRENDA, CELLO, TCDB (Saier et al., 2009), and the COBRA software package, were used to refine the draft model, including filling metabolic gaps, balancing mass and charge, determining reaction directionality, adding information for gene and reaction localization, adding subsystem information to reactions, and adding some transport reactions.
Organism and Cultivation Conditions
Strain Actinoplanes sp. SE50/110 was purchased from the ATCC.
Sucrose medium contained 30 g/L sucrose, 2.0 g/L peptone, 1.0 g/L casein hydrolysate, 1.0 g/L K2HPO4.3H2O, 0.5 g/L KCl, 0.5 g/L MgSO4.7H2O, and 0.1 g/L FeSO4.7H2O, 2 g/L agar. The minimal medium for the functional test contained a carbon source (20 g/L), a nitrogen source (5 g/L), 1.0 g/L K2HPO4.3H2O, 0.5 g/L KCl, 0.5 g/L MgSO4.7H2O, and 0.1 g/L FeSO4.7H2O, and the initial pH was adjusted to 7.0. The medium used for seed cultures was NBS medium, which contained 11 g/L glucose, 4 g/L peptone, 4 g/L yeast extract, 1 g/L MgSO4.7H2O, 2 g/L KH2PO4, and 5.2 g/L K2HPO4.3H2O (Wendler et al., 2013). The acarbose synthesis medium was based on high-maltose minimal medium (Wendler et al., 2013). It consisted of two solutions. Solution 1 consisted of 70 g/L maltose·1H2O, 5 g/L (NH4)2SO4, 6.55 g/L K2HPO4·3H2O, 5 g/L KH2PO4, 5.7 g/L trisodium citrate·2H2O, 1.0 g/L MgCl2·6H2O, and 2.0 g/L CaCl2·2H2O. Solution 2 contained trace elements, including 15.75 mM FeCl2, 25.00 mM MnCl2, 33.75 mMCaCl2, 3.75 mM ZnCl2, 0.50 mM CuCl2, 0.05 mM NiCl2, and 0.02 mM [Co(NH3)6]Cl3. Solution 1 was sterilized by moist heat, while solution 2 was filter sterilized, and afterwards, 0.2 mL of solution 2 was added to solution 1.
To prepare for the fermentation process, the strain was cultured on a sucrose medium for 72 h. Next, seed cultures were prepared by two sequential seed cultures. The first seed cultures were prepared by transferring a colony of about 1 × 1 cm2 to 50 mL NBS medium in a 500 mL Erlenmeyer flask, followed by culturing for 50 h at 28°C with shaking at 200 rpm. A 5 mL aliquot of first seed cultures were used to inoculate 50 mL of second seed medium in a 500 mL Erlenmeyer flask (equivalent to 10% of the inocula), and the seed cultures were formed. Subsequently, the seed cultures were centrifuged for 6 min at 6000 × g, and then washed twice with 0.9% NaCl solution. After another wash and centrifugation step (6 min, 6000 × g), the supernatant was decanted and the resulting pellet was resuspended in 50 mL NaCl solution, of which 5 mL (equivalent to 8% of the inocula) was inoculated into 50 mL of acarbose synthesis medium in 500 mL flasks and into 5 L of acarbose synthesis medium in a 7.5 L fermenter (INFORS). The cultures were grown at 28°C, with shaking at 200 rpm for the 500 mL flasks, and with shaking at 400 rpm for the 7.5 L fermenter.
Biomass Composition
The biomass components of Actinoplanes sp. consist of protein, DNA, RNA, lipids, cell wall constituents (peptidoglycan, carbohydrates, and teichoic acid), and small molecules. The biomass equation is important to obtain a high-quality model (Rocha et al., 2008), and because there is no detailed information about the biomass composition, it was partly measured and partly referenced in the literature. The cells were collected during the mid-exponential growth phase, washed three times with distilled water, and lyophilized. To determine the amino acid composition, cell pellets with a dry weight of 250 mg were hydrolyzed using HCl, and the hydrolysates were analyzed by HPLC (Christias et al., 1975). The Coomassie brilliant blue method was used to measure the protein content. Total DNA was determined by the method of Burton (1955). Total RNA was determined by the method of Benthin (Benthid et al., 1991). Lipids were extracted and measured as described as Izard (Izard and Limberger, 2003). The DNA composition was calculated by using the G+C content (71.3%) (Schwientek et al., 2012). The RNA composition was calculated based on the fact that the presumptive percent of mRNA, rRNA, and tRNA was 5, 75, and 20%, respectively, and the nucleotide sequences for rRNAs and tRNAs were derived from published genome information (Schwientek et al., 2012). The phospholipid composition was adopted from Mycobacterium tuberculosis (Nandedkar, 1983), and the fatty acid composition was adopted from Actinoplanes species (Ara et al., 2010). The precursors demand for triacylglycerols, peptidoglycan, and teichoic acid were assumed to be same as those of Streptomyces coelicolor A3(2) (Borodina et al., 2005).
Analytical Methods
The dry cell weight (DCW) was measured by filtration: 15 mL of culture was filtered via a vacuum pump, followed by washing three times with distilled water and drying at 70°C overnight to a constant weight. The acarbose concentration was measured by HPLC using a Thermo Fisher Scientific (Waltham, MA, USA) Hypersil APS-2 NH2 column (250 × 4.6 mm, 5 μm). The column temperature was maintained at 40°C, the UV detector was set at 210 nm, and the mobile phase was composed of acetonitrile and phosphate buffer (0.3 g/L KH2PO4 and 0.35 g/L Na2HPO4) at a volumetric ratio of 70:30, and run at 1.0 mL/min. The residual maltose concentration was determined by the 3,5-dinitrosalicylic acid method. The concentration of ammonium was determined based on the Berthelot reaction.
Metabolic Network Simulation and Analysis
The resulting model was analyzed using COBRA Toolbox-2.0 (Schellenberger et al., 2011) through the MATLAB interface. For growth simulation, the biomass equation in a minimal medium was set as the objective function. The essential gene analysis was conducted using the “singleGeneDeletion” function of the COBRA toolbox; if the grRatio was lower than 10−6, then the gene was defined as an essential gene. For simulation of acarbose production, the biomass was set to a fixed value, and the acarbose exchange reaction was set as the objective function. The identification of gene amplification targets was based on the strategy of flux scanning based on enforced objective flux (FSEOF) (Choi et al., 2010). The effect of dissolved oxygen (DO) was analyzed by robustness analysis with the fitted substrate uptake rate and cell growth rate (0.025 h−1) as the constraints to predict the acarbose production rate at each controlled oxygen uptake rate. Each amino acid was constrained to have a maximum consumption rate of 0.001 mmol/g DCW/h when simulating the effects of amino acids on acarbose production and cell growth, and the biomass equation and acarbose exchange reaction were set as the objective function, respectively.
Results
Reconstruction and Properties of Model iYLW1028
The reconstruction of the GSMM was completed with an automated procedure and manual refinement. As described in Figure 1, an auto-reconstructed model was generated from the Model-SEED database, and a reaction list was obtained through BLASTp. After the integration of the auto-reconstructed model and BLASTp reaction lists, a draft model, including 1479 reactions and 1143 genes, was obtained. The draft model was further refined by comparison with public databases and the literature (Brunkhorst and Schneider, 2005; Licht et al., 2011; Wendler et al., 2013), including deleting duplicated reactions, filling gaps, adding transport reactions, balancing of mass and charge, adding acarbose synthesis reactions, and adding subsystem information. Thirty one synthesis reactions of acarbose were added to the draft model by literature mining (references were shown in Supplementary Data Sheet 2). Thirty three transport reactions were added according to the KEGG (http://www.genome.jp/kegg/), TCDB (http://www.tcdb.org/), and extensive literature mining to obtain a better understanding of substrate utilization. For example, various sugar transport reactions and metabolic pathways were checked and added to the draft model. The maltose/maltotriose ABC transporters aglEFG, which were not included in draft model, were added by literature mining (Brunkhorst and Schneider, 2005; Wendler et al., 2013). In addition, the transport reactions of dextrin, galactose, sucrose, and trehalose were added to the draft model according to literature mining (Brunkhorst and Schneider, 2005) and TCDB.
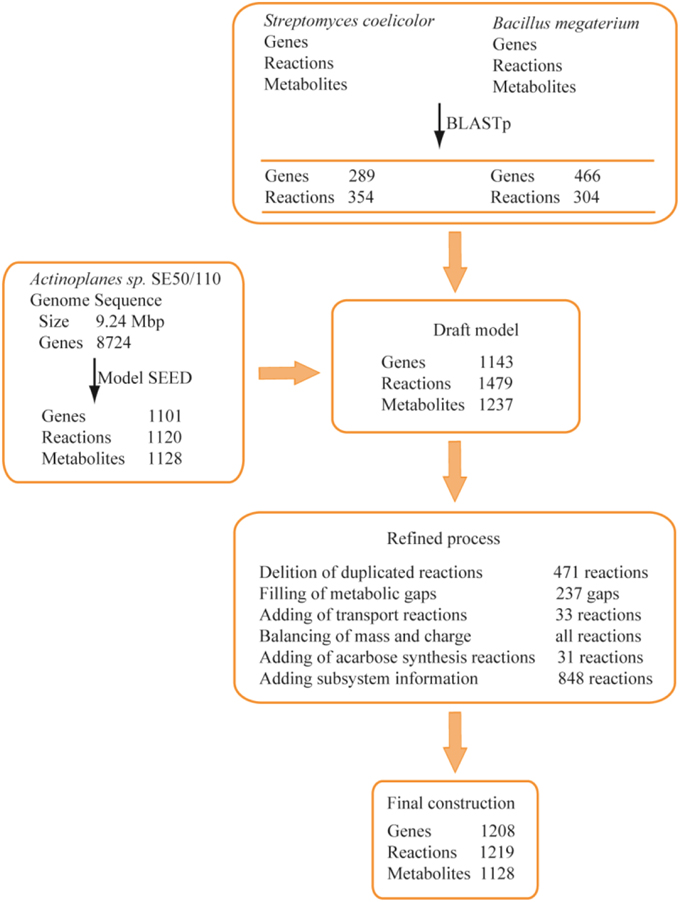
Figure 1. Procedure of metabolic model reconstruction. In BLASTp, genes mean the matched genes between the two genomes. In Model SEED, genes and reactions were obtained from auto-reconstructed procedure.
The final GSMM, iYLW1028, consists of 1219 reactions, 1028 genes, and 1128 metabolites (Data Sheet 1 in Supplementary Materials). As shown in Table 2, 12.5% of the total open reading frames (ORFs), corresponding to 1028 genes of 8247 ORFs, were incorporated into the model. The 1219 reactions were classified into 10 different subsystems (65 metabolic pathways) and located into two cellular compartments (intracellular and extracellular) according to the CELLO database. The numbers of reactions in each subsystem can be seen in Figure 2A. Amino acid metabolism was the largest subsystem, followed by lipid metabolism and carbohydrate metabolism. The sum of these three largest subsystems accounted for more than 50% of the total number of reactions. There were 1162 gene-associated reactions in all, and more than 90% of the subsystems, except for lipid metabolism, were associated with genes, as shown in Figure 2B.
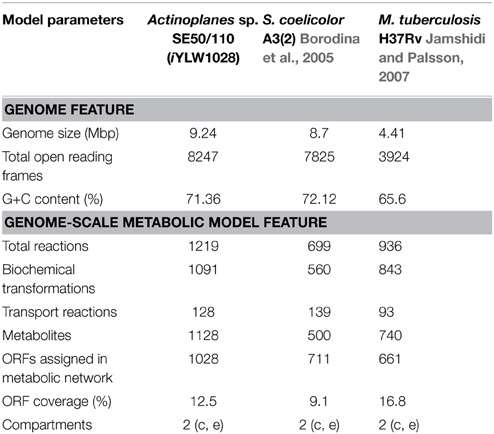
Table 2. Comparison of genome characteristics and model characteristics.
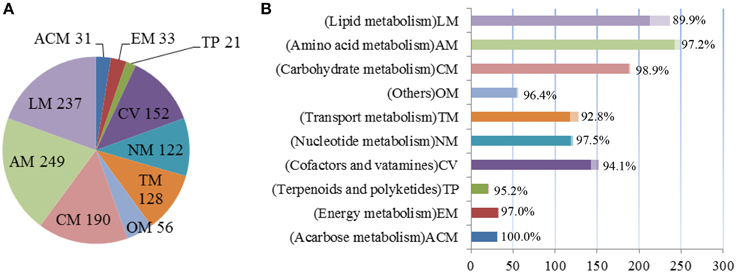
Figure 2. Properties of model iYLW1028. (A) The numbers of reactions in each subsystem. (B) The percent of reactions associated with genes in each subsystem.
To understand the characteristics of model iYLW1028, a comparison of model iYLW1028 with models of Streptomyces coelicolor A3(2) and Mycobacterium tuberculosis H37Rv, which all belong to the Actinomycetales, was also conducted (Table 2). The coverage of the annotated ORFs in the three models (Actinoplanes sp. SE50/110, S. coelicolor A3(2), and M. tuberculosis H37Rv) was 12.5, 9.1, and 16.8%, respectively. Additionally, 265 reactions were shared by the three models. The sum of reactions in carbohydrate metabolism, amino acid metabolism, the metabolism of cofactors and vitamins, and nucleotide metabolism accounted for more than 85% of the 265 shared reactions. There were 330 metabolites shared by the three models, and the number of unique metabolites in the three models (Actinoplanes sp. SE50/110, S. coelicolor A3(2), and M. tuberculosis H37Rv) were 502, 94, and 95, respectively. Model iYLW1028 had more abundant unique metabolites than the other two models, demonstrating that it was more comprehensive.
Determination of Biomass Composition and Verification of Model iYLW1028
Because no detailed biomass information was available for Actinoplanes sp. SE50/110, the biomass composition was determined and referenced from the literature of related species. For biomass composition measuring, strain Actinoplanes sp. SE50/110 was collected during the mid-exponential growth phase, washed three times with distilled water, and lyophilized and measured as detailed in the Methods section. The total biomass was composed of 58% protein, 1% DNA, 11% RNA, 5% lipids, 22% cell wall, and 3% small molecules. The biomass equation and their compositions are shown in Supplementary Data Sheet 2. For all simulations in model iYLW1028, the biomass compositions were assumed to be independent of the environmental conditions.
The capability of utilizing 40 different carbon sources (12 saccharides, 4 alcohols, 4 carboxylic acids, 20 amino acids) for cell growth was qualitatively predicted by flux balance analysis. Each carbon source was used as the sole carbon source in a minimal medium, and the results were compared to experimental data, as shown in Table 3. A 92% match was obtained. This indicated there were no fatal gaps in model iYLW1028 and that model iYLW1028 could predict the catabolic pathways of various carbon sources. Three inconsistent cases were inositol, mannitol, and acarbose. The reasons for the three inconsistent results are: (1) genes in the metabolic pathways of inositol and mannitol were not annotated, so the metabolic pathways were interrupted; (2) Actinoplanes sp. SE50/110 could grow on acarbose minimal medium, and the reason for acarbose was that its transport into the cytoplasm was unclear (Brunkhorst and Schneider, 2005). In addition, of the 40 different carbon sources, 37 carbon sources could sustain cell growth, which indicates that Actinoplanes sp. SE50/110 has a wide substrate utilization spectrum.
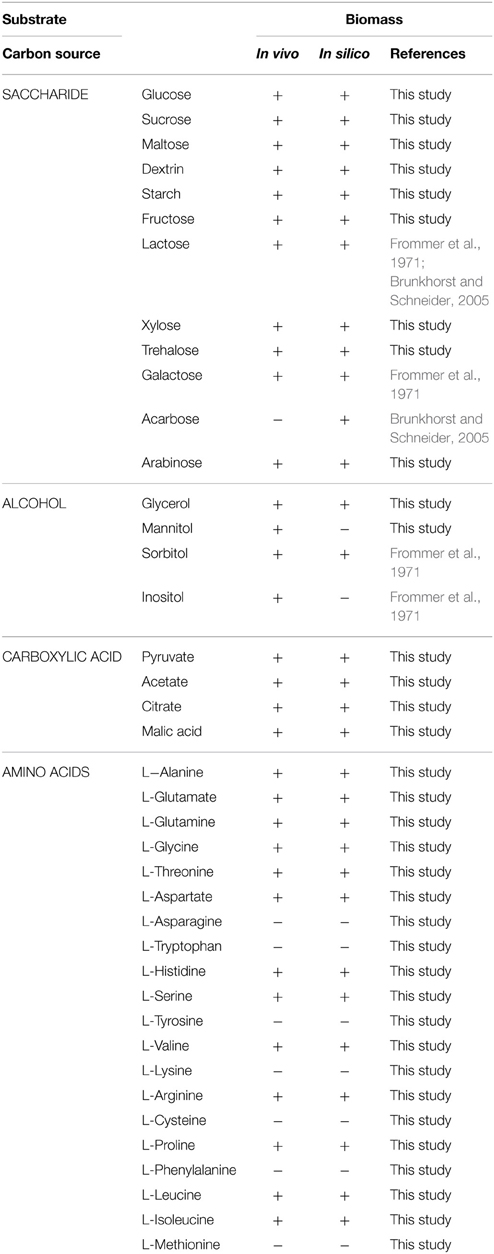
Table 3. Growth phenotypic validation under a sole carbon source.
The capability of utilizing different nitrogen sources for cell growth was also predicted by flux balance analysis. It contained 23 different nitrogen sources (ammonium, nitrate, urea, and 20 amino acids). The results were compared to experimental data, as shown in Table 4. The main results are as follows. (1) A match of 91% between in vivo and in silico was obtained. Of the 23 nitrogen sources, Actinoplanes sp. SE50/110 could grow on 21 sources. Two inconsistent cases were tryptophan and phenylalanine. (2) Phenylalanine could not sustain cell growth in model iYLW1028 because genes in the phenylalanine metabolic pathway were not annotated. (3) Tryptophan as the sole nitrogen source could not sustain growth because the genes of the intermediate metabolite (2-hydroxyphenylacetate) metabolic pathway were not annotated.
Table 4. Growth phenotypic validation under a sole nitrogen source.
Batch fermentation with different maltose uptake rates (fitted from different original maltose concentration data) using acarbose synthesis medium was conducted to evaluate model iYLW1028 quantitatively. The fermentation data were used as constraints to simulate cell growth, including the specific growth rate (μ), maltose uptake rate (MUR), ammonium uptake rate (AUR), and acarbose production rate (APR). As shown in Table 5, the growth rate in silico agreed with the fermentation data. In addition, cell growth on 9 carbon source (glucose, sucrose, galactose, fructose, trehalose, lactose, arabinose, glycerol, and sorbitol) and 2 nitrogen source (urea and glutamate) under the minimal medium was also used for quantitative validation of model iYLW1028. The in silico growth rates were very close to the in vivo values, and they were lower than 10% of the experimental growth rates. The in silico and in vivo specific growth rates and all the cellular flux on the 9 carbon sources and 2 nitrogen sources were listed in Supplementary Data Sheet 5. The agreement of in silico and in vivo growth rates indicates that model iYLW1028 could successfully reflect the cellular metabolism of Actinoplanes sp. SE50/110.
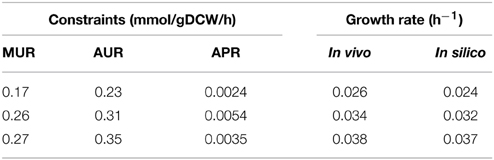
Table 5. Comparison between the simulation value and fermentation data with different experimental constraints by Actinoplanes sp. SE50/110.
Essential Genes and Reactions for Cell Growth
The analysis of genes essential for cell growth was performed by single-gene deletion through MATLAB in two media (acarbose synthesis medium and sucrose medium). As described in Figures 3A,B, 122 genes (11.9%) were predicted to be essential in acarbose synthesis medium, and 81 genes (7.9%) were predicted to be essential in sucrose medium (all the essential genes and simulated conditions are listed in Supplementary Data Sheet 3). More than 75% of the essential genes were concentrated in four subsystems (amino acid metabolism, the metabolism of cofactors and vitamins, nucleotide metabolism, carbohydrate metabolism) under the two conditions, demonstrating that these subsystems play a significant role in cell growth. Additionally, all genes essential for growth in sucrose medium were included in those needed for growth in acarbose synthesis medium, although there was a considerable difference between the two media. The functions of unique genes in acarbose synthesis medium are shown in Supplementary Data Sheet 3. Most of the unique genes participated in amino acid synthesis directly or by supplying precursors. For example, gene ACPL_8142 participated in L-tyrosine synthesis, and genes ACPL_8304 and ACPL_887 participated in L-phenylalanine synthesis. In addition, genes ACPL_1328 and ACPL_1861 belong to the pentose phosphate pathway, but there was no flux of the pentose phosphate pathway in sucrose medium. When a BLASTp search was performed with the database of essential genes (Luo et al., 2014), a 90% match was acquired, which indicated the accuracy of model iYLW1028. However, 2 of 11 unmatched genes were found to be essential in S. coelicolor A3(2). A protein encoded by gene ACPL_1709 and SCO2103 (an essential gene in S. coelicolor A3(2)) catalyzed the formation of 5-methyltetrahydrofolate from 5,10-methylenetetrahydrofolate. Proteins encoded by genes ACPL_6471 and SCO1481 (an essential gene in S. coelicolor A3(2)) also had the same function, as they catalyzed the transfer of orotidylic acid to uridine monophosphate (UMP).
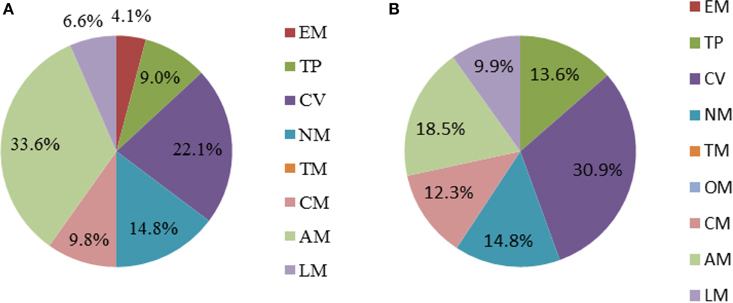
Figure 3. Percentage of essential genes in each subsystem under different cultivated conditions. (A) Acarbose-synthesis medium. (B) Sucrose medium. The abbreviations of each subsystem are the same with that in Figure 2.
The analysis of essential reactions was performed with the same method in acarbose synthesis medium. There were 213 reactions that were predicted to be essential for cell growth (Data Sheet 3 in Supplementary Materials). The pathways of the essential reactions can be seen in Figure 4, and almost 80% of the essential reactions were found in pathways involved in the metabolism of cofactors and vitamins (34 reactions), nucleotide metabolism (29 reactions), amino acid metabolism (55 reactions), and lipid metabolism (52 reactions). Of the 114 genes in essential reactions, 113 belong to essential genes that were described previously.
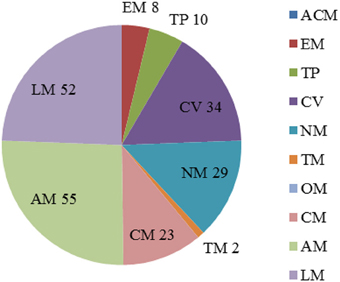
Figure 4. Percentage of essential reactions in each subsystem with maltose as the sole carbon course. The abbreviations of each subsystem are the same with that in Figure 2.
The Acarbose Biosynthetic Pathway in Actinoplanes sp. SE50/110
Model iYLW1028 consists of 31 reactions of acarbose biosynthesis (Figure 5) and the chemical structure for acarbose was as shown in Figure 6. The acarbose biosynthetic pathway was classified into three fractions. (1) Biosynthesis of C7-cylitol moiety: first, 2-epi-5-epi-valiolone synthase, encoded by ACPL_3680, catalyzed the transfer of sedoheptulose 7-phosphate to 2-epi-5-epi-valiolone. Then, after other six enzymatic reactions encoded by ACPL_3668, ACPL_3670, and ACPL_3676–3679, 2-epi-5-epi-valiolone was converted to NDP-1-epi-valienol 7-phpsphate. (2) Biosynthesis of dTDP-4-amino-4,6-dideoxy-D-glucose: it begins with glucose 1-phsophate. There are three reactions in the biosynthesis pathway of dTDP-4-amino-4,6-dideoxy-D-glucose, in which enzyme AcbV is an L-glutamic acid-dependent enzyme. (3) The formation of acarbose and its transport: following catalysis by the deduced protein AcbS encoded by ACPL_3669, NDP-1-epi-valienol 7-phosphate and dTDP-4-amino-4,6-dideoxy-D-glucose are linked to form dTDP-acarviose 7-phosphate, which was further modified by the deduced proteins AcbI and AcbJ (encoded by ACPL_367 and ACPL_3673), leading to the formation of acarbose 7-phosphate. Acarbose 7-phosphate was assumed to be the end-product of the cytoplasmic pathway. With the help of an ABC transporter encoded by ACPL_3664–3666, acarbose 7-phosphate was transported out of the cell, leading to the formation of acarbose. In addition, model iYLW1028 illustrated a “carbophor,” a possible cycling of acarbose-derived metabolites between intracellular and extracellular pools. The extracellular acarbose could link with extracellular saccharides, such as glucose and maltose, which may hydrolyzed by α-amylase (encoded by ACPL_3663 and ACPL_3683) from starch, dextrin, and so on, and then transported into the cell, followed by phosphorylation by acarbose-7-kinase. The intracellular acarbose-derived metabolites were deglycosylated by an amylomaltase-equivalent enzyme (encoded by ACPL_3674), which could form a cycle. Acarbose inhibits the α-glycosidases of competitors via the carbophor.
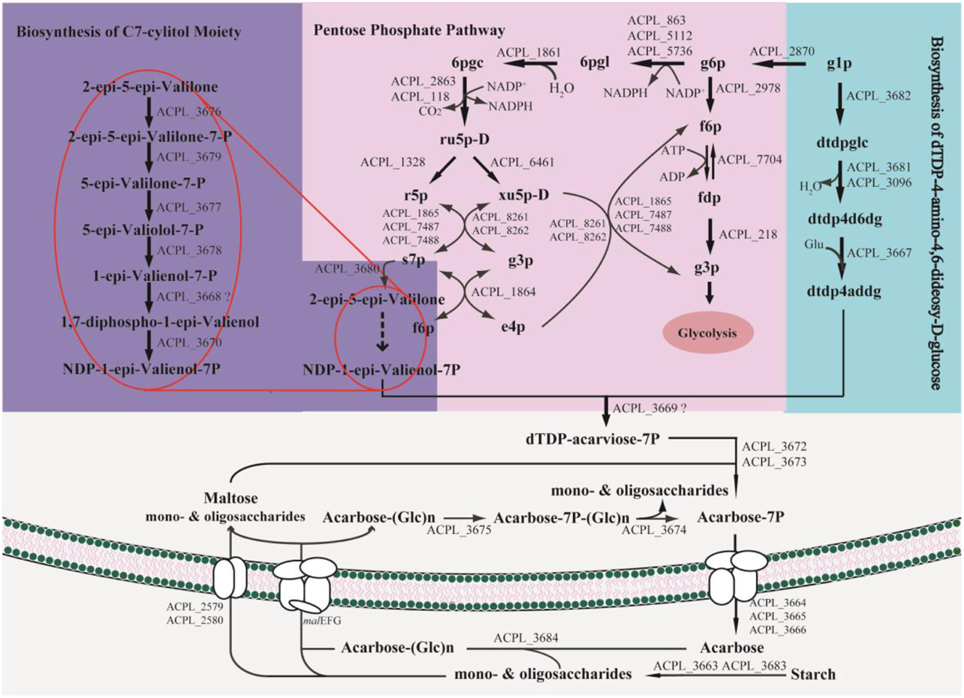
Figure 5. Biosynthetic pathways of acarbose in Actinoplanes sp. SE50/110. The genes malEFG in the pathway were ACPL_6402, ACPL_3200, ACPL_4618, ACPL_5585, ACPL_6401, ACPL_6726, ACPL_3782, ACPL_5386, and ACPL_6400.
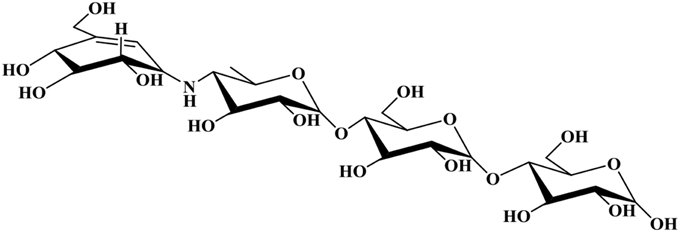
Figure 6. Chemical structure for acarbose.
The essential genes for acarbose production were studied in acarbose synthesis medium. One hundred and thirty three genes were essential for acarbose synthesis, and compared with the essential genes for cell growth, there were 15 unique genes, which all belong to acb cluster genes. All these 15 acb cluster genes were essential for acarbose production, and the deletion of any gene prevented the production of acarbose. The 7 acb clusters genes that were non-essential for acarbose production in model iYLW1028 were ACPL_3663 (acbZ), ACPL_3683 (acbE), ACPL_3674 (acbQ), ACPL_3675 (acbK), ACPL_3684 (acbD), ACPL_3671 (acbP), and ACPL_3681 (acbB). All of these genes contribute to acarbose production, except for ACPL_3681, and they are essential genes. The reasons are as described below. (1) Genes ACPL_3675, ACPL_3674, and ACPL_3684 participated in the reaction of the “carbophor.” However, model iYLW1028 failed to simulate the function of the “carbophor,” so these three genes were silent in model iYLW1028. (2) ACPL_3681 and ACPL_3096 had moderate similarities of 52% (Schwientek et al., 2012) and the proteins encoded by both genes can catalyze the formation of dTDP-4-keto-6-deoxy-D-glucose. Thus, gene ACPL_3681 belongs to the acb cluster, but is not essential for acarbose production. (3) The enzymes encoded by ACPL_3683 and ACPL_3663 hydrolyze starch to glucose; thus, in model iYLW1028, they were predicted to be non-essential genes for acarbose production without the addition of starch. (4) The function of ACPL_3671 is still unknown.
There are four notable aspects in the acarbose synthesis pathway. (1) The starting precursor of the acarbose biosynthetic pathway is 2-epi-5-epi-valiolone, which is derived from sedoheptulose 7-phosphate. Sedoheptulose 7-phosphate is an intermediate metabolite of the pentose phosphate pathway. (2) Glutamate is the primary source of the nitrogen in acarbose. Glutamate and dTDP-4-keto-6-deoxy-D-glucose formed dTDP-4-amino-4,6-dideoxy-D-glucose following catalysis by AcbV, thus introducing the nitrogen into acarbose. (3) Because the starting precursor of acarbose derived from the pentose phosphate pathway, and NADPH was formed along with the pentose phosphate pathway, the cofactor (NADPH) regulation was predicted to affect acarbose production. (4) The expression of the acarbose cluster genes was different in different cultivation media (Schwientek et al., 2013); thus, the overexpression of the acb cluster genes would contribute to acarbose production.
In Silico Simulation of Acarbose Production
To increase the production of acarbose, three types of efforts were made. In model iYLW1028, the effect of additional amino acids on cell growth and acarbose production was simulated (Figure 7). The results show that the addition of amino acids had a good effect on both cell growth and the acarbose production rate. The addition of arginine had the most significantly impact on acarbose production, followed by histidine. And compared to the control, the addition of the aforementioned two amino acids increased the acarbose production rate by 78 and 59%, respectively.
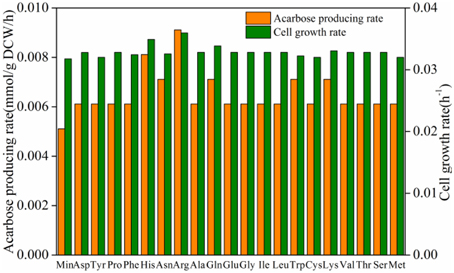
Figure 7. Effect of amino acids on cell growth rate and acarbose production rate.
To find candidate genes to be overexpressed to increase acarbose production, the strategy of FSEOF was applied. When the acarbose production rate was increased gradually, four types of flux profiles were identified: increased, decreased, irregular, and unchanged flux. The flux profile is shown in Supplementary Data Sheet 4. The ratio of pentose phosphate pathway flux to glycolysis flux increased with increasing acarbose production. This simulation result reveals that acarbose production increased with the enhancement of the pentose phosphate pathway and the inhibition of glycolysis. Thus, genes in the pentose phosphate pathway, such as ACPL_1861, ACPL_6461, ACPL_1328, were candidates for overexpression to improve acarbose production. In addition, the flux of the reaction catalyzed by alanine aminotransferase (EC: 2.6.1.2), which forms glutamate, increased with increasing acarbose production. Thus, ACPL_6750 was another candidate gene to be overexpressed.
Meanwhile, oxygen flux was reduced during the whole FSEOF strategy. Therefore, to gain insight into the effect of the oxygen uptake rate on acarbose production, the influence of the oxygen uptake rate on acarbose formation was studied by robustness analysis in acarbose synthesis medium. When the maltose and ammonium uptake rate were constrained to be 0.269 and 0.330 mmol/g DCW/h, respectively, and biomass was constrained to 0.025 h−1, it was found that the acarbose production rate increased sharply when the oxygen uptake rate was in the range of 0–0.2 mmol/g DCW/h (Figure 8). However, when the oxygen uptake rate exceeded 0.2 mmol/g DCW/h, the acarbose production rate began to decrease, and eventually reached zero as the oxygen uptake rate increased.
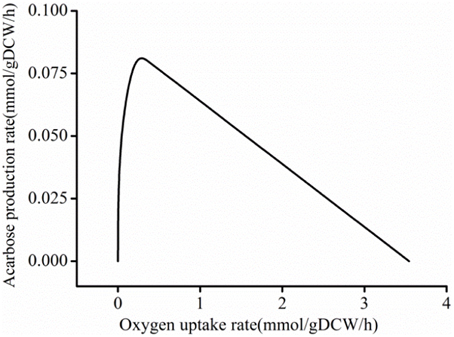
Figure 8. Robustness analysis of oxygen uptake rate.
During fermentation, a small number of other acarbose-like by-products (component A–H) were also produced, of which component C is the most difficult impurity to separate during downstream processing. Component C was produced from acarbose by TreY (Lee et al., 2008). Because TreY was predicted to be a cytoplasmic enzyme according to CELLO in this work, and acarbose existed in a phosphorylated form, in model iYLW1028, component C was supposed to be formed from acarbose 7-phosphate. Gene treY was not an essential gene for growth and acarbose synthesis. Thus, the deletion of treY could contribute to acarbose production and downstream processing, and because two other trehalose synthesis pathways (Lee et al., 2008) exist, the deletion of treY will not have an effect on trehalose synthesis, which is essential for cell growth (Di Lernia et al., 1998; Avonce et al., 2006; Lee et al., 2008). This prediction was also supported by a previous study, in which treY was inactivated in Actinoplanes sp. 8–22 and component C was decreased by 66.7% (Huang et al., 2013).
Effects of Dissolved Oxygen on Acarbose Production
To gain insight into the effect of dissolved oxygen (DO) on acarbose production in batch fermentation experiments, a series of experiments under different aeration rates [0.4, 0.5, 0.6, 0.8, and 1.0 volume vs. mass (vvm)] were conducted. The agitation speed was set at 400 rpm during the whole period of fermentation. The results of the batch fermentation are shown in Figure 9. As a result, the final acarbose concentration (mg/L) and yield (g/g DCW) increased by increasing the aeration rate to 0.5 vvm, but further increasing the aeration rate decreased the final acarbose concentration and yield. The highest DCW and maltose consumption were observed at 0.8 vvm. Under this condition, most consumption of the carbon source was used to synthesize biomass, not acarbose. When aeration was further increased to 1.0 vvm, the DCW, acarbose production, and maltose consumption decreased. These results are a strong indication that excessive oxygen exposure during fermentation inhibits acarbose accumulation, while a relatively low DO level is good for acarbose production.
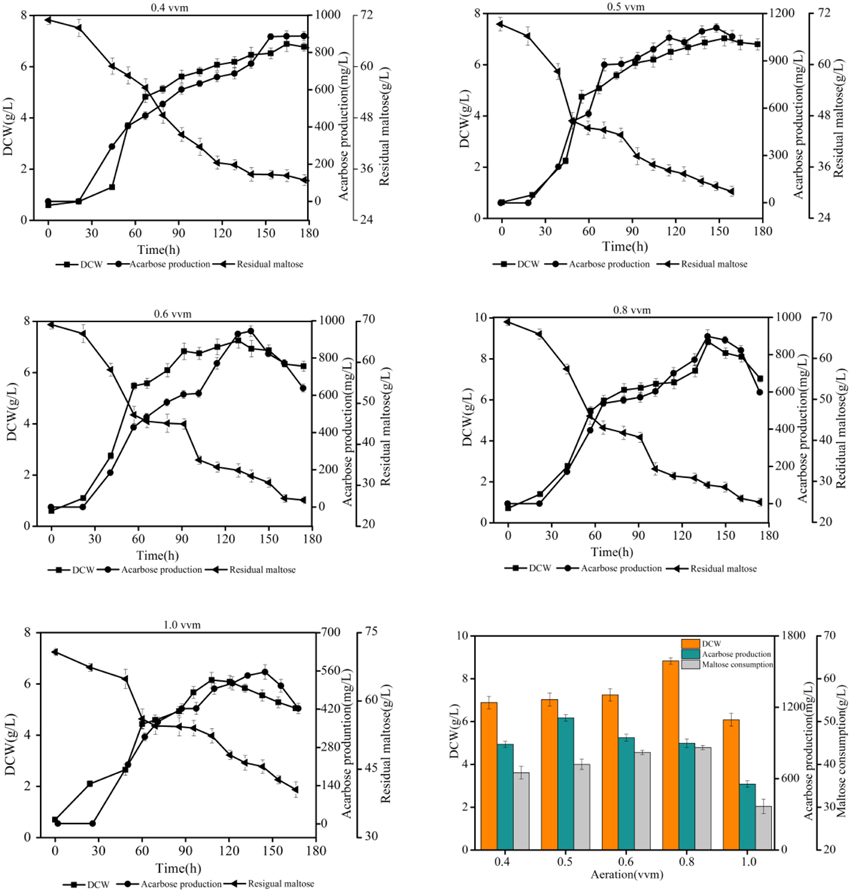
Figure 9. Effects of different aeration rates on acarbose production.
Discussion
Actinoplanes sp. SE50/110 is known to be the wild-type producer of the α-glucosidase inhibitor acarbose (Frommer et al., 1977). This study presents the first GSMM for Actinoplanes. Model iYLW1028 was reconstructed based on iterative measures involving literature mining, the genome sequence, and manual refinement. The capability of utilizing different carbon/nitrogen sources and the agreement between in silico and in vivo cell growth rates on different carbon/nitrogen sources indicated the accuracy of model iYLW1028. Based on model iYLW1028, strategies to improve acarbose production were simulated. It was indicated that, additional amino acids had a beneficial effect on acarbose production, especially L-arginine and L-histidine, and that a relatively low DO level was also beneficial for acarbose production. Gene targets who overexpression could increase the levels of acarbose precursors were identified via the FSEOF algorithm. In addition, the deletion of treY could eliminate the producing of by-product component C. Based on model iYLW1028 and simulation, it is possible to predict limiting factors in the acarbose biosynthetic pathway, perform metabolic engineering to improve acarbose production, and interpret the mechanism at the systems level.
In previous studies, many efforts have been made to interpret the acarbose biosynthetic pathway (Lee et al., 1997; Lee and Egelkrout, 1998; Mahmud et al., 1999; Zhang et al., 2002) and the function of acb clusters genes (Stratmann et al., 1999; Hemker et al., 2001; Zhang et al., 2003; Licht et al., 2011). In model iYLW1028, the reactions in acarbose biosynthetic pathway were summarized and illustrated at a system level to systematically aid our understanding of the biosynthetic pathway. It started with sedoheptulose 7-phosphate and was classified into three fractions: biosynthesis of the C7-cylitol moiety, biosynthesis of dTDP-4-amino-4,6-dideoxy-D-glucose, and the formation of acarbose and its transport. To increase acarbose production, the key factors limiting acarbose production have been discovered and a series of efforts have been made. Because maltose is directly incorporated into acarbose (Lee et al., 1997), the type of carbon source in the fermentation medium is a limiting factor, and it has been optimized. The carbon sources and concentrations that promoted acarbose production in Actinoplanes sp. A56 are 30 g/L glucose and 61.25 g/L maltose (Wei et al., 2010). Osmolality was another limiting factor (Beunink et al., 1997; Wang et al., 2012). Maintaining an elevated osmolality via intermittent feeding of necessary components (14.0 g/L maltose, 6.0 g/L glucose, and 9.0 g/L soybean meal, with feeding at 48, 72, 96, and 120 h and a feed volume of 5 mL) during the fermentation of Actinoplanes utahensis ZJB-08196 increased acarbose production by 15.9%. In this study, two limiting factors were identified based on model iYLW1028. First, the flux of the ratio of the carbon source flow to pentose phosphate pathway was 13.2% according to the analysis of the distribution of carbon sources. Because the direct precursor of acarbose comes from the pentose phosphate pathway, the low level of this intracellular precursor was considered to be a limiting factor. Second, through the robustness analysis of the oxygen uptake rate, it was shown that the acarbose producing rate was affected by the oxygen uptake rate, which was another limiting factor.
Recent strategies to improve acarbose production focused on fermentation compositions (Choi and Shin, 2003; Wang et al., 2011; Sun et al., 2012) and culture conditions (Wang et al., 2011; Li et al., 2012; Cheng et al., 2014), and they have increased acarbose production considerably. However, very little is known about the overexpression or knockout of gene targets to improve acarbose production. Based on the GSMM in this study, we simulated gene overexpression and gene knockouts to guide metabolic engineering to improve acarbose production. It was shown that the overexpression of genes ACPL_1861 (6-phosphoglucanolactonase), ACPL_6461 (ribulose phosphate 3-epimerase), ACPL_1328 (ribose 5-phosphate isomerase) and ACPL_6750 (aminotransferase) promoted acarbose producing. However, no candidate genes to be knockout were found through single and double gene deletions. The overexpression of these four genes lead to a high level of intracellular precursors, which is in agreement with the aforementioned limiting factor. Genes ACPL_1861, ACPL_6461, and ACPL_1328 participated in the pentose phosphate pathway, the overexpression of which increased the precursors of the pentose phosphate pathway. The expression of gene ACPL_6750 would increase the formation of glutamate. Although the wet lab experiments were not completed in our study, the effect of genes ACPL_1861 and ACPL_6461 on the metabolic pathway were supported by literature mining. (1) The deletion of gene devB (6-phosphoglucanolactonase) (Butler et al., 2002) in Streptomyces lividans resulted in a significantly higher antibiotic productivity and a reduced level of pentose phosphate pathway flux. This indicates that overexpression of gene ACPL_1861 might show an increased flux of the pentose phosphate pathway, which could have a beneficial effect on acarbose production. In addition, by overexpressing of gene pgl (encoding 6-phosphogluconolactonase), the riboflavin titer of E. coli RF01S/p15Trc-zgp (Lin et al., 2014) increased by 15.7% compared with strain RF01S/p15Trc-zg, which indicates an enhanced flux of the pentose phosphate pathway. (2) The deletion of gene rpe (ribulose phosphate 3-epimerase) (Shimaoka et al., 2005) in E. coli resulted in low cell growth. It is known that the overall demand for NADPH for biosynthesis is >80% of total cytosolic NADPH production (Fan et al., 2014), and that the most direct route to produce NADPH is via the pentose phosphate pathway. Thus the deletion of rpe might reduce the flux through the pentose phosphate pathway. However, due to the imperfect genetic manipulation of Actinoplanes sp. SE50/110, including the lack of suitable expression vector and transformation method with a high frequency, the wet experiments of gene overexpression are not conducted, which is a weakness of verification on model iYLW1028. In addition, since the effect of the four simulated genes on acarbose production was not verified by wet experiment, they are not appropriate to apply to acarbose producing strains at the present stage. Therefore, Future work for improving acarbose production should focus on the overexpression of these four genes.
The result of the robustness analysis indicated that a relatively lower oxygen uptake rate promoted acarbose production. Additionally, it is known that the DO level plays an important role in acarbose fermentation by Actinoplanes sp. (Li et al., 2012). To elucidate the mechanism by which the oxygen uptake rate affects the acarbose production rate, the distributions of carbon flux under different oxygen levels (aerobic and semi-aerobic) were investigated. It was found that the ratio of pentose phosphate pathway flux to glycolytic flux to was obviously affected by the oxygen levels, as the ratio increased by about 27% when the cells were shifted from a semi-aerobic to aerobic environment. The simulated result was proved by wet lab experiments using different aeration rates. In addition, it has been shown that AcbV, which is required for the biosynthesis of dTDP-4-amino-4,6-dideoxy-D-glucose is an L-glutamic acid-dependent enzyme (Piepersberg et al., 2002; Wehmeier, 2003). Furthermore, in resting cell experiments, several experimental amino acids were found to be a preferred nitrogen source (Lee and Egelkrout, 1998). Therefore the effect of amino acids have been simulated, and it was found that amino acid had a beneficial effect on acarbose production.
In this work, the first GSMM for Actinoplanes was successfully used to illustrate the factors thar limit acarbose biosynthetic during fermentation, to simulate gene targets for improved acarbose production, to elucidate the mechanism of the effect of the oxygen uptake rate on acarbose production, and to interpret the effects of amino acids on acarbose. Despite guiding metabolic engineering and fermentation optimization applications, model iYLW1028 has many future perspectives. First, while there are large amounts of batch fermentation data, little is known about its dynamic fermentation data. Based on dynamic fermentation data, the predictions of microbial behaviors in a dynamic model would enable the comprehensive understanding of acarbose fermentation. Second, one can integrate high-throughput data with the GSMM. Gene expression data in three different growth media were analyzed via RNA-sequencing (Schwientek et al., 2013), which affected acarbose production greatly. With the gene expression data as constraints, the predictions of model iYLW1028 would be more accurate, which would enable us to interpret the different mechanisms of acarbose production in different growth media.
Conclusion
This study presents the first GSMM for Actinoplanes. Model iYLW1028 consists of 1219 reactions, 1128 metabolites, and 1028 genes based on genome information, databases, and literature mining. The prediction of metabolism phenotypes and essential genes based on model iYLW1028 agreed well with the experimental data and the database of essential genes. Using model iYLW1028, in silico metabolic fluxes were analyzed to investigate the effect of additional amino acids and DO on acarbose production. The results showed that additional amino acids had a beneficial effect on acarbose production, especially L-arginine and L-histidine, and that a relatively low DO level was also beneficial for acarbose production. The FSEOF algorithm was used to identify targets whose overexpression could increase the level of acarbose precursors, thereby increasing acarbose production directly. We also examined the effect of the deletion of treY on growth and trehalose synthesis to eliminate the by-product component C. Hence, it is expected that model iYLW1028 will help us understand cellular physiology on a systems level, as well as to perform systems metabolic engineering.
Conflict of Interest Statement
The authors declare that the research was conducted in the absence of any commercial or financial relationships that could be construed as a potential conflict of interest.
Acknowledgments
The author would like to thank Dr. Jens Nielsen, Professor at Chalmers University of Technology, for technological help on the model reconstruction. This work was supported by the National Natural Science Foundation of China (21422602), the National High Technology Research and Development Program of China (2014AA021501), the Graduate Student Creative Research Programme of Jiangsu Province in 2013 (CXZZ13_0755).
Supplementary Material
The Supplementary Material for this article can be found online at: http://journal.frontiersin.org/article/10.3389/fmicb.2015.00632
References
Ara, I., Yamamura, H., Tsetseg, B., Daram, D., and Ando, K. (2010). Actinoplanes toevensis sp. nov. and Actinoplanes tereljensis sp. nov., isolated from Mongolian soil. Int. J. Syst. Evol. Microbiol. 60, 919–927. doi: 10.1099/ijs.0.009944-0
Avonce, N., Mendoza-Vargas, A., Morett, E., and Iturriaga, G. (2006). Insights on the evolution of trehalose biosynthesis. BMC Evol. Biol. 6:109. doi: 10.1186/1471-2148-6-109
Benthid, S., Nielsen, J., and Billadsen, J. (1991). A simple and reliable method for the determination of cellular RNA content. Biotechnol. Tech. 5, 39–42.
Beunink, J., Schedel, M., and Steiner, U. (1997). Osmotically Controlled Fermentation Process for the preparation of Acarbose. U.S. Washington, DC: U.S. Patent and Trademark Office Patent Application.
Borodina, I., Krabben, P., and Nielsen, J. (2005). Genome-scale analysis of Streptomyces coelicolor A3(2) metabolism. Genome Res. 15, 820–829. doi: 10.1101/gr.3364705
Brunkhorst, C., and Schneider, E. (2005). Characterization of maltose and maltotriose transport in the acarbose-producing bacterium Actinoplanes sp. Res. Microbiol. 156, 851–857. doi: 10.1016/j.resmic.2005.03.008
Butler, M. J., Bruheim, P., Jovetic, S., Marinelli, F., Postma, P. W., and Bibb, M. J. (2002). Engineering of primary carbon metabolism for improved antibiotic production in Streptomyces lividans. Appl. Environ. Microbiol. 68, 4731–4739. doi: 10.1128/AEM.68.10.4731-4739.2002
Cheng, X., Peng, W. F., Huang, L., Zhang, B., and Li, K. T. (2014). A novel osmolality-shift fermentation strategy for improving acarbose production and concurrently reducing byproduct component C formation by Actinoplanes sp. A56. J. Ind. Microbiol. Biotechnol. 41, 1817–1821. doi: 10.1007/s10295-014-1520-6
Choi, B. T., and Shin, C. S. (2003). Reduced formation of byproduct component C in acarbose fermentation by Actinoplanes sp. CKD485-16. Biotechnol. Prog. 19, 1677–1682. doi: 10.1021/bp034079y
Choi, H. S., Lee, S. Y., Kim, T. Y., and Woo, H. M. (2010). In silico identification of gene amplification targets for improvement of lycopene production. Appl. Environ. Microbiol. 76, 3097–3105. doi: 10.1128/AEM.00115-10
Christias, C., Couvaraki, C., Georgopoulos, S., Macris, B., and Vomvoyanni, V. (1975). Protein content and amino acid composition of certain fungi evaluated for microbial protein production. Appl. Microbiol. 29, 250–254.
Fan, J., Ye, J. B., Kamphorst, J. J., Shlomi, T., Thompson, C. B., and Rabinowitz, J. D. (2014). Quantitative flux analysis reveals folate-dependent NADPH production. Nature 510, 298–316. doi: 10.1038/nature13236
Frommer, W., Junge, B., Keup, U., Puls, W., and Schmidt, D. (1977). Amino Suger Derivatives. U.S. Washington, DC: U.S. Patent and Trademark Office Patent Application.
Frommer, W., Puls, W., Schiifer, D., Fulda, N. B., Schmidt, D., and Vohwinkel, W. (1971). Glycoside-Hydrolase Enzyme Inhibitors. U.S. Washington, DC: U.S. Patent and Trademark Office Patent Application.
Hemker, M., Stratmann, A., Goeke, K., Schroder, W., Lenz, J., Piepersberg, W., et al. (2001). Identification, cloning, expression, and characterization of the extracellular acarbose-modifying glycosyltransferase, AcbD, from Actinoplanes sp. strain SE50. J. Bacteriol. 183, 4484–4492. doi: 10.1128/JB.183.15.4484-4492.2001
Huang, J., Li, M., and Zhen, Y. (2013). Acarbose Engineering Bacterium as Well as Preparation Method and Application Thereof. Hangzhou: China Patent Application.
Di Lernia, I., Morana, A., Ottombrino, A., Fusco, S., Rossi, M., and De Rosa, M. (1998). Enzymes from sulfolobus shibatae for the production of trehalose and glucose from starch. Extremophiles 2, 409–416. doi: 10.1007/s007920050086
Izard, J., and Limberger, R. J. (2003). Rapid screening method for quantitation of bacterial cell lipids from whole cells. J. Microbiol. Methods 55, 411–418. doi: 10.1016/S0167-7012(03)00193-3
Jamshidi, N., and Palsson, B. O. (2007). Investigating the metabolic capabilities of Mycobacterium tuberculosis H37Rv using the in silico strain iNJ661 and proposing alternative drug targets. BMC Syst. Biol. 1:26. doi: 10.1186/1752-0509-1-26
Burton, K. (1955). A study of the conditions ans mechanism of the diphenylamine reaction for the clorimetric estimation fo fdeoxyribonucleic acid. Biochem. J. 62, 315–322.
Lee, J. S., Hai, T., Pape, H., Kim, T. J., and Suh, J. W. (2008). Three trehalose synthetic pathways in the acarbose-producing Actinoplanes sp. SN223/29 and evidence for the TreY role in biosynthesis of component C. Appl. Microbiol. Biotechnol. 80, 767–778. doi: 10.1007/s00253-008-1582-3
Lee, S., and Egelkrout, E. (1998). Biosynthetic studies on the alpha-glucosidase inhibitor acarbose in Actinoplanes sp.: glutamate is the primary source of the nitrogen in acarbose. J. Antibiot. 51, 225–227. doi: 10.7164/antibiotics.51.225
Lee, S., Sauerbrei, B., Niggemann, J., and Egelkrout, E. (1997). Biosynthetic studies on the alpha-glucosidase inhibitor acarbose in Actinoplanes sp.: source of the maltose unit. J. Antibiot. 50, 954–960. doi: 10.7164/antibiotics.50.954
Li, K.-T., Zhou, J., Wei, S.-J., and Cheng, X. (2012). An optimized industrial fermentation processes for acarbose production by Actinoplanes sp. A56. Bioresour. Technol. 118, 580–583. doi: 10.1016/j.biortech.2012.05.013
Licht, A., Bulut, H., Scheffel, F., Daumke, O., Wehmeier, U. F., Saenger, W., et al. (2011). Crystal structures of the bacterial solute receptor AcbH displaying an exclusive substrate preference for beta-D-galactopyranose. J. Mol. Biol. 406, 92–105. doi: 10.1016/j.jmb.2010.11.048
Lin, Z. Q., Xu, Z. B., Li, Y. F., Wang, Z. W., Chen, T., and Zhao, X. M. (2014). Metabolic engineering of Escherichia coli for the production of riboflavin. Microb. Cell Fact. 13:104. doi: 10.1186/S12934-014-0104-5
Luo, H., Lin, Y., Gao, F., Zhang, C. T., and Zhang, R. (2014). DEG 10, an update of the database of essential genes that includes both protein-coding genes and noncoding genomic elements. Nucleic Acids Res. 42, 574–580. doi: 10.1093/nar/gkt1131
Mahmud, T., Tornus, I., Egelkrout, E., Wolf, E., Uy, C., Floss, H. G., et al. (1999). Biosynthetic studies on the alpha-glucosidase inhibitor acarbose in Actinoplanes sp.: 2-epi-5-epi-valiolone is the direct precursor of the valienamine moiety. J. Am. Chem. Soc. 121, 6973–6983. doi: 10.1021/ja991102w
Nandedkar, A. K. (1983). Comparative study of the lipid composition of particular pathogenic and nonpathogenic species of Mycobacterium. J. Natl. Med. Assoc. 75, 69–74.
Piepersberg, W., Diaz-Guardamino Uribe, P. M., Stratmann, A., Thomas, H., Wehmeier, U., and Zhang, C. S. (2002). “Recent developments in the biosynthesis and regulation of aminoglycosides,” in Microbial Secondary Metabolites: Biosynthesis, Genetics and Regulation, eds F. Fierro and J. F. Martín (Lucknow: Research Signpost), 1–26.
Rocha, I., Förster, J., and Nielsen, J. (2008). Design and application of genome-scale reconstructed metabolic models. Methods Mol. Biol. 416, 409–431. doi: 10.1007/978-1-59745-321-9_29
Saier, M. H., Yen, M. R., Noto, K., Tamang, D. G., and Elkan, C. (2009). The transporter classification database: recent advances. Nucleic Acids Res. 37, D274–D278. doi: 10.1093/nar/gkn862
Schellenberger, J., Que, R., Fleming, R. M., Thiele, I., Orth, J. D., Feist, A. M., et al. (2011). Quantitative prediction of cellular metabolism with constraint-based models: the COBRA Toolbox v2. 0. Nat. Protoc. 6, 1290–1307. doi: 10.1038/nprot.2011.308
Schwientek, P., Szczepanowski, R., Rueckert, C., Kalinowski, J., Klein, A., Selber, K., et al. (2012). The complete genome sequence of the acarbose producer Actinoplanes sp. SE50/110. BMC Genom. 13:112. doi: 10.1186/1471-2164-13-112
Schwientek, P., Wendler, S., Neshat, A., Eirich, C., Ruckert, C., Klein, A., et al. (2013). Comparative RNA-sequencing of the acarbose producer Actinoplanes sp. SE50/110 cultivated in different growth media. J. Biotechnol. 167, 166–177. doi: 10.1016/j.jbiotec.2012.10.019
Shimaoka, M., Kawasaki, H., Takenaka, Y., Kurahashi, O., and Matsui, H. (2005). Effects of edd and pgi disruptions on inosine accumulation in Escherichia coli. Biosci. Biotechnol. Biochem. 69, 1248–1255. doi: 10.1271/bbb.69.1248
Stratmann, A., Mahmud, T., Lee, S., Distler, J., Floss, H. G., and Piepersberg, W. (1999). The AcbC protein from Actinoplanes species is a C-7-cyclitol synthase related to 3-dehydroquinate synthases and is involved in the biosynthesis of the alpha-glucosidase inhibitor acarbose. J. Biol. Chem. 274, 10889–10896. doi: 10.1074/jbc.274.16.10889
Sun, L. H., Li, M. G., Wang, Y. S., and Zheng, Y. G. (2012). Significantly enhanced production of acarbose in fed-batch fermentation with the addition of S-Adenosylmethionine. J. Microbiol. Biotechnol. 22, 826–831. doi: 10.4014/jmb.1111.11047
Wang, Y.-J., Liu, L.-L., Feng, Z.-H., Liu, Z.-Q., and Zheng, Y.-G. (2011). Optimization of media composition and culture conditions for acarbose production by Actinoplanes utahensis ZJB-08196. World J. Microb. Biot. 27, 2759–2766. doi: 10.1007/s11274-011-0751-1
Wang, Y. J., Liu, L. L., Wang, Y. S., Xue, Y. P., Zheng, Y. G., and Shen, Y. C. (2012). Actinoplanes utahensis ZJB-08196 fed-batch fermentation at elevated osmolality for enhancing acarbose production. Bioresour. Technol. 103, 337–342. doi: 10.1016/j.biortech.2011.09.121
Wehmeier, U. F. (2003). The biosynthesis and metabolism of acarbose in Actinoplanes sp. SE 50/110: a progress report. Biocatal. Biotransformation 21, 279–284. doi: 10.1080/102424120310001614388
Wei, S. J., Cheng, X., Huang, L., and Li, K. T. (2010). Medium optimization for acarbose production by Actinoplanes sp. A56 using the response surface methodology. Afr. J. Biotechnol. 9, 1949–1954.
Wendler, S., Hurtgen, D., Kalinowski, J., Klein, A., Niehaus, K., Schulte, F., et al. (2013). The cytosolic and extracellular proteomes of Actinoplanes sp. SE50/110 led to the identification of gene products involved in acarbose metabolism. J. Biotechnol. 167, 178–189. doi: 10.1016/j.jbiotec.2012.08.011
Xue, Y. P., Qin, J. W., Wang, Y. J., Wang, Y. S., and Zheng, Y. G. (2013). Enhanced production of acarbose and concurrently reduced formation of impurity c by addition of validamine in fermentation of Actinoplanes utahensis ZJB-08196. Biomed. Res. Int. 2013:705418. doi: 10.1155/2013/705418
Zhang, C. S., Podeschwa, M., Altenbach, H. J., Piepersberg, W., and Wehmeier, U. F. (2003). The acarbose-biosynthetic enzyme AcbO from Actinoplanes sp. SE 50/110 is a 2-epi-5-epi-valiolone-7-phosphate 2-epimerase. FEBS Lett. 540, 47–52. doi: 10.1016/S0014-5793(03)00221-7
Zhang, C. S., Stratmann, A., Block, O., Bruckner, R., Podeschwa, M., Altenbach, H. J., et al. (2002). Biosynthesis of the C-7-cyclitol moiety of acarbose in Actinoplanes species SE50/110 - 7-O-phosphorylation of the initial cyclitol precursor leads to proposal of a new biosynthetic pathway. J. Biol. Chem. 277, 22853–22862. doi: 10.1074/jbc.M202375200
Keywords: Actinoplanes sp. SE50/110, genome-scale metabolic model, acarbose production, amino acids, oxygen uptake rate
Citation: Wang Y, Xu N, Ye C, Liu L, Shi Z and Wu J (2015) Reconstruction and in silico analysis of an Actinoplanes sp. SE50/110 genome-scale metabolic model for acarbose production. Front. Microbiol. 6:632. doi: 10.3389/fmicb.2015.00632
Received: 31 January 2015; Accepted: 11 June 2015;
Published: 25 June 2015.
Edited by:
Cheng Zhong, Tianjin University of Science and Technology, ChinaReviewed by:
Blaine Pfeifer, The State University of New York at Buffalo, USANobutaka Nakashima, National Institute of Advanced Industrial Science and Technology, Japan
Copyright © 2015 Wang, Xu, Ye, Liu, Shi and Wu. This is an open-access article distributed under the terms of the Creative Commons Attribution License (CC BY). The use, distribution or reproduction in other forums is permitted, provided the original author(s) or licensor are credited and that the original publication in this journal is cited, in accordance with accepted academic practice. No use, distribution or reproduction is permitted which does not comply with these terms.
*Correspondence: Jing Wu, Wuxi Medical School, Jiangnan University, 1800 Lihu Road, Wuxi 214122, China, wujing@jiangnan.edu.cn
†These authors have contributed equally to this work.