 Valeria Michelacci1*
 Massimiliano Orsini2
 Arnold Knijn3
 Sabine Delannoy4
 Patrick Fach4
 Alfredo Caprioli1
 Stefano Morabito1
- 1European Reference Laboratory for Escherichia coli, Dipartimento di Sanità Pubblica Veterinaria e Sicurezza Alimentare, Istituto Superiore di Sanità, Rome, Italy
- 2Istituto Zooprofilattico Sperimentale dell'Abruzzo e del Molise G. Caporale, Teramo, Italy
- 3Servizio Informatico, Documentazione, Biblioteca e Attività Editoriali, Istituto Superiore di Sanità, Rome, Italy
- 4Platform IdentyPath, Food Safety Laboratory, ANSES, Université Paris-Est, Maisons-Alfort, France
Shiga-toxin producing Escherichia coli (STEC) strains possess a large accessory genome composed of virulence genes existing in multiple allelic variants, which sometimes segregate with specific STEC subpopulations. We analyzed the allelic variability of 91 virulence genes of STEC by Real Time PCR followed by melting curves analysis in 713 E. coli strains including 358 STEC. The 91 genes investigated were located on the locus of enterocyte effacement (LEE), OI-57, and OI-122 pathogenicity islands and displayed a total of 476 alleles in the study population. The combinations of the 91 alleles of each strain were termed allelic signatures and used to perform cluster analyses. We termed such an approach High Resolution Virulence Allelic Profiling (HReVAP) and used it to investigate the phylogeny of STEC of multiple serogroups. The dendrograms obtained identified groups of STEC segregating approximately with the serogroups and allowed the identification of subpopulations within the single groups. The study of the allelic signatures provided further evidence of the coevolution of the LEE and OI-122, reflecting the occurrence of their acquisition through a single event. The HReVAP analysis represents a sensitive tool for studying the evolution of LEE-positive STEC.
Introduction
Human infections with Shiga-toxin producing Escherichia coli (STEC) cause a wide range of symptoms including uncomplicated diarrhea, hemorrhagic colitis, and the life-threatening hemolytic uremic syndrome (HUS) (Caprioli et al., 2005). The main virulence feature of STEC is the ability to produce Shiga-toxins (Stx), which interfere with the protein synthesis in the target cells, eventually causing their death (O'Brien and Holmes, 1987). The capacity to produce Stx is acquired through infection with bacteriophages conveying the stx genes, which can remain stably integrated into the bacterial chromosome (O'Brien et al., 1984).
In spite of the striking biological effect exerted by the Stx, their sole production seems not to be sufficient for causing the disease, at least the most severe forms. As a matter of fact, only a few STEC serogroups are usually isolated from human cases of severe disease (Nataro and Kaper, 1998; Karmali et al., 2003), which share the presence in the genome of mobile genetic elements (MGEs) encoding robust machineries for the colonization of the host gut (McDaniel and Kaper, 1997; Paton et al., 2001; Morabito et al., 2003; Imamovic et al., 2010; Michelacci et al., 2013). Three Pathogenicity Islands (PAIs) have been described in the genome of such STEC serogroups: the locus of enterocyte effacement (LEE) (McDaniel and Kaper, 1997), the OI-122 (Karmali et al., 2003; Morabito et al., 2003), and the OI-57 (Imamovic et al., 2010).
The LEE locus governs the ability to induce the typical “attachment and effacement” (A/E) lesion on the enterocyte. It encodes a type three secretion system, effectors subverting the cell functions related with the cytoskeleton assembly and maintenance, and factors mediating the intimate adhesion of the bacterium to the enterocyte, including the adhesin intimin (McDaniel and Kaper, 1997). The other two PAIs carry genes whose products are also involved in the mechanism of colonization, such as Efa1/LifA, encoded by a gene present in the OI-122 (Morabito et al., 2003), and AdfO (Ho et al., 2008), whose genetic determinant is conveyed by the OI-57 (Imamovic et al., 2010).
During the last decades different authors deployed schemes for the classification of the different STEC types (Griffin and Tauxe, 1991; Nataro and Kaper, 1998; Karmali et al., 2003). One of these schemes groups the STEC strains based on the serogroup, relative incidence of human infections, ability to cause severe diseases, association with outbreaks and presence of virulence-associated MGEs in the genome (Karmali et al., 2003). According to this classification, STEC are divided into seropathotypes (SPTs), identified with letters from A to E in a decreasing rank of pathogenicity. SPT A comprises STEC O157, while SPT B includes the STEC belonging to serogroups different from O157 but causing both sporadic cases and outbreaks of HUS, namely O26, O103, O111, O145, and O121. SPTs A and B share the presence of the LEE, OI-57, and OI-122 PAIs in their genome. The SPT C includes a number of STEC serogroups, including O113 and O91, which apparently do not harbor the LEE locus but are sporadically isolated from severe infections. Finally, STEC included in the SPTs D and E have rarely or never been associated with human disease respectively (Karmali et al., 2003). For the last three SPTs the information on the presence and integrity of the three PAIs are scanty.
The complexity of the STEC virulome is an important source of strain genomic variability, which is further augmented by the existence of multiple allelic variants of the virulence genes. Some of the subtypes of stx2 have been significantly associated with the most severe infection (Friedrich et al., 2002), while some other subtypes of both stx1 and stx2 seemed to be primarily associated with a milder course of the disease or confined to animal hosts (Friedrich et al., 2002; Bielaszewska et al., 2006; Persson et al., 2007; Scheutz et al., 2012). A considerable heterogeneity has also been identified in the DNA sequence of the intimin-coding gene eae, leading to the identification of at least 18 intimin types unevenly distributed in the different STEC serogroups (Oswald et al., 2000; Tarr et al., 2002; Ito et al., 2007; Madic et al., 2010).
In the present study we developed an approach to simultaneously identify the presence and the allelic types of a large panel of genes carried by the LEE locus, OI-122, and OI-57 PAIs and used it to study the phylogeny of STEC belonging to SPT A, B and C.
Materials and Methods
Bacterial Strains
A total of 713 E. coli strains positive for at least one of the three pathogenicity islands LEE, OI-122, and OI-57 were selected among the isolates present in the culture collections of the Istituto Superiore di Sanità (ISS, Rome, Italy) and the Agence Nationale de Sécurité Sanitaire de l'Alimentation, de l'Environnement et du travail (ANSES, Maisons Alfort, France) and used to identify the alleles of the genes harbored by the three PAIs. The panel comprised 358 STEC strains belonging to serogroups O157 (n = 81), O26 (n = 32), O111 (n = 36), O103 (n = 8), O145 (n = 8), O121 (n = 3), and others (n = 190) isolated from unrelated human cases of human infections and from food in Italy and France in the period 2008–2011. Additional 355 stx-negative E. coli of multiple serogroups and isolated from human, food and animal sources in the same countries and period were included in the study. The O157 STEC strain EDL933 was used as positive control (Supplementary Table 1, Sheet 1).
A population of 318 unrelated STEC strains, part of the panel of strains described above, was used to assess the performance of the HReVAP approach. These included 161 isolates of SPTs A and B and belonging to serogroups O157 (n = 81), O26 (n = 32), O111 (n = 33), O103 (n = 5), O145 (n = 7) and O121 (n = 3) and 157 eae-negative strains, of serogroups O91 (n = 14), O174 (n = 10), O113 (n = 9), O104 (n = 6), O101 (n = 3), O153 (n = 3), O21 (n = 3), and others (n = 109). The study population also included a panel of 36 stx-negative eae-positive E. coli, altogether referred to as EPEC, including the following serogroups: O26 (n = 12), O127 (n = 5), O55 (n = 4), O128 (n = 3), O125 (n = 3), O111 (n = 2), O86 (n = 2), and others (n = 5).
Finally, 39 out of the 161 SPTs A and B STEC were also subjected to whole genome sequencing, followed by Multi Locus Sequence Typing (MLST) and Whole genome SNP analysis with the aim of comparing HReVAP results with those obtained using these DNA-sequence-based methods. The latter isolates included strains belonging to serogroups O157 (n = 16), O26 (n = 12), O111 (n = 7), O103 (n = 2), O145 (n = 1), and O121 (n = 1).
Real-Time PCR and Melting Curves Analysis
Ninety-one primer pairs were deployed to amplify 100–300 bp fragments from as many genes harbored on the three PAIs LEE, OI-122, and OI-57 (38, 12, and 41 genes from each island, respectively). The genomic sequence of the O157 STEC strain EDL933 (Acc. no. AE005174) was used to design the primer pairs using the Primer-BLAST web-tool available on the NCBI webserver. Some of the primers were degenerated to amplify the target genes in all the STEC strains for which a sequence was available in GenBank. The sequences of primers used in this study and their annealing position on the genomic sequence of EDL933 strain are reported in Table 1.
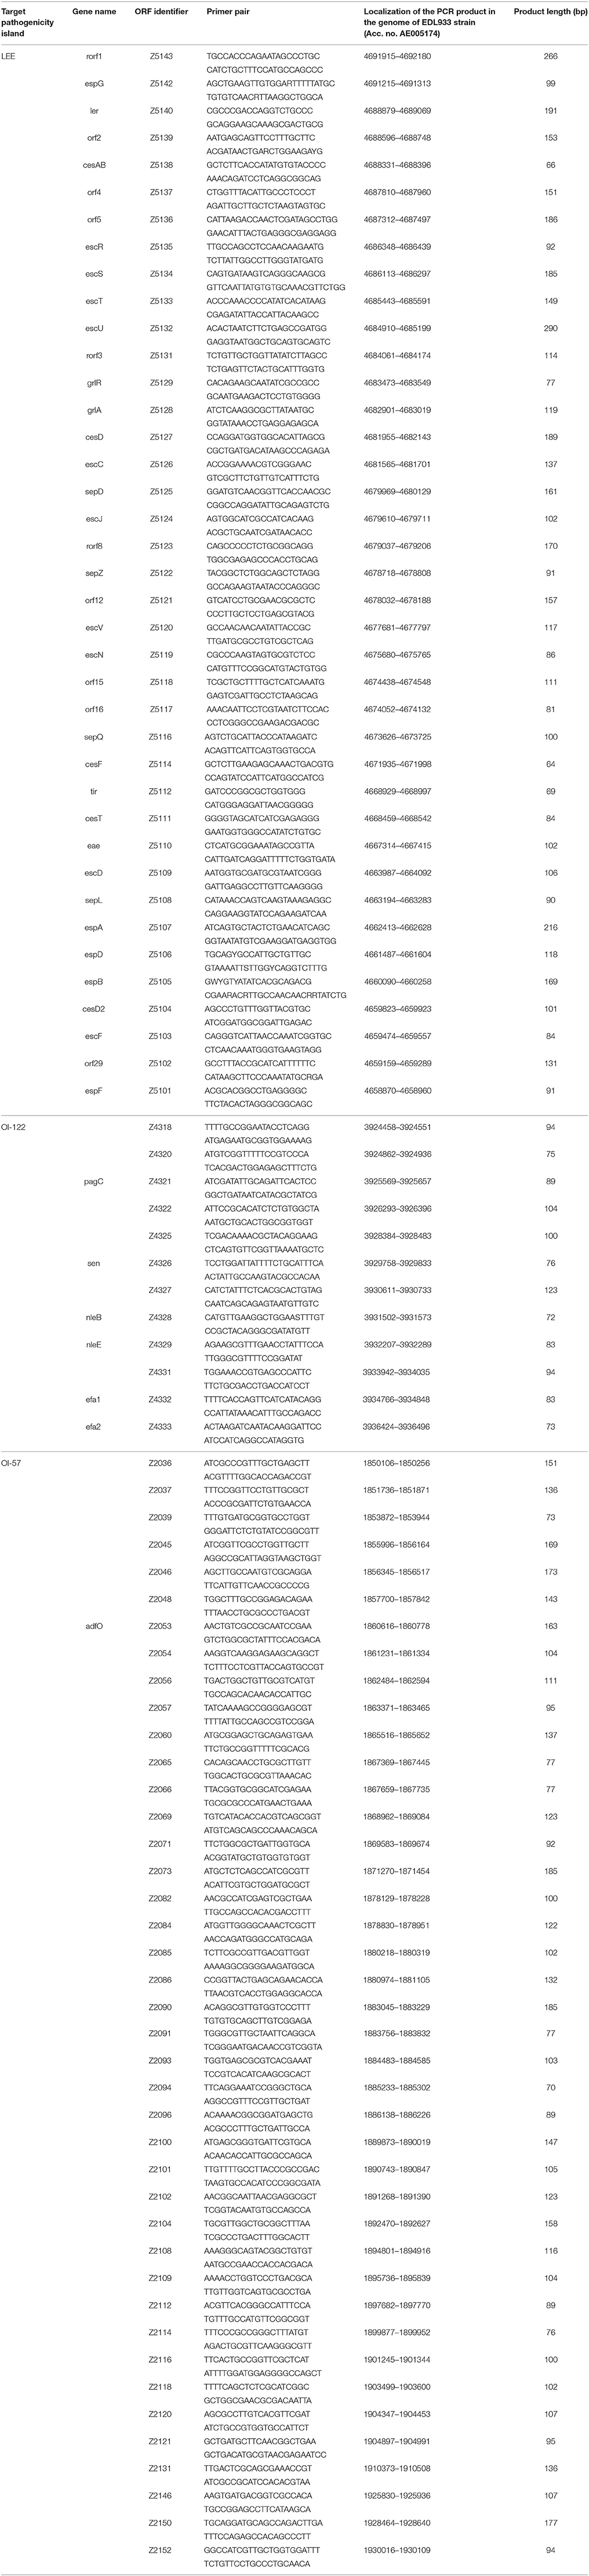
Table 1. List of primers used in this study.
Total DNA was extracted from overnight cultures of the strains with the Nucleospin Tissue extraction kit (Macherey-Nagel, Düren, DE).
The Real-Time PCR reactions were performed on the high throughput BioMark Real Time PCR system with 96.96 Genotyping Dynamic Array Chips (Fluidigm, San Francisco, CA), using the EvaGreen DNA binding dye (Biotium Inc., Hayward, CA). The thermal profile was 95°C for 10 min (enzyme activation) followed by 35 cycles of 95°C for 15 s and 60°C for 1 min (amplification step). Finally, a denaturation step was performed and the melting curves of the amplified products were registered. Eight array chips were used to perform the whole panel of reactions, each including a positive template control consisting in the DNA extracted from an overnight culture of the EDL933 strain. In addition to the 91 genes, each sample was also subjected to amplification of the stx genes (Perelle et al., 2004) and the wecA housekeeping gene, used as marker for E. coli species (Forward primer: 5′-CTTTATCTCAGTAGCCTGGG-3′, Reverse primer: 5′-AGGAAGTAACCAAACGGTCC-3′).
High Resolution Virulence Allelic Profiling Analysis (HReVAP)
The melting temperatures (Tm) of the amplicons were normalized using the Tm of the PCR products amplified from the positive control strain EDL933 present in each array chip. Normalization values were obtained for each array chip minimizing the mean of the Tm standard deviations for the eight normalized Tm measurements over each gene as well as the overall maximum value of the normalized Tm ranges of all genes.
The Tm frequency distributions for each gene have been calculated by grouping values in 0.05°C intervals. The frequency distributions were then analyzed with the “mix” function of the “mixdist” package in the R software (RTeam, 2014). This function finds Maximum Likelihood estimates for the proportions, means, and standard deviations of a mixture distribution by applying a Newton-type iterative method (RTeam, 2014). The number of Gaussians and the starting parameters were adjusted upon evaluation of several fitting results. In order to limit the degrees of freedom, prior knowledge was applied to the model: in each model fit, the standard deviations (σ) of the Gaussian curves were left variable but constrained to be equal. The following command was used for the analysis: mix[Tm_dat, Tm_par, dist = “norm,” mixconstr(conmu = “NONE,” consigma = “SEQ”)], where Tm_dat is the data frame of the grouped Tm data and Tm_par a data frame of the starting values for the parameters of the distributions. Several normal distributions were observed for each gene at different intervals of temperatures. Before clustering, Tm values were aggregated into numbered classes utilizing the model fitting results to define temperature intervals for distinct alleles. The interval limits were calculated as the points of intersection between two adjoining Gaussian curves with the same standard deviation according to the following equation:
Tint = Temperature at the point of intersection between Gaussian 1 and 2
μi = Mean temperature of the Gaussian curve i = 1, 2
σ = Standard deviation of the Gaussian curves
πi = Amplitude of the Gaussian curve i = 1, 2
The model fitting used did not prove optimal for allele assignment due to the proximity of many Gaussian curves, with consequent overlap. Therefore, all fits have been revised trying to keep the maximum number of Gaussian curves in the model while aggregating those heavily overlapping. With this procedure, the resolution of the method (capacity of allele distinction) has been lowered in benefit of the precision of the method (convergence of assignments). The Tm intervals identified by peaks in the distributions obtained from the analysis of each gene were used to identify the alleles, which were labeled with numbers in ascending order according to the position of the peak in the temperature distribution (Supplementary Table 2). Each strain was given a numeric allelic signature comprising the alleles of all the genes analyzed.
The neighbor software of the Emboss package for samples clustering with default parameters (Rice et al., 2000) was used to compare the allelic signatures and to obtain distance matrices.
Each step of the above described procedure has been implemented in dedicated python classes, including the neighbor software that was wrapped together with the TreeGraph software (Stover and Muller, 2010) for graphical trees representation.
The HReVAP software package was deployed and used on the public computational framework ARIES operating on the servers of the Istituto Superiore di Sanità and based on the Galaxy bioinformatics platform (Giardine et al., 2005; Blankenberg et al., 2010; Goecks et al., 2010) (https://w3.iss.it/site/aries/).
The tree files (.tre) produced with the HReVAP clustering algorithm were downloaded and visualized using the FigTree program version 1.4.0 (Drummond et al., 2012).
Whole Genome Sequencing of STEC and Phylogenetic Analyses
Thirty-nine out of the 161 STEC strains used for the HReVAP typing were subjected to whole genome sequencing using the Library Preparation Kit by Kapa Biosystems (Wilmington, MA, USA) and a paired end 100 bp protocol on an Illumina HiSeq2500 instrument in fast run mode according to manufacturers' instructions. The sequencing reads have been uploaded in the EMBL-ENA sequence database (EMBL European Nucleotide Archive Study accession no. PRJEB11886). The raw reads were trimmed to remove the adaptors and to accept 27 as the lowest Phred value and assembled using the de novo assembly tool Edena v3 (Hernandez et al., 2008). The contigs were subjected to in silico Multi Locus Sequence Typing (MLST) with the protocol described by Wirth and colleagues (Wirth et al., 2006). Whole genome Single Nucleotide Polymorphism (WG-SNP) analysis was performed using the ksnp3 pipeline (Gardner et al., 2015), using 19 as kmer size. The optimum value for the kmer size was selected as that producing the highest number of unique kmers of the median length in all the genomes of the dataset and it was calculated by using the kchooser tool included in the ksnp3 pipeline. All the bioinformatics analyses were performed through the ARIES webserver (https://w3.iss.it/site/aries/).
Results
HReVAP: Identification of the Alleles
The analysis of the 91 genes conveyed by the three pathogenicity islands LEE, OI-122, and OI-57 allowed identifying a total of 476 alleles (Supplementary Table 1, Sheet 1 and Supplementary Table 3). Each gene displayed 2 to 10 different alleles in the study population.
The eae-positive strains included in the panel exhibited the presence of 32 out of the 38 LEE-harbored genes on average, while the strains positive for the marker of OI-122, efa1-lifA, were positive for the majority of the 12 genes selected on this PAI (10.8 genes on average). The OI-57 showed the widest variability. As a matter of fact, 10.4% of the isolates proved positive for 1 to 10 genes of PAI OI-57, 30.6% were positive for 11–20 genes, 26% fell in the range of 21–30 genes detected and 33% gave positive result for more than 31 out of the 41 targets considered (Supplementary Table 1, Sheet 1).
The genes conveyed by the LEE and the OI-122 islands showed a mean number of alleles of 4.79 (range: 2–8 alleles; median = 5) and 4.17 (range: 3–8 alleles; median = 4) for each gene, respectively, while those part of the OI-57 were the most variable, displaying a mean value of 5.95 alleles each (range: 3–10 alleles; median = 6) (Figure 1 and Supplementary Table 3). Interestingly, the LEE locus displayed a uniform allelic variation throughout its whole length while the OI-122 and the OI-57 appeared to have a slightly higher number of alleles in the leftmost part (Figure 1).
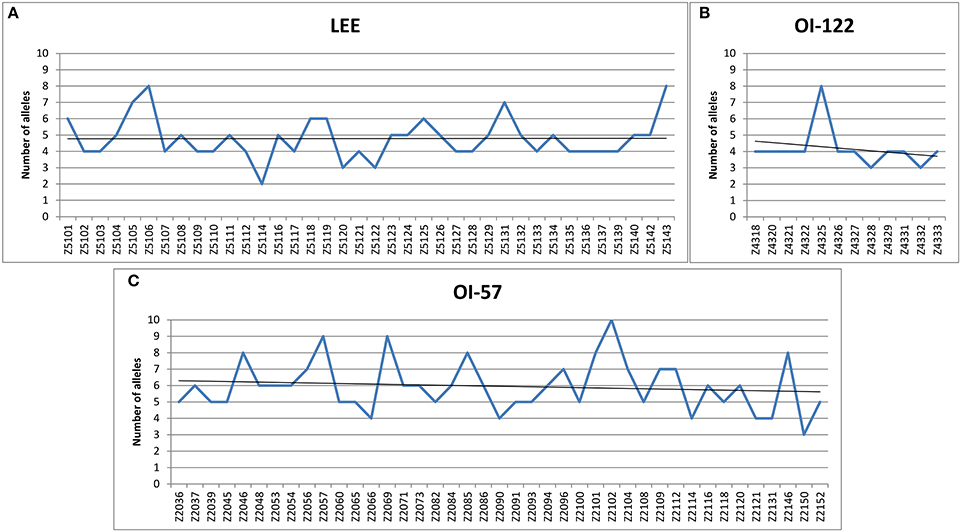
Figure 1. Allelic variability of the PAIs assayed. Number of alleles identified for each of the ORFs assayed and trend lines. (A) Alleles identified in the ORFs harbored by the LEE locus. (B) Alleles identified in the ORFs harbored by the OI-122. (C) Alleles identified in the ORFs harbored by the OI-57.
HReVAP Performance: Amplification of the LEE, OI-122, and OI-57 Targets in STEC and EPEC
All the LEE-genes could be amplified in the vast majority of the STEC strains belonging to SPTs A and B (Figure 2A and Supplementary Table 1, Sheet 2). In detail, no negative results were obtained for all the O157 and O145 strains tested, with the only exception of one O145 strain, negative for eight targets. Nine LEE-borne genes, namely the open reading frames (ORF) Z5101, Z5107, Z5111, Z5112, Z5114, Z5117, Z5121, Z5122, and Z5127 were more variable in the STEC serogroups other than the O157 and O145, with more than 60% of the STEC O26 strains tested producing no amplicons. The same nine targets could not be amplified in all the STEC O103 and O121 strains, with a few exceptions (Figure 2A). Four of these nine gene targets (Z5107, Z5112, Z5114, and Z5122) could not be amplified from the whole panel of the STEC O111, while ORF Z5101 gave positive result in only two strains of this serogroup.
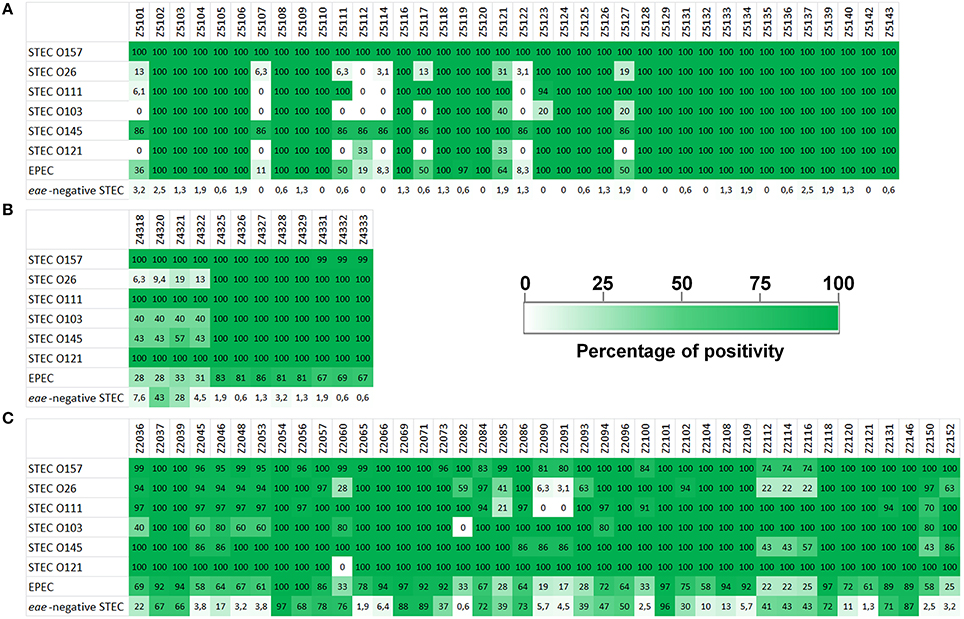
Figure 2. Amplification of HReVAP targets in STEC and EPEC strains. The results are reported as percentage of positive strains for different groups of samples, according to the color scale reported in the figure legend. (A) Results of the ORFs harbored by the LEE locus. (B) Results of the ORFs harbored by the OI-122. (C) Results of the ORFs harbored by the OI-57.
As for the OI-122 PAI, all the 12 ORFs selected were detected in the whole panel of STEC O157, O111, and O121 strains, with the only exception of one O157 strain, which was negative for the three ORFs Z4331, Z4332, and Z4333 (Figure 2B and Supplementary Table 1, Sheet 2).
The STEC strains belonging to serogroups O145, O103, and O26 showed different amplification profiles, with the four ORFs Z4318, Z4320, Z4321, and Z4322 negative in 60% of the O103 strains and in the majority of O145 and O26 strains (Figure 2B).
The HReVAP typing of the STEC and EPEC confirmed the highest degree of variation of PAI OI-57. In particular, ORFs Z2112, Z2114, and Z2116 could not be amplified in many STEC O26, O157, and O145 while ORFs Z2090 and Z2091 were not detected in all the STEC O111, in the majority of STEC O26 strains, and in some STEC O145 and O157. Finally, the ORF Z2085 was frequently negative in STEC O111 and O26 (Figure 2C and Supplementary Table 1, Sheet 2).
Unexpectedly, the eae-negative STEC strains tested also showed positivity to many targets of the PAI OI-57 (Figure 2 and Supplementary Table 1, Sheet 3). In particular, two ORFs, Z2054, and Z2101, were positive in more than 95% of the strains tested, while genes Z2037, Z2039, Z2056, Z2057, Z2060, Z2069, Z2071, Z2084, Z2086, Z2096, Z2118, Z2131, and Z2146, were positive in more than 50% of the population assayed.
As a whole, a mean of 15.9 targets out of the 41 selected for OI-57 were present in the panel of eae-negative STEC strains (range: 5–39; median = 15) (Supplementary Table 1, Sheet 3).
The EPEC strains assayed provided different amplification patterns (Figure 2 and Supplementary Table 1, Sheet 4). As expected, the LEE-borne ORFs and the OI-122 targets followed a pattern of positivity to PCR similar to that displayed by the STEC belonging to SPTs A and B, although with some variation. The OI-57 was present in all the EPEC strains tested but showed two regions of major variability encompassing the ORFs Z2090-Z2093 (negativity range: 72.2–83.3%) and Z2112-Z2116 (negativity range: 75–77.78%) (Figure 2 and Supplementary Table 1, Sheet 4).
HReVAP Typing: Allelic Variability of the LEE, the OI-122, and the OI-57
The allelic variability of the genes harbored by the three pathogenicity islands LEE, OI-122, and OI-57 has been investigated in the same study population used to assess the HReVAP performance.
The clustering of the allelic signatures of the STEC strains of SPTs A and B produced a dendrogram whose branches segregated with the serogroups, with a few exceptions (Figure 3A). In particular, the cluster formed by STEC O157 strains appeared clearly distinct from the others and much more homogeneous, while the strains belonging to O111 and O26 serogroups were divided in two and three distinct clusters, respectively. Similar results were obtained when the cluster analysis was carried out separately using the allelic signatures produced with the ORFs of the LEE locus (Figure 3B) and of the PAI OI-122 only (Figure 3C). Such dendrograms displayed the same topology of that produced when the alleles of the complete ORFs panel were used but showed a lower intra-cluster resolution. More complex results were instead obtained from the HReVAP analysis of the genes conveyed by the OI-57, reflecting the highest variability observed in the ORFs of this PAI (Figure 3D). Even if the main groups corresponding to STEC serogroups O157, O111, and O26 could still be detected, the overall topology showed wider and less defined branches.
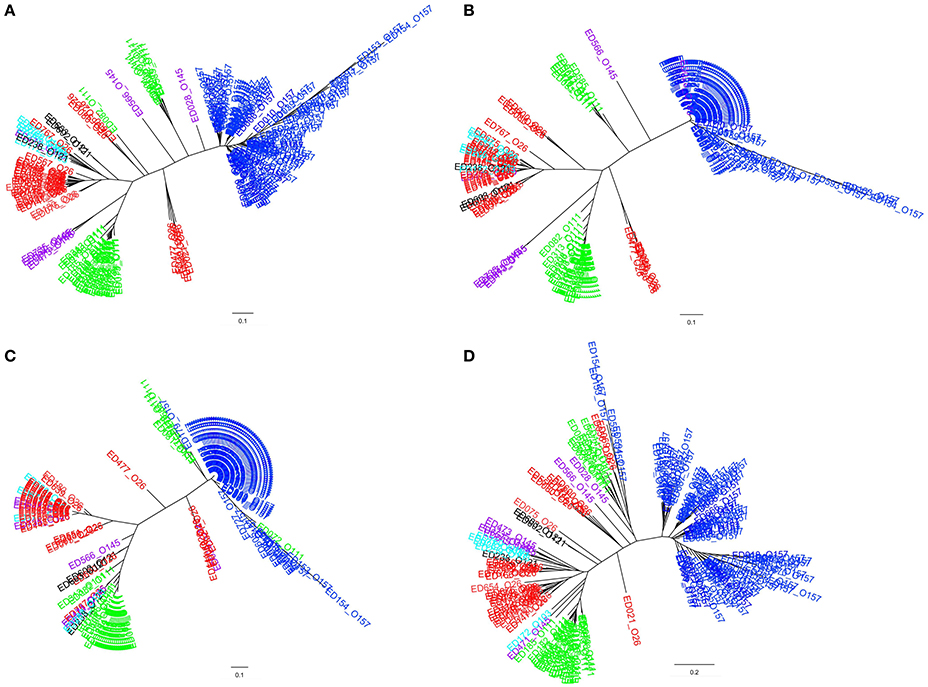
Figure 3. Clustering of the allelic signatures obtained with the HReVAP from STEC strains belonging to SPTs A and B. The different serogroups are labeled according to the following color legend: dark blue for O157, red for O26, green for O111, pale blue for O103, purple for O145, and black for O121. (A) Dendrogram of the allelic signatures from all the 91 ORFs. (B) Dendrogram of the allelic signatures obtained with the ORFs of the LEE locus. (C) Dendrogram of the allelic signatures obtained with the ORFs of the OI-122. (D) Dendrogram of the allelic signatures obtained with the ORFs of the OI-57.
The topology of the dendrograms obtained with the EPEC isolates resembled that of those produced with the STEC of SPTs A and B allelic signatures. However, the higher variability of EPEC, together with the lower number of isolates tested, caused the output to be less definite (Figure 4).
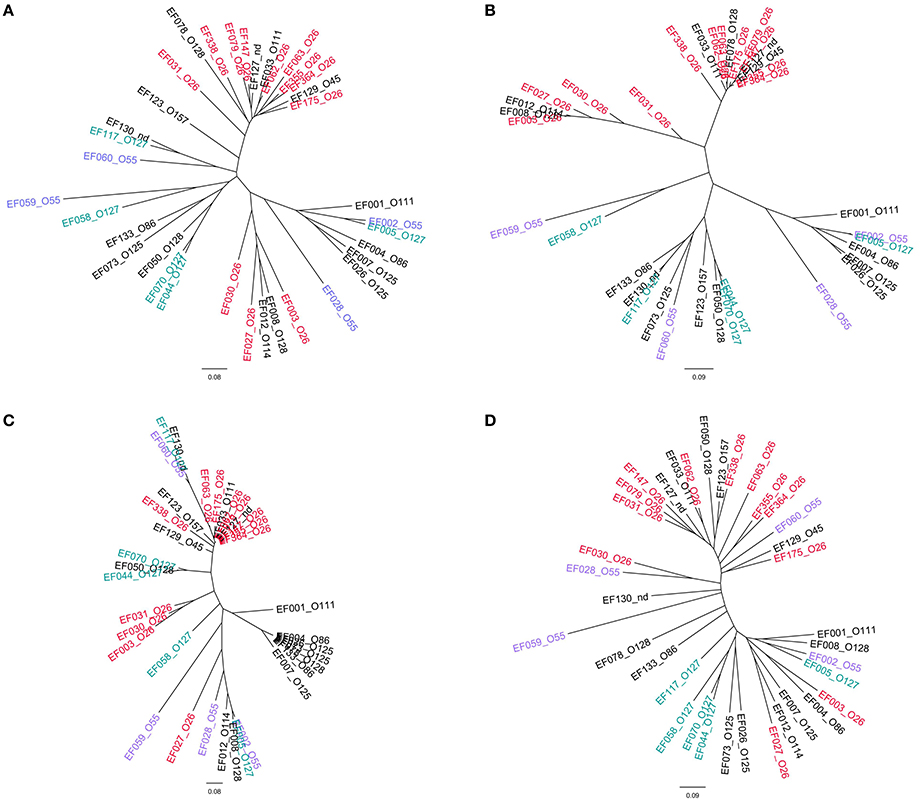
Figure 4. Clustering of the allelic signatures obtained with the HReVAP from EPEC strains. The most represented serogroups are labeled according to the following color legend: red for O26, violet for O55, and blue-green for O127. (A) Dendrogram of the allelic signatures from all the 91 ORFs. (B) Dendrogram of the allelic signatures obtained with the ORFs of the LEE locus. (C) Dendrogram of the allelic signatures obtained with the ORFs of the OI-122. (D) Dendrogram of the allelic signatures obtained with the ORFs of the OI-57.
As for the eae-negative STEC strains, the cluster analysis of the allelic signatures was carried out exploiting the observed positivity to many of the ORFs of the OI-57. Although based on a smaller number of targets, this analysis showed a massive variability in the allelic signatures, yet able to distinguish and group different populations of strains (Figure 5).
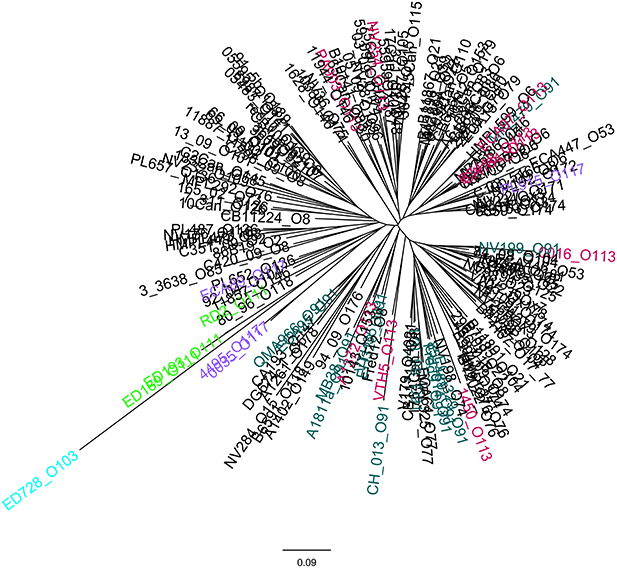
Figure 5. Clustering of the allelic signatures obtained with the HReVAP from the eae-negative STEC strains. Dendrogram of the allelic signatures obtained with the ORFs of the OI-57. The most represented serogroups are labeled according to the following color legend: crimson for O113, green for O111, pale blue for O103, orange for O91, and brown for O117.
Comparison between HReVAP and the DNA Sequence-Based MLST and Whole Genome-SNP Analyses
Thirty-nine STEC strains were used to compare the results of the HReVAP with those produced by DNA sequence-based typing techniques. The strains were either analyzed with the HReVAP or their genomes subjected to in silico MLST and WG-SNP analysis. The comparison showed that the HReVAP (Figure 6A) had a much higher discriminatory power than the MLST (Figure 6B) and produced a dendrogram similar to that produced with the WG-SNP (Figure 6C). Apparently, the topology of the HReVAP dendrogram allowed identifying differences within the serogroups, that were not visible in the WG-SNP-based dendrogram.
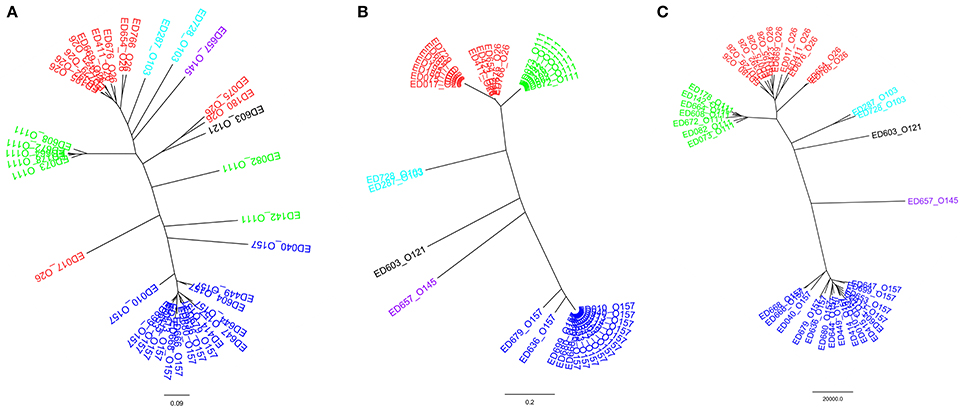
Figure 6. Comparison of the dendrograms obtained by HReVAP, MLST, and WG-SNP typing. The different serogroups are labeled according to the following color legend: dark blue for O157, red for O26, green for O111, pale blue for O103, purple for O145, and black for O121. (A) Dendrogram of the allelic signatures obtained with the HReVAP typing. (B) Dendrogram obtained from the MLST typing. (C) Dendrogram obtained from the WG-SNP typing.
Discussion
The detection of the enzyme isoforms or of the polymorphisms in the genomes of pathogenic microorganisms has been for a long time the basis for the identification of molecular profiles of isolates. Bacterial subtyping has been largely used in research studies on the evolution of bacterial pathogens since the first development of typing methods such as the multi locus enzyme electrophoresis (Selander and Levin, 1980; Selander et al., 1986; Donkor, 2013) and the pulsed field gel electrophoresis (Arbeit et al., 1990), followed by the elaboration of schemes for the identification of the allelic forms of genes as in the multi-locus sequence typing (MLST) (Maiden et al., 1998). Moreover, molecular typing of microorganisms soon demonstrated its great potential in the control of infectious diseases through the implementation of surveillance programs aiming at limiting the burden of infections (Swaminathan et al., 2001). Nowadays, molecular subtyping of bacteria can benefit from cutting edge technologies such as the next generation sequencing (NGS) allowing the detection of whole genome single nucleotide polymorphism (SNP) (WG-SNP) (Kuroda et al., 2010; Vogler et al., 2011; Joensen et al., 2014; Dallman et al., 2015b).
WG-SNP has been successfully used to define a typing scheme for the surveillance of Listeria monocytogenes infections (Commission Decision, 2010). However, its application to bacterial pathogens such as E. coli, although advisable, is still under debate given the extensive genomic variability of this bacterial species. The development of WG-SNP-based typing concepts for E. coli has been attempted by several authors and proved successful for some STEC serogroups such as O157 and, to a lesser extent, O26 (Dallman et al., 2015a,b,c; Holmes et al., 2015; Jenkins et al., 2015). However, a single approach successfully applicable to all the STEC serogroups has not been developed yet.
We have deployed a typing scheme for STEC based on the evaluation of polymorphisms in the sequence of a large panel of virulence genes through the determination of the melting temperature of Real-Time PCR amplicons. Such an approach originated from multiple considerations. The virulence genes, part of the accessory genome, have a higher variability than the rest of the genome. Such an increased variability would reduce the number of targets needed for the phylogenetic analysis. Additionally, comparing the allelic combinations of the fraction of genome shared by all the members of a pathotype (e.g., STEC) should overcome the need of finding an appropriate reference or setting a threshold for the diversity, which would introduce a bias in the evaluation of clusters. These aspects both represent limitations of the currently described whole genome sequence-based methods for E. coli (Dallman et al., 2015a,b,c; Holmes et al., 2015; Jenkins et al., 2015). Finally, the use of the widely diffused Real Time PCR to obtain the strains' signatures makes it not necessary to resort to NGS, which is only available in reference laboratories and requires skills and knowledge of the downstream bioinformatics applications that might be unavailable in most of the front-line laboratories.
The rationale behind the proposed concept resides in the many studies published on the allelic variants of known virulence genes of STEC, such as the Shiga-Toxin-coding genes (Friedrich et al., 2002; Bielaszewska et al., 2006; Persson et al., 2007; Scheutz et al., 2012) and the eae gene (Oswald et al., 2000; Tarr et al., 2002; Ito et al., 2007; Madic et al., 2010), as well as the more recently described subAB and toxB genes (Tozzoli et al., 2010; Michelacci et al., 2013, 2014). All the mentioned papers described the association between specific alleles and sub-populations of STEC strains. We investigated the allelic forms of 91 virulence genes conveyed by the three main MGEs associated with STEC pathogenicity, namely the LEE, the OI-122, and the OI-57 (McDaniel and Kaper, 1997; Karmali et al., 2003; Imamovic et al., 2010) and used the obtained allelic signatures to investigate the phylogenesis of STEC.
The whole process, termed High Resolution Virulence Allelic Profiling (HReVAP), allowed us to identify a range of 2–10 allelic forms for each of the 91 ORFs, resulting in the impressive number of 476 total alleles generating a high number of unique allelic signatures.
The HReVAP clustered the LEE-positive STEC strains into groups approximately segregating with the serogroup, providing an indication that the allelic signatures were not randomly assigned to the isolates. Additionally, the analysis identified different subpopulations within the serogroups and also showed variability within each of the populations identified (Figure 3). This finding was not unexpected, since all the strains used in the test panel were epidemiologically unrelated, and at the same time provided an indication that the HReVAP might also be successful in identifying clusters of related strains such as those derived from an outbreak.
The HReVAP produced allelic signatures also with eae-negative STEC. However, the dendrogram obtained with these strains had a less resolved topology (Figure 5). An explanation of this result resides either in the lower number of genes these isolates are positive for or in the low number of strains in each serogroup, which in some cases only included one isolate. Nevertheless, the finding that at least part of this PAI was frequently present in eae-negative STEC is interesting and constitutes the first report of the presence of this PAI, or its remnants, in this group of STEC.
The HReVAP analysis also proved useful in following the evolution of the single MGEs considered for the typing scheme. As a matter of fact, we could visualize a similar pattern of variation in the allelic signatures obtained considering the ORFs of the LEE locus and the OI-122 (Figures 3B,C). This result indicates that the two MGEs underwent similar evolutionary pathways and supports the previous hypothesis about their common acquisition through a single event of horizontal gene transfer in certain STEC and EPEC strains (Morabito et al., 2003).
Our results showed that the OI-57 had the greatest genetic variability, displaying the highest number of alleles on average for all the ORFs considered (Figure 1C and Supplementary Table 3). Additionally, the analysis of the allelic signatures obtained considering the OI-57 ORFs produced dendrograms with the most dispersed topology (Figures 3D, 4D). These observations suggest that this MGE could have been acquired at an early stage of the evolutionary pathway that led to the emergence of STEC. Additionally, since the LEE-negative STEC investigated were also positive for many of the OI-57-related ORFs considered in this study, it can be hypothesized that such an island could be a common heritage of STEC independently of the presence of the LEE locus.
Finally, the comparison of the performance of the HReVAP with that obtained with other comparative genomic tools such as the MLST and the WG-SNP analysis substantiates the robustness of the HReVAP in identifying LEE-positive STEC populations with a much higher resolution with respect to the MLST and a comparable level of discrimination to that of the WG-SNP.
In conclusion, the HReVAP approach demonstrated good sensitivity and high resolution in the molecular characterization of STEC, particularly for the LEE-positive strains. Moreover, the incredibly large virulome of pathogenic E. coli offers the opportunity to refine the HReVAP typing strategy for other STEC groups, such as the LEE-negative isolates, or even to extend it to other E. coli pathotypes by integrating the panel of targets.
Further work is in progress to assess the use of HReVAP as an effective tool for the surveillance of STEC infections and to obtain the allelic signatures from whole genome sequences in order to make this technique a cross-generational tool connecting the Real-Time PCR and the NGS-based applications.
Author Contributions
VM conceived the experimental design and drafted the manuscript, MO developed the scripts for HReVAP clustering, and critically revised the manuscript, AK developed and applied the scripts for the extraction of the allelic signatures of the HReVAP and critically revised the manuscript, SD and PF designed the Real Time PCR primers, performed the amplifications and melting curve analyses and participated in the revision of the manuscript, AC contributed to the revision of the draft manuscript for important intellectual content, SM conceived the study and thoroughly revised the manuscript. Finally, all the authors approved the manuscript to be published.
Conflict of Interest Statement
The authors declare that the research was conducted in the absence of any commercial or financial relationships that could be construed as a potential conflict of interest.
Supplementary Material
The Supplementary Material for this article can be found online at: http://journal.frontiersin.org/article/10.3389/fmicb.2016.00202
References
Arbeit, R. D., Arthur, M., Dunn, R., Kim, C., Selander, R. K., and Goldstein, R. (1990). Resolution of recent evolutionary divergence among Escherichia coli from related lineages: the application of pulsed field electrophoresis to molecular epidemiology. J. Infect. Dis. 161, 230–235. doi: 10.1093/infdis/161.2.230
Bielaszewska, M., Friedrich, A. W., Aldick, T., Schurk-Bulgrin, R., and Karch, H. (2006). Shiga toxin activatable by intestinal mucus in Escherichia coli isolated from humans: predictor for a severe clinical outcome. Clin. Infect. Dis. 43, 1160–1167. doi: 10.1086/508195
Blankenberg, D., Von Kuster, G., Coraor, N., Ananda, G., Lazarus, R., Mangan, M., et al. (2010). Galaxy: a web-based genome analysis tool for experimentalists. Curr. Protoc. Mol. Biol. Chapter 19:Unit 19.10.11–21. doi: 10.1002/0471142727.mb1910s89
Caprioli, A., Morabito, S., Brugere, H., and Oswald, E. (2005). Enterohaemorrhagic Escherichia coli: emerging issues on virulence and modes of transmission. Vet. Res. 36, 289–311. doi: 10.1051/vetres:2005002
Commission Decision, E. C. (2010). Commission decision concerning a financial contribution from the Union towards a coordinated monitoring programme on the prevalence of Listeria monocytogenes in certain ready-to-eat foods to be carried out in the Member States (2010/678/EU). Official J. Eur. Union, L 292, 40–54. doi: 10.3000/17252555.L_2010.292.eng
Dallman, T. J., Byrne, L., Ashton, P. M., Cowley, L. A., Perry, N. T., Adak, G., et al. (2015a). Whole-genome sequencing for national surveillance of Shiga toxin-producing Escherichia coli O157. Clin. Infect. Dis. 61, 305–312. doi: 10.1093/cid/civ318
Dallman, T. J., Byrne, L., Launders, N., Glen, K., Grant, K. A., and Jenkins, C. (2015b). The utility and public health implications of PCR and whole genome sequencing for the detection and investigation of an outbreak of Shiga toxin-producing Escherichia coli serogroup O26:H11. Epidemiol. Infect. 143, 1672–1680. doi: 10.1017/S0950268814002696
Dallman, T. J., Ashton, C., Byrne, L., Perry, N. T., Petrovska, L., Ellis, R., et al. (2015c). Applying phylogenomics to understand the emergence of Shiga-toxin-producing Escherichia coli O157:H7 strains causing severe human disease in the UK. Microb. Genomics 1. doi: 10.1099/mgen.0.000029
Donkor, E. S. (2013). Molecular typing of the pneumococcus and its application in epidemiology in sub-Saharan Africa. Front. Cell. Infect. Microbiol. 3:12. doi: 10.3389/fcimb.2013.00012
Drummond, A., Heled, J., Lemey, P., de Oliveira, T., Pybus, O., Shapiro, B., et al. (2012). FigTree Graphical Viewer of Phylogenetic Trees [Online]. Available online at: http://tree.bio.ed.ac.uk/software/figtree/
Friedrich, A. W., Bielaszewska, M., Zhang, W. L., Pulz, M., Kuczius, T., Ammon, A., et al. (2002). Escherichia coli harboring Shiga toxin 2 gene variants: frequency and association with clinical symptoms. J. Infect. Dis. 185, 74–84. doi: 10.1086/338115
Gardner, S. N., Slezak, T., and Hall, B. G. (2015). kSNP3.0: SNP detection and phylogenetic analysis of genomes without genome alignment or reference genome. Bioinformatics 31, 2877–2878. doi: 10.1093/bioinformatics/btv271
Giardine, B., Riemer, C., Hardison, R. C., Burhans, R., Elnitski, L., Shah, P., et al. (2005). Galaxy: a platform for interactive large-scale genome analysis. Genome Res. 15, 1451–1455. doi: 10.1101/gr.4086505
Goecks, J., Nekrutenko, A., Taylor, J., and Galaxy, T. (2010). Galaxy: a comprehensive approach for supporting accessible, reproducible, and transparent computational research in the life sciences. Genome Biol. 11:R86. doi: 10.1186/gb-2010-11-8-r86
Griffin, P. M., and Tauxe, R. V. (1991). The epidemiology of infections caused by Escherichia coli O157:H7, other enterohemorrhagic E. coli, and the associated hemolytic uremic syndrome. Epidemiol. Rev. 13, 60–98.
Hernandez, D., Francois, P., Farinelli, L., Osteras, M., and Schrenzel, J. (2008). De novo bacterial genome sequencing: millions of very short reads assembled on a desktop computer. Genome Res. 18, 802–809. doi: 10.1101/gr.072033.107
Ho, T. D., Davis, B. M., Ritchie, J. M., and Waldor, M. K. (2008). Type 2 secretion promotes enterohemorrhagic Escherichia coli adherence and intestinal colonization. Infect. Immun. 76, 1858–1865. doi: 10.1128/IAI.01688-07
Holmes, A., Allison, L., Ward, M., Dallman, T. J., Clark, R., Fawkes, A., et al. (2015). Utility of whole-genome sequencing of Escherichia coli O157 for outbreak detection and epidemiological surveillance. J. Clin. Microbiol. 53, 3565–3573. doi: 10.1128/JCM.01066-15
Imamovic, L., Tozzoli, R., Michelacci, V., Minelli, F., Marziano, M. L., Caprioli, A., et al. (2010). OI-57, a genomic island of Escherichia coli O157, is present in other seropathotypes of Shiga toxin-producing E. coli associated with severe human disease. Infect. Immun. 78, 4697–4704. doi: 10.1128/IAI.00512-10
Ito, K., Iida, M., Yamazaki, M., Moriya, K., Moroishi, S., Yatsuyanagi, J., et al. (2007). Intimin types determined by heteroduplex mobility assay of intimin gene (eae)-positive Escherichia coli strains. J. Clin. Microbiol. 45, 1038–1041. doi: 10.1128/JCM.01103-06
Jenkins, C., Dallman, T. J., Launders, N., Willis, C., Byrne, L., Jorgensen, F., et al. (2015). Public health investigation of two outbreaks of shiga toxin-producing Escherichia coli O157 associated with consumption of watercress. Appl. Environ. Microbiol. 81, 3946–3952. doi: 10.1128/AEM.04188-14
Joensen, K. G., Scheutz, F., Lund, O., Hasman, H., Kaas, R. S., Nielsen, E. M., et al. (2014). Real-time whole-genome sequencing for routine typing, surveillance, and outbreak detection of verotoxigenic Escherichia coli. J. Clin. Microbiol. 52, 1501–1510. doi: 10.1128/JCM.03617-13
Karmali, M. A., Mascarenhas, M., Shen, S., Ziebell, K., Johnson, S., Reid-Smith, R., et al. (2003). Association of genomic O island 122 of Escherichia coli EDL 933 with verocytotoxin-producing Escherichia coli seropathotypes that are linked to epidemic and/or serious disease. J. Clin. Microbiol. 41, 4930–4940. doi: 10.1128/JCM.41.11.4930-4940.2003
Kuroda, M., Serizawa, M., Okutani, A., Sekizuka, T., Banno, S., and Inoue, S. (2010). Genome-wide single nucleotide polymorphism typing method for identification of Bacillus anthracis species and strains among B. cereus group species. J. Clin. Microbiol. 48, 2821–2829. doi: 10.1128/JCM.00137-10
Madic, J., Peytavin de Garam, C., Vingadassalon, N., Oswald, E., Fach, P., Jamet, E., et al. (2010). Simplex and multiplex real-time PCR assays for the detection of flagellar (H-antigen) fliC alleles and intimin (eae) variants associated with enterohaemorrhagic Escherichia coli (EHEC) serotypes O26:H11, O103:H2, O111:H8, O145:H28 and O157:H7. J. Appl. Microbiol. 109, 1696–1705. doi: 10.1111/j.1365-2672.2010.04798.x
Maiden, M. C., Bygraves, J. A., Feil, E., Morelli, G., Russell, J. E., Urwin, R., et al. (1998). Multilocus sequence typing: a portable approach to the identification of clones within populations of pathogenic microorganisms. Proc. Natl. Acad. Sci. U.S.A. 95, 3140–3145. doi: 10.1073/pnas.95.6.3140
McDaniel, T. K., and Kaper, J. B. (1997). A cloned pathogenicity island from enteropathogenic Escherichia coli confers the attaching and effacing phenotype on E. coli K-12. Mol. Microbiol. 23, 399–407. doi: 10.1046/j.1365-2958.1997.2311591.x
Michelacci, V., Grande, L., Tozzoli, R., Maugliani, A., Caprioli, A., and Morabito, S. (2014). Identification of two allelic variants of toxB gene and investigation of their distribution among Verocytotoxin-producing Escherichia coli. Int. J. Med. Microbiol. 304, 730–734. doi: 10.1016/j.ijmm.2014.05.009
Michelacci, V., Tozzoli, R., Caprioli, A., Martinez, R., Scheutz, F., Grande, L., et al. (2013). A new pathogenicity island carrying an allelic variant of the Subtilase cytotoxin is common among Shiga toxin producing Escherichia coli of human and ovine origin. Clin. Microbiol. Infect. 19, E149–E156. doi: 10.1111/1469-0691.12122
Morabito, S., Tozzoli, R., Oswald, E., and Caprioli, A. (2003). A mosaic pathogenicity island made up of the locus of enterocyte effacement and a pathogenicity island of Escherichia coli O157:H7 is frequently present in attaching and effacing E. coli. Infect. Immun. 71, 3343–3348. doi: 10.1128/IAI.71.6.3343-3348.2003
Nataro, J. P., and Kaper, J. B. (1998). Diarrheagenic Escherichia coli. Clin. Microbiol. Rev. 11, 142–201.
O'Brien, A. D., Newland, J. W., Miller, S. F., Holmes, R. K., Smith, H. W., and Formal, S. B. (1984). Shiga-like toxin-converting phages from Escherichia coli strains that cause hemorrhagic colitis or infantile diarrhea. Science 226, 694–696. doi: 10.1126/science.6387911
Oswald, E., Schmidt, H., Morabito, S., Karch, H., Marches, O., and Caprioli, A. (2000). Typing of intimin genes in human and animal enterohemorrhagic and enteropathogenic Escherichia coli: characterization of a new intimin variant. Infect. Immun. 68, 64–71. doi: 10.1128/IAI.68.1.64-71.2000
Paton, A. W., Srimanote, P., Woodrow, M. C., and Paton, J. C. (2001). Characterization of Saa, a novel autoagglutinating adhesin produced by locus of enterocyte effacement-negative Shiga-toxigenic Escherichia coli strains that are virulent for humans. Infect. Immun. 69, 6999–7009. doi: 10.1128/IAI.69.11.6999-7009.2001
Perelle, S., Dilasser, F., Grout, J., and Fach, P. (2004). Detection by 5′-nuclease PCR of Shiga-toxin producing Escherichia coli O26, O55, O91, O103, O111, O113, O145 and O157:H7, associated with the world's most frequent clinical cases. Mol. Cell. Probes 18, 185–192. doi: 10.1016/j.mcp.2003.12.004
Persson, S., Olsen, K. E., Ethelberg, S., and Scheutz, F. (2007). Subtyping method for Escherichia coli shiga toxin (verocytotoxin) 2 variants and correlations to clinical manifestations. J. Clin. Microbiol. 45, 2020–2024. doi: 10.1128/JCM.02591-06
Rice, P., Longden, I., and Bleasby, A. (2000). EMBOSS: the European molecular biology open software suite. Trends Genet. 16, 276–277. doi: 10.1016/S0168-9525(00)02024-2
RTeam, C. (2014). R: A Language and Environment for Statistical Computing [Online]. Available online at: http://www.R-project.org/
Scheutz, F., Teel, L. D., Beutin, L., Pierard, D., Buvens, G., Karch, H., et al. (2012). Multicenter evaluation of a sequence-based protocol for subtyping Shiga toxins and standardizing Stx nomenclature. J. Clin. Microbiol. 50, 2951–2963. doi: 10.1128/JCM.00860-12
Selander, R. K., Caugant, D. A., Ochman, H., Musser, J. M., Gilmour, M. N., and Whittam, T. S. (1986). Methods of multilocus enzyme electrophoresis for bacterial population genetics and systematics. Appl. Environ. Microbiol. 51, 873–884.
Selander, R. K., and Levin, B. R. (1980). Genetic diversity and structure in Escherichia coli populations. Science 210, 545–547. doi: 10.1126/science.6999623
Stover, B. C., and Muller, K. F. (2010). TreeGraph 2: combining and visualizing evidence from different phylogenetic analyses. BMC Bioinformatics 11:7. doi: 10.1186/1471-2105-11-7
Swaminathan, B., Barrett, T. J., Hunter, S. B., Tauxe, R. V., and CDC PulseNet Task Force (2001). PulseNet: the molecular subtyping network for foodborne bacterial disease surveillance, United States. Emerg. Infect. Dis. 7, 382–389. doi: 10.3201/eid0703.017303
Tarr, C. L., Large, T. M., Moeller, C. L., Lacher, D. W., Tarr, P. I., Acheson, D. W., et al. (2002). Molecular characterization of a serotype O121:H19 clone, a distinct Shiga toxin-producing clone of pathogenic Escherichia coli. Infect. Immun. 70, 6853–6859. doi: 10.1128/IAI.70.12.6853-6859.2002
Tozzoli, R., Caprioli, A., Cappannella, S., Michelacci, V., Marziano, M. L., and Morabito, S. (2010). Production of the subtilase AB5 cytotoxin by Shiga toxin-negative Escherichia coli. J. Clin. Microbiol. 48, 178–183. doi: 10.1128/JCM.01648-09
Vogler, A. J., Chan, F., Wagner, D. M., Roumagnac, P., Lee, J., Nera, R., et al. (2011). Phylogeography and molecular epidemiology of Yersinia pestis in Madagascar. PLoS Negl. Trop. Dis. 5:e1319. doi: 10.1371/journal.pntd.0001319
Keywords: accessory genome, allelic variants, STEC subtyping, phylogenesis, bioinformatics
Citation: Michelacci V, Orsini M, Knijn A, Delannoy S, Fach P, Caprioli A and Morabito S (2016) Development of a High Resolution Virulence Allelic Profiling (HReVAP) Approach Based on the Accessory Genome of Escherichia coli to Characterize Shiga-Toxin Producing E. coli (STEC). Front. Microbiol. 7:202. doi: 10.3389/fmicb.2016.00202
Received: 26 November 2015; Accepted: 05 February 2016;
Published: 23 February 2016.
Edited by:
Pina Fratamico, United States Department of Agriculture-Agricultural Research Service, USAReviewed by:
James L. Bono, United State Department of Agriculture- Agricultural Research Service, USAErin R. Reichenberger, United States Department of Agriculture, USA
Copyright © 2016 Michelacci, Orsini, Knijn, Delannoy, Fach, Caprioli and Morabito. This is an open-access article distributed under the terms of the Creative Commons Attribution License (CC BY). The use, distribution or reproduction in other forums is permitted, provided the original author(s) or licensor are credited and that the original publication in this journal is cited, in accordance with accepted academic practice. No use, distribution or reproduction is permitted which does not comply with these terms.
*Correspondence: Valeria Michelacci, valeria.michelacci@iss.it