 Bingxuan Liu
 Haiquan Liu
 Yingjie Pan1,2,3
 Yong Zhao
- 1College of Food Science and Technology, Shanghai Ocean University, Shanghai, China
- 2Laboratory of Quality and Safety Risk Assessment for Aquatic Products on Storage and Preservation, Ministry of Agriculture, Shanghai, China
- 3Shanghai Engineering Research Center of Aquatic-Product Processing and Preservation, Shanghai, China
Microbial growth variability plays an important role on food safety risk assessment. In this study, the growth kinetic characteristics corresponding to maximum specific growth rate (μmax) of 50 V. parahaemolyticus isolates from different sources and genotypes were evaluated at different temperatures (10, 20, 30, and 37°C) and salinity (0.5, 3, 5, 7, and 9%) using the automated turbidimetric system Bioscreen C. The results demonstrated that strain growth variability increased as the growth conditions became more stressful both in terms of temperature and salinity. The coefficient of variation (CV) of μmax for temperature was larger than that for salinity, indicating that the impact of temperature on strain growth variability was greater than that of salinity. The strains isolated from freshwater aquatic products had more conspicuous growth variations than those from seawater. Moreover, the strains with tlh+/tdh+/trh− exhibited higher growth variability than tlh+/tdh−/trh− or tlh+/tdh−/trh+, revealing that gene heterogeneity might have possible relations with the growth variability. This research illustrates that the growth environments, strain sources as well as genotypes have impacts on strain growth variability of V. parahaemolyticus, which can be helpful for incorporating strain variability in predictive microbiology and microbial risk assessment.
Introduction
Vibrio parahaemolyticus is a kind of halophytic, Gram-negative bacterium that can cause headaches, diarrhea, fever, gastroenteritis, and even life-threatening sepsis (Makino et al., 2003). Since the first V. parahaemolyticus was isolated in Japan by Fujino Komiro in 1950 (Fujino et al., 1950), it has been considered as the major food-borne pathogen involving in bacterial seafood poisoning incidents in Asia (Fujikawa et al., 2009). According to annual statistics obtained from the detection network of microbial foodborne illness in China, V. parahaemolyticus has been classified as the major foodborne pathogen (accounting for 65% of the total; Wu et al., 2014). Similarly, cases of foodborne illness caused by V. parahaemolyticus are common in Europe and the United States (Yang et al., 2008; Shen et al., 2009, 2010). In fact, the largest outbreak of V. parahaemolyticus gastroenteritis all over the world did occur in the United States in 1978 and caused up to 1133 cases (Daniels et al., 2000). As demonstrated by recent surveillance data (Ma et al., 2014; Tang et al., 2014), the control of V. parahaemolyticus continues to be challenging worldwide.
It was announced that the strain variability gave the importance as well as the difficulty in controlling V. parahaemolyticus in the previous research (Lianou and Koutsoumanis, 2011). Owing to the fact that V. parahaemolyticus is mainly distributed in estuaries, coastal waters, sediments, and aquatic products (such as shrimp, cod, mackerel, and shellfish), it has become the major sources of food-borne pathogen (Wu et al., 2014). Since multiple strain composites of foodborne pathogens with robust growth or inactivation characteristics are preferred in food safety researches that aimed at assessing the behavior of bacterial pathogens in food products (NACMCF (National Advisory Committee on Microbiological Criteria for Foods), 2005; Scott et al., 2005), the characterizations of a variety of strains with respect to phenotypic responses, such as the growth behavior under different environmental conditions, should be analyzed (Nishina et al., 2004). Additionally, V. parahaemolyticus strains in the environment exhibit a halophilic and seasonal distribution, which are directly related to the salinity and temperature (DePaola et al., 2003; Zimmerman et al., 2007; Johnson et al., 2010; Sobrinho et al., 2014; Esteves et al., 2015). For the purpose of evaluation, the quantitative microbial risk assessment (QMRA) of V. parahaemolyticus should be estimated by at least two factors: temperature (T) and salinity (sodium chloride) (Nauta, 2002; U.S. Food and Drug Administration, 2005). It means that the use of predictive models of growth variability is mainly associated with the T-value and sodium chloride (NaCl) concentration (Ratkowsky et al., 1982; Larsen et al., 2015).
In previous studies of V. parahaemolyticus, only a few of them investigated the relationship between growth environments and strain variability (Fujikawa et al., 2009; Larsen et al., 2015). In west countries such as the USA, aquatic animals are mostly cultured in seawater (Depaola et al., 1990); however, in China, a majority of aquatic farmers practice freshwater aquaculture (Wu et al., 2014). It has been determined that the differences of the source for V. parahaemolyticus strains result in a large amount of diversity in the predictive models of growth variability (McMeekin et al., 1993). Furthermore, most previous research findings of the strain variability of the growth kinetic behavior of foodborne pathogens are based on marine culture (Wong et al., 2000; Alam et al., 2002; Larsen et al., 2015), which would be discrepant from China's actual conditions. Thus, new models with the purpose of developing a safe food production process in China should be built. Moreover, further studies on the influence of gene heterogeneity on growth variability were even less (Lianou and Koutsoumanis, 2013; Lopez-Joven et al., 2015), while as mentioned in Martins and Locke (2015), gene heterogeneity could determine phenotypic heterogeneity including strain growth variability, and therefore this variability might reflect the gene heterogeneity as well.
As the growth variability can introduce the food safety risk, the quantification of the growth variability can better service to the QMRA in microbiology. Aiming at furthering the development of precautionary food safety against V. parahaemolyticus in China, the influences of the T value and NaCl, together with strain sources and genotypes on the growth variability were evaluated in this research. The obtained appropriate data of the growth variability for V. parahaemolyticus could be useful for better characterizing the kinetic behaviors of V. parahaemolyticus in different growth environments (Miles et al., 1997; Yang et al., 2009). In total, 9000 optical density (OD) curves with 50 isolates of V. parahaemolyticus from different sources were generated for four levels temperatures and five levels NaCl concentrations, which will accomplish the following: (1) determine the influences of temperature and salinity on growth variability, and discuss the comparison between this two environmental factors; (2) reveal the growth variability of strains isolated from the aquatic products in freshwater and seawater; (3) demonstrate the effects of gene heterogeneity on the growth variability; and (4) provide a reasonable environmental condition for the storage of preserved food against V. parahaemolyticus.
Materials and Methods
V. parahaemolyticus Strains
Fifty strains of V. parahaemolyticus were isolated from the shrimps which were cultured in freshwater or seawater. The strain information was shown in Table 1. tlh+/tdh+/trh−, tlh+/tdh−/trh+, and tlh+/tdh−/trh− genes were used for distinguishing the genotype of the isolates (Bej et al., 1999; Okada et al., 2009), twelve V. parahaemolyticus strains were tlh+/tdh+/trh− genotype, eleven V. parahaemolyticus strains were tlh+/tdh−/trh+ genotype, one strain (42) was tlh+/tdh+/trh+ genotype and others were tlh+/tdh−/trh− genotype in Table 1. All the strains in the present study were stored frozen (−80°C) in 25% glycerol test tubes. The V. parahaemolyticus strains were first dispensed onto thiosulfate-citrate-bile salts-sucrose agar culture medium (TCBS; Beijing Land Bridge Technology Company Ltd., Beijing, China) plates, and cultured for 18–24 h at 37°C. The single green strain on TCBS plates was then transferred into 10 ml tryptic soy broth (TSB; Beijing Land Bridge Technology Company Ltd., Beijing, China) with pH 8.0 and 3.0% (w/w) NaCl concentration. The 18 h cultures were incubated at 37°C for the preparation of the test inocula. The initial strain concentrations of the inocula were about 109 CFU/ml after incubation. The automated turbidimetric system Bioscreen C (Oy Growth Curves Ab Ltd., Raisio, Finland) was used for testing the corresponding Optical density (OD) values. OD measurements were taken at regular time intervals using the wideband filter (420–580 nm) of the instrument, for a total time period such that a considerable OD change was observed.
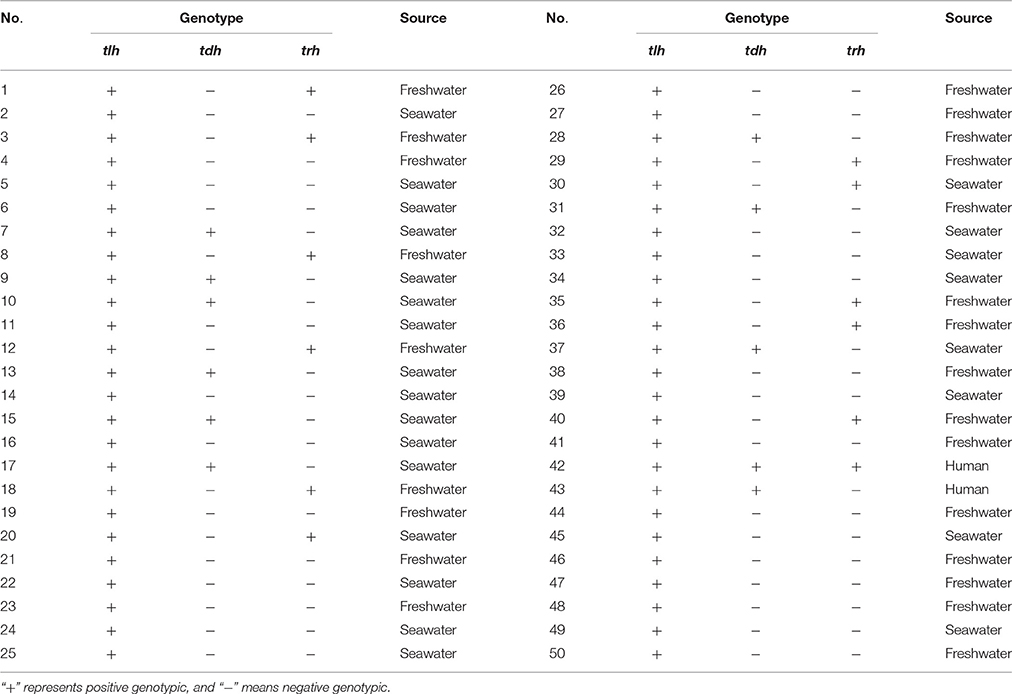
Table 1. The sources of the 50 strains of V. parahaemolyticus from the shrimps.
Growth Experiments
To evaluate the single effect of the T value or NaCl concentration on the growth variability in terms of the two environmental factors, a total of 20 different growth conditions were assessed with 4-levels (10, 20, 30, and 37°C) of temperature and 5-levels (0.5, 3, 5, 7, and 9%) of NaCl concentrations so as to cover the most probable growth region of the V. parahaemolyticus strains. The maximum and minimum boundaries of the T value (37 and 10°C, respectively) and the NaCl concentration (9 and 0.5%, respectively) were set up based on the findings of preliminary experiments in which the growth environment approximately reached the minimum growth requirements (V. parahaemolyticus strains approached the minimum growth rate in the condition of 10°C and 9% salinity) or the maximum growth requirements (V. parahaemolyticus strains attained the maximum growth rate in an optimum environment with 37°C and 3% salinity condition). The prepared initial inocula of each strain were decimally diluted in the TSB with 5 levels of NaCl concentration separately for five times. With strain concentration of approximately 104 CFU/ml, the inoculated TSB were transferred into 100-well microtiter plates, which were then placed in the automated turbidimetric system Bioscreen C for 4 levels of temperatures, respectively. Totally three OD measurement replicates were tested in this process. Additionally, three independent experiments were conducted at each growth condition and therefore there were three samples per strain altogether for testing. In such a way, the total number of the described OD curves would amount to 9000 patterns (3 replicates × 3 independent experiments × 20 growth conditions × 50 types of V. parahaemolyticus). The counted data were analyzed in order to achieve an accurate approximation of the V. parahaemolyticus growth states in different cultured environments. Moreover, it would be more reasonable for the V. parahaemolyticus strain evaluation of QMRA (Vose, 1998).
Maximum Specific Growth Rate
The maximum specific growth rate (μmax) (Dalgaard and Koutsoumanis, 2001) of each strain at each growth condition was estimated according to Mytilinaios et al. (2012). By using the decimal dilution approach with Bioscreen C, the novel calculation of the maximum growth rate in the unit of OD*h−1 can be formulated in the model of Modified Gompertz (Gibson et al., 1987; Zwietering et al., 1990; Gil et al., 2006; Juneja et al., 2007; Yoon et al., 2008), with a little regulation, as the following equation:
Where A means the initial amount of bacteria, C represents the difference between the initial amount and the maximum amount of bacteria, μm represents maximum specific growth rate and λ is the lag time of the strain growth.
To calculate the maximum growth rate, the obtained data with both OD values and cultured times were taken into the above equation in the place of y and t, respectively. The OD curves were then fitted and the matrix of function was calculated including A, C, λ, and μm.
Statistical Analysis
The statistical indicators were used to compare the performance of the models: correlation coefficients (R2), the p values from the Fisher F-test, and root mean square error (RMSE), accuracy factor (Af), and bias factor (Bf), whose mathematical expressions are as follows:
where obs is observed values, pred is predicted values by models, mean is average values, and the n stands for the number of observations. The RMSE values approaching zero indicate a closer fit with the data for the model (Zhang et al., 2015). Af provides the accuracy of the model, which reflects how close the predicted values are to the observed values, while Bf indicates the mean difference between observed and predicted value. Ideally, predictive models would have Af = Bf = 1 (Wang et al., 2014).
The coefficient of variation (CV) of μmax in different conditions were calculated within the formula as
Significance testing making use of p-values was applied to verify the differences of the strain growth rate in different sources. Values differences were compared using the least significant difference (LSD) method at p = 0.05.Statistical analysis was performed using SPSS statistical package17.0 (SPSS Inc., Chicago, IL).
Results
Tendency of Maximum Growth Rates
The estimated maximum specific growth rate μmax vs. 50 strains in various growth environments were calculated are presented in Supplementary Material, and almost all of the values were fitted in the equation given above. By statistical analysis, all the correlation coefficients achieved above 93%, and all RMSE values approached zero. Both accuracy factors and bias factors got close to 1. The results showed a satisfactory goodness-of-fit in this study. A fraction of the maximal growth rate values could not yet be evaluated by Modified Gompertz model (Lammerding, 1997; Anderson and Hattis, 1999; Nauta and Dufrenne, 1999). It should be pointed out that the equation still cannot afford the actual growth state (Li et al., 2007), which requires the construction of a microbial macro growth model in multi-parameters.
Based on the μmax in Supplementary Material, the tendency chats in various growth environments are shown in Figure 1. As shown in Figure 1A for the T of 37°C, the mean value of μmax (OD*h−1) ranged from 0.03 to 0.24 in the condition of 0.5% NaCl, from 0.02 to 0.44 at 3% NaCl, from 0.01 to 0.26 at 5% NaCl, from 0 to 0.15 at 7% NaCl, and from 0 to 0.12 at 9% NaCl among the 50 strains. While with the same NaCl concentration of 3% in the TSB, the mean μmax (OD*h−1) ranged from 0.02 to 0.44 at 37°C, from 0.005 to 0.065 at 30 °C, from 0.007 to 0.031 at 20°C, and from 0.001 to 0.014 at 10°C. Obviously, the average growth rate in the condition of 37°C and 3% NaCl concentration was found to be the largest (Figure 1B). Therefore, 37°C and 3% NaCl were considered as the optimal growth temperature and salinity respectively, similarly 10°C and 9% NaCl were considered as the most non-optimal temperature and salinity in this research.
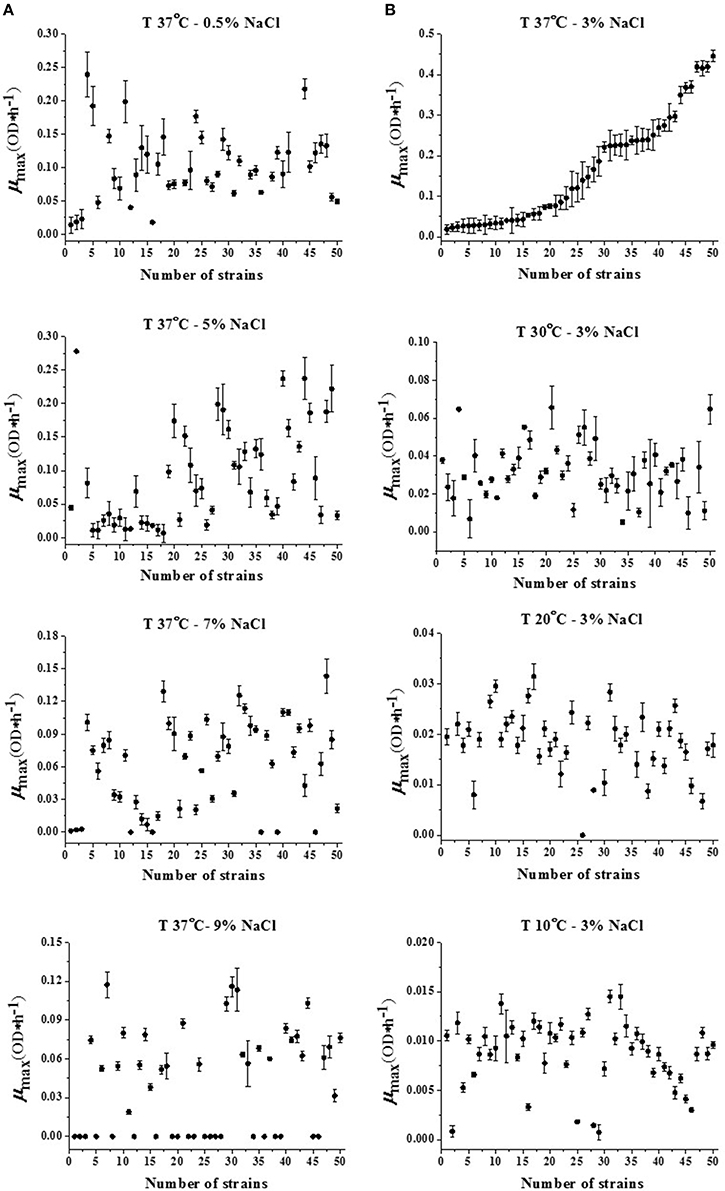
Figure 1. Maximum specific growth rates (μmax) of 50 V. parahaemolyticus strains in different (A) NaCl concentrations (37°C) and (B) T values (3% NaCl).
Evaluation of Growth Variability in Different Temperatures and Salinities
The optimal growth condition at 37°C with 3% NaCl concentration was used as the reference in Figure 1. In this case, the strains from No. 1 to No. 50 tended to be staged growth with an increasing maximum specific growth rate μmax. While in other conditions, the strains from No. 1 to No. 50 seemed to grow randomly with no fixed growth trend as compared with that of the optimal growth condition. For example, the strains No. 50 and No. 1 at 37°C with 3% NaCl salinity had the highest growth rate and the lowest growth rate respectively, but in the condition at 20°C with 3% NaCl salinity, the No. 50 and No. 1 both located in the intermediate range of μmax in all 50 strains, nearly 0.02 OD*h−1. Similar situations also appeared in other strains like No. 2, No. 13, No. 28 strains at 37°C with 5% NaCl salinity compared with those at 10°C with 3% NaCl concentration.
The curves related to the coefficient of variation (CV) of μmax in different conditions were drawn in Figure 2. The CV value of maximum growth rate represented the growth variability for V. parahaemolyticus strains. The CV value among the tested strains at 37°C-3% NaCl concentration was 12.7%, while at 37°C-0.5% NaCl concentration and T 37°C-5% NaCl concentration, it was 13.0 and 15.1%, respectively (Figure 2A). The CV value among the tested strains corresponding to a mean μmax of approximately 0.16 OD*h−1 was 12.7% for 37°C-3% NaCl concentration, while corresponding to a mean μmax of approximately 0.03 OD*h−1, the CV value was 16.3% for 30°C-3% NaCl concentration in Figure 2B. The non-optimal T and NaCl concentration led to an increase of CV values in the activation range of 0–5% NaCl and 30–37°C. On the contrary, in the inactivation range of V. parahaemolyticus strains, since the maximum growth rate dropped to nearly 0 OD*h−1, the CV values of μmax would similarly drop down, with less variance of growth variability in V. parahaemolyticus strains as shown in the points among the 7–9% NaCl concentration and 10–20°C.
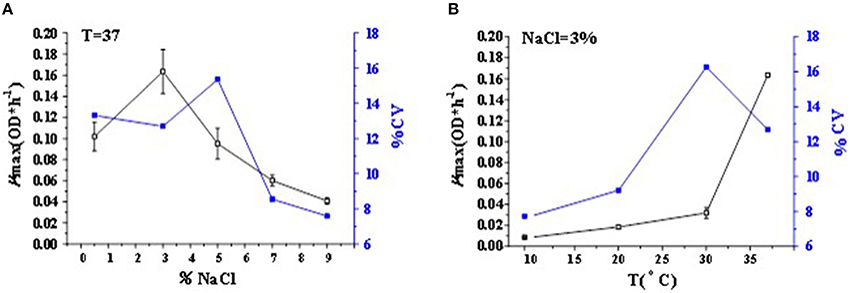
Figure 2. Mean value curve of maximum specific growth rates (μmax) and coefficient of variation curve of μmax among strains (CV-Strain) in different (A) NaCl concentrations and (B) T-values of V. parahaemolyticus.
Comparison of Growth Variability from Different Sources
From the different types of environmental sources in Table 1, the V. parahaemolyticus strains could be roughly divided into two categories: freshwater and seawater. The significant difference analyses between these two categories in four environmental conditions (37°C-3% NaCl, 30°C-3% NaCl, 37°C-9% NaCl, and 10°C-3% NaCl) with in the box plot method were respectively drawn in Figure 3. The 4 environmental conditions represented 4 typical growth kinetics of V. parahaemolyticus strains. These four box plots were counted by the mean of the maximum growth rate μmax in freshwater and seawater accordingly. In addition, the significant differences were calculated by p-value, with 0, 0.063, 0.001, and 0.024 respectively, which demonstrated the growth variability in these two sources. The non-significant difference occurred in the condition at 30°C-3% NaCl, and other conditions performed as the significant difference.
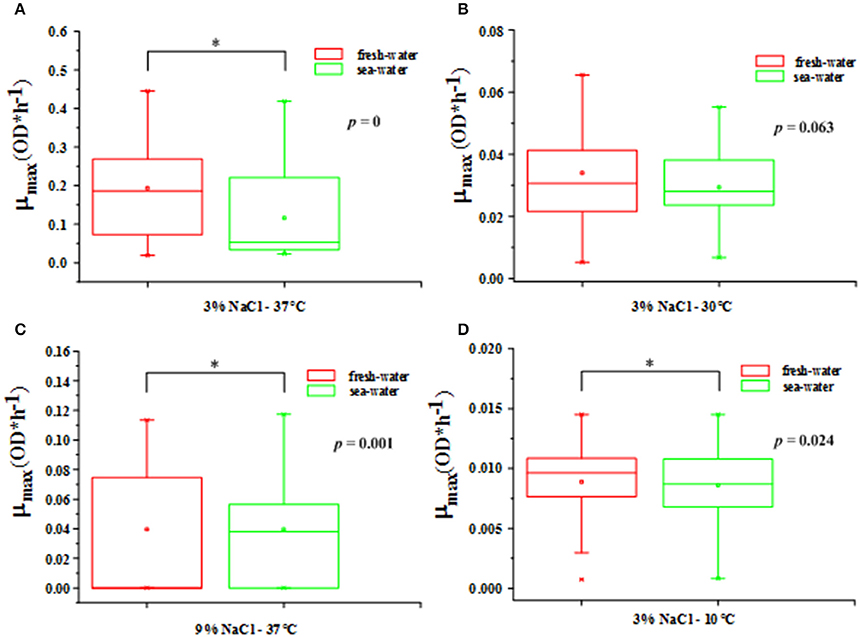
Figure 3. The box plot between freshwater and seawater for V. parahaemolyticus strains in the shrimps in the following growth conditions. (A) 37°C-3% NaCl concentration with p = 0 (optimal growth temperature and salinity), (B) 30°C-3% NaCl concentration with p = 0.063 (μmax most consistent), (C) 37°C-9% NaCl concentration with p = 0.001 (optimal growth temperature and most non-optimal growth salinity), and (D) 10°C-3% NaCl concentration with p = 0.024 (most non-optimal growth temperature and optimal growth salinity). Statistical significance (p < 0.05) is shown by *.
Influence of Genotypes on Growth Variability
Further investigation of the growth variability of V. parahaemolyticus strains was studied through gene heterogeneity. For the purpose of research on the effect of genotypes on growth variability, all 50 strains were classified by growth condition and genotype. Based on each genotype with different virulence factors of V. parahaemolyticus strains (Letchumanan et al., 2014), four groups of virulence genes-related V. parahaemolyticus strains, tlh+/tdh−/trh−, tlh+/tdh+/trh−, tlh+/tdh−/trh+, and tlh+/tdh+/trh+, were introduced in this research in order to explore the internal causes of the growth variability of V. parahaemolyticus. Among these virulence genes, tlh has been expressed by all clinical and environmental strains of V. parahaemolyticus in previous studies (Bej et al., 1999; Okada et al., 2009); thus, the tlh virulence gene was contained in all four groups of isolates. The inter-specific variability of four genotype factors in the environmental factors of T and NaCl concentration is given in Figure 4. In Figure 4A, the temperature was fixed at the optimal condition of 37°C, and the genotype tlh+/tdh+/trh− (colored in red) embodied the largest strain growth variability. The associated CV values were set at a high level compared with 3 other genotypes. In contrast, the tlh+/tdh+/trh+ genotype had the lowest CV values overall. Similar circumstances appeared in Figure 4B with the NaCl concentration set at 3% as well. The growth variability of tlh+/tdh−/trh+ (colored in green) and tlh+/tdh−/trh− (colored in blue) performed moderate, overtopping the CV values only in the condition at 30°C and 3% NaCl concentration.
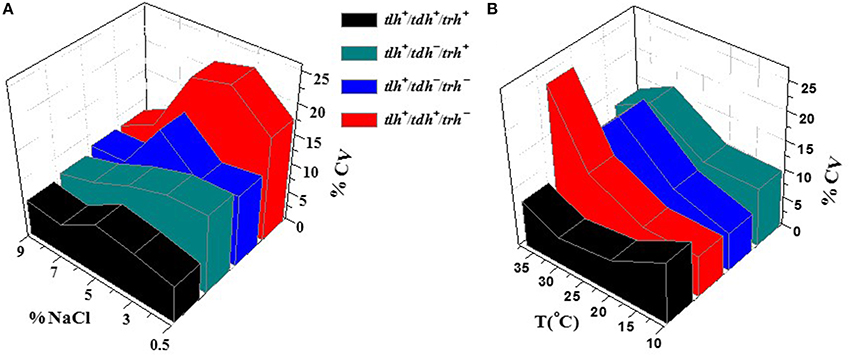
Figure 4. The influence of the genotype on the growth variability of V. parahaemolyticus strains in various conditions. (A) various NaCl concentrations with a fixed T value of 37°C and (B) various temperatures with a fixed NaCl concentration of 3%.
Discussion
Effects of Temperature and NaCl Concentration on μmax
It has been reported that the V. parahaemolyticus strains cannot grow at low temperature in nature since there is growth inhibition for V. parahaemolyticus strains with T-values below 10°C in freshwater or seawater (Cook and Ruple, 1989; Burnham et al., 2009). Regarding growth rate, the conditions at the lowest temperature (i.e., 10°C) and the highest NaCl concentration (i.e., 9%) almost approached the minimum growth requirements of this pathogen (Fujikawa et al., 2009). In contrast among all of the conditions, it is obvious that the growth condition of 37°C and 3% NaCl concentration is considered to be the optimal growth condition with the widest range and maximum mean value of specific growth rate compared to the other combinations (Figure 1), which has already been verified the similar completion in accordance with its own growth habits and laboratory experiments (Miles et al., 1997; Liu et al., 2008; Yang et al., 2009; Baker-Austin et al., 2010; Fernandez-Piquer et al., 2011). In this study, however, a much wider range of growth conditions in discussing both temperature and salinity simultaneously will give more comprehensive testimony for understanding the variability of the V. parahaemolyticus kinetic behavior within the scope of the growth environments.
It seemed that the inter-species growth variability of the 50 strains occurred at different environmental conditions. The trend of maximum growth rate in various conditions indicates that the external environment, such as the temperature and salinity, can affect the growth variability among V. parahaemolyticus strains, and such inter-species growth variability performs randomly (Whiting and Golden, 2002).
Moreover, because of incomplete knowledge of the effects of environmental conditions on model parameters in current microbiological studies (Nauta, 2002), the quantitative information based on a single impact parameter, like only the T-value or the NaCl concentration, needs to be evaluated separately in order to analyze the strain variability of V. parahaemolyticus (Fujikawa et al., 2009). Since there are no methods for separating two impact parameters absolutely, the mutual comparison between the one most non-optimal factor (T-value or NaCl concentration in this study) and the other factor in the optimal condition that emerged by the quantitative data is used here for approaching the actual microbial growth model (Lindqvist, 2006). As can be seen in the growth condition of 37°C-9% NaCl concentration, nearly half of the strains were inactive in such an inappropriate growth environment for V. parahaemolyticus, and it seemed that the rest of the strains still “struggled” in a random range of growth rate, mostly from 0.12 to 0, with a mean μmax value of about 0.06; In another extreme condition with the most non-optimal temperature case while the optimal salinity: 10°C-3% NaCl concentration, although there were few inactive strains, the mean value of the growth rate μmax could just achieve 0.01 or below, and μmax ranged at a smaller scale from 0.015 to 0. The difference indicates that although the temperature and salinity have the same net effect on strain variability, meaning that the μmax variability among the strains increases as the T-values or NaCl concentrations become more unfavorable for V. parahaemolyticus growth, the extent for this growth variability appears to be different for these two environmental parameters (Nauta, 2000). It is illustrated that as one of the two main impact parameters, the influence of low temperature on the decrease of μmax appears to be greater than that of high NaCl concentration in Figure 1.
The analysis in Figure 1 could provide the formulations of temperature and salt which do not allow growth of V. parahaemolyticus. Normally, up to 9% NaCl concentration leads to inactivation for the majority of microorganisms (Francois et al., 2006); however, for halophilic bacteria like V. parahaemolyticus, such NaCl concentration cannot entirely prevent growth of bacteria (Anon, 1988; David et al., 1997). With a peak μmax value of 0.12 for strain No. 7, 30, and 31, it seemed that the strain growth rate was not suppressed. To avoid the growth of most pathogens, the other impact parameter, the temperature, plays an important role in the suppression of μmax. As it was revealed above in the data from 20°C or even 10°C conditions, the V. parahaemolyticus strains in a low temperature could be more easily inactivated with weaker growth behavior. This suggests that preserved foods in a salty environment should be stored in low temperatures below 10°C, which can aid in avoiding V. parahaemolyticus growth. The present study gives a convincing data basis for the instruction of manufacturing preserved foods.
Effects of Temperature and NaCl Concentration on Growth Variability
As reviewed by Nauta (2002), the assumption is often made by food microbiologists that strain-to-strain variation is equal to or smaller than experimental variation, thus it is not necessary to determine strain-to-strain variation. The data presented here demonstrated that the strain variability of the estimated μmax values increased as the growth conditions became more stressful both in terms of NaCl (Figure 2A) and T (Figure 2B). The phenomenon that the non-optimal growth condition has a greater strain variability of growth kinetics than the optimal condition has been pointed in previous studies (Barbosa et al., 1994; Begot et al., 1997; Lianou et al., 2006).
In Figure 2 with both two cases, the maximum CV value occurred at the environmental condition of 30°C and 3% NaCl concentration. It meant that the growth variability of 50 strains was larger than that in the optimal growth condition and any other conditions. Thus, the condition might introduce much difficulties for the control of food safety risk. Actually, this condition comes closest to the natural environment, leading to a big challenge for food safety control (Pouillot et al., 2003). Nevertheless, the V. parahaemolyticus strains in this condition had a relative high consistency with the medium-to-high maximum growth rate, it might therefore maintain a large variety of serotypes as much as possible, which would achieve a diversity of V. parahaemolyticus strains with a similar growth rate when incubated in the same TSB. It exerted favorable effect on strain selection in the growth environment of 30°C and 3% NaCl concentration. Besides, with the similar maximum growth rate of 0.04 in the condition of T 37°C-9% NaCl in Figure 2A and the condition of T 30°C-3% NaCl in Figure 2B, the CV values in the two cases were quite different, corresponding to 3 and 16.27%, respectively, which meant that the growth variability was larger for decreasing temperature than for increasing salinity. It again proves the fact that temperature variation always leads to a more gradual increase in the growth variability in V. parahaemolyticus strains than NaCl variation.
Impact of Different Sources on the Growth Variability
In Figure 3, the largest p-value for the difference between the freshwater and seawater occurred in the condition of 30°C and 3% NaCl, meaning this difference of μmax was not significant. Obviously, this environment condition is the common state found in nature, especially in the subtropical and temperate coastal areas, which means that the V. parahaemolyticus strains that are grown in freshwater and in seawater result in a similar growth rate with relatively consistent growth variability in the normal state found in nature (Larsen et al., 2015). Moreover, the 30°C-3% NaCl condition could aid in strain selection since the consistency of the growth variability from fresh and sea water was optimal in all of the tested conditions, which offered the largest variety of growth variability. In other words, the natural environment found in the coastal areas will lead to a large growth variability in the V. parahaemolyticus strains, which results in difficulties for the QMRA and food safety control (Pouillot et al., 2003), as discussed in Figure 2.
Another interesting point is that there was an extremely significant difference in the growth variability of the freshwater and seawater V. parahaemolyticus strains in the environmental condition of 37°C and 3% NaCl concentration. It has been evaluated that the V. parahaemolyticus strains reached the largest maximum growth rate in such an optimal growth condition in Figure 3. On the contrary, the difference in the NaCl concentration caused the freshwater strains (living in 0.1% salinity in nature) having a larger growth variability than the seawater strains (living in 3% salinity in nature), which resulted in a higher mean value of maximum growth rate with a larger distribution according to an evaluation of its standard deviation. It has been stated that strains in a non-optimal environment condition will have growth variability at a considerably higher level than those in the optimal growth condition, and larger environmental pressure will lead to larger growth variability. In addition, based on the comparison between the condition of 37°C-9% NaCl concentration and that of 10°C-3% NaCl concentration, it is confirmed that a decreasing temperature leads to a somewhat more gradual decrease of μmax than an increasing NaCl concentration does.
Influence of Different Genotypes on the Growth Variability
According to collected data from Table 1, since there was only one strain comprising tlh+/tdh+/trh+, it should have no typical representativeness for the properties of this genotype, while the curve in red gave some reference for the tendency of different genotypes in Figure 4. From the results, it was concluded that the genotype of the tlh+/tdh+/trh− resulted in the largest variation degree in the growth variability of the V. parahaemolyticus strains in all four groups, whereas the genotype with tlh+/tdh+/trh+ illustrated the least obvious variation degree from among those cultured in the environment condition with temperature and NaCl concentration, which verified that gene heterogeneity also affected the growth inter-specific variability for V. parahaemolyticus. Furthermore, as one of the major virulence genotypes in V. parahaemolyticus, tlh+/tdh+/trh− modeled the most non-optimal case in evaluating QMRA, due to there being a large risk of growth variability in reality. In addition, it is suggested that in the food safety control of clinical V. parahaemolyticus strains, more attention should be paid to the genotype of tlh+/tdh+/trh−, which is associated with serious virulence (Miyamoto et al., 1969; Honda and Iida, 1993; Baffone et al., 2005) and large growth variability in most of the environmental conditions. The research exploring the effect of gene heterogeneity on the grow variability in V. parahaemolyticus provides a useful reference for the prevention of pathogenic V. parahaemolyticus in nature.
Conclusion
In the present study, the growth kinetics characteristics of 50 V. parahaemolyticus isolates with different sources and genotypes were assessed at different temperatures (10, 20, 30, and 37°C) and salinity (0.5, 3, 7, and 9%). From the experimental results, it was concluded that the strain variability increased as the growth conditions became more stressful both in terms of temperature and salinity in the activation range, and temperature has larger impacts than salinity on strain growth variability. Therefore, the preserved foods in a salty environment were suggested to be stored in a low temperature below 10°C, which could promise the inactivation of V. parahaemolyticus strains. Moreover, the results showed the fact that the strains isolated from freshwater aquatic product had more conspicuous variations than those from seawater. And it was interpreted that gene heterogeneity also affected strain growth variability of V. parahaemolyticus. The findings of this study should be useful in incorporating strain variability in predictive microbiology and microbial risk assessment, and could provide scientific guidance for V. parahaemolyticus verification and prevention in nature as well as strain selection in experiments.
Author Contributions
BL performed the data analyses and wrote the manuscript; contributed significantly to analysis and manuscript preparation; HL helped perform the analysis with constructive discussions; Substantial contributions to the design of the work and analysis the results. YP, JX drafted the work or revising it critically for important intellectual content. Agreement to be accountable for all aspects of the work in ensuring that questions related to the accuracy or integrity of any part of the work are appropriately investigated and resolved. YZ contributed to the conception of the study. Drafting the work or revising it critically for important intellectual content. Final approval of the version to be published.
Funding
This research was supported by the National Natural Science Foundation of China (31271870, 31571917), the project of Science and Technology Commission of Shanghai Municipality (14DZ1205100, 14320502100), Key Project of Shanghai Agriculture Prosperity through Science and Technology (2014, 3-5 and 2015, 4-8), Shanghai Engineering Research Center of Aquatic-Product Processing & Preservation (11DZ2280300), and the “Dawn” Program of Shanghai Education Commission (15SG48).
Conflict of Interest Statement
The authors declare that the research was conducted in the absence of any commercial or financial relationships that could be construed as a potential conflict of interest.
Supplementary Material
The Supplementary Material for this article can be found online at: http://journal.frontiersin.org/article/10.3389/fmicb.2016.00994
References
Alam, M. J., Tomochika, K. I., Miyoshi, S. I., and Shinoda, S. (2002). Environmental investigation of potentially pathogenic Vibrio parahaemolyticus in the Seto-Inland Sea, Japan. FEMS Microbiol. Lett. 208, 83–87. doi: 10.1111/j.1574-6968.2002.tb11064.x
Anderson, E. L., and Hattis, D. (1999). Uncertainty and variability. Risk Anal. 19, 47–49. doi: 10.1111/j.1539-6924.1999.tb00386.x
Anon (1988). “Dried and smoked fishery products: preparation and composition,” in Fish Smoking and Drying. The Effect of Smoking and Drying on the Nutritional Properties of Fish, ed J. R. Burt (London: Elsevier Applied Science), 121–159.
Baffone, W., Casaroli, A., Campana, R., Citterio, B., Vittoria, E., Pierfelici, L., et al. (2005). ‘In vivo’ studies on the pathophysiological mechanism of Vibrio parahaemolyticus TDH+—induced secretion. Microb. Pathog. 38, 133–137. doi: 10.1016/j.micpath.2004.11.001
Baker-Austin, C., Stockley, L., Rangdale, R., and Martinez-Urtaza, J. (2010). Environmental occurrence and clinical impact of Vibrio vulnificus and Vibrio parahaemolyticus: a European perspective. Environ. Microbiol. Rep. 2, 7–18. doi: 10.1111/j.1758-2229.2009.00096.x
Barbosa, W. B., Cabedo, L., Wederquist, H. J., Sofos, J. N., and Schmidt, G. R. (1994). Growth variation among species and strains of Listeria in culture broth. J. Food Prot. 57, 765–769.
Begot, C., Lebert, I., and Lebert, A. (1997). Variability of the response of 66 Listeria monocytogenes and Listeria innocua strains to different growth conditions. Food Microbiol. 14, 403–412. doi: 10.1006/fmic.1997.0097
Bej, A. K., Patterson, D. P., Brasher, C. W., Vickery, M. C., Jones, D. D., and Kaysner, C. A. (1999). Detection of total and hemolysin-producing Vibrio parahaemolyticus in shellfish using multiplex PCR amplification of tlh, tdh and trh. J. Microbiol. Methods 36, 215–225. doi: 10.1016/S0167-7012(99)00037-8
Burnham, V. E., Janes, M. E., Jakus, L. A., Supan, J., DePaola, A., and Bell, J. (2009). Growth and survival differences of Vibrio vulnificus and Vibrio parahaemolyticus strains during cold storage. J. Food Sci. 74, M314–M318. doi: 10.1111/j.1750-3841.2009.01227.x
Cook, D. W., and Ruple, A. (1989). Indicator bacteria and Vibrionaceae multiplication in postharvest shellstock oysters. J. Food Prot. 52, 343–349.
Dalgaard, P., and Koutsoumanis, K. (2001). Comparison of maximum specific growth rates and lag times estimated from absorbance and viable count data by different mathematical models. J. Microbiol. Methods 43, 183–196. doi: 10.1016/S0167-7012(00)00219-0
Daniels, N. A., MacKinnon, L., Bishop, R., Altekruse, S., Ray, B., Hammond, R. M., et al. (2000). Vibrio parahaemolyticus infections in the United States, 1973-1998. J. Infect. Dis. 181, 1661–1666. doi: 10.1086/315459
David, W. M., Ross, T., Olley, J., and McMeekin, A. T. (1997). Development and evaluation of a predictive model for the effect of temperature and water activity on the growth rate of Vibrio parahaemolyticus. Int. J. Food Microbiol. 38, 133–142. doi: 10.1016/S0168-1605(97)00100-1
Depaola, A., Hopkins, L. H., Peeler, J. T., Wentz, B., and Mcphearson, R. M. (1990). Incidence of Vibrio parahaemolyticus in United States coastal waters and oysters. Appl. Environ. Microbiol. 56, 2299–2302.
DePaola, A., Nordstrom, J. L., Bowers, J. C., Wells, J. G., and Cook, D. W. (2003). Seasonal abundance of total and pathogenic Vibrio parahaemolyticus in Alabama oysters. Appl. Environ. Microbiol. 69, 1521–1526. doi: 10.1128/AEM.69.3.1521-1526.2003
Esteves, K., Mosser, T., Aujoulat, F., Hervio-Heath, D., Monfort, P., and Jumas-Bilak, E. (2015). Highly diverse recombining populations of Vibrio cholerae and Vibrio parahaemolyticus in French Mediterranean coastal lagoons. Front. Microbiol. 6:708. doi: 10.3389/fmicb.2015.00708
Fernandez-Piquer, J., Bowman, J. P., Ross, T., and Tamplin, M. L. (2011). Predictive models for the effect of storage temperature on Vibrio parahaemolyticus viability and counts of total viable bacteria in Pacific oysters (Crassostrea gigas). Appl. Environ. Microbiol. 77, 8687–8695. doi: 10.1128/AEM.05568-11
Francois, K., Devlieghere, F., Standaert, A. R., Geeraerd, A. H., Van Impe, J. F., and Debevere, J. (2006). Effect of environmental parameters (temperature, pH and aw) on the individual cell lag phase and generation time of Listeria monocytogenes. Int. J. Food Microbiol. 108, 326–335. doi: 10.1016/j.ijfoodmicro.2005.11.017
Fujikawa, H., Kimura, B., and Fujii, T. (2009). Development of a predictive program for Vibrio parahaemolyticus growth under various environmental conditions. Biocontrol Sci. 14, 127–131. doi: 10.4265/bio.14.127
Fujino, T., Okuno, Y., Nakada, D., Aoyama, A., Mukai, K., and Uebo, T. (1950). On the bacteria examination of Shirasu food poisoning. Med. J. Osaka Univ. 4, 299–304.
Gibson, A. M., Bratchell, N., and Roberts, T. A. (1987). The effect of sodium chloride and temperature on the rate and extent of growth of Clostridium botulinum type A in pasteurized pork slurry. J. Appl. Bacteriol. 62, 479–490. doi: 10.1111/j.1365-2672.1987.tb02680.x
Gil, M. M., Brandao, T. R., and Silva, C. L. (2006). A modified Gompertz model to predict microbial inactivation under time-varying temperature conditions. J. Food Eng. 76, 89–94. doi: 10.1016/j.jfoodeng.2005.05.017
Honda, T., and Iida, T. (1993). The pathogenicity of Vibrio parahaemolyticus and the role of the thermostable direct haemolysin and related haemolysins. Rev. Med. Microbiol. 4, 106–113. doi: 10.1097/00013542-199304000-00006
Johnson, C. N., Flowers, A. R., Noriea, N. F., Zimmerman, A. M., Bowers, J. C., DePaola, A., et al. (2010). Relationships between environmental factors and pathogenic Vibrios in the northern Gulf of Mexico. Appl. Environ. Microbiol. 76, 7076–7084. doi: 10.1128/AEM.00697-10
Juneja, V. K., Melendres, M. V., Huang, L., Gumudavelli, V., Subbiah, J., and Thippareddi, H. (2007). Modeling the effect of temperature on growth of Salmonella in chicken. Food Microbiol. 24, 328–335. doi: 10.1016/j.fm.2006.08.004
Lammerding, A. M. (1997). An overview of microbial food safety risk assessment. J. Food Prot. 60, 1420–1425.
Larsen, A. M., Rikard, F. S., Walton, W. C., and Arias, C. R. (2015). Temperature effect on high salinity depuration of Vibrio vulnificus and V. parahaemolyticus from the Eastern oyster (Crassostrea virginica). Int. J. Food Microbiol. 192, 66–71. doi: 10.1016/j.ijfoodmicro.2014.09.025
Letchumanan, V., Chan, K. G., and Lee, L. H. (2014). Vibrio parahaemolyticus: a review on the pathogenesis, prevalence, and advance molecular identification techniques. Front. Microbiol. 5:705. doi: 10.3389/fmicb.2014.00705
Li, H., Xie, G., and Edmondson, A. (2007). Evolution and limitations of primary mathematical models in predictive microbiology. Br. Food J. 109, 608–626. doi: 10.1108/00070700710772408
Lianou, A., and Koutsoumanis, K. P. (2011). Effect of the growth environment on the strain variability of Salmonella enterica kinetic behavior. Food Microbiol. 28, 828–837. doi: 10.1016/j.fm.2010.04.006
Lianou, A., and Koutsoumanis, K. P. (2013). Strain variability of the behavior of foodborne bacterial pathogens: a review. Int. J. Food Microbiol. 167, 310–321. doi: 10.1016/j.ijfoodmicro.2013.09.016
Lianou, A., Stopforth, J. D., Yoon, Y., Wiedmann, M., and Sofos, J. N. (2006). Growth and stress resistance variation in culture broth among Listeria monocytogenes strains of various serotypes and origins. J. Food Prot. 69, 2640–2647.
Lindqvist, R. (2006). Estimation of Staphylococcus aureus growth parameters from turbidity data: characterization of strain variation and comparison of methods. Appl. Environ. Microbiol. 72, 4862–4870. doi: 10.1128/AEM.00251-06
Liu, D., Ning, X., and Zhang, J. (2008). Optimization of growth condition of Vibrio Parahaemolyticus via response surface methodology. Microbiology 35, 306–310. doi: 10.3969/j.issn.0253-2654.2008.02.029
Lopez-Joven, C., Ignacio de Blas, M., and Roque, A. (2015). Prevalences of pathogenic and non-pathogenic Vibrio parahaemolyticus in mollusks from the Spanish Mediterranean Coast. Front. Microbiol. 6:736. doi: 10.3389/fmicb.2015.00736
Ma, C., Deng, X., Ke, C., He, D., and Liang, Z. (2014). Epidemiology and etiology characteristics of foodborne outbreaks caused by Vibrio parahaemolyticus during 2008-2010 in Guangdong province, China. Foodborne Pathog. Dis. 11, 21–29. doi: 10.1089/fpd.2013.1522
Makino, K., Oshima, K., Kurokawa, K., Yokoyama, K., Uda, T., Tagomori, K., et al. (2003). Genome sequence of Vibrio parahaemolyticus: a pathogenic mechanism distinct from that of V. cholerae. Lancet 361, 743–749. doi: 10.1016/S0140-6736(03)12659-1
Martins, B. M., and Locke, J. C. (2015). Microbial individuality: how single-cell heterogeneity enables population level strategies. Curr. Opin. Microbiol. 24, 104–112. doi: 10.1016/j.mib.2015.01.003
McMeekin, T. A., Olley, J. N., Ross, T., and Ratkowsky, D. A. (1993). Predictive Microbiology: Theory and Application. (Taunton, MA: John Wiley Sons Ltd).
Miles, D. W., Ross, T., Olley, J., and McMeekin, T. A. (1997). Development and evaluation of a predictive model for the effect of temperature and water activity on the growth rate of Vibrio parahaemolyticus. Int. J. Food Microbiol. 38, 133–142. doi: 10.1016/S0168-1605(97)00100-1
Miyamoto, Y., Kato, T., Obra, Y., Akiyama, S., Takizawa, K., and Yamai, S. (1969). In vitro characteristic of Vibrio parahaemolyticus: its close correlation with human pathogenicity. J. Bacteriol. 100, 1147.
Mytilinaios, I., Salih, M., Schofield, H. K., and Lambert, R. J. (2012). Growth curve prediction from optical density data. Int. J. Food Microbiol. 154, 169–176. doi: 10.1016/j.ijfoodmicro.2011.12.035
NACMCF (National Advisory Committee on Microbiological Criteria for Foods) (2005). Considerations for establishing safety-based consume-by date labels for refrigerated ready-to-eat foods. J. Food Prot. 68, 1761–1775.
Nauta, M. J. (2000). Separation of uncertainty and variability in quantitative microbial risk assessment models. Int. J. Food Microbiol. 57, 9–18. doi: 10.1016/S0168-1605(00)00225-7
Nauta, M. J. (2002). Modelling bacterial growth in quantitative microbiological risk assessment: is it possible? Int. J. Food Microbiol. 73, 297–304. doi: 10.1016/S0168-1605(01)00664-X
Nauta, M. J., and Dufrenne, J. B. (1999). Variability in growth characteristics of different Escherichia coli O157:H7 isolates and its implications for predictive microbiology. Quant. Microbiol. 1, 137–155. doi: 10.1023/A:1010087808314
Nishina, T., Wada, M., Ozawa, H., Hara-Kudo, Y., Konuma, H., Hasegawa, J., et al. (2004). Growth kinetics of Vibrio parahaemolyticus O3:K6 under varying conditions of pH, NaCl concentration and temperature. Shokuhin Eiseigaku Zasshi. 45, 35–37. doi: 10.3358/shokueishi.45.35
Okada, N., Iida, T., Park, K. S., Goto, N., Yasunaga, T., Hiyoshi, H., et al. (2009). Identification and characterization of a novel type III secretion system in trh-positive Vibrio parahaemolyticus strain TH3996 reveal genetic lineage and diversity of pathogenic machinery beyond the species level. Infect. Immun. 77, 904–913. doi: 10.1128/IAI.01184-08
Pouillot, R., Albert, I., Cornu, M., and Denis, J. B. (2003). Estimation of uncertainty and variability in bacterial growth using Bayesian inference. Application to Listeria monocytogenes. Int. J. Food Microbiol. 81, 87–104. doi: 10.1016/S0168-1605(02)00192-7
Ratkowsky, D. A., Olley, J., McMeekin, T. A., and Ball, A. (1982). Relationship between temperature and growth rate of bacterial cultures. J. Bacteriol. 149, 1–5.
Scott, V. N., Swanson, K. M. J., Freier, T. A., Pruett, W. P. Jr., Sveum, W. H., Hall, P. A., et al. (2005). Guidelines for conducting Listeria monocytogenes challenge testing of foods. Food Prot. Trends 25, 818–825.
Shen, X., Cai, Y., and Liu, C. (2009). Effect of temperature on uptake and survival of Vibrio parahaemolyticus in oysters (Crassostrea plicatula). Int. J. Food Microbiol. 136, 129–132. doi: 10.1016/j.ijfoodmicro.2009.09.012
Shen, X. S., Liu, W. W., and Liu, C. C. (2010). “Effects of cold storage and thermal treatment on growth and survival of pathogenic Vibrio Parahaemolyticus,” in International Conference on Bioinformatics and Biomedical Technology (Chengdu), 371–373.
Sobrinho, P. C., Destro, M. T., Franco, B. D., and Landgraf, M. (2014). A quantitative risk assessment model for Vibrio parahaemolyticus in raw oysters in Sao Paulo State, Brazil. Int. J. Food Microbiol. 180, 69–77. doi: 10.1016/j.ijfoodmicro.2014.04.008
Tang, J. Y. H., Mohd-Noor, N. H., Mazlan, N., Yeo, C. C., and Che, B. B. (2014). Survival of Vibrio cholerae O1 and Vibrio parahaemolyticus in fried and boiled Malaysian fish sausage. Food Control 41, 102–105. doi: 10.1016/j.foodcont.2014.01.004
U.S. Food Drug Administration (2005). Quantitative Risk Assessment on the Public Health Impact of Pathogenic Vibrio parahaemolyticus in Raw Oysters. Center for Food Safety and Applied Nutrition, Food and Drug Administration, U.S. Department of Health and Human Services. Available online at: http://www.fda.gov/Food/FoodScienceResearch/RiskSafetyAssessment/ucm050421.htm
Vose, D. J. (1998). The application of quantitative risk assessment to microbial food safety. J. Food Prot. 61, 640–648.
Wang, J. J., Sun, W. S., Jin, M. T., Liu, H. Q., Zhang, W. J., Sun, X. H., et al. (2014). Fate of Vibrio parahaemolyticus on shrimp after acidic electrolyzed water treatment. Int. J. Food Microbiol. 179, 50–56. doi: 10.1016/j.ijfoodmicro.2014.03.016
Whiting, R. C., and Golden, M. H. (2002). Variation among Escherichia coli O157:H7 strains relative to their growth, survival, thermal inactivation, and toxin production in broth. J. Food Microbiol. 75, 127–133. doi: 10.1016/S0168-1605(02)00003-X
Wong, H. C., Liu, S. H., Ku, L. W., Lee, I. Y., Wang, T. K., Lee, Y. S., et al. (2000). Characterization of Vibrio parahaemolyticus isolates obtained from foodborne illness outbreaks during 1992 through 1995 in Taiwan. J. Food Prot. 63, 900–906.
Wu, Y., Wen, J., Ma, Y., Ma, X., and Chen, Y. (2014). Epidemiology of foodborne disease outbreaks caused by Vibrio parahaemolyticus, China, 2003-2008. Food Control 46, 197–202. doi: 10.1016/j.foodcont.2014.05.023
Yang, Z. Q., Jiao, X. A., Li, P., Pan, Z. M., Huang, J. L., Gu, R. X., et al. (2009). Predictive model of Vibrio parahaemolyticus growth and survival on salmon meat as a function of temperature. Food Microbiol. 26, 606–614. doi: 10.1016/j.fm.2009.04.004
Yang, Z. Q., Jiao, X. A., Zhou, X. H., Cao, G. X., Fang, W. M., and Gu, R. X. (2008). Isolation and molecular characterization of Vibrio parahaemolyticus from fresh, low-temperature preserved, dried, and salted seafood products in two coastal areas of eastern China. Int. J. Food Microbiol. 125, 279–285. doi: 10.1016/j.ijfoodmicro.2008.04.007
Yoon, K. S., Min, K. J., Jung, Y. J., Kwon, K. Y., Lee, J. K., and Oh, S. W. (2008). A model of the effect of temperature on the growth of pathogenic and nonpathogenic Vibrio parahaemolyticus isolated from oysters in Korea. Food Microbiol. 25, 635–641. doi: 10.1016/j.fm.2008.04.007
Zhang, Z., Liu, H., Lou, Y., Xiao, L., Liao, C., Malakar, P. K., et al. (2015). Quantifying viable Vibrio parahaemolyticus and Listeria monocytogenes simultaneously in raw shrimp. Appl. Microbiol. Biotechnol. 99, 6451–6462. doi: 10.1007/s00253-015-6715-x
Zimmerman, A. M., DePaola, A., Bowers, J. C., Krantz, J. A., Nordstrom, J. L., and Johnson, C. N. (2007). Variability of total and pathogenic Vibrio parahaemolyticus densities in northern Gulf of Mexico water and oysters. Appl. Environ. Microbiol. 73, 7589–7596. doi: 10.1128/AEM.01700-07
Keywords: Vibrio parahemolyticus, maximum growth rate, growth variability, environmental factor, temperature, salinity, gene heterogeneity
Citation: Liu B, Liu H, Pan Y, Xie J and Zhao Y (2016) Comparison of the Effects of Environmental Parameters on the Growth Variability of Vibrio parahaemolyticus Coupled with Strain Sources and Genotypes Analyses. Front. Microbiol. 7:994. doi: 10.3389/fmicb.2016.00994
Received: 26 January 2016; Accepted: 09 June 2016;
Published: 23 June 2016.
Edited by:
Rosanna Tofalo, University of Teramo, ItalyReviewed by:
Antonio Valero, University of Cordoba, SpainGiorgia Perpetuini, University of Teramo, Italy
Copyright © 2016 Liu, Liu, Pan, Xie and Zhao. This is an open-access article distributed under the terms of the Creative Commons Attribution License (CC BY). The use, distribution or reproduction in other forums is permitted, provided the original author(s) or licensor are credited and that the original publication in this journal is cited, in accordance with accepted academic practice. No use, distribution or reproduction is permitted which does not comply with these terms.
*Correspondence: Yong Zhao, yzhao@shou.edu.cn
†These authors have contributed equally to this study.