 Xiaomin Xia
 Wang Guo
 Shangjin Tan
 Hongbin Liu
- Division of Life Science, The Hong Kong University of Science and Technology, Hong Kong, Hong Kong
Synechococcus are the most abundant and widely distributed picocyanobacteria in the ocean. The salt-wedge type of estuary possesses the complete horizontal and vertical gradient of salinity together with other physical and chemical parameters. In order to reveal whether such a complex environmental gradient harbors a high diversity of Synechococcus, we investigated the abundance, taxonomic composition and pigment genetic diversity of Synechococcus in surface and bottom waters across the salinity gradient in a salt-wedge estuary by flow cytometric analysis and pyrosequencing of the rpoC1 gene and cpcBA operon (encoding phycocyanin). Synechococcus were ubiquitously distributed in the studied region, with clear spatial variations both horizontally and vertically. The abundance and diversity of Synechococcus were low in the freshwater-dominated low salinity waters. By pyrosequencing of the rpoC1 gene, we have shown that with the increase of salinity, the dominant Synechococcus shifted from the freshwater Synechococcus to the combination of phylogenetic subcluster 5.2 and freshwater Synechococcus, and then the strictly marine subcluster 5.1 clade III. Besides, the composition of Synechococcus assemblage in the deep layer was markedly different from the surface in the stratified waters (dissimilarities: 40.32%-95.97%, SIMPER analysis). High abundance of clade III Synechococcus found in the brackish waters may revise our previous understanding that strains of this clade prefers oligotrophic environment. Our data also suggested that both the phylogenetic subcluster 5.3 Synechococcus, a lineage that was not well understood, and subcluster 5.1 clade I, a typical cold water lineage, were widely distributed in the bottom layer of the estuary. Clade I detected in the studied region was mainly contributed by subclade IG. Analysis of the cpcBA operon sequences revealed niche partitioning between type 1 and type 3 Synechococcus, with type 2 distributed broadly across the whole environmental gradients. Our results suggest that the salt wedge estuary provides various niches for different lineages of Synechococcus, making it an environment with high Synechococcus diversity compared with adjacent freshwater and shelf sea environments.
Introduction
Synechococcus is one of major components of the phytoplankton community in both marine (Glover et al., 1986; Partensky et al., 1999) and freshwater (Callieri and Stockner, 2002; Sarmento et al., 2008) ecosystems. Compared with Prochlorococcus, another important pico-cyanobacteria which dominate in the oligotrophic open ocean, Synechococcus have higher nutrient requirements and are therefore more abundant in coastal (Li, 1998; Flombaum et al., 2013) and upwelling waters (Partensky et al., 1999; Cuevas and Morales, 2006). For instance, the highest Synechococcus abundance was recorded in the Costa Rica Dome where strong upwelling occurs (Saito et al., 2005), varying between 1.2 × 10⁶ and 3.7 × 10⁶ cells mL-1. A high abundance of Synechococcus was also reported in the Red Sea (Veldhuis and Kraay, 1993), Baltic Sea (Kuosa, 1991), and Chesapeake Bay (Wang et al., 2011). In Hong Kong coastal waters, Synechococcus are also important primary producers in the summer, with the maximum abundance reaching 5.7 × 10⁵ cells mL-1 (Liu et al., 2014).
Synechococcus are divided into three major pigment types by their different phycobiliprotein compositions: type 1 binds only phycocyanobilin (PCB), type 2 binds both PCB and phycoerythrobilin (PEB), while type 3 contains PCB, PEB and phycourobilin (PUB) (Six et al., 2007). Hence, type 1 is also called PC-only Synechococcus while type 2 and 3 are PE-containing Synechococcus. Type 3 is further divided into four subtypes, 3a (low PUB), 3b (medium PUB), 3c (high PUB) and 3d (variable PUB), according to the compositional proportion of PUB relative to PEB. Studies have widely reported different geographical distributions of Synechococcus pigment types – type 1 is abundant in high nutrient and turbidity coastal and estuarine waters, type 2 prefers relatively clean coastal waters, while type 3 dominates in oligotrophic open ocean (Olson et al., 1988, 1990; Wood et al., 1998). Besides in situ fluorometer (Cowles et al., 1993) and FCM (Olson et al., 1988), recently molecular methods have been applied to study Synechococcus pigment diversity in marine waters (Crosbie et al., 2003; Haverkamp et al., 2009; Everroad and Wood, 2012; Liu et al., 2014; Xia et al., 2017). The cpeBA operon and cpcBA operon are two gene markers commonly used to identify Synechococcus pigment types (Crosbie et al., 2003; Haverkamp et al., 2008; Liu et al., 2014; Xia et al., 2017).
Taxonomically, cluster 5 marine Synechococcus is further divided into three subclusters, S5.1, S5.2 and S5.3 according to the gene markers, such as the 16S rRNA and rpoC1 (Herdman et al., 2001; Fuller et al., 2003; Mazard et al., 2012). These three subclusters are further composed of at least 19 phylogenetical lineages (Farrant et al., 2016; Xia et al., 2017). Studies that adopted culture independent methods have revealed niche differentiation in Synechococcus lineages (Zwirglmaier et al., 2008; Huang et al., 2012; Xia et al., 2017). For example, clade I is known as cold water Synechococcus, while clade II is dominant in tropical/subtropical warm waters. Previous studies have also reported that distinct Synechococcus communities were present in the oligotrophic oceanic waters and nutrient rich coastal waters (Scanlan and West, 2002). Environmental factors such as concentration and type of inorganic nitrogen (Ahlgren and Rocap, 2006), phosphate concentration (Tetu et al., 2009), temperature (Pittera et al., 2014), salinity (Rajaneesh and Mitbavkar, 2013; Xia et al., 2015), and trace metal (Ahlgren et al., 2014) are all known to influence the distribution of Synechococcus lineages. However, the niches of some Synechococcus lineages remain unknown.
Previous studies suggested that Synechococcus pigment genes, such as PE-encoding genes, have undergone horizontal gene transfers between Synechococcus lineages during the evolution of this genus (Six et al., 2007; Everroad and Wood, 2012). This makes it impossible to identify a Synechococcus taxonomic lineage and pigment type at the same time based on a single gene marker. For examples, the phylogenetic tree based on the cpeBA operon sequences clearly grouped several Synechococcus lineages (see Figure 3 in Everroad and Wood, 2012). On the other hand, some lineages are composed by different pigment types. For example, clade II Synechococcus have at least 4 pigment types: type 2, 3a, 3c, and 3d1 (Roscoff Syenchococcus database). Hence, different from identification of Synechococcus pigment types which is based on cpeBA and cpcBA operon, taxonomic lineage of a Synechococcus is classified via housekeeping genes, such asITS (Haverkamp et al., 2008), 16s rRNA gene (Fuller et al., 2003), rpoC1 (Mühling et al., 2006), and petB (Farrant et al., 2016).
Synechococcus community composition in estuaries or river plumes is often distinct from that in saline waters. A study conducted in Hong Kong water has shown that the water influenced by freshwater discharge from the Pearl River is dominated by PC-only (type 1) S5.2 Synechococcus, freshwater Synechococcus, and Cyanobium, while the coastal water not directly impacted by the river plume is dominated by various clades of marine Synechococcus S5.1 (Xia et al., 2015). The study also suggested that Synechococcus imported by the freshwater discharge are an important component of the cyanobacterial phytoplankton in the estuarine ecosystems. Similar observation was also reported by the studies carried out in the Zuari estuary and Changjiang estuary (Rajaneesh and Mitbavkar, 2013; Chung et al., 2015).
Due to high nutrient inputs, estuaries often sustain high levels of productivity. Salt wedge estuaries with strong vertical salinity gradient harbor different microbial communities in the surface and deep water (Korlević et al., 2016). The Pearl River is one of the largest rivers in China with a typical salt wedge estuary in the wet season (Harrison et al., 2008). In contrast to the increasing salinity along the river-estuary-coastal water transition, nutrient concentrations gradually decrease (Harrison et al., 2008). The strong gradient of environmental conditions makes the Pearl River estuary an ideal place to evaluate factors affecting the spatial distribution of Synechococcus lineages. However, till now, no study of Synechococcus phylogenetic diversity and pigment diversity along the salinity gradient with different depths was conducted in this strongly stratified estuary.
In order to study Synechococcus abundance, community taxonomic composition and pigment diversity in the salt wedge estuary, we conducted a cruise in July 2014 to collect samples along a salinity gradient in the Pearl River-estuary-coast system. Abundance of Synechococcus was evaluated by flow cytometric analysis. Synechococcus taxonomic composition and pigment diversity were assessed through pyrosequencing of the rpoC1 gene and cpcBA operon, respectively. The relationship between environmental factors and Synechococcus diversity was also analyzed.
Materials and Methods
Sample Collection
Samples were collected from the Pearl River estuary on a cruise conducted from 13 to 20 July 2014 (Figure 1 and Table 1). Salinity, temperature and depth were measured by a conductivity-temperature-depth rosette system (CTD, Sea Bird Electronics). At each station, 0.5–1 L of water was collected from surface and bottom (1 m above the bottom) layers, pre-filtered through a 3.0 μm (47 mm) polycarbonate membrane (PALL Corporation) and then filtered onto a 0.22 μm (47 mm) polycarbonate membrane for DNA extraction. Membranes were frozen at –80°C immediately after filtration. For counting Synechococcus abundance, 1.8 mL water from each station was fixed with seawater buffered paraformaldehyde (0.5%, final concentration), flash frozen in liquid nitrogen and stored at –80°C. Water samples for nutrient measurement were filtered with 0.45μm cellulose acetate membranes and were stored at -20°C until analysis. Analytical protocols for nutrients followed Dai et al. (Dai et al., 2008). The method detection limits are 0.5 μM for ammonia, 0.02 μM for nitrite, 0.07 μM for nitrate, and 0.17 μM for phosphate.
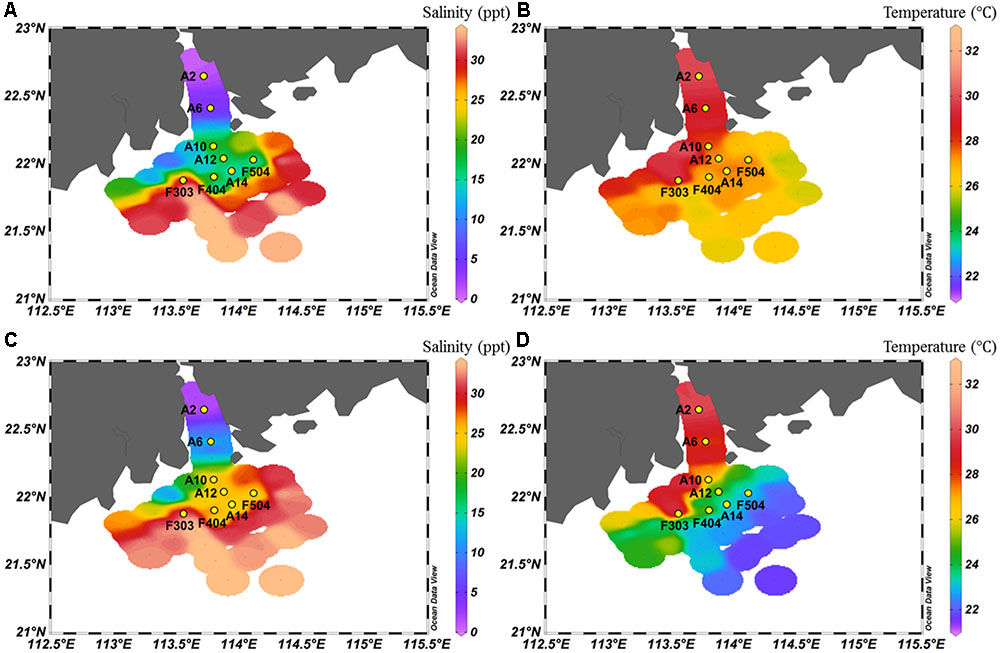
FIGURE 1. Salinity (A,C) and temperature (B,D) of surface (A,B) and bottom (C,D) water of the study area.
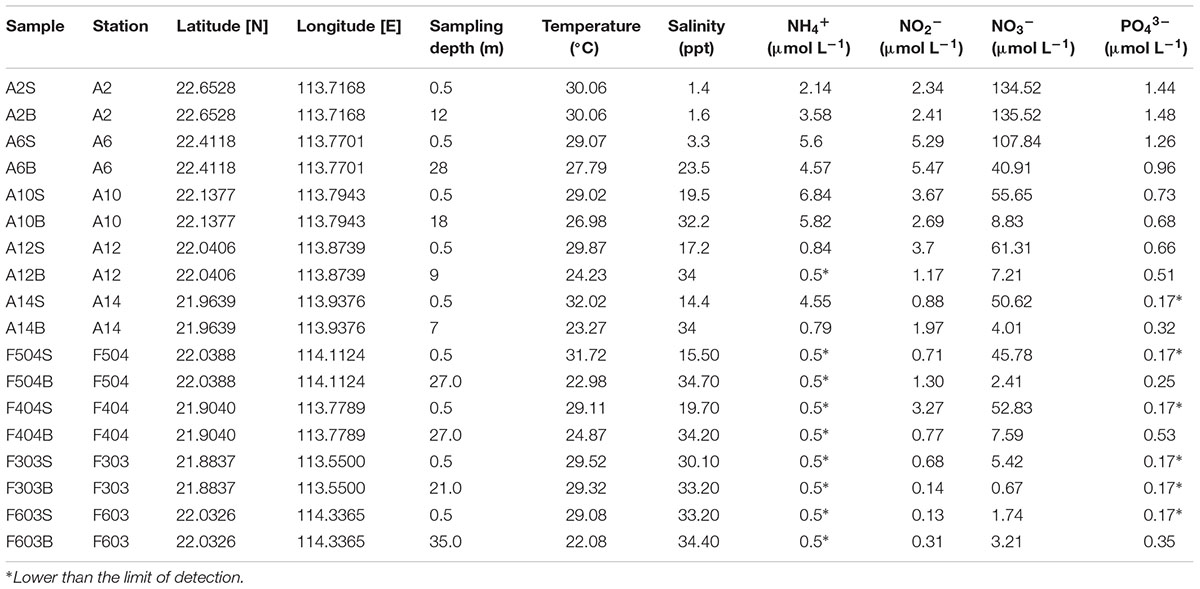
TABLE 1. Characteristics of sampling sites and measured environmental factors.
Analysis of Synechococcus Abundance
Synechococcus cells were enumerated using a Becton-Dickson FACSCalibur flow cytometer equipped with dual lasers of 488 and 635 nm with a high flow rate (Liu et al., 2014). Ten microliter yellow–green fluorescent beads (1 μm, Polysciences, Warrington, PA, United States) were added to each sample as an internal standard. Flow cytometric data were analyzed using WinMDI software 2.9 (Joseph Trotter, Scripps Research Institute, LaJolla, CA, United States). PC-only and PE-containing type Synechococcus were counted following the method described by Liu et al. (2014). However, samples from F303 were lost.
DNA Extraction, PCR, and Sequencing
Genomic DNA was extracted using the PureLink Genomic DNA mini kit (Invitrogen, CA, United States) and was eluted in TE buffer (Tris-EDTA buffer: 10 mM Tris,1 mM EDTA,pH8.0). For amplification of the rpoC1 gene, the PCR followed the protocol of Mühling et al. (2006). The first round of PCR used the primer rpoC1-N5 and the C-terminal primer rpoC1-C, and the PCR products were used as templates for a second round of PCR with modified primer rpoC1-39F (5′-adaptor+barcode+GGNATNGTNTGYGAGCGYTG) and rpoC1-462R (5′-adaptor+CGYAGRCGCTTGRTCAGCTT) (Xia et al., 2015). The PCR products were gel-purified using the Qiaquick gel purification kit (Qiagen, Hilgen, Germany) as described by the manufacturer. Purified amplicons were sequenced using the GS Junior pyrosequencing system according to manufacturer instructions (Roche, 454 Life Sciences, Branford, CT, United States).
For amplification of the cpcBA operon sequences, we used the primer pair SyncpcB-Fw (5′-adaptor+barcode+ATGGCTGCTTGCCTGCG-3′) and SyncpcA-Rev (5′-adaptor +ATCTGGGTGGTGTAGGG-3′) designed by Haverkamp et al. (2008). The PCR reaction mixture was composed of 1 μL of template DNA, 2.5 μL of 10× PCR buffer, 0.5 μL of 10 mM dNTP mixture, 0.75 μL of 50 mM MgCl2, 1 unit of Platinum taq DNA polymerase (Invitrogen, CA, United States), and 1 μL of each forward and reverse primer (10 nM). Sterile MilliQ-grade water was added to a final reaction volume of 25 μL. The PCR reactions were run on a Bio-Rad PCR machine. The program was 5 min at 94°C, followed by 40 cycles of 30 s at 94°C, 30 s at 55°C and 1 min at 72°C. The final elongation step was 10 min at 72°C. The PCR products were gel purified and sequenced in the GS Junior 454 sequencing system.
454 Post-run Sequence Analyses
Analysis of the rpoC1 and cpcBA sequence was conducted using the microbial ecology community software program Mothur2 (Schloss et al., 2009). Raw sequences were first processed by removing barcodes and primers, then only reads with an average quality score above 25 and length longer than 300 nt were taken into account. Sequences were then denoised using the command shhh.seqs with sigma value of 0.01. Sequences containing ambiguous bases and homopolymer longer than 8 bp were also screened. Chimeras were identified using the command chimera.uchime and were then removed. After the above quality control, sequences were identified by local Blast using BioEdit with an expectation value 0.01 (Hall, 1999). For the analysis of rpoC1 gene, sequences classified as Prochlorococcus and Synechocystis were removed, and the remaining sequences that were less than 90% identical to the S5.1 clades and 85% identical to S5.2, S5.3, Cyanobium, and FS reference sequences (Supplementary Table S1) were assigned as unclassified (Xia et al., 2015). Similarly, for the cpcBA operon, sequences were identified by the local blast with the expectation value 0.01. The reference sequences of the rpoC1 (Xia et al., 2015) and cpcBA operon were listed in Supplementary Tables S1, S2. The cpcBA operon reference sequences were from the NCBI GenBank database3 and the pigment type of representative strains was determined according to the Roscoff Synechococcus database4 and Everroad and Wood’s work (Everroad and Wood, 2012). As there were three copies of the cpcBA operon in the genomic sequence of type 1 Synechococcus (Six et al., 2007), the number of resulting type 1 sequences was divided by three in calculating the relative abundance of each Synechococcus pigment type. Coverge and operational taxonomic units (OTUs) numbers were calculated at the cutoff level of 3% for the rpoC1 gene and 5% for the cpcBA operon using Mothur’s command summary.single. OTUs which contain only 1 sequence were removed. The relative abundance of each OTU in a sample was calculated using the command get.relabund. The Margalef’s species richness (d = (S–1)/ln(N), where S is total OTU number and N is total reads of each sample) and diversity (Shannon index H′) were calculated. Similarity percentage (SIMPER) analysis of the dissimilarity between Synechococcus communities was carried out using Primer 5 (Primer-E Ltd., Plymouth, United Kingdom). The Spearman correlation between Synechococcus groups was calculated using R package Corrplot (Wei, 2016). Only the correlations with P-value less than 0.05 were considered as significant and were thus visualized.
Phylogenetic Analysis of the rpoC1 and cpcBA Sequences
The representative sequences of the 40 most abundant OTUs for the rpoC1 gene (covered 73.1% of total reads) and cpcBA operon (covered 65.7% of total reads) were extracted and aligned with the reference sequences using ClustalW (Thompson et al., 2002) according to their codon structures. Modeltest and maximum likelihood phylogenetic tree construction were done by using Mega 6 (Tamura et al., 2013), in which the model used for the rpoC1 was GTR+G+I and that for the cpcBA operon was TN92+G+I. Bootstrap confidence analysis was carried out with 200 replications for evaluating the robustness of the tree topologies. A heatmap showing the relative abundance of each OTU was generated using iTol (Letunic and Bork, 2007).
Sequence Submission
All sequences obtained from this study have been deposited in the National Center for Biotechnology Information (NCBI) Sequence Read Archive (SRA) under accession numbers: SRS2048774–SRS2048789 and SRS2048826–SRS2048834 (Supplementary Table S3).
Results
Environmental Conditions of the Sampling Stations
As shown in Figure 1, strong salinity gradients between the surface and bottom waters were recorded in all sampling stations, except the well-mixed stations A2 and F303. The surface water salinity ranged from 0 to 33 ppt. Along the Pearl River-estuary-coast transect, temperature of the surface waters gradually increased whereas the bottom waters had an opposite pattern. The surface waters had a generally higher temperature and nutrient concentration than the bottom waters. Concentrations of phosphate, NO3-, NO2-, and NH4+ were higher at the stations A2 and A6, which were strongly influenced by the freshwater discharge (Table 1). Higher salinity and lower nutrient concentration were recorded in station F303, due to the strong influence of offshore oceanic water.
Synechococcus Abundance
Synechococcus distributed ubiquitously in the Pearl River estuary and the adjacent coastal waters (Figure 2) with abundance ranging from 1.3 × 10⁴ to 2.5 × 10⁵ cells mL-1 in the surface waters and from 5.9 × 10³ to 2.0 × 10⁴ cells mL-1 in the bottom waters. The abundance of Synechococcus in the medium and high salinity stations were higher than that of the low salinity stations (A2 and A6). PE-containing Synechococcus were found in all samples and its abundance gradually increased with increasing salinity. The highest PE-containing Synechococcus abundance was detected in the surface water of A14, F404, and F504 (around 1.4 × 10⁵ cells mL-1). PC-only Synechococcus were also found in all surface samples, however, they were only detected in the bottom water of stations A02, A06, A10, and A12. In the surface water of stations A10, A12, A14, and F404, PC-only Synechococcus abundance could reach 8.0 × 10⁴ cells mL-1 (Figure 2). In general, PC-only and PE-containing Synechococcus were more abundant in the surface waters than the bottom waters at all stations except A6.
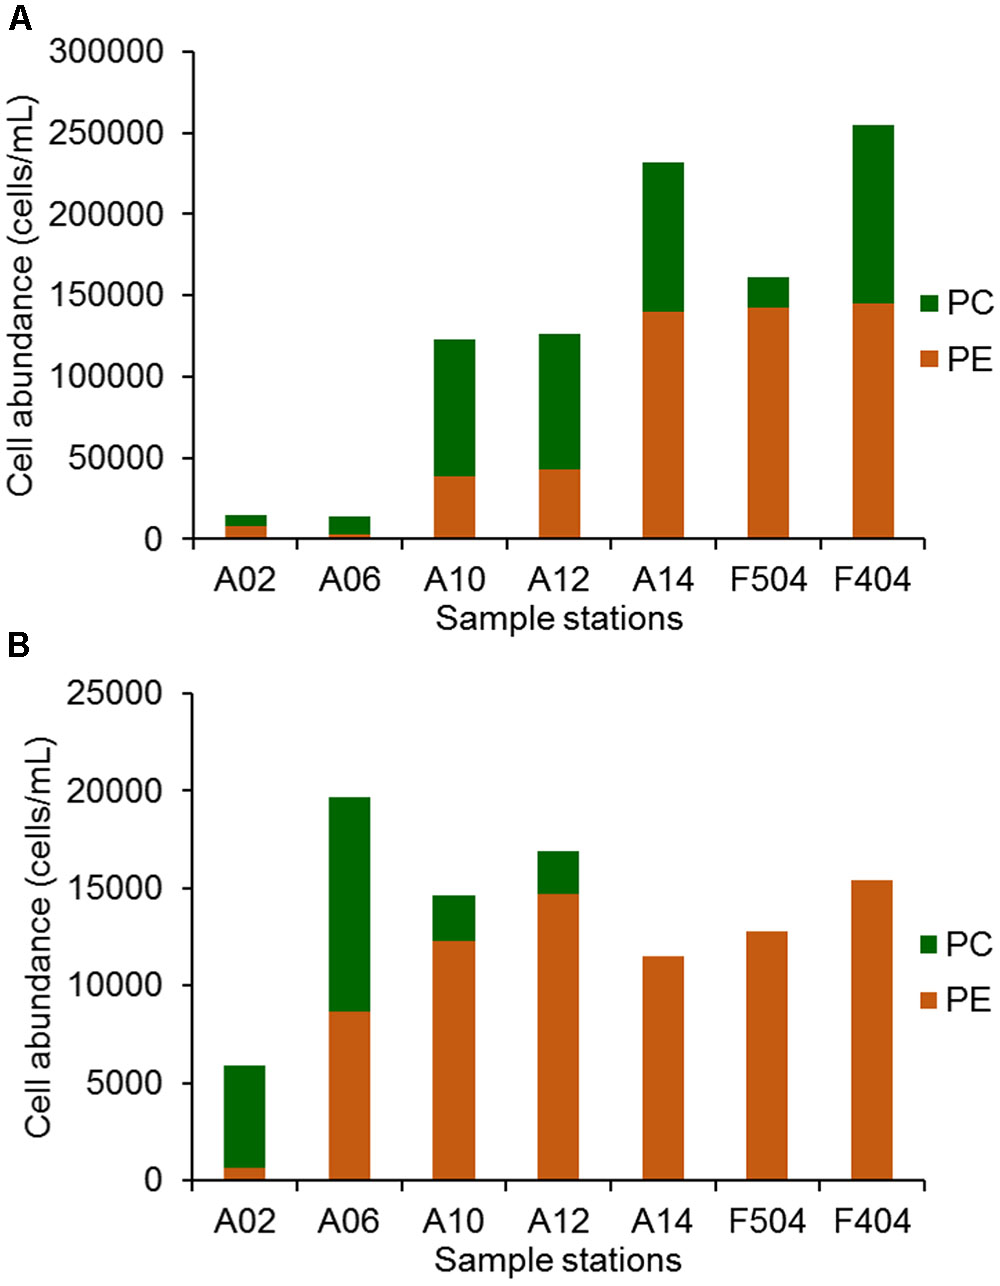
FIGURE 2. The abundance of PC only and PE containing Synechococcus in the surface (A) and bottom (B) of sampling stations.
Diversity of Synechococcus in the Pearl River Estuary
The number of the rpoC1 sequences obtained by pyrosequencing was listed in Supplementary Table S3. The diversities of Synechococcus assemblages were estimated by the Margalef’s species richness index and Shannon diversity index (Supplementary Figure S1). The surface water of stations A2 and A6, which had low salinities, displayed the lowest Synechococcus richness and diversity. The richness and diversity of Synechococcus in the bottom waters did not show a large variation, and they were higher in the bottom than the surface waters at all stations, except A10 and A14.
In the phylogenetic tree, all euryhaline (clade VIII, S5.2 and Cyanobium) and freshwater Synechococcus formed a cluster that is separated from the strictly marine Synechococcus clades (Supplementary Figure S2). In the Pearl River estuary, most S5.2 Synechococcus were affiliated with WH8007. Freshwater Synechococcus were identified into two lineages, FS_I and FS_II, and FS_I had a narrower distribution than FS_II. In the phylogenetic tree, FS_I sequences were affiliated with the uncultured clone sequences from the Tucuru hydroelectric power station reservoir in Brazilian Amazonia, while FS_II sequences were clustered with PS675 and PS676 isolated from Lake Teganuma (Japan) (Supplementary Figure S2). In A2S, almost all of freshwater Synechococcus were contributed by FS_II, while that in A6S were mainly from FS_I. OTUs which were belonged to freshwater Synechococcus, Cyanobium and S5.2 had high relative abundance in the medium salinity waters, while those belonged to clade III, such as OTU1 (contain the most reads), mainly occurred in the medium and high salinity waters. Moreover, S5.3, one of the major group Synechococcus in the studied region, had higher relative abundance in the bottom waters. It could be further classified into three subgroups, one was formed by previously reported strains RCC307 and Minos 01, the second by OTU12 and OTU18, and the third by OTU11 and OTU34. However, clade II, which was reported as the dominant Synechococcus in tropical/subtropical warm waters by previous studies (Zwirglmaier et al., 2008; Huang et al., 2012; Xia et al., 2017), was not abundant in the studied area. It is surprising that OTU25, which was widely distributed in the bottom water of the Pearl River estuary (A6B, A12B, A14B, F504B, and F404B with relative abundance from 0.01 to 5.5% of sample’s reads), was grouped with clade I Synechococcus - a typical cold water lineage.
Composition of Synechococcus Assemblages in the Pearl River Estuary
Altogether, 21 Synechococcus lineages were identified from 16 samples based on rpoC1 gene (Figure 3). Freshwater Synechococcus could be detected in all samples, with relative abundance ranging from 0.25 to 99.97% of each samples’ reads (Figure 3). More than 98% of the detected cells were freshwater Synechococcus in A2S and A6S, where the salinity was lower than 6 ppt. It was found that the dominant Synechococcus in the surface waters had shifted with the increase of salinity, from freshwater Synechococcus to a combination of freshwater Synechococcus and S5.2, and then to S5.1. High relative abundance of clade III was mainly recorded in the A14S, F504S, F404S and F303S, where the salinity is intermediate to high. Clade V, which was also a major S5.1 Synechococcus in the studied area, only had high relative abundance in stations F404S and F303S (Figure 3).
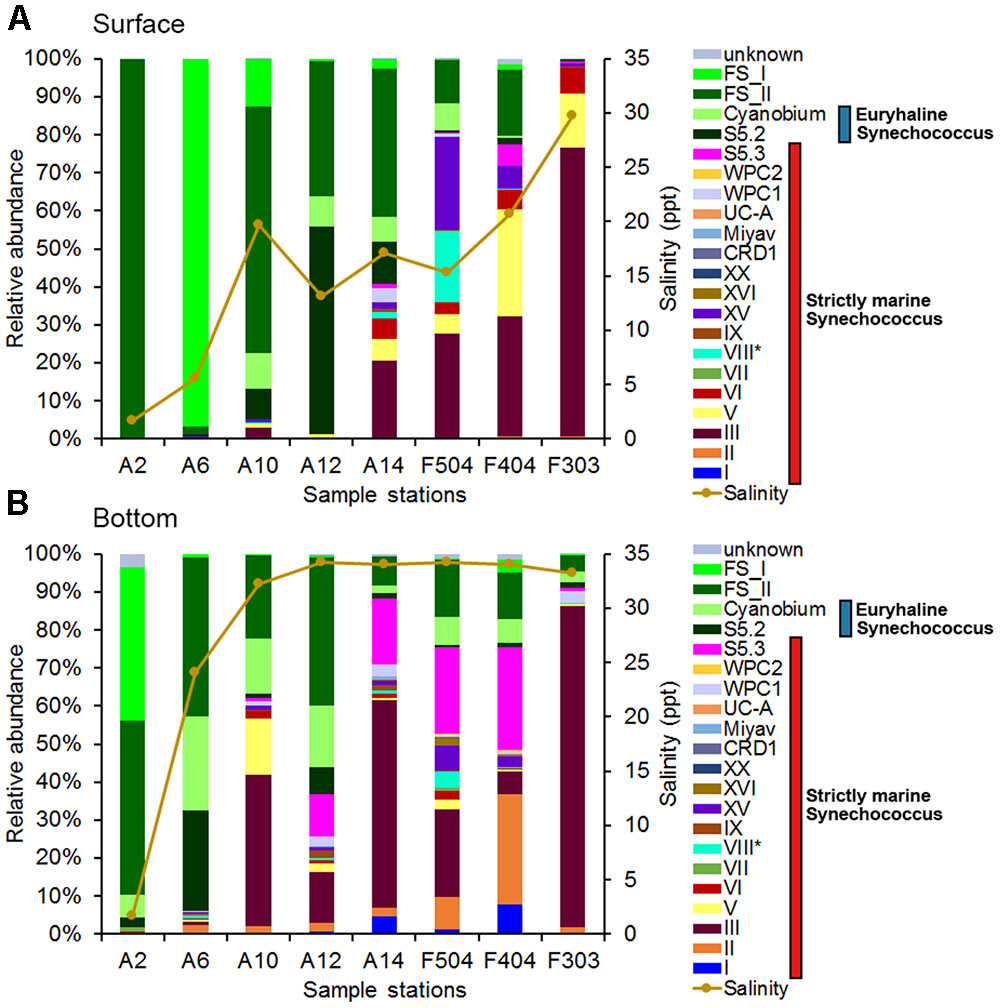
FIGURE 3. Synechococcus community compositions in the surface (A) and bottom (B) waters based on the rpoC1 gene. FS_I and FS_II are two phylogenetic groups of fresh Synechococcus found in this study (see Supplementary Figure S3). ∗S5.1 clade VIII: Euryhaline Synechococcus.
In general, Synechococcus assemblage compositions in the bottom layer were markedly different from that in the surface water layer (Figure 3). Freshwater Synechococcus largely dominated the bottom water of A2 while Cyanobium, S5.2 and 10 clades of S5.1 Synechococcus were also detected. Compared with sample A2B, A6B were found with a higher relative abundance of S5.2 and Cyanobium instead of the freshwater Synechococcus. Moreover, Clade III and S5.3 had a high relative abundance in the bottom water of high salinity stations. Clades I and II were detected in all bottom samples (except A2B and F303B which had no clade I) with relatively low abundance. The highest relative abundance of clade I was detected in F404B, reached 7.89%. Phylogenetic analysis of clade I rpoC1 sequences showed that OTU71 and OTU85 were affiliated with subclades IC and IA, respectively (Supplementary Figure S3). However, OTU25, which was the most abundant clade I OTU, did not group with reference sequences of reported subclades (Xia et al., 2017) (82%–86% nt identity to the subclades’ representative sequences and 99% to uncultured Synechococcus RFLP-type S14 (AJ584725.1)) and may belong to a novel subclade (Supplementary Figure S3).
The dissimilarity between surface and bottom Synechococcus communities was analyzed using SIMPER analysis (Figure 4). The lowest dissimilarity (20.96%) was detected at station F303, where water was well mixed. The dissimilarity in the stratified stations ranged from 40.32 to 95.97%. The highest dissimilarity occurred at station A6, which was mainly contributed by FS_I, FS_II and S5.2. FS_II and clade III were the major contributors of the dissimilarity at stations A10 and A14, where FS_II had higher relative abundance in the surface waters, while clade III were relatively more abundant in the bottom. S5.3, which was mainly distributed in the bottom waters, was also a major contributor to the dissimilarity at stations A12, A14, and F504.
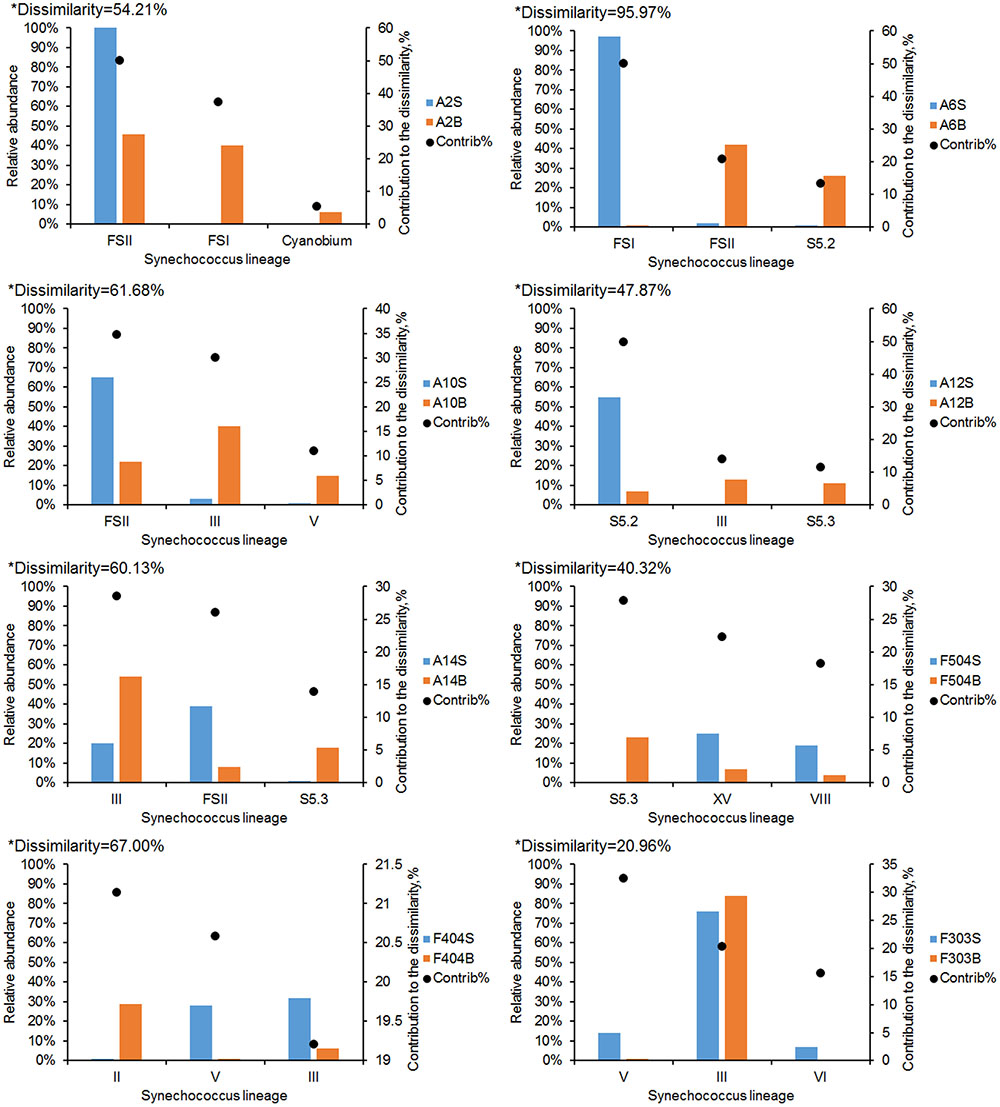
FIGURE 4. SIMPER analysis of the dissimilarity between Synechococcus communities in the surface and bottom waters in each station. Bar charts show the relative abundance of the three Synechococcus lineages that contributed most to the dissimilarity of communities. ∗The dissimilarity between the surface and bottom Synechococcus communities.
Spearman’s correlation coefficients were calculated between the Synechococcus lineages and environmental factors (Figure 5). Being significantly correlated to each other positively, clades I, II, XVI, CRD1, and S5.3 were inversely correlated with temperature and were mainly distributed in the bottom layer. Besides, freshwater Synechococcus FS_I was strongly negatively associated with salinity and positively related with nutrient concentrations, which was contrasting to clades III, IX, WPC1, and S5.3 which preferred high salinity and low NO3- environment. It was noted that the Synechococcus lineages with the highest relative abundance in the Pearl River estuary, clade III and freshwater Synechococcus (FS_I and FS_II), were negatively correlated to each other, which indicates an opposite distribution pattern. On the other hand, euryhaline Synechococcus S5.2 was highly positively correlated with Cyanobium, which suggests that they shared similar niches.
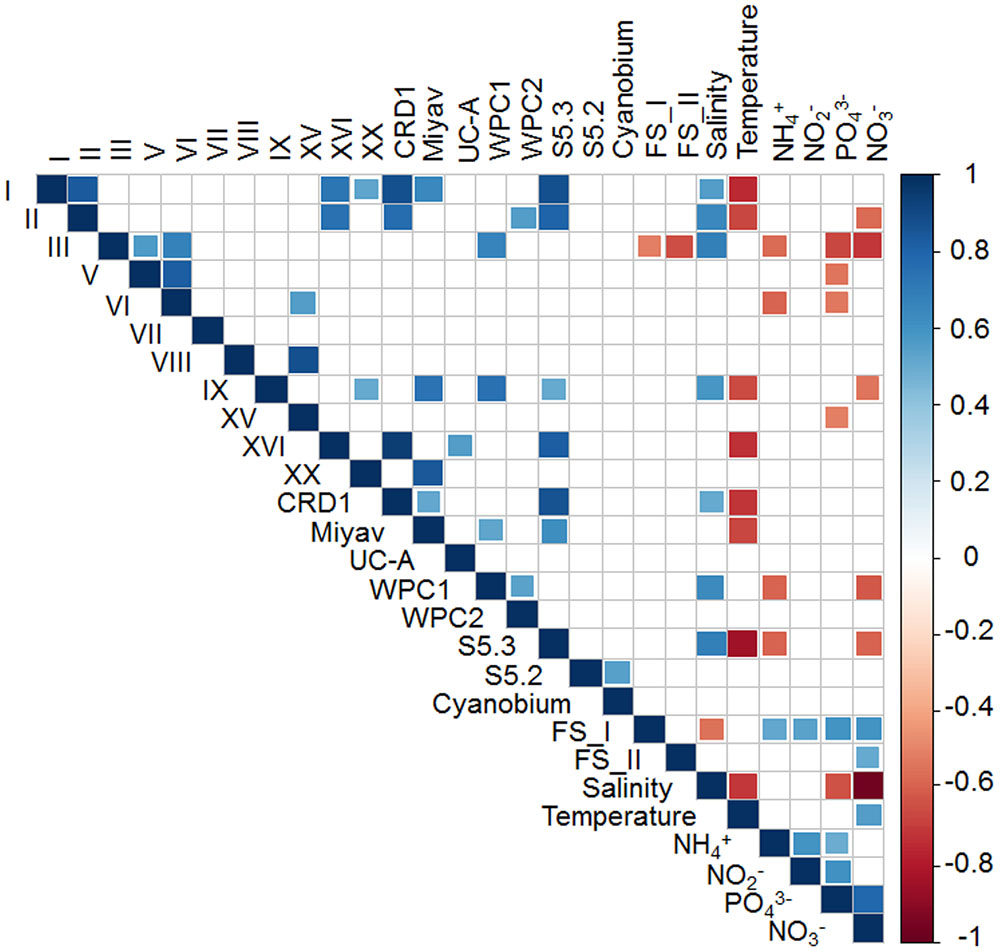
FIGURE 5. Spearman rank correlation between Synechococcus clades and environmental factors. Only significant correlations (P < 0.05) are shown.
Synechococcus Assemblage Harboring in the Surface and Bottom Waters had Different Pigment Compositions
Based on the successful amplification and sequencing of the cpcBA operon sequences from eight samples (the other samples did not amplify) (Supplementary Table S3), 4 well-separated clusters were formed in the phylogenetic tree (Supplementary Figure S4). Although type 1, 2, and 3b Synechococcus could be easily classified by the sequencing of cpcBA sequence, PUB containing Synechococcus type 3a, 3c, 3d, and 3f (recently defined by Mahmoud et al., 2017) could not be distinguished from each other (Supplementary Figure S4). Type 3 sequences from S5.3 formed a clade (hereafter named S5.3-Type 3) and were separated from the clade formed by those from S5.1 (hereafter named S5.1-Type 3). The phylogenetic tree also shows that most of the type 1 OTUs were affiliated with PS673 and PS676. Only 1 of the 40 most abundant OTUs was identified as S5.3-Type 3, which was mainly distributed in the bottom waters.
Distributed widely in the surface samples (Figure 6), proportion of type 1 decreased gradually while type 2 increased with increasing salinity. Only a small portion of Synechococcus detected was identified as type 3 at the stations of lowest salinity (A6S and A10S), comparing to more than 44.8% in the oceanic water (F303S). Besides, Synechococcus pigment compositions in the surface and bottom waters at the two stratified stations (A10 and F504) were remarkably different. While station A10B was dominated by S5.1-type 3 Synechococcus, A10S were mainly dominated by type 1 and type 2. Moreover, the relative abundance of type 3 Synechococcus was also greatly higher in the bottom than in the surface at station F504. S5.3-Type 3, which was not abundant in the surface waters, had higher relative abundance in the bottom water of stations A10 and F504. However, in well mixed station F303, similar Synechococcus pigment composition in the surface and bottom layers were detected, which were composed of more type 2 and 3 cells than type 1.
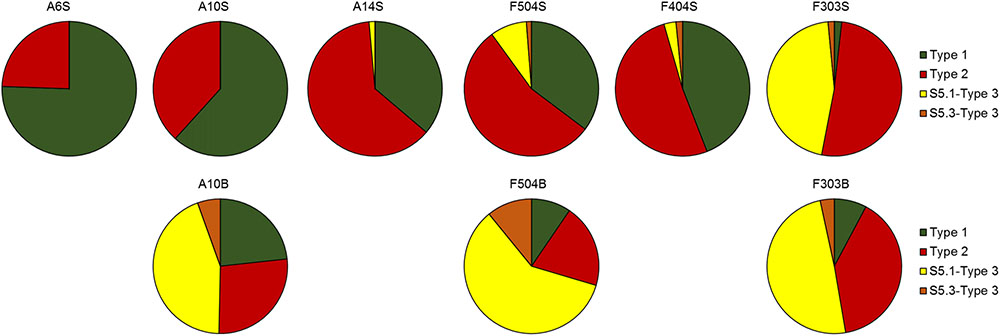
FIGURE 6. Synechococcus pigment compositions in the surface and bottom samples revealed by sequencing the cpcBA operon sequences.
Discussion
The abundance and diversity of Synechococcus were extensively studied in various marine environments, from oligotrophic open ocean to subtropical coastal and estuarine waters. However, none of the studies systematically reported the Synechococcus diversities in the salt wedge estuaries. Here, we used flow cytometric analysis and pyrosequencing method to assess the abundance, pigment diversity (based on the cpcBA operon) and taxonomic diversity (based on the rpoC1 gene) of Synechococcus in the Pearl River estuary, a typical salt wedge estuary in summer. Our results revealed that Synechococcus were highly abundant in this subtropical estuary, with a clear spatial variation in phylogenetic composition and pigment diversity along the surface salinity gradient, as well as between the surface and bottom waters.
Previous study has suggested that next generation sequencing methods with high sensitivity could yield more insights into the Synechococcus community composition than the traditional clone library method and flow cytometry approach (Xia et al., 2015). Consistently, in the present study, PC only Synechococcus were detected in all samples by using the pyrosequencing method while they could not be detected in some bottom samples by applying the flow cytometry approach. Moreover, using sequencing method, different pigment types and phylogenetic groups can be identified, providing more information about the composition of Synechococcus community.
Abundance of Synechococcus along the Salinity Gradient of River Plume
High abundance of Synechococcus (up to 2.5 × 10⁵ cells mL-1 in surface waters) was observed in the Pearl River estuary in July, which was higher than most other marine environments (Flombaum et al., 2013), suggesting that Synechococcus were important primary producers in the subtropical river-impacted coastal water (Qiu et al., 2010). Spatial variations in Synechococcus abundance and the distribution of Synechococcus groups observed in the Pearl River estuary (Figure 2) was consistent with the studies carried out in other estuaries, such as Chesapeake Bay (Wang et al., 2011) and Zuari estuary (Rajaneesh and Mitbavkar, 2013), which have also displayed increasing Synechococcus abundance along the salinity gradient. Low salinity (Wang et al., 2011; Rajaneesh and Mitbavkar, 2013; Xia et al., 2015) and light limitation (Harrison et al., 2008) could be the reasons of low Synechococcus abundance in the freshwater-dominated estuarine water.
Shifts in Phylogenetic Composition and Pigment Diversity of Synechococcus Assemblages Along the Salinity Gradient in Subtropical River-Estuary-Shelf
The phylogenetic compositions of Synechococcus assemblage (assessed using the rpoC1 gene) varied along the salinity gradient. It is not surprising that freshwater Synechococcus were dominant in the inner field of the estuary (A2S and A6S), where turbid river water reigns. However, it was shown in the phylogenetic analysis that most of the Synechococcus detected in these two samples belonged to two distinct OTUs, OTU2 and OTU3, which suggests the niche differentiation among subgroups of freshwater Synechococcus. Freshwater Synechococcus were also abundant in A10S, A12S, and A14S, of which the salinity ranged from 13.1 to 19.7 ppt. This observation contrasted with the study in the Chesapeake Bay, the largest estuary in the United States, where freshwater Synechococcus are rare (Chen et al., 2006). Apart from the freshwater Synechococcus, euryhaline Synechococcus S5.2, and Cyanobium were also abundant in the intermediate salinity water. Their preferences of higher salinity environments compared with the freshwater Synechococcus agreed with the finding of a previous study that S5.2 Synechococcus has a high ability to deal with low salinity stress but requires elevated salinity for growth (Wang et al., 2011). Co-occurrence of S5.2 and Cyanobium was also reported by a study conducted in Hong Kong water (Xia et al., 2015) and Baltic Sea blackish water (Celepli et al., 2017), suggesting the two Synechococcus lineages have similar physiological and ecological characteristics. However, the Spearman analysis did not show any strong correlation between the distribution of these two lineages and any measured environmental factors (Figure 5).
The proportion of S5.1 lineages increased with salinity (Figure 3). Celepli et al. (2017) reported that in the southern Baltic Sea, Synechococcus community transitioned from being dominated by euryhaline Synechococcus and Cyanobium to a mix of euryhaline and marine Synechococcus strains of S5.1 taking place at a salinity of 13–16 ppt. Similarly, our study showed that the transition occurred at salinity around 15 ppt in the Pearl River estuary (Figure 3). In the Baltic Sea coastal water, Synechococcus community is dominated by cold water clades I and IV, while the brackish and saline waters in the Pearl River estuary was widely dominated by the clade III. High relative abundance of clade III found in both the brackish and saline waters is consistent with the observation in the ECS (Choi et al., 2011; Xia et al., 2017). However, this is in contrast with the report in the Mediterranean Sea where clade III Synechococcus was mainly found in high salinity, oligotrophic, and phosphate-depleted water (Mella-Flores et al., 2011). The contrasting results observed by different studies were accounted by the fact that clade III contains several ecologically significant taxonomic units (ESTUs) with distinct niche preferences (Farrant et al., 2016). Furthermore, a strongly positive correlation of clade III and WPC1 (first found in the East China Sea and the Japan Sea (Choi and Noh, 2009)) was shown in the correlation analysis (Figure 5), which coincides with the finding of co-occurrence of clade III and WPC1 reported by previous studies (Choi et al., 2015; Xia et al., 2017). Besides that, clades V and VI, which overall distribution is not well understood, also co-occurred with clade III. Clades III, V and, VI and III were negatively related to nutrient concentrations, suggesting they have preferences of oceanic environment. Clade XV, which mainly occur between 30° and 35°N/S (Huang et al., 2012; Sudek et al., 2015) and in upwelling regions (Sohm et al., 2016), was also distributed in the surface of F504 with relatively high relative abundance. Although previous studies reported that clade II is the dominant clade in the tropical/subtropical warm water (Zwirglmaier et al., 2008), we found this clade not abundant in the Pearl River estuary and its adjacent coastal water. Low abundance of clade II in this area may be due to the fact that clade II has fewer regulators (Palenik et al., 2006) to adapt to such dynamic and highly variable estuary-shelf environment. As a single Synechococcus clade can possess different pigment types, it is impossible to identify pigment types based on housekeeping genes, such as 16S rRNA and rpoC1 (Haverkamp et al., 2009; Everroad and Wood, 2012; Xia et al., 2017). Instead, the analysis of cpcBA operon (encoding phycocyanin) and cpeBA operon (encoding phycoerythrin) were applied to study Synechococcus pigment diversity in marine environments. Using the cpeBA sequence, a recent study found four groups of Synechococcus pigment types: 2, 3a, 3dA and the combination of 3c and 3dB can be identified (Xia et al., 2017). However, this gene marker cannot be applied to identify PC-only Synechococcus because they do not have the cpeBA operon. Hence, in this study, we used the cpcBA operon for studying pigment diversity in the Pearl River estuary. Haverkamp et al. (2009) suggested that the high phylogenetic resolution provided by the cpcBA operon is useful to assess the microdiversity of Synechococcus strains. Phylogenetically, this gene marker is capable of differentiating type 1, 2 and type 3 Synechococcus, while subtypes of type 3 (3a, 3c, and 3d) cannot be distinguished (Supplementary Figure S4). Yet, we found that this gene marker allows us to assign type 3 to S5.1 or S5.3 (Supplementary Figure S4). Studies have reported that different Synechococcus pigment types often co-occur in a marine environment, while one phenotype generally predominates (Haverkamp et al., 2009). Consistently, we found co-occurrence of Synechococcus pigment types in our samples. Dominant pigment type shifted from type 1 to type 3 along the high turbid freshwater-dominated estuary to the shelf water, on top of the relatively abundant of the widely occurring type 2 Synechococcus across the whole study area. Such a distribution pattern supports the point that underwater light spectral properties have a strong selective pressure on Synechococcus populations (Vörös et al., 1998; Six et al., 2007; Stomp et al., 2007; Xia et al., 2017).
Markedly Different Synechococcus Assemblages Harboring in the Surface and Bottom Waters of the Salt Wedge Estuary
The partition of Synechococcus lineages along depth is not as strong as the horizontal scale in marine water (Zwirglmaier et al., 2008). Therefore, Synechococcus assemblage composition in the surface water is generally representing the community at lower depth (Sohm et al., 2016). Indeed, Synechococcus assemblage had similar compositions in the surface and deep layers of the oceanic station F303, where strong mixing occurred. However, the assemblage displayed vertical differentiation in the stratified water. The surface water, which was a mixture of freshwater and marine water, was characterized with low salinity and high nutrient (Harrison et al., 2008). This environment would favor the selection of euryhaline strains which have a higher requirement of nutrients. On the other hand, the deep layer features high salinity but relatively low nutrient marine water (Harrison et al., 2008) which is suitable for the growth of strictly marine Synechococcus. For example, in the surface water of A10 and A12 euryhaline S5.2 Synechococcus had high relative abundance, while S5.1 Synechococcus had high proportion in the bottom waters.
Interestingly, S5.3, a minor group in marine environments, was widely detected from the bottom layer of stratified stations. S5.3 has at least six clades and shows depth partitioning (Huang et al., 2012). S5.3-I, represented by RCC307, is mainly present in surface water layer, while S5.3-II, -IV, -V, and –VI prevail in the medium to low light layer (Huang et al., 2012). Based on the rpoC1 gene sequence, we found that S5.3 in the Pearl River estuary was not as diverse as in the open ocean and was abundant in the bottom layer (Supplementary Figure S2). Their distribution was significantly positively related to salinity while negatively correlated with temperature, NH4+ and NO3- (Figure 5). This is in agreement with Hashimoto et al.’s (2012) observation that S5.3 mainly occurs in deep waters. Apart from S5.3, we observed that clade I also widely occurred in the bottom layer where temperature could exceed 23°C. This is in contrast with the conclusion of previous studies that clade I is restricted in high latitude cold water (Zwirglmaier et al., 2008; Huang et al., 2012; Sohm et al., 2016). A recent study reported that clade I contains at least six subclades with different thermal preferences (Xia et al., 2017). Consistently, only warm water subclades, IA and IC (see Figure 8 in Xia et al., 2017), were detected in the Pearl River estuary (Supplementary Figure S3). Besides these two subclades, OTU25, the most abundant clade I OTU, did not cluster with all reported subclades (Xia et al., 2017), but formed another novel subclade (subclade IG) (Supplementary Figure S3). The fact that subclade IG, defined by this study, was mainly distributed in deep water may be the reason why this subclade has not previously been detected. Huang et al. also detected clade I in the South China Sea at relatively deep layers of 75 and 100 m depth with relatively high abundance by sequencing 16S-23S rRNA internal transcribed spacer (ITS) (Huang et al., 2012). This suggests that clade I may be globally distributed and some subclades are specifically distributed in the deep water of tropical/subtropical region.
Conclusion
The river-estuary-shelf continuum is a highly complex system, which provides a wide array of niches for a highly diverse Synechococcus assemblage ranging from freshwater Synechococcus to euryhaline and strictly marine Synechococcus. Our data suggest that Synechococcus lineages have markedly different abilities to deal with environmental variations. In the estuary, salinity is an important factor influencing the distribution of Synechococcus groups. More studies are needed to reveal the mechanisms involved in salinity tolerance. The fact that high abundance of clade III occurs in the brackish coastal water may revise our previous understanding that clade III prefers oligotrophic oceanic water. Our results further reveal that clade I and S5.3 contain subgroups that have different niches. Further studies should focus on isolation of Synechococcus strains from the studied area and the physiological traits of clades I, III, and S5.3 strains. Moreover, to uncover more details about the distribution of Synechococcus in the salt wedge estuary, high resolution sampling (both vertical and horizontal) need to be conducted in future studies.
Author Contributions
HL designed the experiment. XX and WG performed the experiments. Data were analyzed by XX in collaboration with WG and HL. XX and HL wrote the manuscript. ST attended the cruise and collected FM and DNA samples. All authors reviewed and approved the final version of the manuscript.
Funding
This study was funded by National Natural Science Foundation of China (NSFC) (41361164001), and partially supported by a grant from the Research Grants Council of the Hong Kong Special Administrative Region, China (Project No. T21/602/16). HL also acknowledge the support of RGC GRF 661813.
Conflict of Interest Statement
The authors declare that the research was conducted in the absence of any commercial or financial relationships that could be construed as a potential conflict of interest.
Acknowledgments
We are grateful to Ms. Candy Lee for analyzing flow cytometric data. Yanping Xu is greatly acknowledged for measuring the nutrients. We also thank Prof. Minhan Dai from Xiamen University for providing us opportunities to collect samples.
Supplementary Material
The Supplementary Material for this article can be found online at: http://journal.frontiersin.org/article/10.3389/fmicb.2017.01254/full#supplementary-material
Footnotes
- ^http://roscoff-culture-collection.org/strains/shortlists/taxonomic-groups/marine-synechococcus
- ^http://www.mothur.org/wiki/Download_mothur
- ^https://www.ncbi.nlm.nih.gov/
- ^http://roscoff-culture-collection.org/strains/shortlists/taxonomic-groups/marine-synechococcus
References
Ahlgren, N. A., Noble, A., Patton, A. P., Roache-Johnson, K., Jackson, L., Robinson, D., et al. (2014). The unique trace metal and mixed layer conditions of the Costa Rica upwelling dome support a distinct and dense community of Synechococcus. Limnol. Oceanogr. 59, 2166–2184. doi: 10.4319/lo.2014.59.6.2166
Ahlgren, N. A., and Rocap, G. (2006). Culture isolation and culture-independent clone libraries reveal new marine Synechococcus ecotypes with distinctive light and N physiologies. Appl. Environ. Microbiol. 72, 7193–7204. doi: 10.1128/AEM.00358-06
Callieri, C., and Stockner, J. G. (2002). Freshwater autotrophic picoplankton: a review. J. Limnol. 61, 1–14. doi: 10.4081/jlimnol.2002.1
Celepli, N., Sundh, J., Ekman, M., Dupont, C. L., Yooseph, S., Bergman, B., et al. (2017). Meta-omic analyses of Baltic Sea cyanobacteria: diversity, community structure and salt acclimation. Environ. Microbiol. 19, 673–686. doi: 10.1111/1462-2920.13592
Chen, F., Wang, K., Kan, J., Suzuki, M. T., and Wommack, K. E. (2006). Diverse and unique picocyanobacteria in Chesapeake Bay, revealed by 16S-23S rRNA internal transcribed spacer sequences. Appl. Environ. Microbiol. 72, 2239–2243. doi: 10.1128/AEM.72.3.2239-2243.2006
Choi, D. H., and Noh, J. H. (2009). Phylogenetic diversity of Synechococcus strains isolated from the East China Sea and the East Sea. FEMS Microbiol. Ecol. 69, 439–448. doi: 10.1111/j.1574-6941.2009.00729.x
Choi, D. H., Noh, J. H., Hahm, M.-S., and Lee, C. M. (2011). Picocyanobacterial abundances and diversity in surface water of the northwestern Pacific Ocean. Ocean Sci. J. 46, 265–271. doi: 10.1007/s12601-011-0020-0
Choi, D. H., Selph, K. E., and Noh, J. H. (2015). Niche partitioning of picocyanobacterial lineages in the oligotrophic northwestern Pacific Ocean. Algae 30, 223. doi: 10.4490/algae.2015.30.3.223
Chung, C. C., Gong, G. C., Huang, C. Y., Lin, J. Y., and Lin, Y. C. (2015). Changes in the Synechococcus assemblage composition at the surface of the East China Sea due to flooding of the Changjiang River. Microb. Ecol. 70, 677–688. doi: 10.1007/s00248-015-0608-5
Cowles, T., Desiderio, R., and Neuer, S. (1993). In situ characterization of phytoplankton from vertical profiles of fluorescence emission spectra. Mar. Biol. 115, 217–222. doi: 10.1007/BF00346338
Crosbie, N. D., Pöckl, M., and Weisse, T. (2003). Dispersal and phylogenetic diversity of nonmarine picocyanobacteria, inferred from 16S rRNA gene and cpcBA-intergenic spacer sequence analyses. Appl. Environ. Microbiol. 69, 5716–5721. doi: 10.1128/AEM.69.9.5716-5721.2003
Cuevas, L. A., and Morales, C. E. (2006). Nanoheterotroph grazing on bacteria and cyanobacteria in oxic and suboxic waters in coastal upwelling areas off northern Chile. J. Plankton Res. 28, 385–397. doi: 10.1093/plankt/fbi124
Dai, M., Wang, L., Guo, X., Zhai, W., Li, Q., He, B., et al. (2008). Nitrification and inorganic nitrogen distribution in a large perturbed river/estuarine system: the Pearl River Estuary, China. Biogeosciences 5, 1545–1585. doi: 10.5194/bg-5-1227-2008
Everroad, R. C., and Wood, A. M. (2012). Phycoerythrin evolution and diversification of spectral phenotype in marine Synechococcus and related picocyanobacteria. Mol. Phylogenet. Evol. 64, 381–392. doi: 10.1016/j.ympev.2012.04.013
Farrant, G. K., Doré, H., Cornejo-Castillo, F. M., Partensky, F., Ratin, M., Ostrowski, M., et al. (2016). Delineating ecologically significant taxonomic units from global patterns of marine picocyanobacteria. Proc. Natl. Acad. Sci. U.S.A. 113, E3365–E3374. doi: 10.1073/pnas.1524865113
Flombaum, P., Gallegos, J. L., Gordillo, R. A., Rincón, J., Zabala, L. L., Jiao, N., et al. (2013). Present and future global distributions of the marine Cyanobacteria Prochlorococcus and Synechococcus. Proc. Natl. Acad. Sci. U.S.A. 110, 9824–9829. doi: 10.1073/pnas.1307701110
Fuller, N. J., Marie, D., Partensky, F., Vaulot, D., Post, A. F., and Scanlan, D. J. (2003). Clade-specific 16S ribosomal DNA oligonucleotides reveal the predominance of a single marine Synechococcus clade throughout a stratified water column in the Red Sea. Appl. Environ. Microbiol. 69, 2430–2443. doi: 10.1128/AEM.69.5.2430-2443.2003
Glover, H., Campbell, L., and Prezelin, B. (1986). Contribution of Synechococcus spp. to size-fractioned primary productivity in three water masses in the Northwest Atlantic Ocean. Mar. Biol. 91, 193–203. doi: 10.1007/BF00569435
Hall, T. A. (1999). BioEdit: a user-friendly biological sequence alignment editor and analysis program for Windows 95/98/NT. Nucleic Acids Symp. Ser. 41, 95–98.
Harrison, P. J., Yin, K., Lee, J. H. W., Gan, J., and Liu, H. (2008). Physical–biological coupling in the Pearl River Estuary. Cont. Shelf Res. 28, 1405–1415. doi: 10.1016/j.csr.2007.02.011
Hashimoto, R., Yoshida, T., Kuno, S., Nishikawa, T., and Sako, Y. (2012). The first assessment of cyanobacterial and diazotrophic diversities in the Japan Sea. Fish. Sci. 78, 1293–1300. doi: 10.1007/s12562-012-0548-7
Haverkamp, T., Acinas, S. G., Doeleman, M., Stomp, M., Huisman, J., and Stal, L. J. (2008). Diversity and phylogeny of Baltic Sea picocyanobacteria inferred from their ITS and phycobiliprotein operons. Environ. Microbiol. 10, 174–188. doi: 10.1111/j.1462-2920.2007.01442.x
Haverkamp, T., Schouten, D., Doeleman, M., Wollenzien, U., Huisman, J., and Stal, L. J. (2009). Colorful microdiversity of Synechococcus strains (picocyanobacteria) isolated from the Baltic Sea. ISME J. 3, 397–408. doi: 10.1038/ismej.2008.118
Herdman, M., Castenholz, R., Waterbury, J., and Rippka, R. (2001). “Form-genus XIII. Synechococcus,” in Bergey’s Manual of Systematic Bacteriology, eds D. R. Boone and R. W. Castenholz (New York, NY: Springer).
Huang, S., Wilhelm, S. W., Harvey, H. R., Taylor, K., Jiao, N., and Chen, F. (2012). Novel lineages of Prochlorococcus and Synechococcus in the global oceans. ISME J. 6, 285–297. doi: 10.1038/ismej.2011.106
Korlević, M., Šupraha, L., Ljubešić, Z., Henderiks, J., Ciglenečki, I., Dautović, J., et al. (2016). Bacterial diversity across a highly stratified ecosystem: a salt-wedge Mediterranean estuary. Syst. Appl. Microbiol. 39, 398–408. doi: 10.1016/j.syapm.2016.06.006
Kuosa, H. (1991). Picoplanktonic algae in the northern Baltic Sea: seasonal dynamics and flagellate grazing. Mar. Ecol. Prog. Ser. 73, 269–276. doi: 10.3354/meps073269
Letunic, I., and Bork, P. (2007). Interactive Tree Of Life (iTOL): an online tool for phylogenetic tree display and annotation. Bioinformatics 23, 127–128. doi: 10.1093/bioinformatics/btl529
Li, W. K. (1998). Annual average abundance of heterotrophic bacteria and Synechococcus in surface ocean waters. Limnol. Oceanogr. 43, 1746–1753. doi: 10.4319/lo.1998.43.7.1746
Liu, H., Jing, H., Wong, T. H., and Chen, B. (2014). Co-occurrence of phycocyanin- and phycoerythrin-rich Synechococcus in subtropical estuarine and coastal waters of Hong Kong. Environ. Microbiol. Rep. 6, 90–99. doi: 10.1111/1758-2229.12111
Mahmoud, R. M., Sanfilippo, J. E., Nguyen, A. A., Strnat, J. A., Partensky, F., Garczarek, L., et al. (2017). Adaptation to blue light in marine Synechococcus requires MpeU, an enzyme with similarity to phycoerythrobilin lyase isomerases. Front. Microbiol. 8:243. doi: 10.3389/fmicb.2017.00243
Mazard, S., Ostrowski, M., Partensky, F., and Scanlan, D. J. (2012). Multi-locus sequence analysis, taxonomic resolution and biogeography of marine Synechococcus. Environ. Microbiol. 14, 372–386. doi: 10.1111/j.1462-2920.2011.02514.x
Mella-Flores, D., Mazard, S., Humily, F., Partensky, F., Mahé, F., Bariat, L., et al. (2011). Is the distribution of Prochlorococcus and Synechococcus ecotypes in the Mediterranean Sea affected by global warming? Biogeosciences 8, 2785–2804. doi: 10.5194/bg-8-2785-2011
Mühling, M., Fuller, N. J., Somerfield, P. J., Post, A. F., Wilson, W. H., Scanlan, D. J., et al. (2006). High resolution genetic diversity studies of marine Synechococcus isolates using rpoC1-based restriction fragment length polymorphism. Aquat. Microb. Ecol. 45, 263–275. doi: 10.3354/ame045263
Olson, R. J., Chisholm, S. W., Zettler, E. R., and Armbrust, E. (1988). Analysis of Synechococcus pigment types in the sea using single and dual beam flow cytometry. Deep Sea Res. Part A Oceanogr. Res. Pap. 35, 425–440. doi: 10.1016/0198-0149(88)90019-2
Olson, R. J., Chisholm, S. W., Zettler, E. R., and Armbrust, E. (1990). Pigments, size, and distributions of Synechococcus in the North Atlantic and Pacific Oceans. Limnol. Oceanogr. 35, 45–58. doi: 10.4319/lo.1990.35.1.0045
Palenik, B., Ren, Q., Dupont, C. L., Myers, G. S., Heidelberg, J. F., Badger, J. H., et al. (2006). Genome sequence of Synechococcus CC9311: insights into adaptation to a coastal environment. Proc. Natl. Acad. Sci. U.S.A. 103, 13555–13559. doi: 10.1073/pnas.0602963103
Partensky, F., Blanchot, J., and Vaulot, D. (1999). Differential distribution and ecology of Prochlorococcus and Synechococcus in oceanic waters: a review. Bull. Inst. Oceanogr. 19, 457–475.
Pittera, J., Humily, F., Thorel, M., Grulois, D., Garczarek, L., and Six, C. (2014). Connecting thermal physiology and latitudinal niche partitioning in marine Synechococcus. ISME J. 8, 1221–1236. doi: 10.1038/ismej.2013.228
Qiu, D., Huang, L., Zhang, J., and Lin, S. (2010). Phytoplankton dynamics in and near the highly eutrophic Pearl River Estuary, South China Sea. Cont. Shelf Res. 30, 177–186. doi: 10.1016/j.marpolbul.2011.01.018
Rajaneesh, K., and Mitbavkar, S. (2013). Factors controlling the temporal and spatial variations in Synechococcus abundance in a monsoonal estuary. Mar. Environ. Res. 92, 133–143. doi: 10.1016/j.marenvres.2013.09.010
Saito, M. A., Rocap, G., and Moffett, J. W. (2005). Production of cobalt binding ligands in a Synechococcus feature at the Costa Rica upwelling dome. Limnol. Oceanogr. 50, 279–290. doi: 10.4319/lo.2005.50.1.0279
Sarmento, H., Unrein, F., Isumbisho, M., Stenuite, S., Gasol, J. M., and Descy, J.-P. (2008). Abundance and distribution of picoplankton in tropical, oligotrophic Lake Kivu, eastern Africa. Freshw. Biol. 53, 756–771. doi: 10.1111/j.1365-2427.2007.01939.x
Scanlan, D. J., and West, N. J. (2002). Molecular ecology of the marine cyanobacterial genera Prochlorococcus and Synechococcus. FEMS Microbiol. Ecol. 40, 1–12. doi: 10.1111/j.1574-6941.2002.tb00930.x
Schloss, P. D., Westcott, S. L., Ryabin, T., Hall, J. R., Hartmann, M., Hollister, E. B., et al. (2009). Introducing mothur: open-source, platform-independent, community-supported software for describing and comparing microbial communities. Appl. Environ. Microbiol. 75, 7537–7541. doi: 10.1128/AEM.01541-09
Six, C., Thomas, J.-C., Garczarek, L., Ostrowski, M., Dufresne, A., Blot, N., et al. (2007). Diversity and evolution of phycobilisomes in marine Synechococcus spp.: a comparative genomics study. Genome Biol. 8, R259. doi: 10.1186/gb-2007-8-12-r259
Sohm, J. A., Ahlgren, N. A., Thomson, Z. J., Williams, C., Moffett, J. W., Saito, M. A., et al. (2016). Co-occurring Synechococcus ecotypes occupy four major oceanic regimes defined by temperature, macronutrients and iron. ISME J. 10, 333–345. doi: 10.1038/ismej.2015.115
Stomp, M., Huisman, J., Stal, L. J., and Matthijs, H. C. (2007). Colorful niches of phototrophic microorganisms shaped by vibrations of the water molecule. ISME J. 1, 271–282. doi: 10.1038/ismej.2007.59
Sudek, S., Everroad, R. C., Gehman, A. L. M., Smith, J. M., Poirier, C. L., Chavez, F. P., et al. (2015). Cyanobacterial distributions along a physico-chemical gradient in the Northeastern Pacific Ocean. Environ. Microbiol. 17, 3692–3707. doi: 10.1111/1462-2920.12742
Tamura, K., Stecher, G., Peterson, D., Filipski, A., and Kumar, S. (2013). MEGA6: molecular evolutionary genetics analysis version 6.0. Mol. Biol. Evol. 30, 2725–2729. doi: 10.1093/molbev/mst197
Tetu, S. G., Brahamsha, B., Johnson, D. A., Tai, V., Phillippy, K., Palenik, B., et al. (2009). Microarray analysis of phosphate regulation in the marine cyanobacterium Synechococcus sp. WH8102. ISME J. 3, 835–849. doi: 10.1038/ismej.2009.31
Thompson, J. D., Gibson, T., and Higgins, D. G. (2002). Multiple sequence alignment using ClustalW and ClustalX. Curr. Protoc. Bioinformatics 2.3, 2.3.1–2.3.22. doi: 10.1002/0471250953.bi0203s00
Veldhuis, M. J., and Kraay, G. W. (1993). Cell abundance and fluorescence of picoplankton in relation to growth irradiance and nitrogen availability in the Red Sea. Neth. J. Sea Res. 31, 135–145. doi: 10.1016/0077-7579(93)90003-B
Vörös, L., Callieri, C., Katalin, V., and Bertoni, R. (1998). “Freshwater picocyanobacteria along a trophic gradient and light quality range,” in Phytoplankton and Trophic Gradients, eds M. A. Cobelas, C. S. Reynolds, P. S. Castillo, and J. Kristiansen (Dordrecht: Springer), 117–125. doi: 10.1023/A:1017026700003
Wang, K., Wommack, K. E., and Chen, F. (2011). Abundance and distribution of Synechococcus spp. and cyanophages in the Chesapeake Bay. Appl. Environ. Microbiol. 77, 7459–7468. doi: 10.1128/AEM.00267-11
Wood, A. M., Phinney, D. A., and Yentsch, C. S. (1998). Water column transparency and the distribution of spectrally distinct forms of phycoerythrin-containing organisms. Mar. Ecol. Prog. Ser. 162, 25–31. doi: 10.3354/meps162025
Xia, X., Partensky, F., Garczarek, L., Suzuki, K., Guo, C., Yan Cheung, S., et al. (2017). Phylogeography and pigment type diversity of Synechococcus cyanobacteria in surface waters of the northwestern Pacific Ocean. Environ. Microbiol. 19, 142–158. doi: 10.1111/1462-2920.13541
Xia, X., Vidyarathna, N. K., Palenik, B., Lee, P., and Liu, H. (2015). Comparison of the seasonal variations of Synechococcus assemblage structures in estuarine waters and coastal waters of Hong Kong. Appl. Environ. Microbiol. 81, 7644–7655. doi: 10.1128/AEM.01895-15
Zwirglmaier, K., Jardillier, L., Ostrowski, M., Mazard, S., Garczarek, L., Vaulot, D., et al. (2008). Global phylogeography of marine Synechococcus and Prochlorococcus reveals a distinct partitioning of lineages among oceanic biomes. Environ. Microbiol. 10, 147–161. doi: 10.1111/j.1462-2920.2007.01440.x
Keywords: salt wedge estuary, pyrosequencing, rpoC1 gene, cpcBA operon, salinity gradient
Citation: Xia X, Guo W, Tan S and Liu H (2017) Synechococcus Assemblages across the Salinity Gradient in a Salt Wedge Estuary. Front. Microbiol. 8:1254. doi: 10.3389/fmicb.2017.01254
Received: 30 March 2017; Accepted: 21 June 2017;
Published: 06 July 2017.
Edited by:
Hongyue Dang, Xiamen University, ChinaReviewed by:
Yonghui Zeng, Aarhus University, DenmarkHanna Maria Farnelid, Linnaeus University, Sweden
Copyright © 2017 Xia, Guo, Tan and Liu. This is an open-access article distributed under the terms of the Creative Commons Attribution License (CC BY). The use, distribution or reproduction in other forums is permitted, provided the original author(s) or licensor are credited and that the original publication in this journal is cited, in accordance with accepted academic practice. No use, distribution or reproduction is permitted which does not comply with these terms.
*Correspondence: Hongbin Liu, liuhb@ust.hk Xiaomin Xia, xxia@connect.ust.hk