 Inmaculada Tomás1*
 Alba Regueira-Iglesias1
 Maria López2
 Nora Arias-Bujanda1
 Lourdes Novoa1
 Carlos Balsa-Castro1
 Maria Tomás2*
- 1Oral Sciences Research Group, Department of Surgery and Medical Surgical Specialties, School of Medicine and Dentistry, Universidade de Santiago de Compostela, Health Research Institute of Santiago (IDIS), Santiago de Compostela, Spain
- 2Department of Microbiology, Complejo Hospitalario Universitario A Coruña-Instituto de Investigación Biomédica de A Coruña, A Coruña, Spain
Currently, there is little evidence available on the development of predictive models for the diagnosis or prognosis of chronic periodontitis based on the qPCR quantification of subgingival pathobionts. Our objectives were to: (1) analyze and internally validate pathobiont-based models that could be used to distinguish different periodontal conditions at site-specific level within the same patient with chronic periodontitis; (2) develop nomograms derived from predictive models. Subgingival plaque samples were obtained from control and periodontal sites (probing pocket depth and clinical attachment loss <4 mm and >4 mm, respectively) from 40 patients with moderate-severe generalized chronic periodontitis. The samples were analyzed by qPCR using TaqMan probes and specific primers to determine the concentrations of Actinobacillus actinomycetemcomitans (Aa), Fusobacterium nucleatum (Fn), Parvimonas micra (Pm), Porphyromonas gingivalis (Pg), Prevotella intermedia (Pi), Tannerella forsythia (Tf), and Treponema denticola (Td). The pathobiont-based models were obtained using multivariate binary logistic regression. The best models were selected according to specified criteria. The discrimination was assessed using receiver operating characteristic curves and numerous classification measures were thus obtained. The nomograms were built based on the best predictive models. Eight bacterial cluster-based models showed an area under the curve (AUC) ≥0.760 and a sensitivity and specificity ≥75.0%. The PiTfFn cluster showed an AUC of 0.773 (sensitivity and specificity = 75.0%). When Pm and AaPm were incorporated in the TdPiTfFn cluster, we detected the two best predictive models with an AUC of 0.788 and 0.789, respectively (sensitivity and specificity = 77.5%). The TdPiTfAa cluster had an AUC of 0.785 (sensitivity and specificity = 75.0%). When Pm was incorporated in this cluster, a new predictive model appeared with better AUC and specificity values (0.787 and 80.0%, respectively). Distinct clusters formed by species with different etiopathogenic role (belonging to different Socransky’s complexes) had a good predictive accuracy for distinguishing a site with periodontal destruction in a periodontal patient. The predictive clusters with the lowest number of bacteria were PiTfFn and TdPiTfAa, while TdPiTfAaFnPm had the highest number. In all the developed nomograms, high concentrations of these clusters were associated with an increased probability of having a periodontal site in a patient with chronic periodontitis.
Introduction
Periodontal diseases are among the most common conditions affecting human beings (Dentino et al., 2013). In 2010, severe periodontitis was estimated to be the sixth most prevalent disease globally, affecting 743 million people worldwide and with an age-standardized incidence of 701 cases per 100,000 person-years (Kassebaum et al., 2014). Periodontitis is an inflammatory condition of the gingivae. It causes the destruction of the ligament and alveolar bone supporting the teeth, resulting in oral malodour and tooth loss (Dentino et al., 2013). In addition to its impact on the oral health status and quality of life of patients (Shanbhag et al., 2012; Al-Harthi et al., 2013), periodontitis is currently being connected bidirectionally to the pathogenesis of various systemic diseases and conditions such as diabetes (Chapple et al., 2013), coronary heart disease (Tonetti et al., 2013), rheumatoid arthritis (de Pablo et al., 2009), respiratory diseases (Bansal et al., 2013), and dementia (Abbayya et al., 2015).
Although traditional clinical measures are informative for evaluating the severity of periodontitis and the response to therapy (Korte and Kinney, 2016), these clinical criteria are only partially able to determine current disease activity or the future risk of structure loss (Giannobile et al., 2009; Zhang et al., 2009). As a result, one of the major challenges in the field of periodontology is to determine biomarkers for screening and predicting the early onset of periodontitis or evaluating disease activity and the efficacy of therapy (diagnostic or prognostic tests) (Zhang et al., 2009; Buduneli and Kinane, 2011).
Periodontal diseases are multifactorial in origin; their initiation and progression require the involvement of several factors, including bacteria that contribute to the formation of a polymicrobial biofilm at the subgingival level. Consequently, periodontal microbiology has been an area of intense research for decades (Teles et al., 2013).
In order to overcome the well-known limitations of bacterial cultures, a series of molecular techniques were developed, including DNA hybridization and the polymerase chain reaction (PCR) (Socransky et al., 1998; Loomer, 2004). Socransky et al. (1998) used genomic hybridization techniques to identify three species that were strongly associated with the clinical parameters of chronic periodontitis: Treponema denticola, Porphyromonas gingivalis, and Tannerella forsythia. These species together constituted the so-called ‘Red Complex.’ This complex was related to other bacteria such as Fusobacterium nucleatum, Prevotella intermedia, Prevotella nigrescens, Peptostreptococcus micros (Parvimonas micra), Campylobacter rectus, Campylobacter showae, Campylobacter gracilis, Eubacterium nodatum, Streptococcus constellatus, and Fusobacterium periodonticum. All of these species formed the ‘Orange Complex.’
Quantitative PCR, qPCR or real-time PCR are variants of the conventional PCR technique that is used to amplify and simultaneously quantify the amplification product obtained from a sample (Sakamoto et al., 2005). There are several studies in the scientific literature in which the diagnostic accuracy of the qPCR technique in samples from healthy subjects and periodontitis patients was assessed using the conventional bacterial culture as a reference (Boutaga et al., 2005, 2006, 2007; Jervoe-Storm et al., 2005; Atieh, 2008; Kotsilkov et al., 2015). The conclusion that can be drawn from these investigations is that the qPCR is a sensitive and specific method which has a high positive predictive value (PPV) when it comes to the detection of target bacteria (Boutaga et al., 2005, 2006, 2007; Jervoe-Storm et al., 2005; Atieh, 2008; Kotsilkov et al., 2015). In fact, Atieh (2008) performed a meta-analysis in 2008 in which it was demonstrated that this molecular technique is associated with a high diagnostic accuracy in detecting (specifically) Aggregatibacter actinomycetemcomitans and P. gingivalis compared to conventional cultures.
Until now, research on periodontal microbiology using qPCR has focused on the study of periopathogens such as: A. actinomycetemcomitans, P. gingivalis, T. forsythia, P. intermedia, T. denticola, F. nucleatum, and P. micra (Braga et al., 2010; Saygun et al., 2011; Decat et al., 2012; Polonyi et al., 2013; Gatto et al., 2014; Kinney et al., 2014; Al-hebshi et al., 2015; Kotsilkov et al., 2015; Milne et al., 2015; Scapoli et al., 2015; Torrungruang et al., 2015; Golynska et al., 2016). In most of these q-PCR studies, the authors applied a ‘simple analytical approach’ consisting of univariate comparisons of the periopathogen levels quantified in different periodontal conditions (Braga et al., 2010; Polonyi et al., 2013; Kotsilkov et al., 2015; Milne et al., 2015; Scapoli et al., 2015; Golynska et al., 2016). As a result, there are very few studies based on a multivariate modeling approach (Saygun et al., 2011; Gatto et al., 2014; Kinney et al., 2014; Al-hebshi et al., 2015; Torrungruang et al., 2015).
Consequently, when assuming that chronic periodontitis is orchestrated by a bacterial consortium rather than by a single pathogen (Teles et al., 2013), further evidence is required on the development of predictive models for diagnosing periodontitis or its prognosis based on the qPCR quantification of subgingival pathobionts using appropriate multivariate analytical techniques. Accordingly, the objectives of the present cross-sectional study (paired design) were to:
(1) Compare the detection frequencies and levels of seven well-known pathobionts detected in subgingival sites with different periodontal conditions (control site vs. periodontal site) within the same patient with chronic periodontitis.
(2) Obtain pathobiont-based predictive models that could be used to distinguish different periodontal conditions at site-specific level within the same periodontal patient.
(3) Develop nomograms derived from pathobiont-based predictive models.
Materials and Methods
Selection of Study Group and Clinical Examination
A total of 40 subjects affected by moderate to severe generalized chronic periodontitis were recruited among consecutive patients who were referred between 2014 and 2016 to the Periodontology and Patients with Special Needs units at the School of Medicine and Dentistry (Universidade de Santiago de Compostela, Spain) for an assessment of their oral health status. Patients were selected if they fulfilled the following inclusion criteria: (1) age 30 to 65 years; (2) good general health, no pregnancy or breastfeeding; (3) no intake of systemic antimicrobials during the previous 6 months; (4) no intake of antiinflammatory medication in the previous 4 months; (5) no routine use of oral antiseptics; (6) no presence of implants or orthodontic appliances; (7) no previous periodontal treatment; and (8) the presence of at least 18 natural teeth.
Two experienced dentists and previously calibrated performed all the periodontal diagnoses. The probing pocket depth (PPD) and clinical attachment loss (CAL) (=PPD+ gingival recession) were recorded throughout the mouth on six sites per tooth (excluding third molars) using a PCP-UNC 15 probe. Bleeding on probing (BOP) and bacterial plaque levels (BPL) were recorded for the full mouth on a binary scale (presence/absence) on six sites per tooth. Standardized radiographs of all teeth were obtained to assess the alveolar bone status. Patients were diagnosed as suffering from moderate to severe generalized chronic periodontitis based on the previously established criteria (Armitage, 1999; Page and Eke, 2007). Smoking status was also recorded (Figure 1).
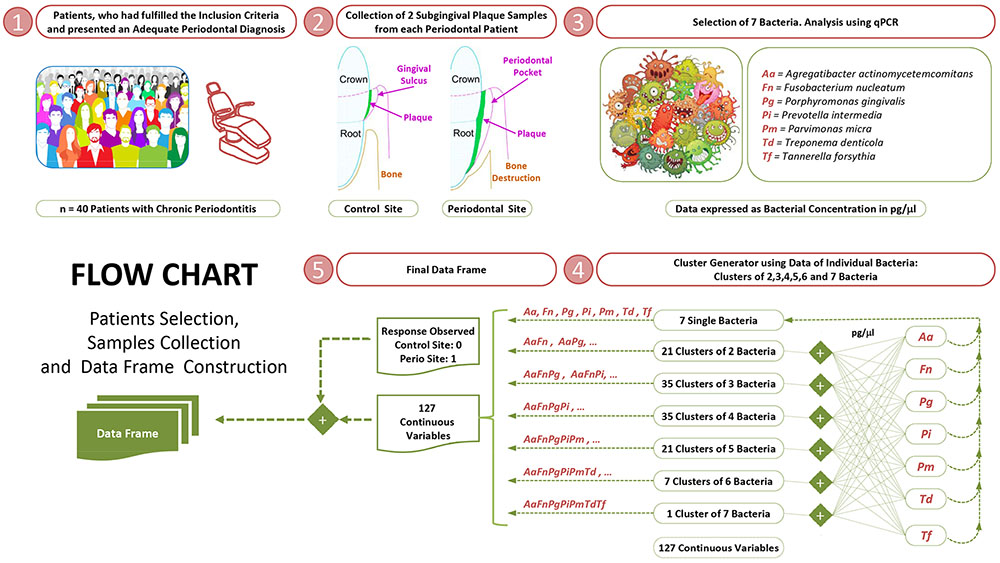
FIGURE 1. Selection of study groups, collection of subgingival samples and construction of dataframe.
Patients who agreed to participate in the study provided their written informed consent. The study protocol was approved by the Ethics Committee of Clinical Investigations of Galicia (registration number 2015/006). The ‘transparent reporting of a multivariable prediction model for individual prognosis or diagnosis’ (TRIPOD) guidelines were considered (Moons et al., 2015).
Collection of Subgingival Plaque Samples
Control and periodontal sites were defined within the same periodontal patient as follows: (1) the control sites had a PPD and CAL <4 mm and no radiographic evidence of alveolar bone loss; and (2) the periodontal sites had a PPD and CAL >4 mm and radiographic evidence of bone loss (Figure 1).
All the subgingival plaque samples were collected in the afternoon, approximately 5–7 h after toothbrushing. The samples were obtained from both a control site and a periodontal site (two or three adjacent locations in each site) in each periodontal patient by inserting a total of five sterile endodontic paper points into each location (size 30) for 10 s following isolation and supragingival plaque removal. The samples were placed in 1.5 ml microcentrifuge tubes with 300 μl of a phosphate buffer and frozen at -80°C until further analysis.
DNA Extraction and qPCR
Two investigators blinded to the clinical data performed the bacterial analyses by qPCR. The bacteria were separated from the paper points before the DNA extraction by washing with 500 μL of a phosphate buffer solution and vortexing. DNA extraction from the samples was performed in the MagNA Pure Compact Instrument (Roche, Germany) following the manufacturer’s instructions. We used it in combination with the MagNA Pure Bacteria Lysis Buffer (Roche) and the DNA Bacteria purification protocol (Roche) to work with the bacterial DNA isolated from subgingival plaque samples.
The levels of seven pathobionts were quantified: A. actinomycetemcomitans (Aa); F. nucleatum (Fn); P. micra (Pm); P. gingivalis (Pg); P. intermedia (Pi); T. forsythensis (Tf); and T. denticola (Td). Real-time PCR (LightCycler®480 system, Roche) was performed using TaqMan probes (Universal Probe Library, Roche) and primers were designed to amplify specific target genes from each bacterium (Table 1) (Fernández-Pinero et al., 2013; Fraczyk et al., 2016). The specificity of the probes was analyzed among all the bacteria from this study. We worked with uracil-N-glycosylase, Cod-UNG (ArcticZymes, Norway) (Bou et al., 2014) to remove contaminating amplicons from the previous qPCR. To confirm this, we used the water from the reaction of the qPCR as a negative control (Champlot et al., 2010).
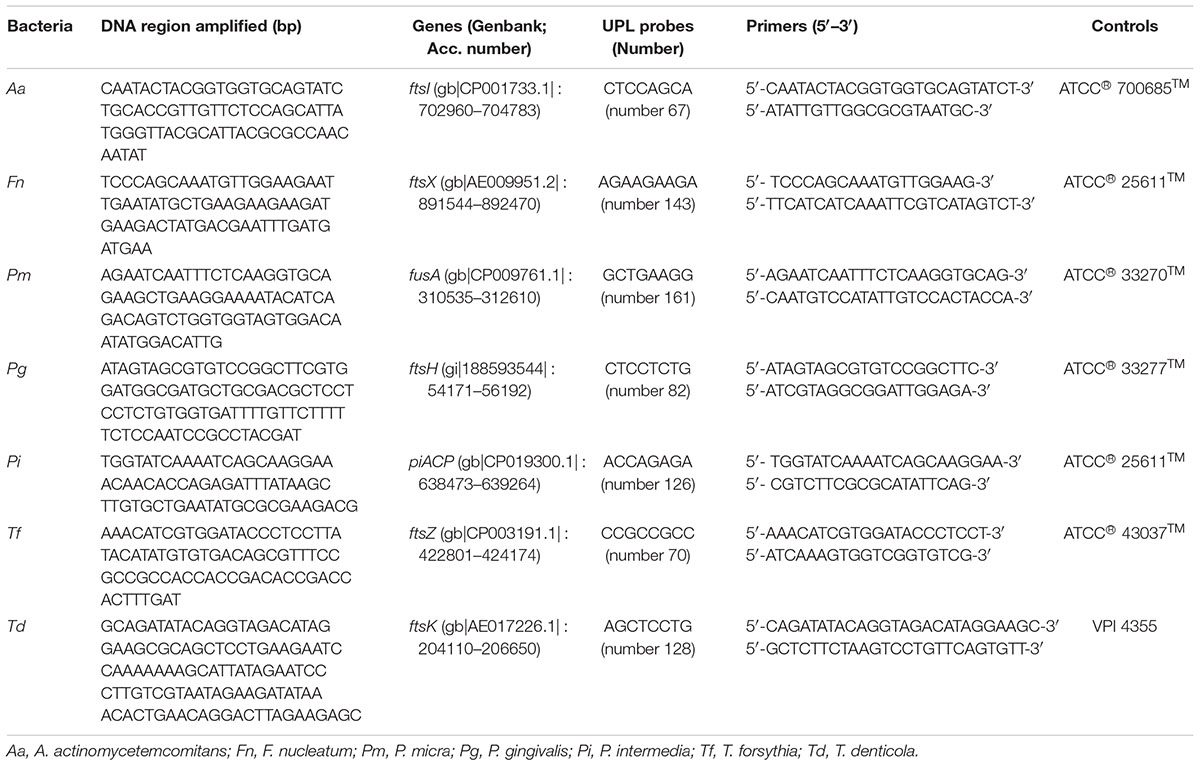
TABLE 1. DNA regions amplified, the targeted gene name, TaqMan probes and primers used in the present study for the detection of the seven bacteria analyzed.
Absolute quantification of the DNA was performed using the standard curve method. A standard dilution series of known amounts of genomic DNA (from 100 pg to 1 fg) were assessed in the same assay. Cp-values obtained from these standards were used to generate a standard curve from which the amount of DNA in the unknown samples was calculated. Each standard contained the same target region that was amplified in the sample. Strains from each microorganism, obtained from the ATCC Bacteriology Collection, were used both to generate the standard curves and as positive controls. A regression analysis was performed to obtain the equation used to interpolate the Cp-values from healthy and diseased sites and thus quantify the corresponding concentrations of genomic DNA of each pathobiont in each sample (pg/μl). The value of R2 was used as a measure of the goodness-of-fit of the regression analysis.
Statistical Analysis
The unit of analysis in the study was the sampled subgingival site. The ‘a priori’ sample size calculation was performed using the program G∗Power 3.1.5 (Faul et al., 2007). The following statistical criteria were established: (1) an effect size of 0.5 for bacterial concentrations between the control and periodontal sites; (2) an alpha error of 0.05; and (3) a statistical power of 90%. A sample size of 36 subjects was required on the basis of these criteria and the application of the Wilcoxon test to evaluate the differential bacterial concentrations.
The independent variables were: (1) the quantitative levels of the species individually (7 variables); and (2) due to its biological significance, the quantitative levels of all possible bacterial clusters (120 variables) (Figure 1) (Supplementary Data Sheet S1). The statistical analyses were performed using the R software (R Core Team, 2016).
Univariate Analysis of the Detection Frequencies and Levels of Pathobionts in Relation to the Severity of Chronic Periodontitis: Control Sites vs. Periodontal Sites
Contingency tables were used and the McNemar test was applied to compare the detection frequencies between the control and periodontal sites. The Shapiro–Wilk test was performed to analyze the distribution of the quantitative variables. As the clinical parameters associated with chronic periodontitis, as well as the subgingival concentrations of the pathobionts, showed a non-normal distribution, the contrast between the two types of subgingival site (control vs. periodontal) was determined using the Wilcoxon test.
The Student’s t-test or Mann–Whitney U test for quantitative variables (according to the type of distribution of variables) and the Fisher’s exact test for categorical variables were used to compare the clinical characteristics between smokers and non-smokers. The influence of smoking (smokers vs. non-smokers) in the detection frequencies and bacterial concentrations for each type of subgingival site were studied using the Fisher’s exact test and the Mann–Whitney U test, respectively.
The Benjamini–Hochberg correction was applied to control the false discovery rate (FDR) (Benjamini and Hochberg, 1995) in the comparative analysis, establishing a Q parameter of 0.05, which corresponds to a FDR < 5%. A significance level of P < 0.05 was applied.
Correlations of bacterial levels with clinical parameters (BOP, PPD, and CAL) were assessed using Spearman’s correlation coefficients.
Multivariate Predictive Modeling of Chronic Periodontitis at Site-Specific Level Based on Subgingival Pathobiont Levels: Selection of Models
Spearman correlations between pathobionts were calculated and used as an orientation for model building, in order to prevent redundancies and possible collinearity between bacteria with similar biological effects. Pathobiont-based models were selected for their biological significance, their capacity to predict chronic periodontitis at site-specific level and their statistical validity.
Models were constructed by initially selecting one bacterium or bacterial cluster as predictor variable. In order to test whether the predictive ability of bacterial clusters can be increased by incorporating others, two-variable models combining different bacterial clusters were analyzed. A methodological advantage of the matched case-control sample approach within the same periodontal patient used in this study is that the subject-associated variables (such as age, gender, and smoking status) are the same for the control and periodontal sites and so do not need to be incorporated in the predictive models.
The statistical criteria applied for model selection were:
(1) The capacity of each pathobiont-based model to discriminate the severity of chronic periodontitis at site-specific level, that was assessed with the Epi package and using the receiver operating characteristic (ROC) curve (Carstensen et al., 2017). The models with an area under the curve (AUC) value ≥0.76 were selected, as these are typically considered to be acceptable predictive models (Hosmer et al., 2013). The calculation of the AUC values and their corresponding 95% confidence intervals (CIs) by bootstrapping was performed using the pROC package (Robin et al., 2011).
(2) The capacity of each pathobiont-based model to classify the severity of chronic periodontitis at site-specific level, that was assessed with the pROC package and bootstrapping. Numerous classification measures such as accuracy (ACC), sensitivity, specificity, the PPV, and the negative predictive value (NPV) were obtained by setting an optimal threshold, as well as their corresponding 95% CIs (Robin et al., 2011). The best cut-off value for each model was determined so that the percentage of correct predictions was the maximum. The models with sensitivity and specificity values ≥75% were selected.
As a single indicator of diagnostic performance, the diagnostic odds ratio (DOR) was calculated as the ratio of the odds of positivity in the diseased patients relative to the odds of positivity in those with no disease (Glas et al., 2003). The value of the DOR ranges from 0 to infinity, with higher values indicating a better discriminatory test performance (higher accuracy). A DOR of 1.0 indicates that a test does not discriminate between subjects with the disease and those without it. DOR values <1.0 suggest improper test interpretation (a proportion of negative test results in the group with disease) (Glas et al., 2003).
(3) In models with at least two independent variables, the variance inflation factor (VIF; for models which only include continuous variables) was <2.28. This value allowed us to assume that the model did not present evidence of multicollinearity between the independent variables (O’brien, 2007).
(4) The Hosmer–Lemeshow test (a calibration measure) was not significant (P > 0.05) when using the Resource Selection package (Lele et al., 2017).
Any model that did not fulfill any of these inclusion criteria was discarded for the posterior analysis.
Multivariate Predictive Modeling of Chronic Periodontitis at Site-Specific Level Based on Subgingival Pathobiont Levels: Validation of Selected Models, and the Development of Nomograms
Bootstrap methods were used to test for possible overfitting by determining optimism values on the discrimination and classification measures. The bootstrap analysis was replicated on 1000 different samples of the same sample size drawn with replacements from the original sample. Optimism, which is a measurement of internal model validation that refers to the absolute magnitude of bias, equals the difference between respective statistics of the bootstrap sample (bootstrap performance) and the bootstrap model in the original sample (test performance) (Efron and Tibshirani, 1994; Steyerberg et al., 2001b). Bias-corrected (bc) AUC values and all the classification measures (bc-ACC, bc-sensitivity, bc-specificity, bc-PPV, and bc-NPV) were calculated as their corresponding apparent measures derived from the entire original sample minus optimism (Efron and Tibshirani, 1994; Steyerberg et al., 2001b). In terms of the bc-DOR, these ratios were calculated from the values of bc-sensitivity and bc-specificity.
The nomograms were built based on the selected models using the RMS package (Harrel, 2016). A nomogram maps the predicted probabilities into points on a scale from zero to 100 in a user-friendly graphical interface. The total points accumulated by the various covariates correspond to the predicted probability of having a subgingival site with periodontal destruction in a periodontal patient (Iasonos et al., 2008).
Figure 2 shows the flow chart of the statistical analysis: binary logistic regression and diagnostic nomograms.
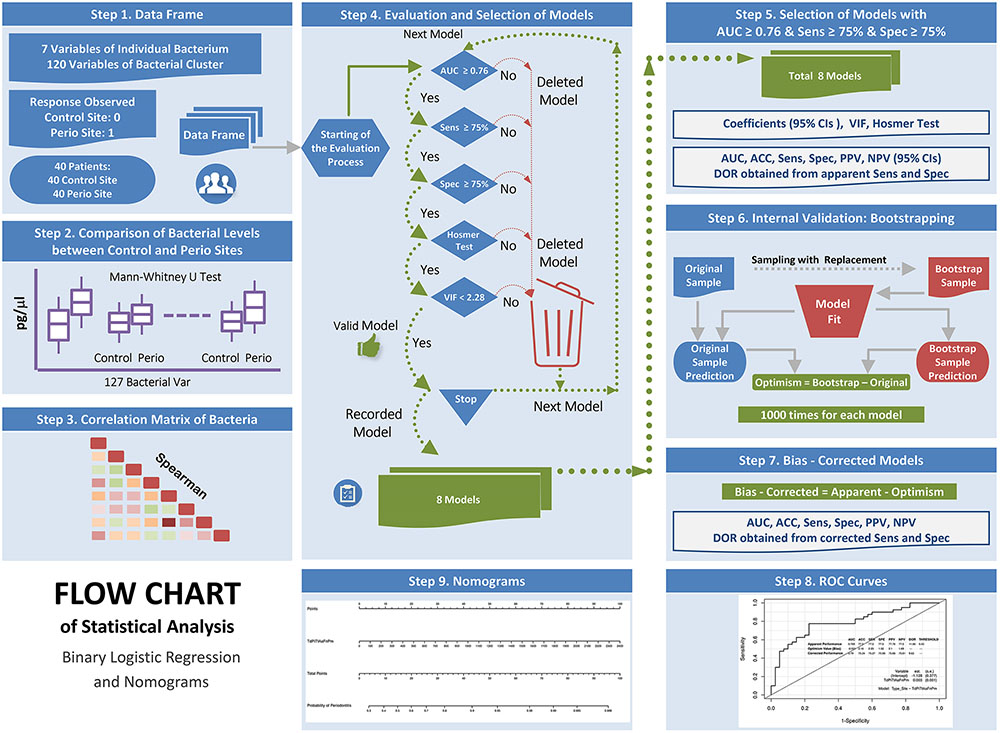
FIGURE 2. Flow chart of the statistical analysis: binary logistic regression and diagnostic nomograms.
Results
Characteristics of the Study Group
The study group consisted of 40 individuals with a diagnosis of moderate-severe generalized chronic periodontitis and an average age of 51.35 years. Of these patients, 18 were male and 22 female. With regard to the comparative analysis of clinical parameters between the control and periodontal sites, the latter showed significantly higher BOP, PPD, and CAL values (Table 2).
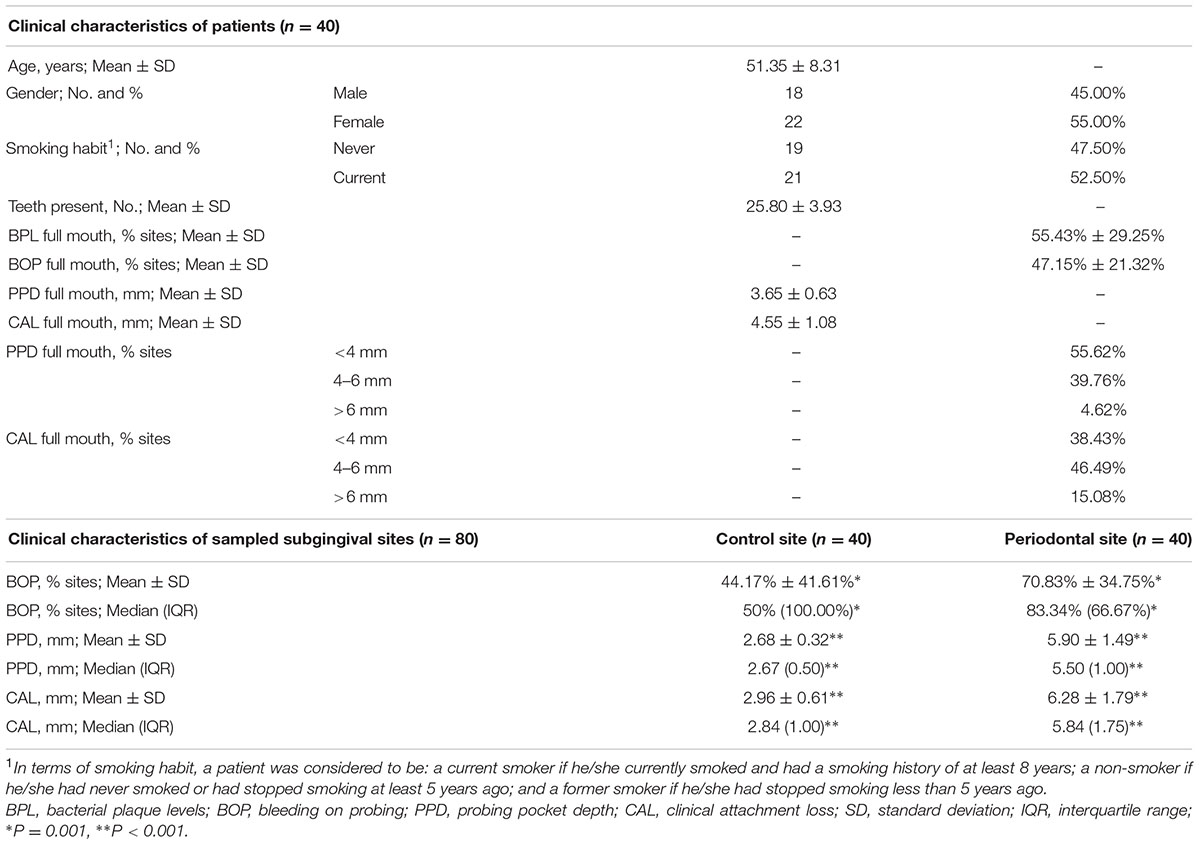
TABLE 2. Demographic and clinical characteristics of the patients with chronic periodontitis included in the present study, as well as the clinical characteristics of the sampled subgingival sites (control site vs. periodontal site).
In relation to their smoking habits, 19 patients were non-smokers and 21 current smokers, and both patient groups showed similar age and gender characteristics, as well as similar values in terms of the periodontal indices recorded in the full mouth and the sampled subgingival sites.
Detection Frequencies and Levels of Pathobionts in the Chronic Periodontitis: Control Sites vs. Periodontal Sites
The detection frequencies of the seven species evaluated were similar between the control and periodontal sites. The median total bacterial concentration of the periodontal sites was four times higher than that detected in the control sites (P < 0.001). Five pathobionts showed significantly higher concentrations in the periodontal sites than the control sites. These species were: Fn, Pm, Pg, Tf, and Td (P < 0.001 for all the bacteria except Fn, P = 0.023). In terms of the 127 bacterial clusters, all except PiAaFn, PiFn, and PiAa showed significantly higher concentrations in the periodontal sites than the control sites (P-values ranged from <0.001 to 0.009). After applying the Benjamini–Hochberg correction, all the significant P-values were maintained (Table 3 and Supplementary Data Sheet S1). With regard to smoking habit, no significant differences were found in the detection frequencies or the bacterial concentrations for each subgingival site between the smokers and non-smokers.
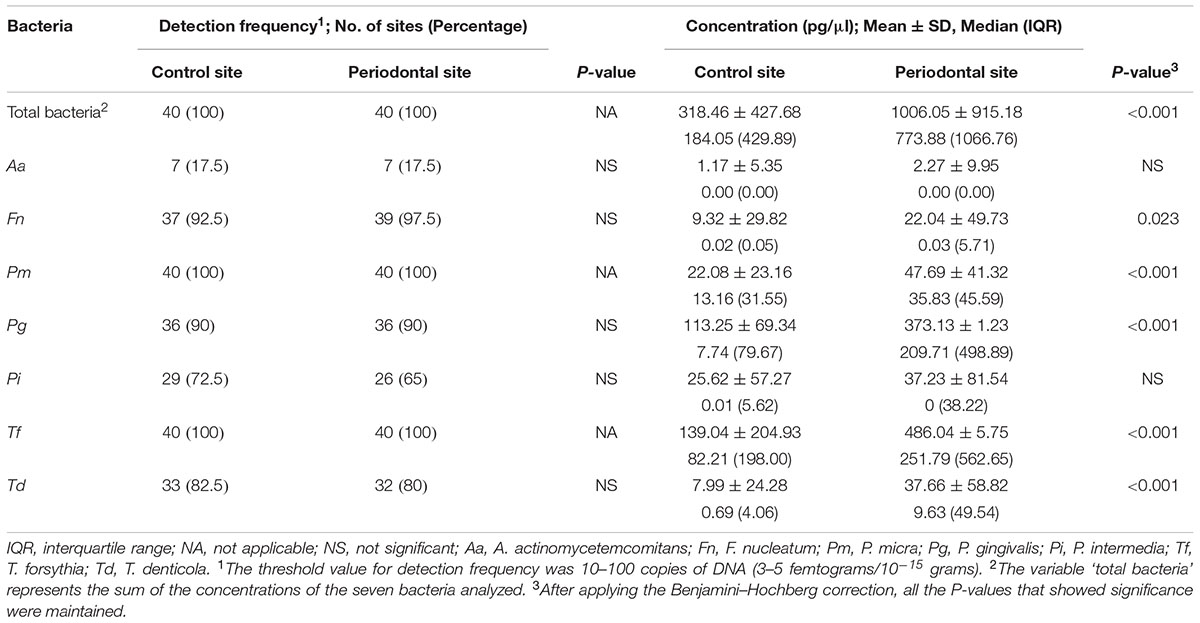
TABLE 3. Comparison of the detection frequencies and concentrations (pg/μl) of seven periopathogens between the two subgingival sites (control and periodontal sites) in the periodontal patient group.
Multivariate Predictive Modeling of Chronic Periodontitis at Site-Specific Level Based on Subgingival Pathobiont Levels: Selection and Validation of Models, and the Development of Nomograms
A first description of the relation between pathobiont levels, as well as with the clinical parameters (PPD, CAL) is given in Supplementary Data Sheet S1, by means of their Spearman correlations. Almost all correlations between bacteria and with the PPD and CAL values were positive. The interpretation is that when a subgingival site with periodontal destruction was present, the majority of pathobionts presented larger values, which can be verified in the comparative analysis between control and periodontal sites shown in Table 3. However, the correlation values between the bacteria and these with the clinical parameters were not very high, the strongest associations being observed between Pg and Tf (Rho = 0.699) and several clusters with ≥4 bacteria and CAL (Rho > 0.540) (Supplementary Data Sheet S1).
Applying the statistical criteria set out in the section ‘Materials and Methods,’ a total of eight models were selected (Table 4 and Supplementary Data Sheet S2). In all of them, the predictor variables were represented by one bacterial cluster composed of at least three species. The most common bacteria were: Tf and Pi (both were present in eight models), followed by Td and Fn (both were present in six models) and Aa and Pm (both were present in five and three models, respectively). The concentration values of the optimal threshold ranged from 218.86 pg/μl for the PiTfFn model to 264.16 pg/μl for the TdPiTfAaFnPm model. There was no predictive model formed by two bacterial clusters that fulfilled the established statistical criteria.
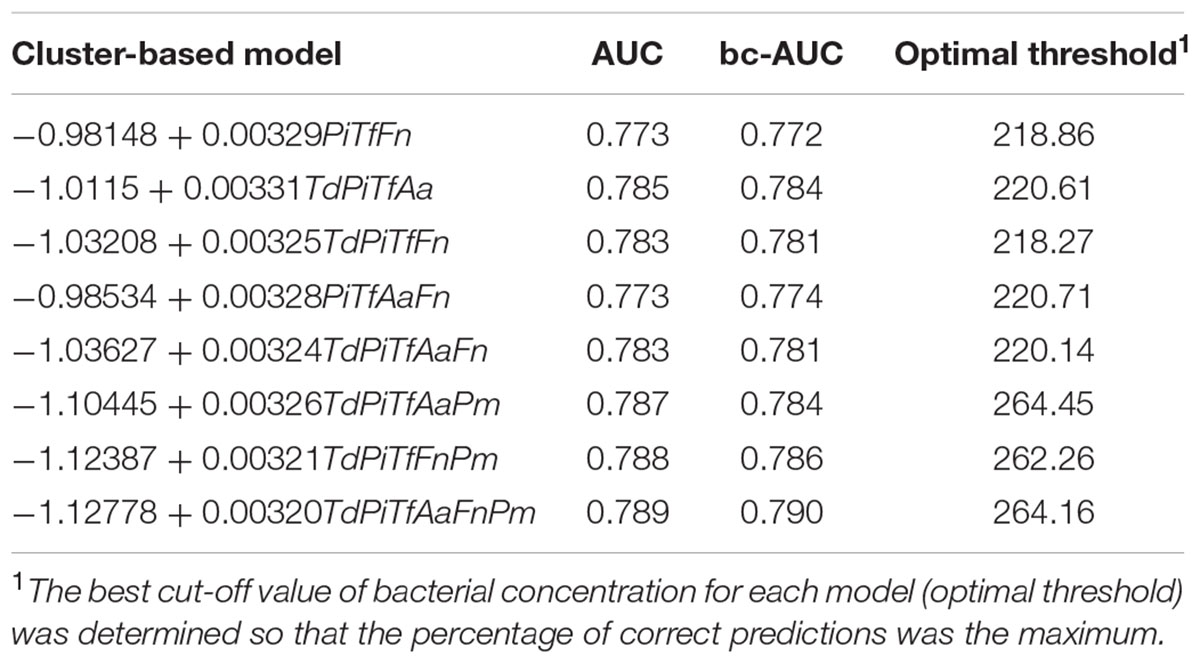
TABLE 4. Description of the eight models based on bacterial clusters, including the apparent and bias-corrected AUC values, as well as optimal threshold values.
The main results on the apparent and bc-measures of discrimination and classification of eight pathobiont-based models are detailed in Table 5 and Supplementary Data Sheet S2. The apparent AUC values of these models ranged from 0.773 to 0.789. The PiTfFn cluster showed an apparent AUC value of 0.773 (sensitivity and specificity = 75.0%; DOR = 9.0). When Td was incorporated in this cluster, a new predictive model emerged with better apparent AUC, sensitivity and DOR values (0.783, 77.5%, and 10.3, respectively). When Pm and AaPm were incorporated in the TdPiTfFn cluster, we obtained the two best predictive models with apparent AUC values of 0.788 and 0.789, respectively, as well as sensitivity and specificity values of 77.5% and DOR of 11.8 for both models. However, when Aa and TdAa were incorporated in the PiTfFn cluster, the two predictive models that appeared did not have better discrimination and classification measures than those detected in clusters of lower numbers of bacteria, such as PiTfFn and TdPiTfFn.
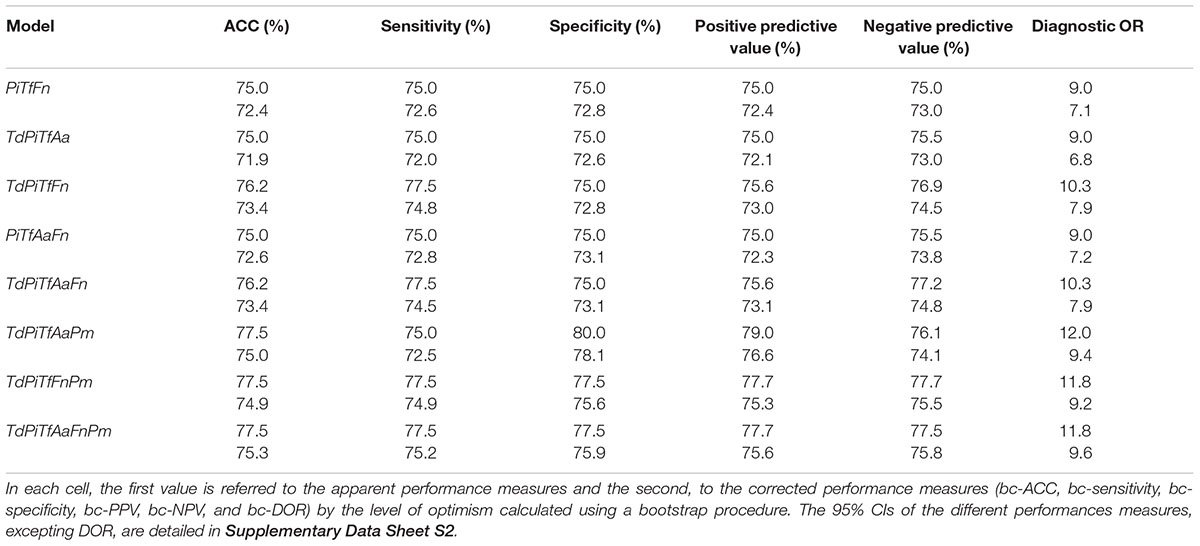
TABLE 5. Measures of discrimination and classification of the eight models based on bacterial clusters.
The TdPiTfAa cluster showed an apparent AUC value of 0.785 (sensitivity and specificity = 75.0%; DOR = 9.0). When Pm was incorporated in this cluster, a new predictive model appeared with better apparent AUC, specificity and DOR values (0.787, 80.0%, and 12.0, respectively). The optimism values obtained by the bootstrap methods in relation to the performance measures of these models ranged from -0.001 to 0.003 in the AUC values and 1.52–3.07% in the classification indices.
Figures 3, 4 show the ROC curves of the most predictive clusters with the lowest number of species – PiTfFn and TdPiTfAa – and the highest number of bacteria – TdPiTfAaFnPm and TdPiTfAaPm. Figures 5, 6 show the diagnostic nomograms of the four previous models. As noted previously, the discrimination and classification performance values of all the nomograms were high, indicating their good accuracy. Overall, in eight nomograms, the high concentration levels of the different bacterial clusters were associated with an increased probability of having a subgingival site with periodontal destruction in a patient with chronic periodontitis. Supplementary Files show these graphics of the eight models with an AUC ≥0.76 and sensitivity and specificity values ≥ 75% (Supplementary Data Sheets S3, S4, and Figures S1–S8).
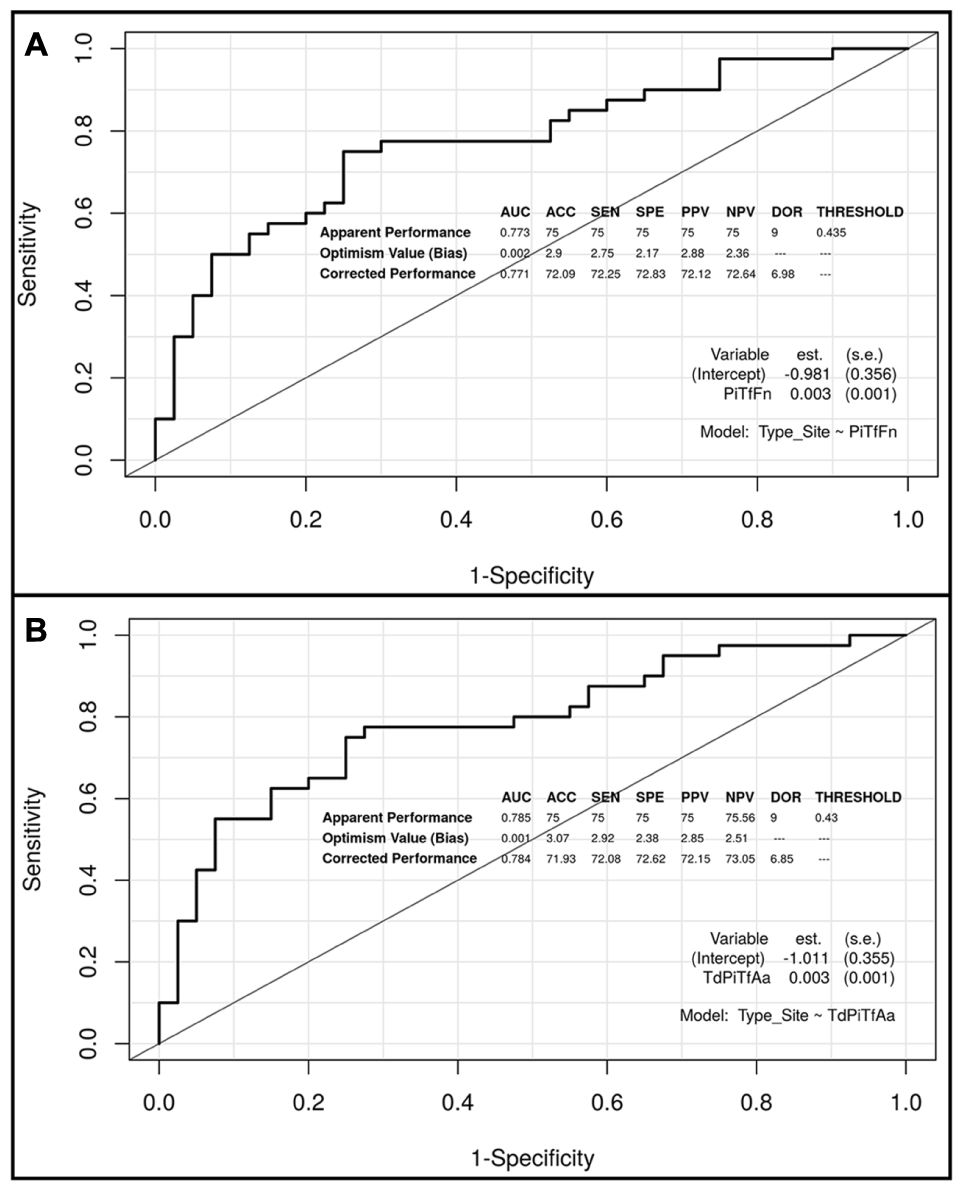
FIGURE 3. Receiver operating characteristic (ROC) curves of the two predictive models based on the PiTfFn and TdPiTfAa clusters, including the apparent and bias-corrected measures by bootstrapping. (A) PiTfFn cluster; (B) TdPiTfAa cluster.
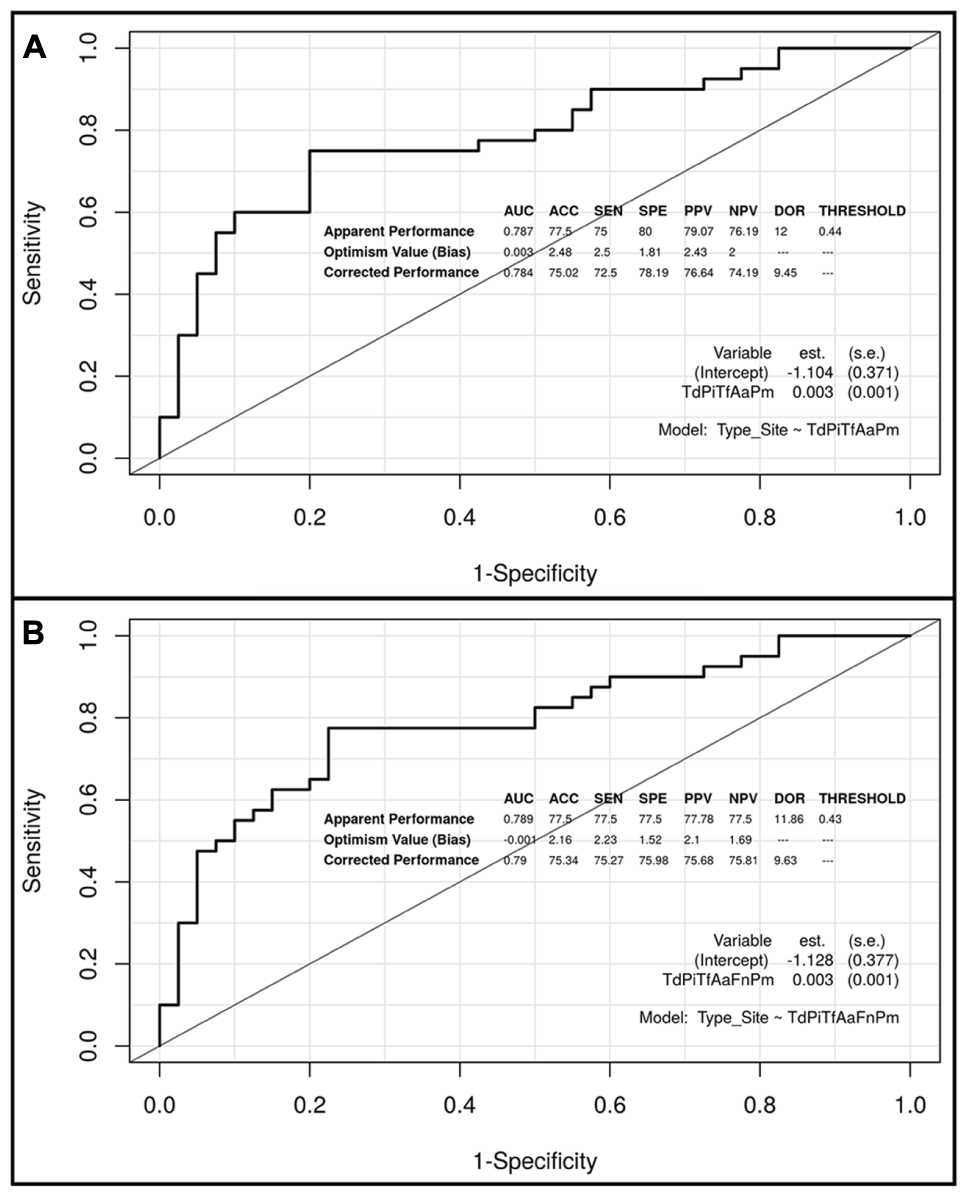
FIGURE 4. Receiver operating characteristic (ROC) curves of the two predictive models based on the TdPiTfAaPm and TdPiTfAaFnPm clusters, including the apparent and bias-corrected measures by bootstrapping. (A) TdPiTfAaPm cluster; (B) TdPiTfAaFnPm cluster.
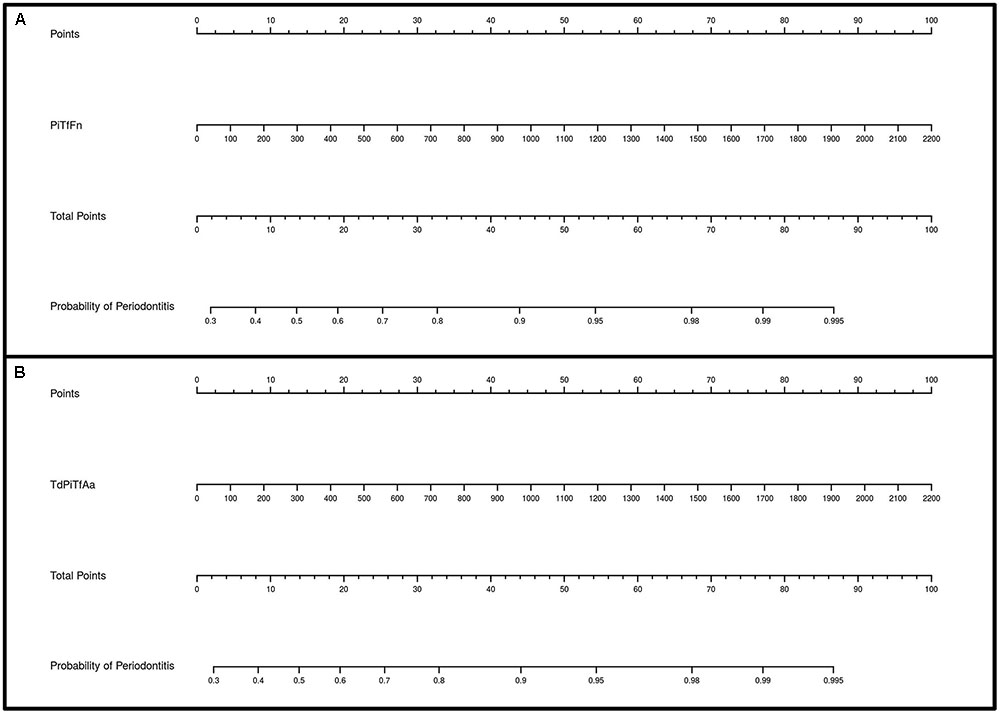
FIGURE 5. Diagnostic nomograms based on the PiTfFn and TdPiTfAa models for predicting the probability of having a periodontal site. The probability of having a subgingival site with periodontal destruction is calculated by drawing a line to the point on the axis for each of the following variables: (A) PiTfFn cluster; (B) TdPiTfAa cluster. The points for each variable are located on the total point line. Next, a vertical line is projected from the total point line to the predicted probability bottom scale to obtain the individual probability of periodontitis at the site-specific level.
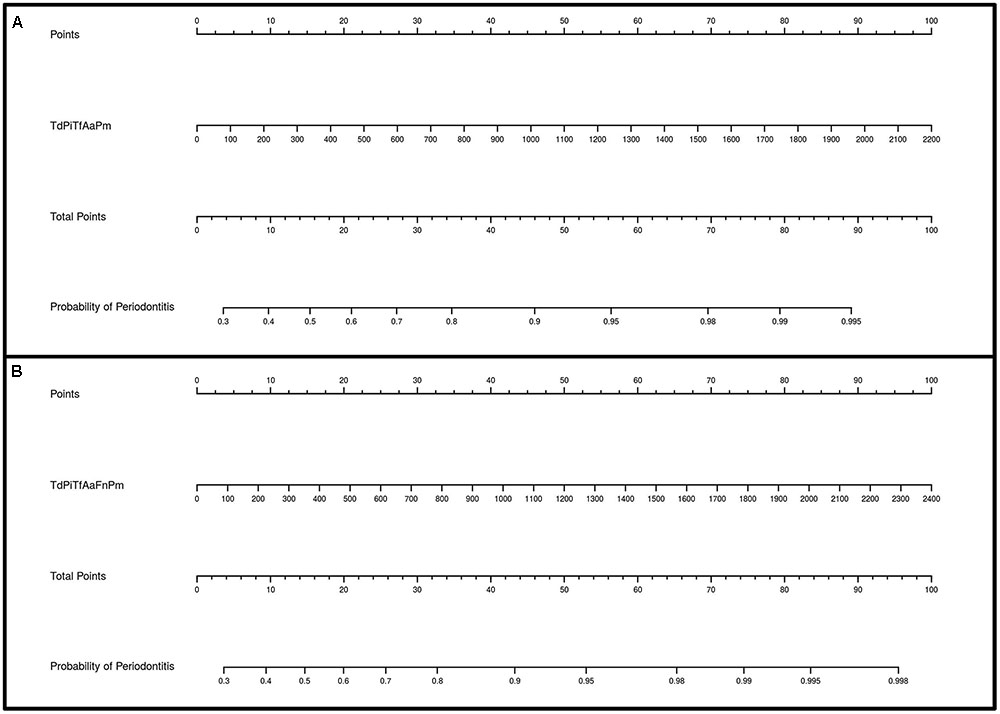
FIGURE 6. Diagnostic nomograms based on the TdPiTfAaPm and TdPiTfAaFnPm models for predicting the probability of having a periodontal site. The probability of having a subgingival site with periodontal destruction is calculated by drawing a line to the point on the axis for each of the following variables: (A) TdPiTfAaPm cluster; (B) TdPiTfAaFnPm cluster. The points for each variable are located on the total point line. Next, a vertical line is projected from the total point line to the predicted probability bottom scale to obtain the individual probability of periodontitis at the site-specific level.
Discussion
Methodological Aspects of the qPCR Studies
In terms of study design, a control group (healthy subjects) is compared to a group of periodontitis patients in numerous qPCR studies of periodontal pathogens at the subgingival level (Braga et al., 2010; Kretschmar et al., 2012). The control group may also include gingivitis patients (Scapoli et al., 2015), or they may constitute a separate group (Masunaga et al., 2010). In addition, there are other authors who have studied subgingival samples microbiologically using the qPCR from different periodontal patient groups according to the degree of periodontal affection (mild, moderate, or severe) (Zorina et al., 2011) or the type of disease (chronic vs. aggressive) (Casarin et al., 2010). There are also qPCR studies that have been performed exclusively on subjects with periodontitis (Kotsilkov et al., 2015; Milne et al., 2015).
Although certain subject-associated factors can increase an individual’s overall susceptibility to periodontal diseases, it appears that not all sites within a subject are equally susceptible at one time (Griffiths, 2003). This site-specific clinical pattern can be attributed to differences in the bacterial species composition of subgingival plaque (Byrne et al., 2009). However, there is little evidence in the literature of the influence of pathobionts analyzed by the qPCR in relation to the site-specific severity of chronic periodontitis (Mineoka et al., 2008; Teixeira et al., 2009; Al-hebshi et al., 2014). As a consequence, we propose using a qPCR technique to study the relationship between pathobiont levels from subgingival sites with different degrees of disease (control sites vs. periodontal sites) within the same periodontal patient. This methodology (paired design) means that the effects of inter-individual variations in factors other than bacterial composition are avoided.
Regarding the species studied, we decided to quantify them initially according to Socransky’s bacterial complexes (Socransky et al., 1998), with those most frequently studied being: three species of the Red Complex (Pg, Tf, and Td), the main three species of the Orange Complex (Fn, Pi, and Pm) and a species from the Green Complex (Aa). Consequently, our intention was to focus on various well-known pathobionts that could be used as biomarkers in a possible diagnostic tool for dental practitioners in order to improve disease control and reduce the future risk of progression seen in everyday clinical practice.
In numerous qPCR papers, the authors report the number of DNA copies as a measure of the quantification of the bacterial load rather than cell numbers, because the copy number of the marker gene, particularly the 16S rRNA gene, varies from one species to another and is unknown for some of them (Al-hebshi et al., 2014, 2015; Yang et al., 2016). This implies that available bacterial counts for some of the tested genera/species have probably been over-estimated (Al-hebshi et al., 2014). In the present series, we used a new qPCR technique with TaqMan probes and Cod-UNG enzymes for the molecular detection of these pathobionts. This patented technique allows the easy design of probes for the detection of any pathogen while maintaining excellent sensitivity and specificity (Bou et al., 2014). In the present study, the absolute quantification of the DNA of each species was performed using the standard curve method. Moreover, the target genes studied were different single-copy genes per genome, which may allow absolute counts of DNA copies to be reported in terms of cell numbers.
From an analytical point of view, the majority of authors in their respective qPCR studies applied a ‘simple approach.’ As a result, the subgingival levels of pathobionts in control volunteers and periodontal patients were compared for testing using q-PCR, whether or not a particular bacterium is absent/present and/or diminished/elevated at the individual level (Braga et al., 2010; Polonyi et al., 2013; Kotsilkov et al., 2015; Milne et al., 2015; Scapoli et al., 2015; Golynska et al., 2016). In parallel with current trends in big data analytics for genomic medicine (He et al., 2017), further evidence is required about applying multivariate analytical approaches to qPCR data. This would enable there to be a better understanding of the complex bacterial interactions present in chronic periodontitis. This type of analytical approach was used in our study.
Detection Frequencies and Levels of Pathobionts in the Severity of Chronic Periodontitis: Control Sites vs. Periodontal Sites
Al-hebshi et al. (2014) used the qPCR to investigate seven pathobionts (the species of the Red Complex, the genera Fusobacterium spp. and Prevotella spp., as well as Aa) in healthy and periodontal subgingival sites within the same periodontal patient. This study was similar to ours methodologically. The Al-hebshi’s series revealed detection percentages of 100% for Pm, Td, Tf, Fusobacterium spp. and Prevotella spp., 97.5% for Pg, and 67.5% for Aa. We agree with them on the high detection rates found for the Red Complex species, Fn and Pm (80–100%), confirming that the mere presence of the bacteria is not an indicator of the clinical situation (Byrne et al., 2009; Charalampakis et al., 2013). However, in contrast to Al-hebshi et al. (2014), our series of periodontal patients showed lower detection frequencies for Pi (69%) and, especially, Aa (17.5%), although those values were not conditioned by the subgingival site tested. Initially, our results on the low prevalence of Aa confirmed its marginal role in chronic periodontitis in our study population, which reflects the findings of other authors (Gatto et al., 2014); however, we will later see how its role changes in the multivariate analysis.
In Al-hebshi’s study (Al-hebshi et al., 2014), the levels of Pm, Prevotella spp., Pg, Tf, and Td were higher in subgingival sites with periodontal destruction than the control sites. However, after correcting for multiple comparisons, these differences only remained statistically significant for Pm and Tf. This was probably due to the small sample size (only 20 periodontal patients). In the present study, our results revealed that periodontal sites had significantly higher concentrations for the three Red Complex species (concentration increments of 27, 14, and 3 times for Pg, Td, and Tf, respectively) and Pm and Fn (concentration increments of 2.7 and 1.5 times, respectively).
Our findings demonstrated that all the pathobionts (except Aa and Pi) were present at the control sites (non-active sites) and that an increase in their concentrations was required to trigger activity in the periodontal site; Pg was the bacteria that had a higher increment. The relevance of the Red Complex species together and Pg alone in the pathogenesis of periodontitis has been proved in numerous in vitro studies (Bao et al., 2014; Lin et al., 2014; Willi et al., 2014). A bacterial consortium named the Orange Complex, which includes Fn and Pm, was indicated as preceding the Red Complex with respect to colonization and proliferation (Socransky et al., 1998). In relation to Fn and Pm, there is growing evidence based on in vitro research on their role as periodontal pathogens (Nonnenmacher et al., 2003; Lee and Baek, 2013; Wang et al., 2013; Kim and Lee, 2014; Marchesan et al., 2016).
Although evaluating the influence of smoking was not a major objective of the present study, our findings in this regard are consistent with those of Tomita et al. (2013), as we did not detect significant differences in the profiles of the seven species present in the sampled subgingival sites (control and periodontal sites). These sites showed similar clinical characteristics between smokers and non-smokers. Nevertheless, these results should be interpreted with caution since, in larger series, other authors have found significantly higher prevalences of Td and Tf and significantly higher levels of Aa, Pg, and Tf in smokers with chronic periodontitis (Gatto et al., 2014; Guglielmetti et al., 2014).
Multivariate Predictive Modeling of the Subgingival Levels of Pathobionts: Selection of the Best Models and the Development of Nomograms
In periodontology, traditional clinical criteria are often inadequate for determining sites of active disease, measuring the degree of susceptibility to future progression, and monitoring the response to therapy (Giannobile et al., 2009; Korte and Kinney, 2016). In this sense, there is a need for research on innovative diagnostic tests based on biomarkers that focus on the early recognition of the microbial challenge to the host, providing a benefit in terms of disease control at the site-specific level.
The first step to assess whether a test could be clinically useful is the analysis of its predictive ability (Deeks, 1999). In this sense, there are some papers in the literature that have focused on the analysis of the predictive ability of the pathobiont levels quantified by the qPCR to distinguish different degrees of periodontal affection in subgingival samples from different individuals (Ramseier et al., 2009; Saygun et al., 2011; Kinney et al., 2014; Al-hebshi et al., 2015; Torrungruang et al., 2015). Several of these studies coincide in terms of detecting that the subgingival levels of certain bacteria, such as the Red Complex species, C. rectus, Pi, Pm and even a new bacterial phylum of oral Synergistetes, showed a good diagnostic power for distinguishing between healthy/gingivitis patients and those with periodontitis (AUC values ranged from >0. 74 to >0.80) (Ramseier et al., 2009; Al-hebshi et al., 2015).
However, we have found very few papers like ours on bacteria-based predictive models for diagnosing periodontitis severity or progression using a paired design (Byrne et al., 2009; Nomura et al., 2012; Charalampakis et al., 2013; Gatto et al., 2014). Charalampakis et al. (2013) identified sites at risk of future progression during 2 years of maintenance in 50 patients with chronic periodontitis. This research was based on longitudinal clinical and microbiological monitoring using DNA–DNA hybridization involving 25 bacterial species. In this series, both members of the Red Complex as well as of the ‘B Complex’ (Pi, Fn and C. rectus) were equally able to identify periodontitis from non-periodontitis sites and severe periodontitis sites from non-severe periodontitis sites; these bacterial complexes had AUC values above 0.75. In accordance with these results (Charalampakis et al., 2013), in our study the best predictive models with AUC values ≥0.76 (sensitivity and specificity ≥75%), which could be regarded as good (Hosmer et al., 2013), included the concentration levels of different bacterial clusters formed by at least three bacteria. These findings were ratified by the analysis of the internal validation that was performed, since the optimism values obtained by the bootstrap techniques were not high. Therefore, in accordance with the findings of previous authors (Byrne et al., 2009; Charalampakis et al., 2013), our results confirm that the use of bacterial quantitative data rather than dichotomous data (presence/absence) provides more statistical power for detecting any predictive relationship with disease severity.
Interestingly, and unlike Charalampakis’s study, the bacteria present in all the predictive clusters were Tf and Pi (both in eight models), followed by Td and Fn (both in six models) and Aa and Pm (both in five and three models, respectively). All these clusters were constituted by bacteria that belong to different Socransky’s complexes and have different pathogenic roles in disease severity in terms of individual concentration levels. Such an outcome was previously observed in our own series. In fact, although Pi and Aa had non-significant, higher concentrations in the periodontal sites than the control sites, their levels contributed to increasing the predictive ability of the cluster in which they were incorporated. On the other hand, although Pg was the species that showed the highest concentration increment in the periodontal sites, surprisingly this species did not have a high power for predicting periodontitis severity in comparison with other pathobionts, since it was not included in any of the best predictive models. From a predictive perspective, these findings contribute to Pg being regarded as a ‘keystone’ pathobiont which is a microorganism that can change the environment to alter proportions or levels of other symbionts and pathobionts within the ecological niche; these microorganisms are the main ones responsible for triggering the destructive cascade that provokes the activation of inflammation and subsequent bone destruction (Costalonga and Herzberg, 2014).
In accordance with previous authors (Byrne et al., 2009; Charalampakis et al., 2013), we demonstrated that the detection of a specific threshold of concentration levels of certain bacterial clusters may serve as a predictor of periodontitis severity at site-specific level. Two main predictive clusters were identified: PiTfFn (AUC = 0.773; sensitivity and specificity = 75.0%; DOR = 9.0) and TdPiTfAa (AUC = 0.785; sensitivity and specificity = 75.0%; DOR = 9.0). In relation to PiTfFn, when other bacteria or clusters such as Td, Pm, and AaPm were incorporated in this cluster, new predictive models emerged with better predictive parameters. The two best predictive clusters were TdPiTfFnPm and TdPiTfAaFnPm, with AUC values of 0.788 and 0.789, respectively (sensitivity and specificity values of 77.5% and DOR of 11.8 for both models). In relation to TdPiTfAa, when Pm was incorporated in this cluster, a new predictive model appeared with better AUC, specificity and DOR values (0.787, 80.0%, and 12.0, respectively).
To the best of our knowledge, this study presents the first evidence that these new bacterial clusters are capable of predicting the severity of chronic periodontitis, with several species detected outside the Red Complex that contribute to the detection of periodontal destruction at the specific-site level. To date, the findings obtained by open-ended molecular approaches support the hypothesis that chronic periodontitis is initiated by polymicrobial synergy and the dysbiosis of the entire microbial community (PSD model). The condition is characterized not only by a greater involvement of the ‘established’ pathobionts, as studied in this series, but also by the coexistence of other pathobionts with an unknown role such as Anaeroglobus, Bulleidia, Desulfobulbus, Filifactor alocis, Mogibacterium, Phocaeicola, Schwartzia, or TM7 (Camelo-Castillo et al., 2015a,b). Given this new pathogenic approach of the disease, it would be very interesting to study the predictive ability of these new pathobionts and other symbionts in chronic periodontitis, as well as their relationship with host mediators.
Nomograms are simplified representations of complicated statistical models, and their clinical value relates to the fact that they map the predicted probabilities into points on a scale from 0 to 100 in a user-friendly graphical interface (Iasonos et al., 2008). To our knowledge, this is the first study providing several nomograms based on the concentration levels of certain bacterial clusters to predict the probability of having a periodontal site in a patient with chronic periodontitis.
Our nomograms, which are derived from the eight best-fitting models, fulfilled the requirements of discrimination. Overall, in all the nomograms, higher concentration levels of different bacterial clusters were associated with an increased probability of having a periodontal site in a periodontal patient. The use of only a few variables is desirable in nomograms to increase their utility in clinical practice (Altman and Royston, 2000). Consequently, of the nomograms developed in the present study, we highlight those based on the clusters formed by the lower number of species, PiTfFn and TdPiTfAa. The application of these tools in the field of clinical activity would improve the identification of sites with periodontal destruction that are at possible risk of future progression, contributing to the decision-making process and treatment planning dilemmas.
Our research has some limitations. The most important weakness is that the prediction of the study’s accuracy is only measured in the samples that generated the model equations. As a consequence, to evaluate the reproducibility of the models and control for the possibility of overfitting, we validated the prediction rule internally (discrimination and classification measures) using bootstrap methods on the original derivation dataset by sampling with replacements for 1000 iterations (Steyerberg et al., 2001a,b). This internal validation method revealed optimal results on the control of overfitting in the models.
The evaluation of these cluster-based predictive models and nomograms is a potential future research direction. Firstly, it would greatly benefit the strength of our study if the predictive accuracy of the predictive models derived from our series could be measured in a large ‘external’ or independent cohort of patients to verify whether our findings are universally applicable or if they are conditioned by differences associated with geographic regions and ethnic groups (Herrera et al., 2008; Wara-aswapati et al., 2009; Psoter et al., 2011). An appropriate calibration analysis of the predictive models should also be performed. Secondly, the potential prognostic value at the site-specific level of these cluster-based predictive models with regard to disease progression and the response to treatment in periodontal patients should be exploited in longitudinal studies, as should their relationship with host mediators and their potential predictive accuracy in saliva samples.
Conclusion
We corroborated the important etiopathogenic role in quantitative terms, not only of Socransky’s Red Complex pathobionts, but also of other species such as Parvimonas micra, in the severity of chronic periodontitis at site-specific level. Several statistically validated models based on the bacterial concentration levels with a good predictive accuracy demonstrated that some species are good biomarkers when it comes to distinguishing a site with periodontal destruction in a periodontal patient. All these models consist of different clusters formed by several bacteria, at least three, which belong to different Socransky’s complexes. The most predictive clusters with the lowest number of species were PiTfFn and TdPiTfAa, and those with the highest number were TdPiTfFnPm and TdPiTfAaFnPm. In all the nomograms, higher concentration levels of these clusters were associated with an increased probability of finding a periodontal site in a patient with chronic periodontitis. The clinical implications of these predictive tools could include improved patient monitoring and the control of disease activity at the site-specific level. However, additional evidence is needed to test the external validity of these bacterial cluster-based models for predicting chronic periodontitis severity at the site-specific level and confirming the clinical value of the proposed nomograms.
Author Contributions
IT, AR-I, NA-B, and LN participated in the recruitment and diagnosis of patients, the collection of oral samples, in reviewing the literature and writing the paper. ML and MT participated in the quantification by qPCR of pathobionts and in the interpretation of the obtained results. IT and CB-C participated in the statistical design of the models, in the internal validation analysis and the development of the graphics. All authors made substantial contributions to all of the following: (1) the conception and design of the study, or acquisition of data, or analysis and interpretation of data, (2) drafting the article or revising it critically for important intellectual content, (3) the review and approval of the manuscript in its submitted form.
Funding
This work was supported by the EM2014/025 project from the Regional Ministry of Culture, Education and University (regional government of Galicia, Spain), which is integrated in the Regional Plan of Research, Innovation and Development 2011–2015; and grants PI13/02390-PI16/01163 awarded to MT within the State Plan for R+D+I 2013–2016 (National Plan for Scientific Research, Technological Development and Innovation 2008–2011) and co-financed by the ISCIII-Deputy General Directorate of evaluation and Promotion of Research-European Regional Development Fund “A way of Making Europe” and Instituto de Salud Carlos III FEDER.
Conflict of Interest Statement
The authors declare that the research was conducted in the absence of any commercial or financial relationships that could be construed as a potential conflict of interest.
Supplementary Material
The Supplementary Material for this article can be found online at: http://journal.frontiersin.org/article/10.3389/fmicb.2017.01443/full#supplementary-material
DATA SHEET S1 | Dataframe and univariate analysis.
DATA SHEET S2 | Description of cluster-based models with an AUC value ≥0.76 and sensitivity and specificity values ≥75%, and their principal characteristics. Results of the analysis on the internal validation by bootstrap methods of these predictive models.
DATA SHEET S3 | (Figures S1–S8): Receiver operating characteristic (ROC) curves of the cluster-based models with an AUC ≥0.76 and sensitivity and specificity values ≥75%.
DATA SHEET S4 | (Figures S1–S8): Diagnostic nomograms derived from the cluster-based models with an AUC ≥0.76 and sensitivity and specificity values ≥75%.
References
Abbayya, K., Puthanakar, N. Y., Naduwinmani, S., and Chidambar, Y. S. (2015). Association between periodontitis and alzheimer’s disease. N. Am. J. Med. Sci. 7, 241–246. doi: 10.4103/1947-2714.159325
Al-Harthi, L. S., Cullinan, M. P., Leichter, J. W., and Thomson, W. M. (2013). The impact of periodontitis on oral health-related quality of life: a review of the evidence from observational studies. Aust. Dent. J. 58, 274–277. doi: 10.1111/adj.12076
Al-hebshi, N. N., Al-Alimi, A., Taiyeb-Ali, T., and Jaafar, N. (2015). Quantitative analysis of classical and new putative periodontal pathogens in subgingival biofilm: a case-control study. J. Periodontal Res. 50, 320–329. doi: 10.1111/jre.12210
Al-hebshi, N. N., Shuga-Aldin, H. M., Al-Sharabi, A. K., and Ghandour, I. (2014). Subgingival periodontal pathogens associated with chronic periodontitis in Yemenis. BMC Oral Health 14:13. doi: 10.1186/1472-6831-14-13
Altman, D. G., and Royston, P. (2000). What do we mean by validating a prognostic model? Stat. Med. 19, 453–473.
Armitage, G. C. (1999). Development of a classification system for periodontal diseases and conditions. Ann. Periodontol. 4, 1–6. doi: 10.1902/annals.1999.4.1.1
Atieh, M. A. (2008). Accuracy of real-time polymerase chain reaction versus anaerobic culture in detection of Aggregatibacter actinomycetemcomitans and Porphyromonas gingivalis: a meta-analysis. J. Periodontol. 79, 1620–1629. doi: 10.1902/jop.2008.070668
Bansal, M., Khatri, M., and Taneja, V. (2013). Potential role of periodontal infection in respiratory diseases - a review. J. Med. Life 6, 244–248.
Bao, K., Belibasakis, G. N., Thurnheer, T., Aduse-Opoku, J., Curtis, M. A., and Bostanci, N. (2014). Role of Porphyromonas gingivalis gingipains in multi-species biofilm formation. BMC Microbiol. 14:258. doi: 10.1186/s12866-014-0258-7
Benjamini, Y., and Hochberg, Y. (1995). Controlling the false discovery rate: a practical and powerful approach to multiple testing. J. R. Stat. Soc. Series B (Methodological) 57, 289–300.
Bou, G., Fernández, A., and Tomás, M. (2014). Procedure for clinical diagnosis of an infectious disease using quantitative PCR, oligonucleotides marked from 8 to 9 nucleotides in length and the uracil-N- glycosylase of the atlantic cod. Patent No ES2449665. Washington, DC: U.S. Patent and Trademark Office.
Boutaga, K., Savelkoul, P. H., Winkel, E. G., and Van Winkelhoff, A. J. (2007). Comparison of subgingival bacterial sampling with oral lavage for detection and quantification of periodontal pathogens by real-time polymerase chain reaction. J. Periodontol. 78, 79–86. doi: 10.1902/jop.2007.060078
Boutaga, K., Van Winkelhoff, A. J., Vandenbroucke-Grauls, C. M., and Savelkoul, P. H. (2005). Periodontal pathogens: a quantitative comparison of anaerobic culture and real-time PCR. FEMS Immunol. Med. Microbiol. 45, 191–199. doi: 10.1016/j.femsim.2005.03.011
Boutaga, K., Van Winkelhoff, A. J., Vandenbroucke-Grauls, C. M., and Savelkoul, P. H. (2006). The additional value of real-time PCR in the quantitative detection of periodontal pathogens. J. Clin. Periodontol. 33, 427–433. doi: 10.1111/j.1600-051X.2006.00925.x
Braga, R. R., Carvalho, M. A., Bruna-Romero, O., Teixeira, R. E., Costa, J. E., Mendes, E. N., et al. (2010). Quantification of five putative periodontal pathogens in female patients with and without chronic periodontitis by real-time polymerase chain reaction. Anaerobe 16, 234–239. doi: 10.1016/j.anaerobe.2010.02.007
Buduneli, N., and Kinane, D. F. (2011). Host-derived diagnostic markers related to soft tissue destruction and bone degradation in periodontitis. J. Clin. Periodontol. 38(Suppl. 11), 85–105. doi: 10.1111/j.1600-051X.2010.01670.x
Byrne, S. J., Dashper, S. G., Darby, I. B., Adams, G. G., Hoffmann, B., and Reynolds, E. C. (2009). Progression of chronic periodontitis can be predicted by the levels of Porphyromonas gingivalis and Treponema denticola in subgingival plaque. Oral Microbiol. Immunol. 24, 469–477. doi: 10.1111/j.1399-302X.2009.00544.x
Camelo-Castillo, A., Mira, A., Pico, A., Nibali, L., Henderson, B., Donos, N., et al. (2015a). Subgingival microbiota in health compared to periodontitis and the influence of smoking. Front. Microbiol. 6:119. doi: 10.3389/fmicb.2015.00119
Camelo-Castillo, A., Novoa, L., Balsa-Castro, C., Blanco, J., Mira, A., and Tomás, I. (2015b). Relationship between periodontitis-associated subgingival microbiota and clinical inflammation by 16S pyrosequencing. J. Clin. Periodontol. 42, 1074–1082. doi: 10.1111/jcpe.12470
Carstensen, B., Plummer, M., Laara, E., and Hills, M. (2017). Epi: A Package for Statistical Analysis in Epidemiology. R Package Version 2.10. Available at: http://CRAN.R-project.org/package=Epi
Casarin, R. C., Ribeiro Edel, P., Mariano, F. S., Nociti, F. H. Jr., Casati, M. Z., and Goncalves, R. B. (2010). Levels of Aggregatibacter actinomycetemcomitans, Porphyromonas gingivalis, inflammatory cytokines and species-specific immunoglobulin G in generalized aggressive and chronic periodontitis. J. Periodontal Res. 45, 635–642. doi: 10.1111/j.1600-0765.2010.01278.x
Champlot, S., Berthelot, C., Pruvost, M., Bennett, E. A., Grange, T., and Geigl, E. M. (2010). An efficient multistrategy DNA decontamination procedure of PCR reagents for hypersensitive PCR applications. PLoS ONE 5:e13042. doi: 10.1371/journal.pone.0013042
Chapple, I. L., Genco, R., and Working group 2 of joint Efp/Aap workshop (2013). Diabetes and periodontal diseases: consensus report of the joint EFP/AAP workshop on periodontitis and systemic diseases. J. Clin. Periodontol. 84(4 Suppl.), S106–S112. doi: 10.1111/jcpe.12077
Charalampakis, G., Dahlen, G., Carlen, A., and Leonhardt, A. (2013). Bacterial markers vs. clinical markers to predict progression of chronic periodontitis: a 2-yr prospective observational study. Eur. J. Oral Sci. 121, 394–402. doi: 10.1111/eos.12080
Costalonga, M., and Herzberg, M. C. (2014). The oral microbiome and the immunobiology of periodontal disease and caries. Immunol. Lett. 162, 22–38. doi: 10.1016/j.imlet.2014.08.017
de Pablo, P., Chapple, I. L., Buckley, C. D., and Dietrich, T. (2009). Periodontitis in systemic rheumatic diseases. Nat. Rev. Rheumatol. 5, 218–224. doi: 10.1038/nrrheum.2009.28
Decat, E., Cosyn, J., De Bruyn, H., Miremadi, R., Saerens, B., Van Mechelen, E., et al. (2012). Optimization of quantitative polymerase chain reactions for detection and quantification of eight periodontal bacterial pathogens. BMC Res. Notes 5:664. doi: 10.1186/1756-0500-5-664
Deeks, J. J. (1999). Using evaluations of diagnostic tests: understanding their limitations and making the most of available evidence. Ann. Oncol. 10, 761–768. doi: 10.1023/A:1008359805260
Dentino, A., Lee, S., Mailhot, J., and Hefti, A. F. (2013). Principles of periodontology. Periodontology 2000, 16–53. doi: 10.1111/j.1600-0757.2011.00397.x
Efron, B., and Tibshirani, R. J. (1994). An Introduction to the Bootstrap. Boca Raton, FL: CRC Press.
Faul, F., Erdfelder, E., Lang, A. G., and Buchner, A. (2007). G∗Power 3: a flexible statistical power analysis program for the social, behavioral, and biomedical sciences. Behav. Res. Methods 39, 175–191. doi: 10.3758/BF03193146
Fernández-Pinero, J., Gallardo, C., Elizalde, M., Robles, A., Gomez, C., Bishop, R., et al. (2013). Molecular diagnosis of african swine fever by a new real-time PCR using universal probe library. Transbound. Emerg. Dis. 60, 48–58. doi: 10.1111/j.1865-1682.2012.01317.x
Fraczyk, M., Wozniakowski, G., Kowalczyk, A., Niemczuk, K., and Pejsak, Z. (2016). Development of cross-priming amplification for direct detection of the african swine fever virus, in pig and wild boar blood and sera samples. Lett. Appl. Microbiol. 62, 386–391. doi: 10.1111/lam.12569
Gatto, M. R., Montevecchi, M., Paolucci, M., Landini, M. P., and Checchi, L. (2014). Prevalence of six periodontal pathogens in subgingival samples of italian patients with chronic periodontitis. New Microbiol. 37, 517–524.
Giannobile, W. V., Beikler, T., Kinney, J. S., Ramseier, C. A., Morelli, T., and Wong, D. T. (2009). Saliva as a diagnostic tool for periodontal disease: current state and future directions. Periodontology 2000, 52–64. doi: 10.1111/j.1600-0757.2008.00288.x
Glas, A. S., Lijmer, J. G., Prins, M. H., Bonsel, G. J., and Bossuyt, P. M. (2003). The diagnostic odds ratio: a single indicator of test performance. J. Clin. Epidemiol. 56, 1129–1135. doi: 10.1016/S0895-4356(03)00177-X
Golynska, M., Polkowska, I., and Bartoszcze-Tomaszewska, M. (2016). Molecular evaluation of selected periodontal pathogens from subgingival region in canine and human periodontal disease. J. Vet. Sci. 18, 51–58. doi: 10.4142/jvs.2017.18.1.51
Griffiths, G. S. (2003). Formation, collection and significance of gingival crevice fluid. Periodontology 2000, 32–42. doi: 10.1034/j.1600-0757.2003.03103.x
Guglielmetti, M. R., Rosa, E. F., Lourencao, D. S., Inoue, G., Gomes, E. F., De Micheli, G., et al. (2014). Detection and quantification of periodontal pathogens in smokers and never-smokers with chronic periodontitis by real-time polymerase chain reaction. J. Periodontol. 85, 1450–1457. doi: 10.1902/jop.2014.140048
Harrel, F. E. Jr. (2016). Rms: Regression Modeling Strategies. R Package Version 4.5–0. Available at: http://CRAN.R-project.org/package=rms
He, K. Y., Ge, D., and He, M. M. (2017). Big data analytics for genomic medicine. Int. J. Mol. Sci. 18:E412. doi: 10.3390/ijms18020412
Herrera, D., Contreras, A., Gamonal, J., Oteo, A., Jaramillo, A., Silva, N., et al. (2008). Subgingival microbial profiles in chronic periodontitis patients from Chile, Colombia and Spain. J. Clin. Periodontol. 35, 106–113. doi: 10.1111/j.1600-051X.2007.01170.x
Hosmer, D. W. Jr., Lemeshow, S., and Sturdivant, R. X. (2013). Applied Logistic Regression. Hoboken, NJ: John Wiley & Sons, Inc.
Iasonos, A., Schrag, D., Raj, G. V., and Panageas, K. S. (2008). How to build and interpret a nomogram for cancer prognosis. J. Clin. Oncol. 26, 1364–1370. doi: 10.1200/JCO.2007.12.9791
Jervoe-Storm, P. M., Koltzscher, M., Falk, W., Dorfler, A., and Jepsen, S. (2005). Comparison of culture and real-time PCR for detection and quantification of five putative periodontopathogenic bacteria in subgingival plaque samples. J. Clin. Periodontol. 32, 778–783. doi: 10.1111/j.1600-051X.2005.00740.x
Kassebaum, N. J., Bernabe, E., Dahiya, M., Bhandari, B., Murray, C. J., and Marcenes, W. (2014). Global burden of severe periodontitis in 1990-2010: a systematic review and meta-regression. J. Dent. Res. 93, 1045–1053. doi: 10.1177/0022034514552491
Kim, Y. J., and Lee, S. H. (2014). Reducing the bioactivity of Tannerella forsythia lipopolysaccharide by Porphyromonas gingivalis. J. Microbiol. (Seoul, Korea) 52, 702–708. doi: 10.1007/s12275-014-4324-5
Kinney, J. S., Morelli, T., Oh, M., Braun, T. M., Ramseier, C. A., Sugai, J. V., et al. (2014). Crevicular fluid biomarkers and periodontal disease progression. J. Clin. Periodontol. 41, 113–120. doi: 10.1111/jcpe.12194
Korte, D. L., and Kinney, J. (2016). Personalized medicine: an update of salivary biomarkers for periodontal diseases. Periodontology 2000, 26–37. doi: 10.1111/prd.12103
Kotsilkov, K., Popova, C., Boyanova, L., Setchanova, L., and Mitov, I. (2015). Comparison of culture method and real-time PCR for detection of putative periodontopathogenic bacteria in deep periodontal pockets. Biotechnol. Biotechnol. Equip. 29, 996–1002. doi: 10.1080/13102818.2015.1058188
Kretschmar, S., Yin, L., Roberts, F., London, R., Flemmig, T. T., Arushanov, D., et al. (2012). Protease inhibitor levels in periodontal health and disease. J. Periodontal Res. 47, 228–235. doi: 10.1111/j.1600-0765.2011.01425.x
Lee, S. H., and Baek, D. H. (2013). Characteristics of Porphyromonas gingivalis lipopolysaccharide in co-culture with Fusobacterium nucleatum. Mol. Oral Microbiol. 28, 230–238. doi: 10.1111/omi.12020
Lele, S. R., Keim, J. L., and Solymos, P. (2017). Package “ResourceSelection”. R Package Version 0.3–2. Available at: https://github.com/psolymos/ResourceSelection.
Lin, F. Y., Hsiao, F. P., Huang, C. Y., Shih, C. M., Tsao, N. W., Tsai, C. S., et al. (2014). Porphyromonas gingivalis GroEL induces osteoclastogenesis of periodontal ligament cells and enhances alveolar bone resorption in rats. PLoS ONE 9:e102450. doi: 10.1371/journal.pone.0102450
Loomer, P. M. (2004). Microbiological diagnostic testing in the treatment of periodontal diseases. Periodontology 2000 34, 49–56. doi: 10.1046/j.0906-6713.2002.003424.x
Marchesan, J., Jiao, Y. Z., Schaff, R. A., Hao, J., Morelli, T., Kinney, J. S., et al. (2016). TLR4, NOD1 and NOD2 mediate immune recognition of putative newly identified periodontal pathogens. Mol. Oral Microbiol. 31, 243–258. doi: 10.1111/omi.12116
Masunaga, H., Tsutae, W., Oh, H., Shinozuka, N., Kishimoto, N., and Ogata, Y. (2010). Use of quantitative PCR to evaluate methods of bacteria sampling in periodontal patients. J. Oral Sci. 52, 615–621. doi: 10.2334/josnusd.52.615
Milne, T. J., Coates, D. E., Leichter, J. W., Soo, L., Williams, S. M., Seymour, G. J., et al. (2015). Periodontopathogen levels following the use of an er:YAG laser in the treatment of chronic periodontitis. Aust. Dent. J. doi: 10.1111/adj.12306 [Epub ahead of print].
Mineoka, T., Awano, S., Rikimaru, T., Kurata, H., Yoshida, A., Ansai, T., et al. (2008). Site-specific development of periodontal disease is associated with increased levels of Porphyromonas gingivalis, Treponema denticola, and Tannerella forsythia in subgingival plaque. J. Periodontol. 79, 670–676. doi: 10.1902/jop.2008.070398
Moons, K. G., Altman, D. G., Reitsma, J. B., Ioannidis, J. P., Macaskill, P., Steyerberg, E. W., et al. (2015). Transparent reporting of a multivariable prediction model for individual prognosis or diagnosis (TRIPOD): explanation and elaboration. Ann. Intern. Med. 162, W1–W73. doi: 10.7326/M14-0698
Nomura, Y., Shimada, Y., Hanada, N., Numabe, Y., Kamoi, K., Sato, T., et al. (2012). Salivary biomarkers for predicting the progression of chronic periodontitis. Arch. Oral Biol. 57, 413–420. doi: 10.1016/j.archoralbio.2011.09.011
Nonnenmacher, C., Dalpke, A., Zimmermann, S., Flores-De-Jacoby, L., Mutters, R., and Heeg, K. (2003). DNA from periodontopathogenic bacteria is immunostimulatory for mouse and human immune cells. Infect. Immun. 71, 850–856. doi: 10.1128/IAI.71.2.850-856.2003
O’brien, R. M. (2007). A caution regarding rules of thumb for variance inflation factors. Qual. Quant. 41, 673–690. doi: 10.1007/s11135-006-9018-6
Page, R. C., and Eke, P. I. (2007). Case definitions for use in population-based surveillance of periodontitis. J. Periodontol. 78, 1387–1399. doi: 10.1902/jop.2007.060264
Polonyi, M., Prenninger, N., Arweiler, N. B., Haririan, H., Winklehner, P., and Kierstein, S. (2013). Assessment of viable periodontal pathogens by reverse transcription quantitative polymerase chain reaction. J. Periodontal Res. 48, 671–676. doi: 10.1111/jre.12052
Psoter, W. J., Ge, Y., Russell, S. L., Chen, Z., Katz, R. V., Jean-Charles, G., et al. (2011). PCR detection of Streptococcus mutans and Aggregatibacter actinomycetemcomitans in dental plaque samples from Haitian adolescents. Clin. Oral Investig. 15, 461–469. doi: 10.1007/s00784-010-0413-y
R Core Team (2016). R: A Language and Environment for Statistical Computing. Vienna: R foundation for statistical computing.
Ramseier, C. A., Kinney, J. S., Herr, A. E., Braun, T., Sugai, J. V., Shelburne, C. A., et al. (2009). Identification of pathogen and host-response markers correlated with periodontal disease. J. Periodontol. 80, 436–446. doi: 10.1902/jop.2009.080480
Robin, X., Turck, N., Hainard, A., Tiberti, N., Lisacek, F., Sanchez, J. C., et al. (2011). pROC: An open-source package for R and S+ to analyze and compare ROC curves. BMC Bioinformatics 12:77. doi: 10.1186/1471-2105-12-77
Sakamoto, M., Umeda, M., and Benno, Y. (2005). Molecular analysis of human oral microbiota. J. Periodontal Res. 40, 277–285. doi: 10.1111/j.1600-0765.2005.00793.x
Saygun, I., Nizam, N., Keskiner, I., Bal, V., Kubar, A., Acikel, C., et al. (2011). Salivary infectious agents and periodontal disease status. J. Periodontal Res. 46, 235–239. doi: 10.1111/j.1600-0765.2010.01335.x
Scapoli, L., Girardi, A., Palmieri, A., Martinelli, M., Cura, F., Lauritano, D., et al. (2015). Quantitative analysis of periodontal pathogens in periodontitis and gingivitis. J. Biol. Regul. Homeost. Agents 29, 101–110.
Shanbhag, S., Dahiya, M., and Croucher, R. (2012). The impact of periodontal therapy on oral health-related quality of life in adults: a systematic review. J. Clin. Periodontol. 39, 725–735. doi: 10.1111/j.1600-051X.2012.01910.x
Socransky, S. S., Haffajee, A. D., Cugini, M. A., Smith, C., and Kent, R. L. Jr. (1998). Microbial complexes in subgingival plaque. J. Clin. Periodontol. 25, 134–144. doi: 10.1111/j.1600-051X.1998.tb02419.x
Steyerberg, E. W., Eijkemans, M. J. C., and Habbema, J. D. F. (2001a). Application of shrinkage techniques in logistic regression analysis: a case study. Stat. Neerl. 55, 76–88. doi: 10.1111/1467-9574.00157
Steyerberg, E. W., Harrell, F. E. Jr., Borsboom, G. J., Eijkemans, M. J., Vergouwe, Y., and Habbema, J. D. (2001b). Internal validation of predictive models: efficiency of some procedures for logistic regression analysis. J. Clin. Epidemiol. 54, 774–781. doi: 10.1016/S0895-4356(01)00341-9
Teixeira, S. R., Mattarazo, F., Feres, M., Figueiredo, L. C., de Faveri, M., Simionato, M. R., et al. (2009). Quantification of Porphyromonas gingivalis and fimA genotypes in smoker chronic periodontitis. J. Clin. Periodontol. 36, 482–487. doi: 10.1111/j.1600-051X.2009.01411.x
Teles, R., Teles, F., Frias-Lopez, J., Paster, B., and Haffajee, A. (2013). Lessons learned and unlearned in periodontal microbiology. Periodontology 2000 62, 95–162. doi: 10.1111/prd.12010
Tomita, S., Komiya-Ito, A., Imamura, K., Kita, D., Ota, K., Takayama, S., et al. (2013). Prevalence of Aggregatibacter actinomycetemcomitans, Porphyromonas gingivalis and Tannerella forsythia in japanese patients with generalized chronic and aggressive periodontitis. Microb. Pathog. 6, 11–15. doi: 10.1016/j.micpath.2013.04.006
Tonetti, M. S., Van Dyke, T. E., and Working group 1 of the joint Efp/Aap workshop (2013). Periodontitis and atherosclerotic cardiovascular disease: consensus report of the joint EFP/AAP workshop on periodontitis and systemic diseases. J. Clin. Periodontol. 40(Suppl. 14), S24–S29. doi: 10.1111/jcpe.12089
Torrungruang, K., Jitpakdeebordin, S., Charatkulangkun, O., and Gleebbua, Y. (2015). Porphyromonas gingivalis, Aggregatibacter actinomycetemcomitans, and Treponema denticola/Prevotella intermedia co-infection are associated with severe periodontitis in a thai population. PLoS ONE 10:e0136646. doi: 10.1371/journal.pone.0136646
Wang, Q., Wright, C. J., Dingming, H., Uriarte, S. M., and Lamont, R. J. (2013). Oral community interactions of Filifactor alocis in vitro. PLoS ONE 8:e76271. doi: 10.1371/journal.pone.0076271
Wara-aswapati, N., Pitiphat, W., Chanchaimongkon, L., Taweechaisupapong, S., Boch, J. A., and Ishikawa, I. (2009). Red bacterial complex is associated with the severity of chronic periodontitis in a Thai population. Oral Dis. 15, 354–359. doi: 10.1111/j.1601-0825.2009.01562.x
Willi, M., Belibasakis, G. N., and Bostanci, N. (2014). Expression and regulation of triggering receptor expressed on myeloid cells 1 in periodontal diseases. Clin. Exp. Immunol. 178, 190–200. doi: 10.1111/cei.12397
Yang, X., Li, C., and Pan, Y. (2016). The influences of periodontal status and periodontal pathogen quantity on salivary 8-hydroxydeoxyguanosine and interleukin-17 levels. J. Periodontol. 87, 591–600. doi: 10.1902/jop.2015.150390
Zhang, L., Henson, B. S., Camargo, P. M., and Wong, D. T. (2009). The clinical value of salivary biomarkers for periodontal disease. Periodontology 2000, 25–37. doi: 10.1111/j.1600-0757.2009.00315.x
Keywords: chronic periodontitis, multivariate modeling techniques, paired design, periopathogens, predictive ability, qPCR, site-specific, subgingival plaque
Citation: Tomás I, Regueira-Iglesias A, López M, Arias-Bujanda N, Novoa L, Balsa-Castro C and Tomás M (2017) Quantification by qPCR of Pathobionts in Chronic Periodontitis: Development of Predictive Models of Disease Severity at Site-Specific Level. Front. Microbiol. 8:1443. doi: 10.3389/fmicb.2017.01443
Received: 22 March 2017; Accepted: 17 July 2017;
Published: 09 August 2017.
Edited by:
Fumito Maruyama, Kyoto University, JapanReviewed by:
Takahiko Shiba, Tokyo Medical and Dental University, JapanHidetomo Iwano, Rakuno Gakuen University, Japan
Ching-Yuan Chen, Columbia University Medical Center, United States
Copyright © 2017 Tomás, Regueira-Iglesias, López, Arias-Bujanda, Novoa, Balsa-Castro and Tomás. This is an open-access article distributed under the terms of the Creative Commons Attribution License (CC BY). The use, distribution or reproduction in other forums is permitted, provided the original author(s) or licensor are credited and that the original publication in this journal is cited, in accordance with accepted academic practice. No use, distribution or reproduction is permitted which does not comply with these terms.
*Correspondence: Inmaculada Tomás, inmaculada.tomas@usc.es Maria Tomás, ma.del.mar.tomas.carmona@sergas.es