Reduced Circulating Levels of miR-433 and miR-133b Are Potential Biomarkers for Parkinson’s Disease
 Xiong Zhang1,2
  Rui Yang2 Bei-Lei Hu1 Pengcheng Lu3 Li-Li Zhou2
  Zhi-Yong He1 Hong-Mei Wu2*
  Jian-Hong Zhu1,2,4*
- 1Department of Geriatrics and Neurology, the Second Affiliated Hospital and Yuying Children’s Hospital, Wenzhou Medical University, Wenzhou, China
- 2Department of Preventive Medicine, Wenzhou Medical University, Wenzhou, China
- 3Department of Biostatistics Graduate Program, University of Kansas Medical Center, Kansas City, KS, United States
- 4Key Laboratory of Watershed Science and Health of Zhejiang Province, Wenzhou Medical University, Wenzhou, China
Aberrant expression of microRNA (miRNA) in tissues may lead to altered level in circulation. Considerable evidence has suggested that miRNA deregulation is involved in the pathogenesis of Parkinson’s disease (PD). In this study, we screened a set of PD-associated miRNAs and aimed to identify differentially expressed miRNAs in plasma of PD patients and to evaluate their potentiality to serve as PD biomarkers. A total of 95 subjects consisting of 46 sporadic PD cases and 49 controls were recruited. Plasma levels of six miRNAs including miR-433, miR-133b, miR-34b, miR-34c, miR-153, and miR-7 were evaluated using reverse transcribed quantitative PCR, among which we found that miR-34c and miR-7 were below detection limit under our condition. The results showed that levels of circulating miR-433 (P = 0.003) and miR-133b (P = 0.006), but not miR-34b and miR-153, were reduced in PD patients. miR-433 and miR-133b were strongly correlated in both control and PD groups (rs = 0.87 and 0.85, respectively). The correlation between miR-34b and miR-153 expressions was significantly reduced (P < 0.05) in the PD group. Although miR-433 and miR-133b were likely to be functionally complimentary as suggested by Pathway and Gene Ontology analyses, these two miRNAs per se might not be sufficient to predict PD. No correlation was observed between the four miRNAs and age or severity of disease. Collectively, our results demonstrate that circulating miR-433 and miR-133b are significantly altered in PD and may serve as PD biomarkers.
Introduction
Parkinson’s disease (PD) is the second most common neurodegenerative disease characterized by progressive loss of dopaminergic neurons in substantia nigra. While hereditary PD is mainly caused by gene mutations such as in SNCA, Parkin, and PINK1, the majority of this disease is sporadic and the pathogenesis involves both genetic vulnerabilities and environmental exposures (Bekris et al., 2010). Thus far, diagnosis of PD largely relies on the presence of motor symptoms, clinically characterized by bradykinesia, resting tremor, rigidity, and at late stage gait instability. However, the actual onset of this disease precedes the motor manifestations by a number of years (Kalia and Lang, 2015). As a consequence, possible clinic or preventive interventions lag far behind the disease onset. Substantial efforts have therefore been made to develop potential markers for early diagnosis of PD, and the strategies include prodromal clinical signs, imaging, skin or colonic biopsies, genetic sequencing, and biochemical testing in cerebral spinal fluid, blood, saliva, and urine. For example, certain non-motor symptoms such as olfactory impairment and rapid eye movement sleep behavior disorder, which are frequently present in PD before motor manifestations, have been under investigation as potential markers for PD diagnosis (Postuma et al., 2012). Unfortunately, thus far none of them has been proven effective in clinical trials despite early promises (Kalia and Lang, 2015).
MicroRNAs (miRNAs) act as endogenous regulators of gene expression by binding to complementary sequences of target messenger RNA (Chen and Rajewsky, 2007). Being small non-protein coding RNAs and also relatively stable, disturbance of miRNA in tissues is possibly reflected by changes in serum/plasma, which renders miRNA a potentially convenient biomarker in monitoring diseases (Reid et al., 2011). miRNAs have also been suggested to play an important role in PD and profiled in brains of PD patients (Kim et al., 2007; Minones-Moyano et al., 2011). Among the miRNAs known to be associated with PD, in particular those with postmortem evidence and/or regulating α-synuclein expression, are: miR-34b and miR-34c, down-regulated in the brains of PD patients (Minones-Moyano et al., 2011; Villar-Menendez et al., 2014) and repressing α-synuclein expression (Kabaria et al., 2015); miR-7 and miR-153, suppressing α-synuclein expression (Junn et al., 2009; Doxakis, 2010); miR-433, regulating fibroblast growth factor 20 (FGF20) levels and subsequent α-synuclein expression (Wang et al., 2008); and miR-133b, down-regulated in midbrain of PD patients and interacting with Pitx3 (Kim et al., 2007). In this study, we focused on these six miRNAs to better understand PD-associated changes and explore their potentiality as PD biomarkers.
Materials and Methods
Study Subjects
A total of 95 Han Chinese individuals were enrolled in this study, consisting of 46 sporadic PD patients (22 men and 24 women) and 49 controls (22 men and 27 women). The age of the patients and controls was 63.13 ± 1.46 and 60.35 ± 1.16, respectively. The two groups were comparable by gender (P = 0.78) and age (P = 0.14). The patients were diagnosed by two movement disorder neurologists according to the UK Parkinson’s Disease Society Brain Bank Criteria, and were not with a family history of PD or secondary and atypical parkinsonism. The control subjects were free of neurological disorders by medical history, physical and laboratory examinations. The PD patients were divided into three subgroups according to Hoehn and Yahr (H&Y) staging (Hoehn and Yahr, 1998) including stage I (H&Y stage: 1–2), stage II (H&Y stage: 3–4), and stage III (H&Y stage: 5). All subjects participating in this study signed informed written consents. The study was approved by the ethics committee of the Second Affiliated Hospital and Yuying Children’s Hospital, Wenzhou Medical University.
Plasma Sample Collection and miRNA Extraction
Fasting blood samples were collected in EDTA tubes and centrifuged for 15 min at 1500 rpm at room temperature. After centrifugation, plasma was collected and stored at -80°C until analysis. RNAs enriched of small size were extracted from 500 μl of aliquots using miRcute miRNA isolation Kit (Tiangen, Beijing, China) according to the manufacturer’s instruction.
Determination of miRNA Levels by RT-qPCR
Sequences and miRBase accession numbers of the assessed miRNAs were listed in Table 1. RNA (50 ng) was reverse-transcribed using FastQuant RT Kit with gDNase (Tiangen, Beijing, China). qPCR was performed using FastStart Essential DNA Green Master (Roche, Mannheim, Germany) in accordance with the manufacturer’s instruction in CFX ConnectTM Real-Time PCR detection system (Bio-Rad Laboratories, Hercules, CA, United States). Small nucleolar RNA U6 was used as an internal control. The RT and PCR primers for each miRNA and U6 were purchased from RiboBio (Guangzhou, China), termed Bulge-LoopTM miRNA RT-qPCR (reverse-transcription quantitative PCR) primer set and U6 stem-loop RT-qPCR primer set, respectively. Each reaction was performed with triplicates with cycling conditions as follows: 95°C for 10 min, followed by 45 cycles of 95°C for 10 s, 60°C for 15 s, and 72°C for 20 s. The miRNA expression levels were calculated as 2-Δct, wherein the average cycle threshold (McCulloch et al., 2008) value of each miRNA was subtracted by their respective Ct value of U6.
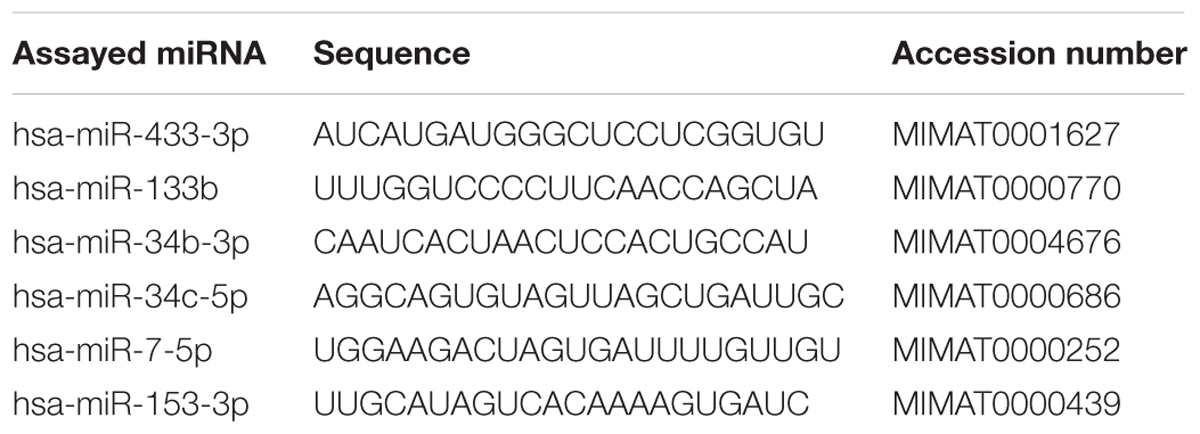
TABLE 1. The miRNA sequences and miRBase accession numbers.
Pathway and Gene Ontology Analyses of miRNA Targets
The miRNA target genes were sequentially analyzed using miRTarBase1 (release 4.5; a database that has experimentally validated the miRNA-target interactions; Hsu et al., 2014), and in DAVID2 (Database for Annotation, Visualization and Integrated Discovery; Huang et al., 2009), a web-accessible program that integrates functional genomic annotations with intuitive graphical summaries, to identify KEGG (Kyoto Encyclopedia of Genes and Genomes) pathways (Kanehisa and Goto, 2000), followed by gene ontology (GO) analyses (Ashburner et al., 2000; Gene Ontology Consortium, 2004).
Supervised Learning Algorithms
Six algorithm models were generated using R (version 3.1.2), including decision tree (Quinlan, 1986), conditional inference tree (Hothorn et al., 2006), random forest (Rodriguez et al., 2006), support vector machine (Cortes and Vapnik, 1995), naive Bayesian (Leung, 2007), and logistic regression (Hosmer and Lemeshow, 2000). Model performance was assessed using the area under the receiver operating characteristic curve (AUC), accuracy, sensitivity and specificity. The model metrics were obtained from internal fivefold cross-validation with 100 repeats.
Statistical Analysis
Statistical analysis was performed using Statistical Product and Service Solutions (SPSS; version 20.0) for windows. Differences in gender and age between patients and controls were assessed using χ2 test and t-test, respectively. Differences in miRNA expression levels between patients and controls were evaluated using Mann–Whitney U-test following normality analysis using Kolmogorov–Smirnov test and Shapiro–Wilk test with or without logarithm and square root transformations. Outliers, which differed more than 30 times from the median, were excluded by using informal box plots to pinpoint the outlying points (Laurikkala et al., 2000). Spearman’s rank correlation coefficient was calculated to estimate the association between levels of each miRNA. Fisher Z transformation was used to analyze differences in correlation coefficients of the miRNA pairs between the patient and control groups, and a z value outside of the range of -1.96∼1.96 was considered as P < 0.05. Values were expressed as means ± SE unless otherwise indicated. A difference was considered statistically significant when a two-tailed P-value was <0.05.
Results
Expression of the Six miRNAs in Plasma of PD Patients and Controls
We first randomly selected three control and three PD samples to determine whether the six miRNAs could be reliably detected in plasma under our condition as described in Section “Materials and Methods.” An average qPCR Ct value of 40 was considered as a detection limit in this study as values beyond indicate minute abundance (Gallo et al., 2012; Muller et al., 2014). The results showed that levels of miR-34c (Ct, 41.5 ± 0.41) and miR-7 (beyond detection limit) were very low in plasma. In contrast, the other four miRNAs, including miR-433 (Ct, 38.1 ± 1.57), miR-133b (Ct, 33.2 ± 0.29), miR-34b (Ct, 37.5 ± 0.94), and miR-153 (Ct, 38.9 ± 0.65), were constantly detectable. We thus measured and analyzed expression levels of these four miRNAs in the following experiments. The expression levels of miR-433 (Figure 1A; P = 0.003) and miR-133b (Figure 1B; P = 0.006) were significantly lower in plasma of PD patients compared with the controls. In contrast, no significant difference was found in miR-34b (Figure 1C) and miR-153 (Figure 1D) between the controls and PD cases. Of note, four samples (one in controls; three in PD) were excluded in the group of miR-133b based on the outlier calculation. Some studies did not use any controls but kept the reaction system consistent throughout experiments, and straightforwardly used the measured levels (Chen et al., 2008; Ren et al., 2013). The current study followed a consistent system as well; we thus applied this method by removing the normalization of U6, and detected similar results (Supplementary Figure S1).
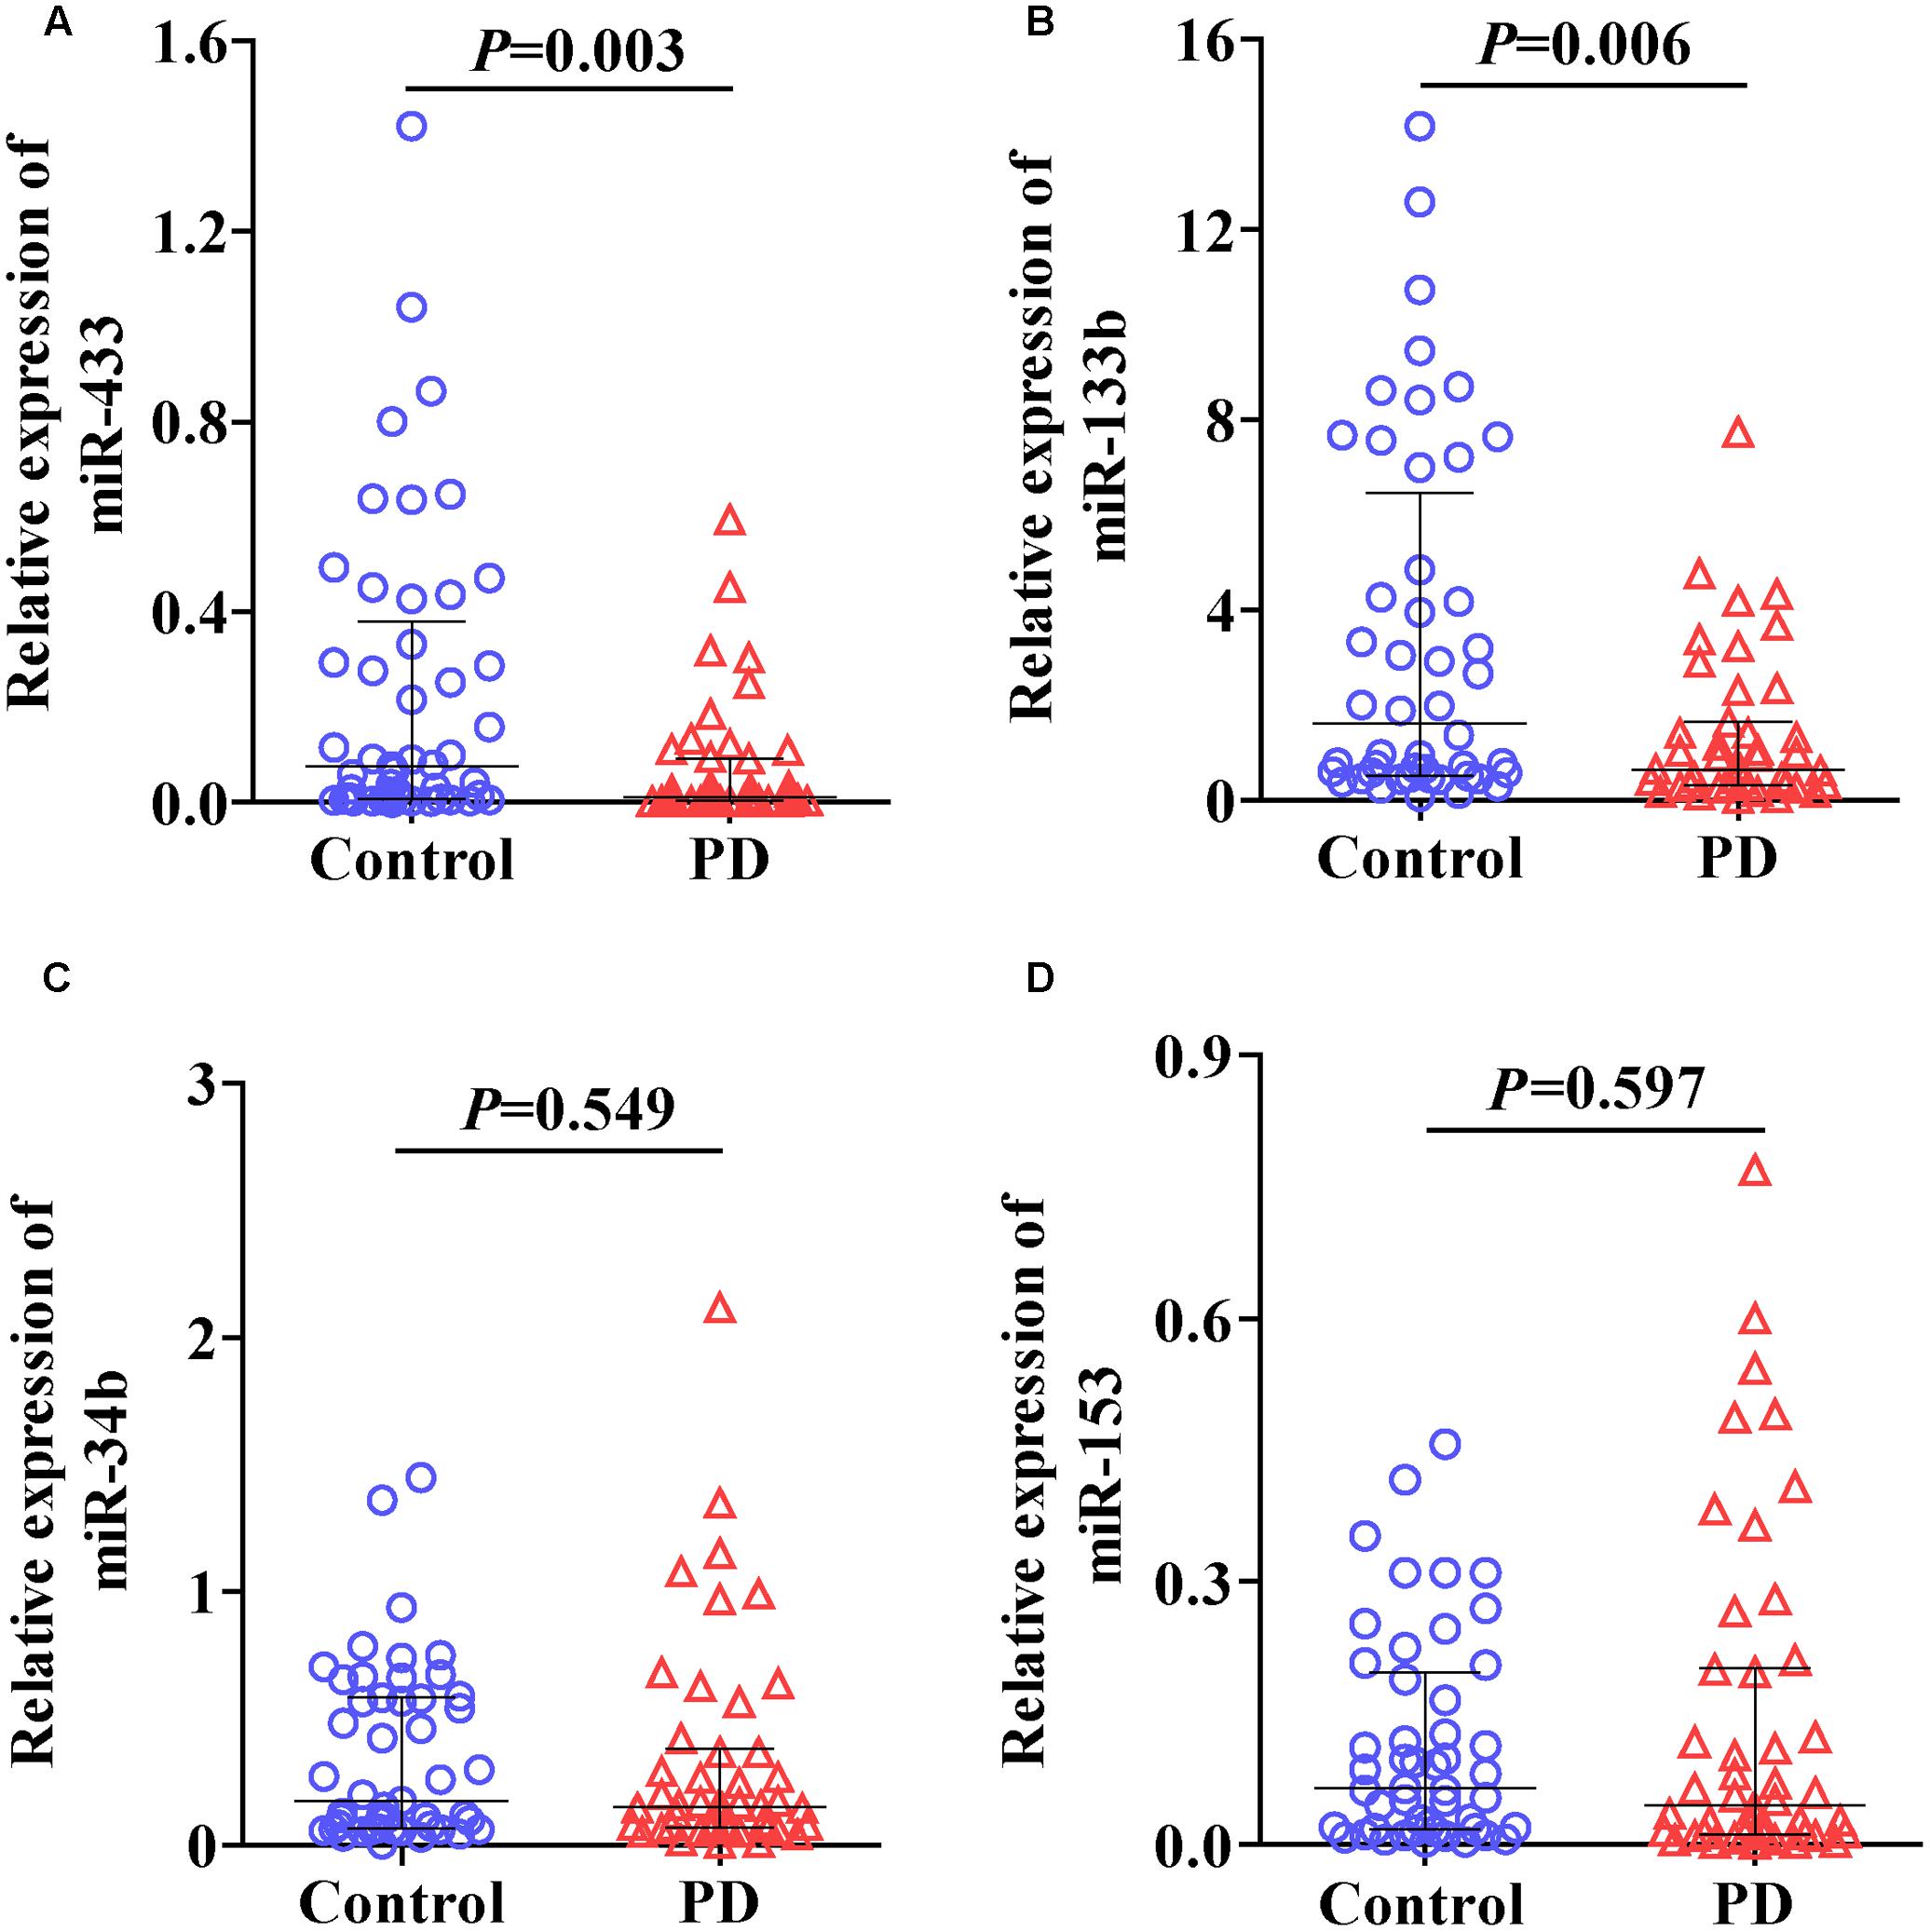
FIGURE 1. Levels of miR-433 (A), miR-133b (B), miR-34b (C), and miR-153 (D) in plasma of Parkinson’s disease (PD) patients and controls. Expression of miRNAs was expressed relative to their respective level of U6. The bar represents median with interquartile range.
Analysis of Correlation between the Four miRNAs in PD Patients and Controls
Correlations were analyzed to understand potential links within miR-433, miR-133b, miR-34b, and miR-153. The strongest correlation was present between miR-433 and miR-133b (rs = 0.87 and 0.85, respectively, in the control and PD groups; Figure 2A), followed by the correlation between miR-133b and miR-34b in the controls (rs = 0.78; Figure 2D). The results showed a pattern of reduction in miRNA correlations from the controls to patients (Figure 2). However, only the coefficient of the pair of miR-34b and miR-153 was significantly reduced in PD cases compared with that in the controls (z = 2.31; Figure 2F). In contrast, the other reductions from the controls to patients were not significant (Figures 2A–E; z = 0.35 for the pair of miR-433 and miR-133b; z = 1.55 for miR-433 and miR-34b; z = 1.89 for miR-433 and miR-153; z = 1.32 for miR-133b and miR-34b; z = 1.22 for miR-133b and miR-153). No correlation was found between age and miRNA expression levels in both control and PD groups (Supplementary Table S1). We also analyzed whether levels of the miRNAs were associated with disease severity, but found no difference among the three stages of our PD patients (Supplementary Table S2).
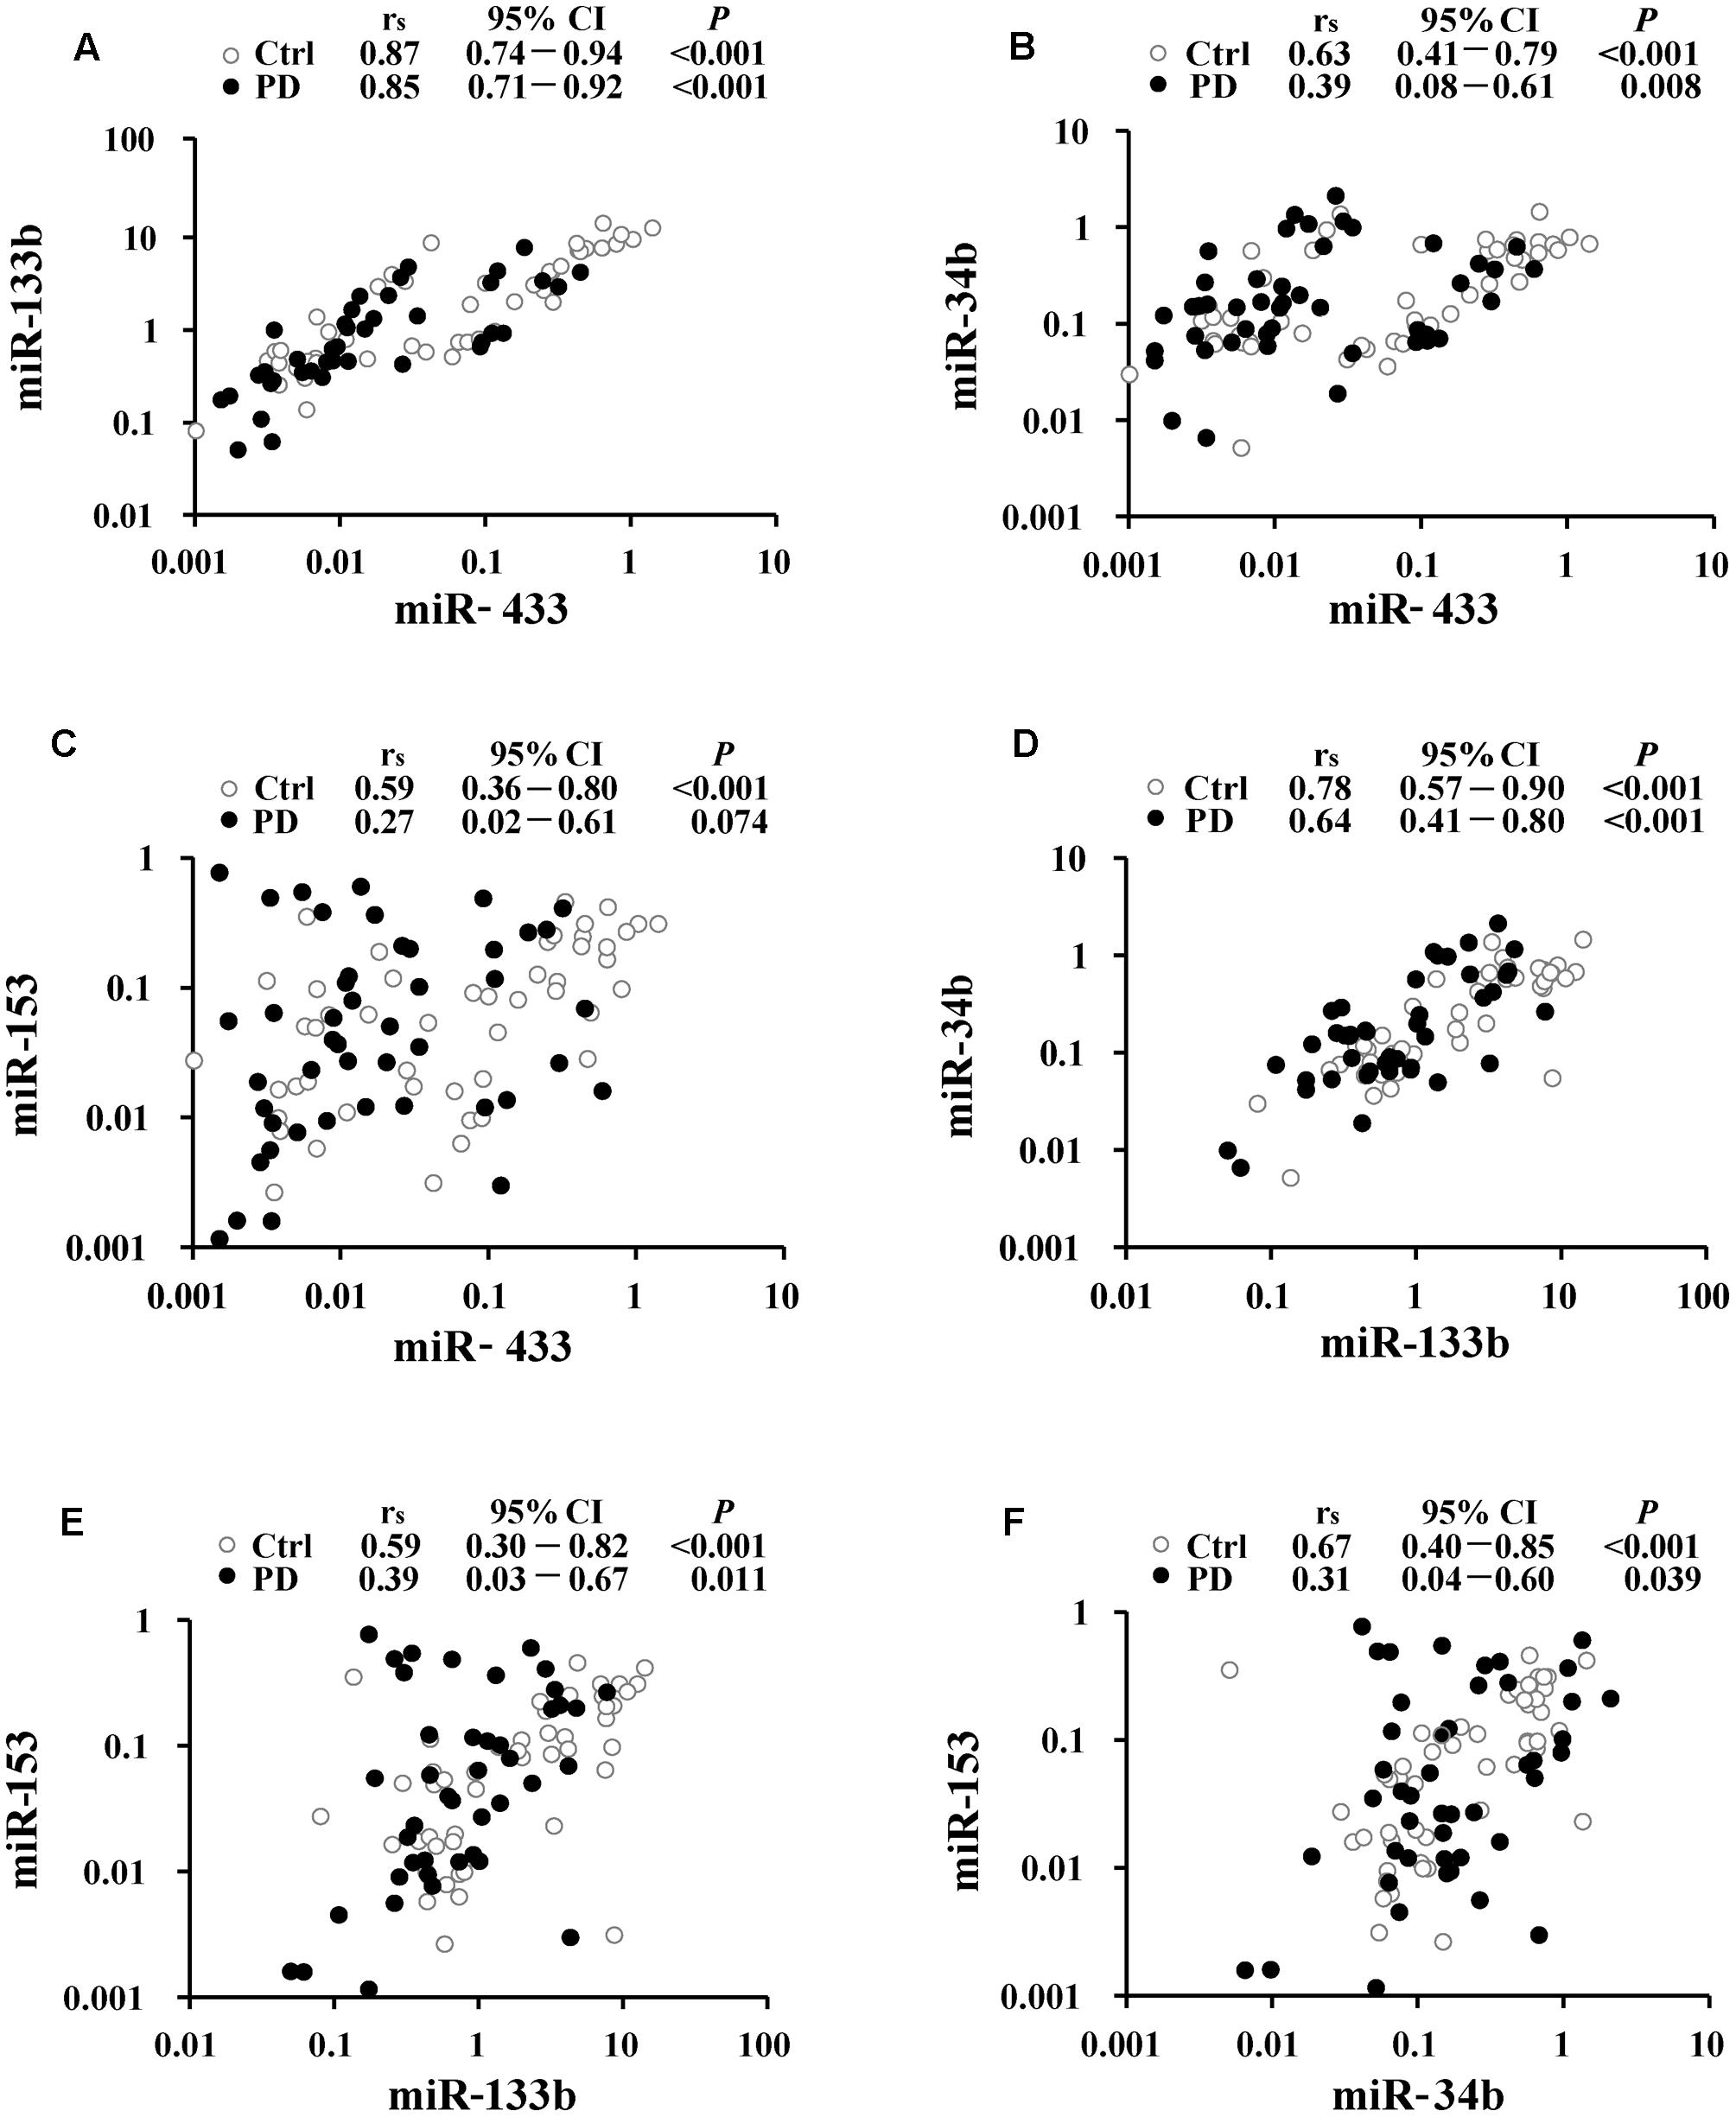
FIGURE 2. Correlation analyses between miR-433 and miR-133b (A), miR-433 and miR-34b (B), miR-433 and miR-153 (C), miR-133b and miR-34b (D), miR-133b and miR-153 (E), as well as miR-34b and miR-153 (F) in Parkinson’s disease (PD) and control (Ctrl) groups. Spearman’s rank correlation coefficient (rs) along with 95% confidence intervals (CI) and P-values are listed above each chart.
Pathway Analysis, GO Analysis, and PD Prediction Modeling
Given the PD-associated changes in miR-433 and miR-133b and their correlations, we performed further analyses to understand their potential target genes and similarities. Analysis in miRTarBase suggested 71 target genes for miR-433 and 67 for miR-133b (Supplementary Table S3). KEGG pathway analysis showed that the identified target genes of miR-433 were involved in 13 pathways and those of miR-133b were in 26 pathways, sharing seven pathways in common, including MAPK, PI3K-AKT, and Ras signaling pathways (Figure 3A). Results with statistical significance (P < 0.05) from GO analysis showed no shared biological processes for miR-433 and miR-133b, while the later was involved in more processes (41 vs. 6). The most significant biological processes included phosphatidylinositol-mediated signaling, positive regulation of DNA replication, regulation of actin cytoskeleton organization, and fibroblast growth factor receptor signaling pathway (Figure 3B).
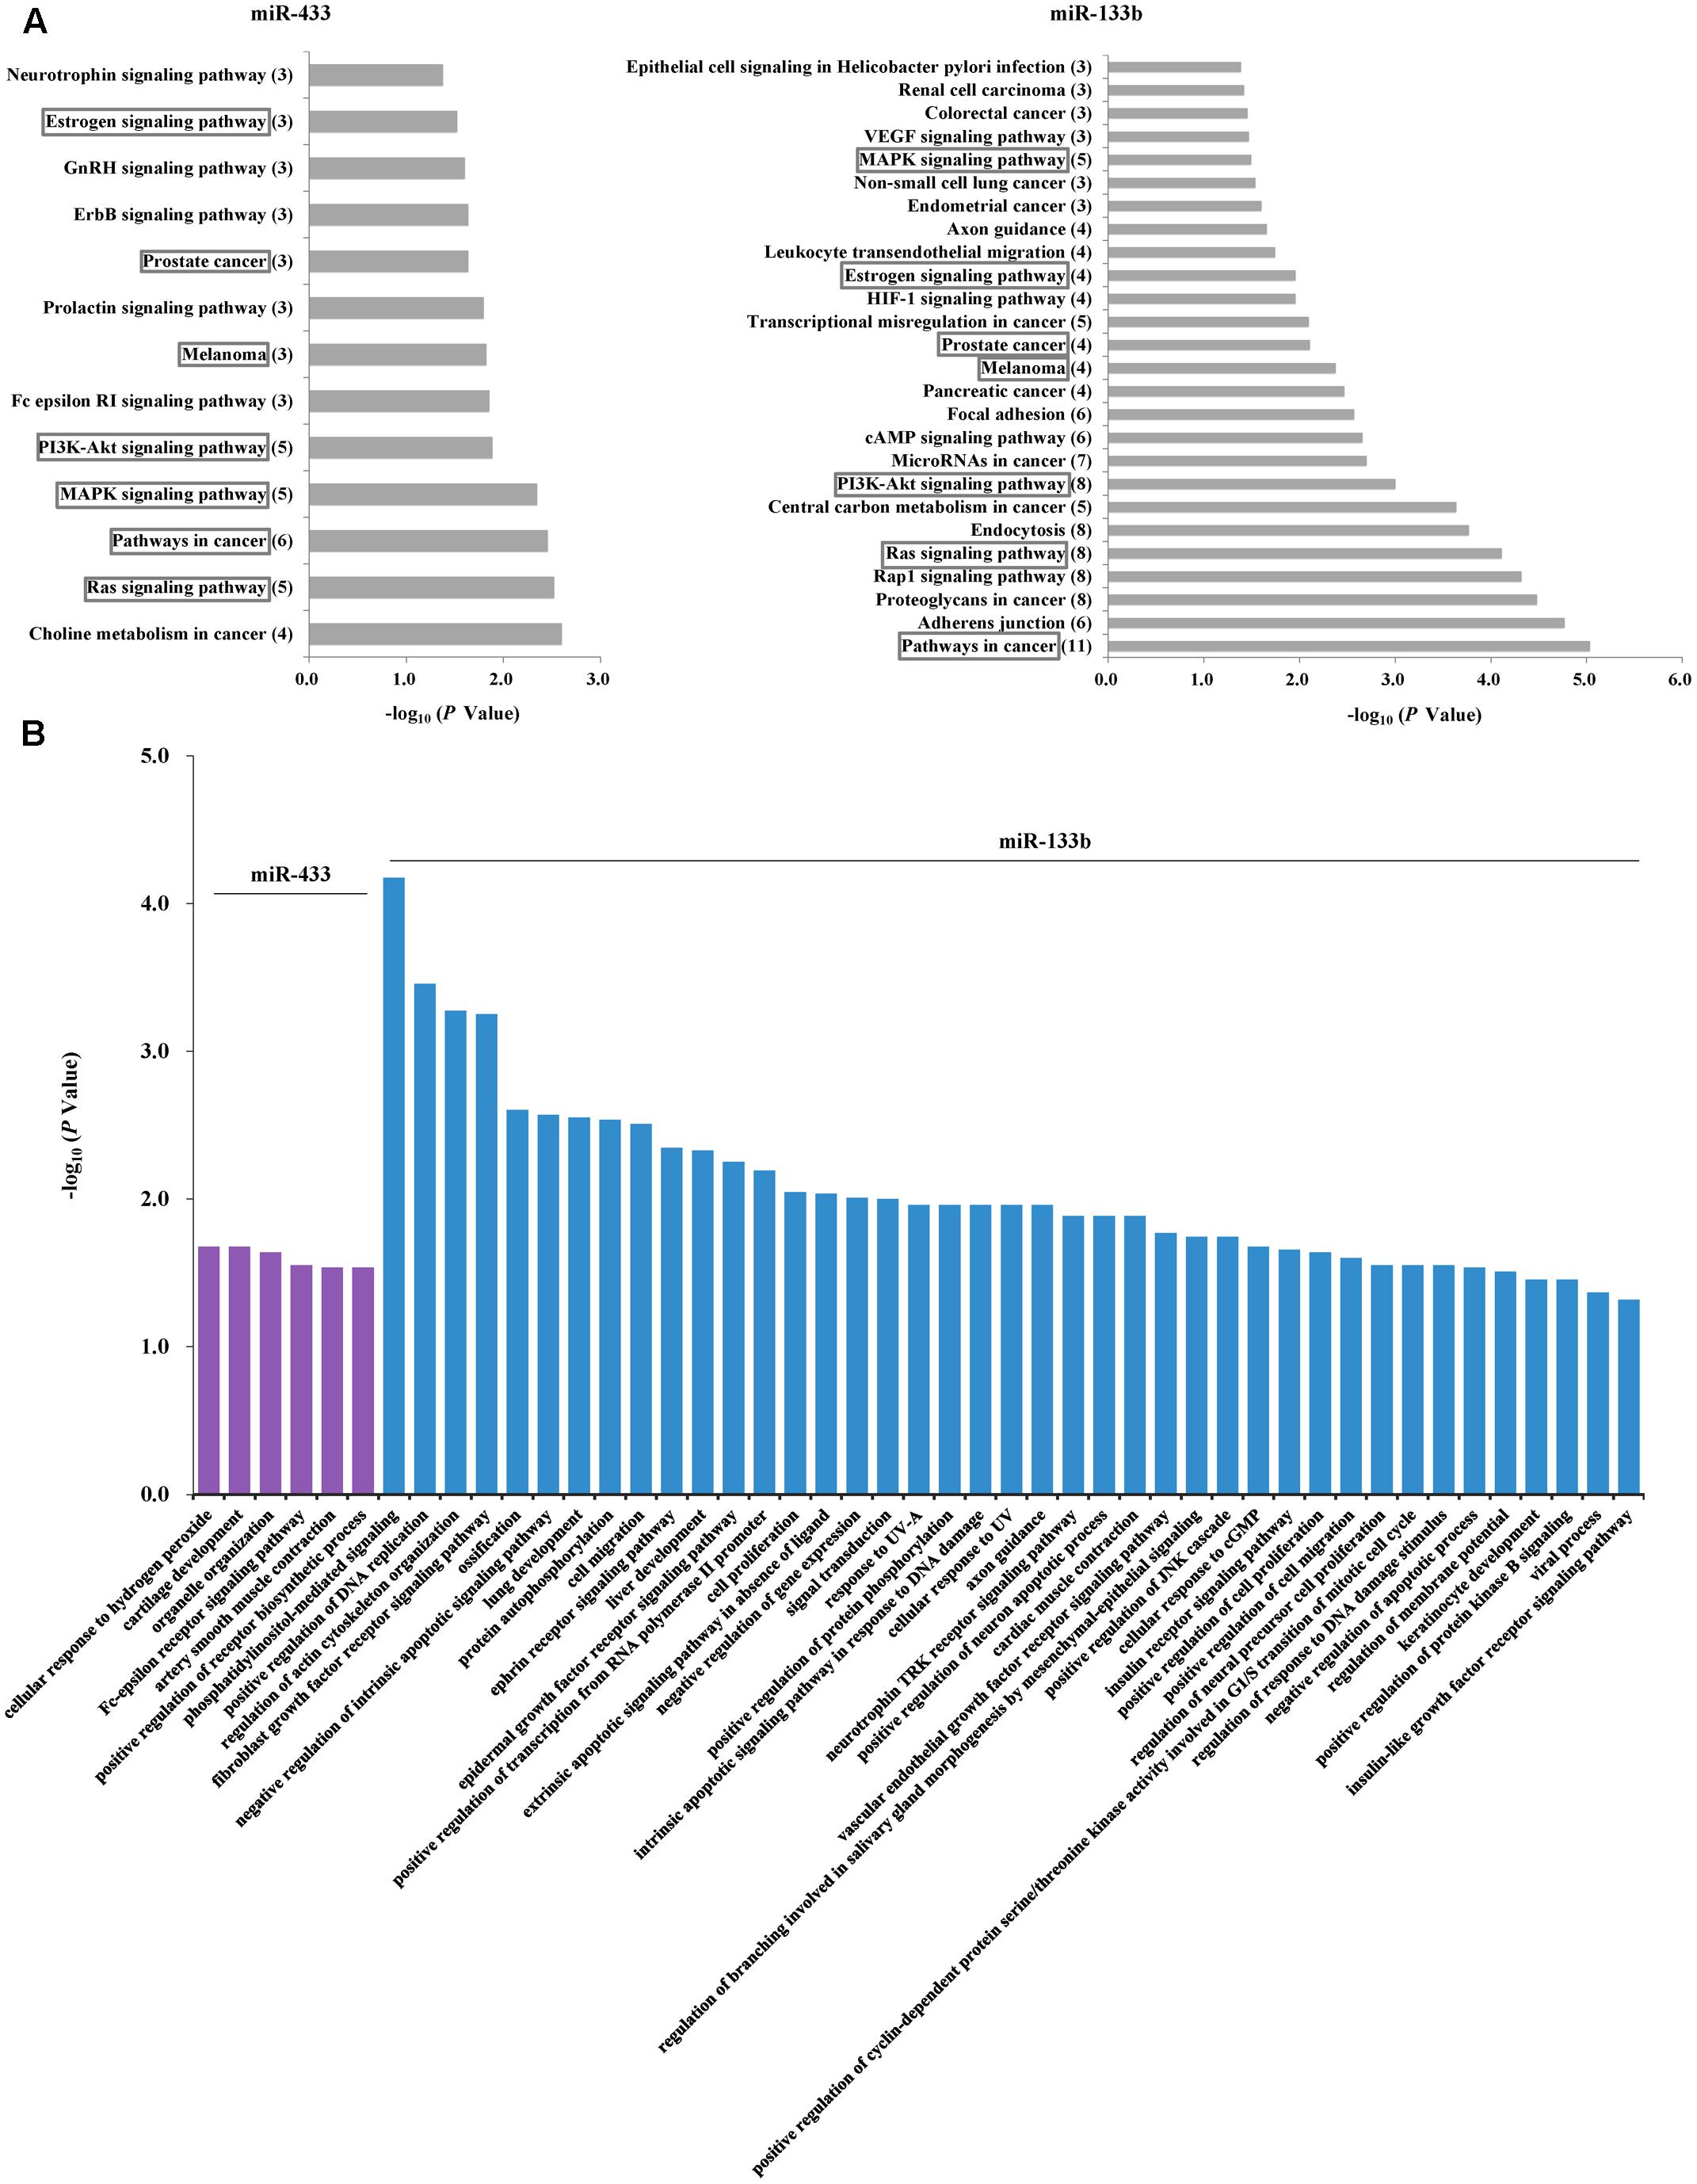
FIGURE 3. Analyses of potential target genes for miR-433 and miR-133b. (A) KEGG pathway analysis of the target genes. The horizontal axis represents enrichment score. The number of enriched genes for each pathway is shown in parentheses in the vertical axis. The boxes indicate the common pathways shared by miR-433 and miR-133b. (B) Gene ontology analysis of the target genes. P-value was to examine the significance of gene-term enrichment with a modified Fisher’s exact test. Only the pathways or biological processes with P < 0.05 were shown.
We also applied multiple supervised learning algorithms, including decision tree, conditional inference tree, random forest, support vector machine, naive Bayesian, and logistic regression, to model miR-433 and miR-133b for PD prediction (Table 2). None of the models led to decent overall performance in terms of AUC, accuracy, sensitivity, and specificity based on the current data. Interestingly, a specificity of 0.87 was achieved by naive Bayesian classifier.
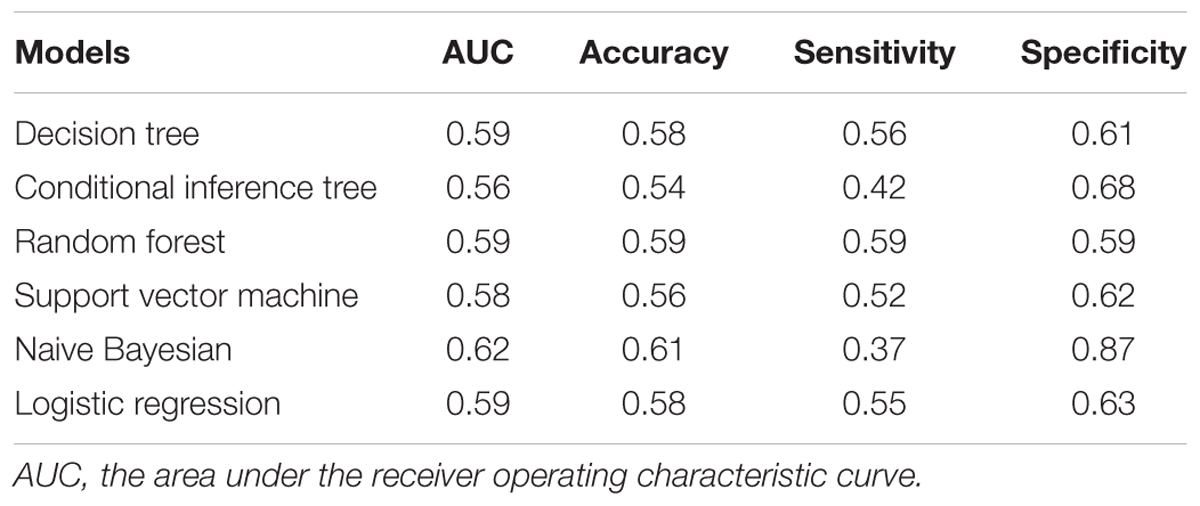
TABLE 2. Algorithm models of miR-433 and miR-133b for PD prediction.
Discussion
Deficiency in efficient biomarkers hinders timely intervention of PD and thus demands continuous endeavors. Aberrant miRNA expression has been suggested in a strength of linkage to sporadic PD (Harraz et al., 2011). Herein, we demonstrate that plasma levels of miR-433 and miR-133b significantly differ between PD patients and controls, following screening a set of cell-free PD-associated miRNAs. These two miRNAs exhibit strong correlations in terms of their expression levels in plasma, and share several common signaling pathways.
miR-433 binds to the promoter region of FGF20. A variant, rs12720208, at the miRNA binding site of FGF20 is associated with PD, as its risk allele prevents miR-433 from attaching and leads to increased FGF20 translation and subsequent α-synuclein expression (Wang et al., 2008). The reduced expression of miR-433 as suggested in plasma may contribute to increased FGF20 and α-synuclein expression, assuming that the plasma level reflects the changes in the brain. In accordance with our results, a recent profiling of extracellular miRNAs by small RNA sequencing also suggests a significant decrease of miR-433 in cerebrospinal fluid (CSF) of postmortem PD patients. Their profiling in serum shows five differentially expressed miRNAs (Table 3), but no statistical difference was found in miR-433 and miR-133b (Burgos et al., 2014). One possible reason for the discrepancy is that the profiling samples are from postmortem patients, which usually are at very late stage of the disease. Meanwhile, specific analysis by qPCR may be more sensitive than general sequencing profiling.
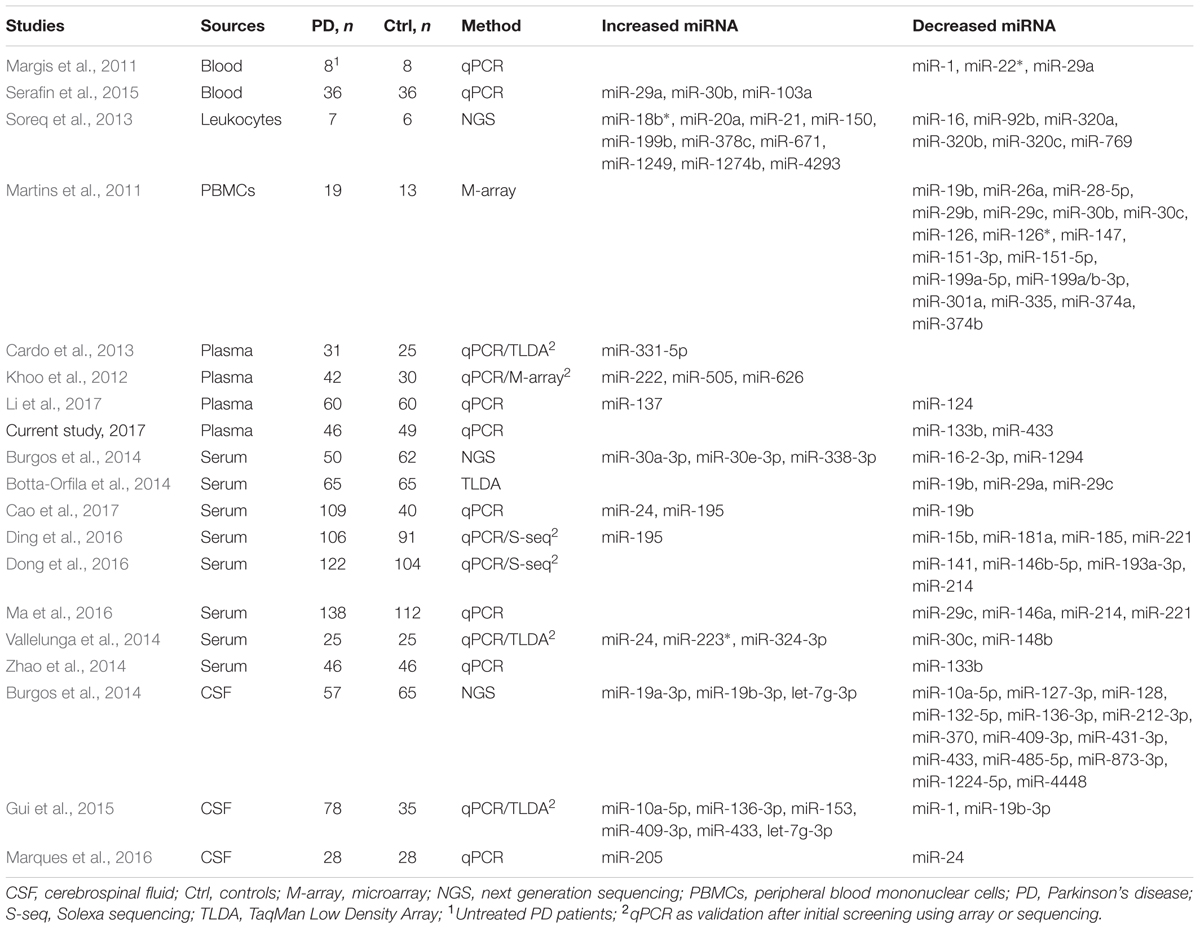
TABLE 3. Aberrant expression of miRNAs in fluids or blood cells of PD patients.
The miR-133b is enriched in dopaminergic neurons and is deficient in midbrain tissues of PD patients (Kim et al., 2007). The miR-133b suppresses midbrain dopaminergic neuron maturation and function by targeting Pitx3 as disclosed in primary rat midbrain cultures (Kim et al., 2007). The deficiency of miR-133b in PD is further confirmed using laser microdissected postmortem dopaminergic neurons in a case–control study (Sonntag, 2010). In accordance, miR-133b level is significantly decreased in plasma/serum of PD patients as shown in the current study and a previous report (Zhao et al., 2014). Interestingly, different from the above in vitro model (Kim et al., 2007), miR-133b null mice exhibit normal numbers of midbrain dopaminergic neurons during development and aging along with unchanged Pitx3 expression and dopamine release in the striatum (Heyer et al., 2012). This result indicates that miR-133b per se is not sufficient to induce the pathogenesis of PD, or its reduction in PD may merely be a consequence of dopaminergic neuronal loss during disease progression.
In contrast to miR-433, miR-133b, miR-34b, and miR-153, which are stably measurable in plasma, miR-34c and miR-7 are present at very low level in plasma, indicating that these two miRNAs may not be suitable to be biomarkers. On the other hand, our limited sample volume prevents us from detecting these low abundant miRNAs through the use of higher amount of RNA for the original cDNA synthesis. Results from microarray and sequencing analyses show that miR-34c and/or miR-7 are expressed in peripheral blood mononuclear cells (PBMCs) and in serum, although their expression not altered in PD (Martins et al., 2011; Burgos et al., 2014).
Pairwise correlations between miR-433, miR-133b, miR-34b, and miR-153 showed a trend of reduction in the PD group, indicating a differential involvement of these miRNAs in PD pathogenesis and/or pathology. Notably, the strongest correlation is observed between miR-433 and miR-133b, the two miRNAs with significant changes in PD. It appears that aging has no impact on levels of these miRNAs in plasma. However, further studies are needed from populations of wider age range since the age of participants in this study resides in a narrow range. It is surprising that changes in miR-433 and miR-133b expression are not associated with PD severity, although this seems not a sole case (Zhao et al., 2014; Li et al., 2017). Further studies are needed with larger sample size for each stage.
Potential target genes of miR-433 and miR-133b were involved in various pathways, sharing seven in common. However, no overlap was found in these genes, neither in the biological processes, suggesting that they function likely in a complementary manner. Modeling using data of miR-433 and miR-133b does not generate satisfactory performance for PD prediction. It may attribute to our relative small sample size that limits the cross-validation to build an optimal machine-learning model. On the other hand, it may not be surprising since a single form of biomarker has been considered almost impossible to predict PD and a combination of multiple testing including imaging, biochemical, and genetic is proposed to be required for future success (Kalia and Lang, 2015).
Proper normalization is critical for detection of authentic biological differences between samples. Although there is no consensus on the miRNA loading control (Laurent et al., 2015), many studies have used nucleolar RNA U6 as an internal control to normalize circulating miRNAs (Ai et al., 2010; Wang et al., 2013; Zhao et al., 2014), while some studies simply follow a consistent reaction system using no normalization controls as noted earlier (Chen et al., 2008; Ren et al., 2013). Besides, endogenous miR-16-5p, considered to be similar among individuals in most cases, was occasionally used as an internal control (Song et al., 2012). However, serum or plasma prepared from hemolyzed blood samples may contain miR-16-5p that can be increased by 20- to 30-fold (Pritchard et al., 2012). Exogenous synthesized miRNAs such as Caenorhabditis elegans miR-39/54/238 are also used for normalization (Mitchell et al., 2008; Brase et al., 2011; Tan et al., 2014), which, however, lack the capacity to normalize biological and pathological variations (Laurent et al., 2015). In general, higher amount of qPCR template can reduce the cycle number and obtain lower Ct value for potentially more stable values, and larger sample size helps the power of analysis (Dong et al., 2016). Unfortunately, there is realistic challenges to acquire more volume and more samples such as in the study by Muller et al. (2014). In the current study, some Ct values are relatively high in measurements of miR-433 and miR-153. As indicated in Section “Materials and Methods,” triplicate repeats are used during each qPCR to help the quality control of reliability. The normalization methods using U6 as an internal control and using no control lead to similar results, suggesting that our reactions are stably performed following a consistent system.
As summarized in Table 3, miRNA biomarkers of PD are investigated in blood, PBMCs, leukocytes, plasma, serum, and CSF. There seems no report in urine and saliva, although cases are found in other diseases such as cancer (Park et al., 2009; Yamada et al., 2011). Interestingly, the identified differentially expressed miRNAs in PD are varied among studies (Table 3). As mentioned earlier, we selected the six miRNAs based on postmortem evidence in brain and/or regulating α-synuclein expression. Not considering the studies which measure miRNAs individually selected by their respective rationales, results from screenings by arrays or next generation sequencing are surprisingly rarely overlapped (Martins et al., 2011; Khoo et al., 2012; Cardo et al., 2013; Soreq et al., 2013; Botta-Orfila et al., 2014; Burgos et al., 2014; Vallelunga et al., 2014; Gui et al., 2015; Ding et al., 2016; Dong et al., 2016). This discrepancy may be attributed to differences in ages, disease stages and subtypes of included patients, threshold of significance in data processing, sample sizes, and type of sources if using different fluids/cells. Of note from the overall results, a decreased level of miR-19b/miR-19b-3p in PD is suggested by four studies, respectively, in PBMCs (Martins et al., 2011), serum (Botta-Orfila et al., 2014; Cao et al., 2017), and CSF (Gui et al., 2015), except one study which shows increased miR-19b-3p expression in CSF (Burgos et al., 2014). The expression of miR-195 is suggested increased in serum of PD by two studies (Ding et al., 2016; Cao et al., 2017). The expression of miR-30c is decreased in PD, respectively, in PBMCs (Martins et al., 2011) and serum (Vallelunga et al., 2014). Decreased levels of miR-133b and miR-433 in plasma of PD as shown in the current study are in line with two previous reports, respectively in serum and CSF (Burgos et al., 2014; Zhao et al., 2014). Also, consistent with our results, miR-153 and miR-34b are not reported to be changed in fluids of PD. miR-34c and miR-7, which are not sufficiently detected in our condition, are not suggested to be changed either in PD (Table 3). Further investigations are warranted to clarify how levels of miRNAs change in the fluids of PD in association with PD subtypes and disease progression. Also, the differences may be worth testing in urine and saliva in order to further understand their potentiality to serve as PD biomarkers.
Conclusion
While it is a long haul to eventually identify clinic proven biomarkers, we herein screen and demonstrate that levels of miR-433 and miR-133b, two miRNAs associated with PD pathogenesis, are significantly reduced in plasma of PD patients and not correlated with age, suggesting their specificity and potentiality to serve as biomarkers. Future studies are needed in combination with other testing to upgrade their performance in predicting PD.
Author Contributions
J-HZ, XZ, and H-MW designed and supervised the project. XZ, B-LH, and Z-YH collected samples and clinical data. RY and L-LZ performed research. RY, PL, and H-MW analyzed data. J-HZ and RY wrote the article.
Funding
This work was supported by funding from Natural Science Foundation of Zhejiang Province (LY16H310012), National Natural Science Foundation of China (81571087), Science and Technology Department of Zhejiang Province (2016C33180), Wenzhou Municipal Science and Technology Bureau (Y20150005).
Supplementary Material
The Supplementary Material for this article can be found online at: https://www.frontiersin.org/article/10.3389/fncel.2017.00170/full#supplementary-material
Conflict of Interest Statement
The authors declare that the research was conducted in the absence of any commercial or financial relationships that could be construed as a potential conflict of interest.
Footnotes
References
Ai, J., Zhang, R., Li, Y., Pu, J., Lu, Y., Jiao, J., et al. (2010). Circulating microRNA-1 as a potential novel biomarker for acute myocardial infarction. Biochem. Biophys. Res. Commun. 391, 73–77. doi: 10.1016/j.bbrc.2009.11.005
Ashburner, M., Ball, C. A., Blake, J. A., Botstein, D., Butler, H., Cherry, J. M., et al. (2000). Gene Ontology: tool for the unification of biology. Nat. Genet. 25, 25–29.
Bekris, L. M., Mata, I. F., and Zabetian, C. P. (2010). The genetics of Parkinson disease. J. Geriatr. Psychiatry Neurol. 23, 228–242. doi: 10.1177/0891988710383572
Botta-Orfila, T., Morato, X., Compta, Y., Lozano, J. J., Falgas, N., Valldeoriola, F., et al. (2014). Identification of blood serum micro-RNAs associated with idiopathic and LRRK2 Parkinson’s disease. J. Neurosci. Res. 92, 1071–1077. doi: 10.1002/jnr.23377
Brase, J. C., Johannes, M., Schlomm, T., Falth, M., Haese, A., Steuber, T., et al. (2011). Circulating miRNAs are correlated with tumor progression in prostate cancer. Int. J. Cancer 128, 608–616. doi: 10.1002/ijc.25376
Burgos, K., Malenica, I., Metpally, R., Courtright, A., Rakela, B., Beach, T., et al. (2014). Profiles of extracellular miRNA in cerebrospinal fluid and serum from patients with Alzheimer’s and Parkinson’s diseases correlate with disease status and features of pathology. PLoS ONE 9:e94839. doi: 10.1371/journal.pone.0094839
Cao, X. Y., Lu, J. M., Zhao, Z. Q., Li, M. C., Lu, T., An, X. S., et al. (2017). MicroRNA biomarkers of Parkinson’s disease in serum exosome-like microvesicles. Neurosci. Lett. 644, 94–99. doi: 10.1016/j.neulet.2017.02.045
Cardo, L. F., Coto, E., de Mena, L., Ribacoba, R., Moris, G., Menendez, M., et al. (2013). Profile of microRNAs in the plasma of Parkinson’s disease patients and healthy controls. J. Neurol. 260, 1420–1422. doi: 10.1007/s00415-013-6900-8
Chen, K., and Rajewsky, N. (2007). The evolution of gene regulation by transcription factors and microRNAs. Nat. Rev. Genet. 8, 93–103. doi: 10.1038/nrg1990
Chen, X., Ba, Y., Ma, L., Cai, X., Yin, Y., Wang, K., et al. (2008). Characterization of microRNAs in serum: a novel class of biomarkers for diagnosis of cancer and other diseases. Cell Res. 18, 997–1006. doi: 10.1038/cr.2008.282
Cortes, C., and Vapnik, V. (1995). Support-vector networks. Mach. Learn. 20, 273–297. doi: 10.1007/bf00994018
Ding, H., Huang, Z., Chen, M., Wang, C., Chen, X., Chen, J., et al. (2016). Identification of a panel of five serum miRNAs as a biomarker for Parkinson’s disease. Parkinsonism Relat. Disord. 22, 68–73. doi: 10.1016/j.parkreldis.2015.11.014
Dong, H., Wang, C., Lu, S., Yu, C., Huang, L., Feng, W., et al. (2016). A panel of four decreased serum microRNAs as a novel biomarker for early Parkinson’s disease. Biomarkers 21, 129–137. doi: 10.3109/1354750x.2015.1118544
Doxakis, E. (2010). Post-transcriptional regulation of alpha-synuclein expression by mir-7 and mir-153. J. Biol. Chem. 285, 12726–12734. doi: 10.1074/jbc.M109.086827
Gallo, A., Tandon, M., Alevizos, I., and Illei, G. G. (2012). The majority of microRNAs detectable in serum and saliva is concentrated in exosomes. PLoS ONE 7:e30679. doi: 10.1371/journal.pone.0030679
Gene Ontology Consortium (2004). The Gene Ontology (GO) database and informatics resource. Nucleic Acids Res. 32(Suppl. 1), D258–D261.
Gui, Y., Liu, H., Zhang, L., Lv, W., and Hu, X. (2015). Altered microRNA profiles in cerebrospinal fluid exosome in Parkinson disease and Alzheimer disease. Oncotarget 6, 37043–37053. doi: 10.18632/oncotarget.6158
Harraz, M. M., Dawson, T. M., and Dawson, V. L. (2011). MicroRNAs in Parkinson’s disease. J. Chem. Neuroanat. 42, 127–130. doi: 10.1016/j.jchemneu.2011.01.005
Heyer, M. P., Pani, A. K., Smeyne, R. J., Kenny, P. J., and Feng, G. (2012). Normal midbrain dopaminergic neuron development and function in miR-133b mutant mice. J. Neurosci. 32, 10887–10894. doi: 10.1523/JNEUROSCI.1732-12.2012
Hoehn, M. M., and Yahr, M. D. (1998). Parkinsonism: onset, progression, and mortality. Neurology 50, 318.
Hosmer, D. W., and Lemeshow, S. (eds). (2000). “Introduction to the logistic regression model,” in Applied Logistic Regression, 2nd Edn, (Hoboken, NJ: John Wiley & Sons, Inc.), 1–30.
Hothorn, T., Hornik, K., and Zeileis, A. (2006). Unbiased recursive partitioning: a conditional inference framework. J. Comput. Graph. Stat. 15, 651–674.
Hsu, S.-D., Tseng, Y.-T., Shrestha, S., Lin, Y.-L., Khaleel, A., Chou, C.-H., et al. (2014). miRTarBase update 2014: an information resource for experimentally validated miRNA-target interactions. Nucleic Acids Res. 42, D78–D85. doi: 10.1093/nar/gkt1266
Huang, D. W., Sherman, B. T., and Lempicki, R. A. (2009). Systematic and integrative analysis of large gene lists using DAVID bioinformatics resources. Nat. Protoc. 4, 44–57. doi: 10.1038/nprot.2008.211
Junn, E., Lee, K. W., Jeong, B. S., Chan, T. W., Im, J. Y., and Mouradian, M. M. (2009). Repression of alpha-synuclein expression and toxicity by microRNA-7. Proc. Natl. Acad. Sci. U.S.A. 106, 13052–13057. doi: 10.1073/pnas.0906277106
Kabaria, S., Choi, D. C., Chaudhuri, A. D., Mouradian, M. M., and Junn, E. (2015). Inhibition of miR-34b and miR-34c enhances alpha-synuclein expression in Parkinson’s disease. FEBS Lett. 589, 319–325. doi: 10.1016/j.febslet.2014.12.014
Kalia, L. V., and Lang, A. E. (2015). Parkinson’s disease. Lancet 386, 896–912. doi: 10.1016/S0140-6736(14)61393-3
Kanehisa, M., and Goto, S. (2000). KEGG: kyoto encyclopedia of genes and genomes. Nucleic Acids Res. 28, 27–30.
Khoo, S. K., Petillo, D., Kang, U. J., Resau, J. H., Berryhill, B., Linder, J., et al. (2012). Plasma-based circulating MicroRNA biomarkers for Parkinson’s disease. J. Parkinsons Dis. 2, 321–331. doi: 10.3233/jpd-012144
Kim, J., Inoue, K., Ishii, J., Vanti, W. B., Voronov, S. V., Murchison, E., et al. (2007). A MicroRNA feedback circuit in midbrain dopamine neurons. Science 317, 1220–1224. doi: 10.1126/science.1140481
Laurent, L. C., Abdel-Mageed, A. B., Adelson, P. D., Arango, J., Balaj, L., Breakefield, X., et al. (2015). Meeting report: discussions and preliminary findings on extracellular RNA measurement methods from laboratories in the NIH extracellular RNA communication consortium. J. Extracell. Vesicles 4:26533. doi: 10.3402/jev.v4.26533
Laurikkala, J., Juhola, M., Kentala, E., Lavrac, N., Miksch, S., and Kavsek, B. (2000). “Informal identification of outliers in medical data,” in Proceedings of the Fifth International Workshop on Intelligent Data Analysis in Medicine and Pharmacology, Berlin, 20–24.
Leung, K. M. (2007). Naive Bayesian Classifier. Available: http://cis.poly.edu/~mleung/FRE7851/f07/naiveBayesianClassifier.pdf
Li, N., Pan, X., Zhang, J., Ma, A., Yang, S., Ma, J., et al. (2017). Plasma levels of miR-137 and miR-124 are associated with Parkinson’s disease but not with Parkinson’s disease with depression. Neurol. Sci. 38, 761–767. doi: 10.1007/s10072-017-2841-9
Ma, W., Li, Y., Wang, C., Xu, F., Wang, M., and Liu, Y. (2016). Serum miR-221 serves as a biomarker for Parkinson’s disease. Cell. Biochem. Funct. 34, 511–515. doi: 10.1002/cbf.3224
Margis, R., Margis, R., and Rieder, C. R. (2011). Identification of blood microRNAs associated to Parkinsonis disease. J. Biotechnol. 152, 96–101. doi: 10.1016/j.jbiotec.2011.01.023
Marques, T. M., Kuiperij, H. B., Bruinsma, I. B., van Rumund, A., Aerts, M. B., Esselink, R. A., et al. (2016). MicroRNAs in cerebrospinal fluid as potential biomarkers for Parkinson’s disease and multiple system atrophy. Mol. Neurobiol. doi: 10.1007/s12035-016-0253-0 [Epub ahead of print].
Martins, M., Rosa, A., Guedes, L. C., Fonseca, B. V., Gotovac, K., Violante, S., et al. (2011). Convergence of miRNA expression profiling, alpha-synuclein interacton and GWAS in Parkinson’s disease. PLoS ONE 6:e25443. doi: 10.1371/journal.pone.0025443
McCulloch, C. C., Kay, D. M., Factor, S. A., Samii, A., Nutt, J. G., Higgins, D. S., et al. (2008). Exploring gene-environment interactions in Parkinson’s disease. Hum. Genet. 123, 257–265. doi: 10.1007/s00439-008-0466-z
Minones-Moyano, E., Porta, S., Escaramis, G., Rabionet, R., Iraola, S., Kagerbauer, B., et al. (2011). MicroRNA profiling of Parkinson’s disease brains identifies early downregulation of miR-34b/c which modulate mitochondrial function. Hum. Mol. Genet. 20, 3067–3078. doi: 10.1093/hmg/ddr210
Mitchell, P. S., Parkin, R. K., Kroh, E. M., Fritz, B. R., Wyman, S. K., Pogosova-Agadjanyan, E. L., et al. (2008). Circulating microRNAs as stable blood-based markers for cancer detection. Proc. Natl. Acad. Sci. U.S.A. 105, 10513–10518. doi: 10.1073/pnas.0804549105
Muller, M., Kuiperij, H. B., Claassen, J. A., Kusters, B., and Verbeek, M. M. (2014). MicroRNAs in Alzheimer’s disease: differential expression in hippocampus and cell-free cerebrospinal fluid. Neurobiol. Aging 35, 152–158. doi: 10.1016/j.neurobiolaging.2013.07.005
Park, N. J., Zhou, H., Elashoff, D., Henson, B. S., Kastratovic, D. A., Abemayor, E., et al. (2009). Salivary microRNA: discovery, characterization, and clinical utility for oral cancer detection. Clin. Cancer Res. 15, 5473–5477. doi: 10.1158/1078-0432.ccr-09-0736
Postuma, R. B., Aarsland, D., Barone, P., Burn, D. J., Hawkes, C. H., Oertel, W., et al. (2012). Identifying prodromal Parkinson’s disease: pre-motor disorders in Parkinson’s disease. Mov. Disord. 27, 617–626. doi: 10.1002/mds.24996
Pritchard, C. C., Kroh, E., Wood, B., Arroyo, J. D., Dougherty, K. J., Miyaji, M. M., et al. (2012). Blood cell origin of circulating microRNAs: a cautionary note for cancer biomarker studies. Cancer Prev. Res. 5, 492–497. doi: 10.1158/1940-6207.CAPR-11-0370
Reid, G., Kirschner, M. B., and van Zandwijk, N. (2011). Circulating microRNAs: association with disease and potential use as biomarkers. Crit. Rev. Oncol. Hematol. 80, 193–208. doi: 10.1016/j.critrevonc.2010.11.004
Ren, S., Wang, F., Shen, J., Sun, Y., Xu, W., Lu, J., et al. (2013). Long non-coding RNA metastasis associated in lung adenocarcinoma transcript 1 derived miniRNA as a novel plasma-based biomarker for diagnosing prostate cancer. Eur. J. Cancer 49, 2949–2959. doi: 10.1016/j.ejca.2013.04.026
Rodriguez, J. J., Kuncheva, L. I., and Alonso, C. J. (2006). Rotation forest: a new classifier ensemble method. IEEE Trans. Pattern Anal. Mach. Intell. 28, 1619–1630.
Serafin, A., Foco, L., Zanigni, S., Blankenburg, H., Picard, A., Zanon, A., et al. (2015). Overexpression of blood microRNAs 103a, 30b, and 29a in L-dopa-treated patients with PD. Neurology 84, 645–653. doi: 10.1212/wnl.0000000000001258
Song, J., Bai, Z., Han, W., Zhang, J., Meng, H., Bi, J., et al. (2012). Identification of suitable reference genes for qPCR analysis of serum microRNA in gastric cancer patients. Dig. Dis. Sci. 57, 897–904. doi: 10.1007/s10620-011-1981-7
Sonntag, K. C. (2010). MicroRNAs and deregulated gene expression networks in neurodegeneration. Brain Res. 1338, 48–57. doi: 10.1016/j.brainres.2010.03.106
Soreq, L., Salomonis, N., Bronstein, M., Greenberg, D. S., Israel, Z., Bergman, H., et al. (2013). Small RNA sequencing-microarray analyses in Parkinson leukocytes reveal deep brain stimulation-induced splicing changes that classify brain region transcriptornes. Front. Mol. Neurosci. 6:10. doi: 10.3389/fnmol.2013.00010
Tan, L., Yu, J. T., Liu, Q. Y., Tan, M. S., Zhang, W., Hu, N., et al. (2014). Circulating miR-125b as a biomarker of Alzheimer’s disease. J. Neurol. Sci. 336, 52–56. doi: 10.1016/j.jns.2013.10.002
Vallelunga, A., Ragusa, M., Di Mauro, S., Iannitti, T., Pilleri, M., Biundo, R., et al. (2014). Identification of circulating microRNAs for the differential diagnosis of Parkinson’s disease and Multiple System Atrophy. Front. Cell. Neurosci. 8:156. doi: 10.3389/fncel.2014.00156
Villar-Menendez, I., Porta, S., Buira, S. P., Pereira-Veiga, T., Diaz-Sanchez, S., Luis Albasanz, J., et al. (2014). Increased striatal adenosine A(2A) receptor levels is an early event in Parkinson’s disease-related pathology and it is potentially regulated by miR-34b. Neurobiol. Dis. 69, 206–214. doi: 10.1016/j.nbd.2014.05.030
Wang, G., van der Walt, J. M., Mayhew, G., Li, Y. J., Zuchner, S., Scott, W. K., et al. (2008). Variation in the miRNA-433 binding site of FGF20 confers risk for Parkinson disease by overexpression of alpha-synuclein. Am. J. Hum. Genet. 82, 283–289. doi: 10.1016/j.ajhg.2007.09.021
Wang, L., Wang, H. C., Chen, C., Zeng, J., Wang, Q., Zheng, L., et al. (2013). Differential expression of plasma miR-146a in sepsis patients compared with non-sepsis-SIRS patients. Exp. Ther. Med. 5, 1101–1104. doi: 10.3892/etm.2013.937
Yamada, Y., Enokida, H., Kojima, S., Kawakami, K., Chiyomaru, T., Tatarano, S., et al. (2011). MiR-96 and miR-183 detection in urine serve as potential tumor markers of urothelial carcinoma: correlation with stage and grade, and comparison with urinary cytology. Cancer Sci. 102, 522–529. doi: 10.1111/j.1349-7006.2010.01816.x
Keywords: Parkinson’s disease, plasma, microRNA, biomarker, miR-433, miR-133b
Citation: Zhang X, Yang R, Hu B-L, Lu P, Zhou L-L, He Z-Y, Wu H-M and Zhu J-H (2017) Reduced Circulating Levels of miR-433 and miR-133b Are Potential Biomarkers for Parkinson’s Disease. Front. Cell. Neurosci. 11:170. doi: 10.3389/fncel.2017.00170
Received: 29 March 2017; Accepted: 06 June 2017;
Published: 23 June 2017.
Edited by:
Antonio Gambardella, Magna Græcia University, ItalyReviewed by:
Christina Gross, Cincinnati Children’s Hospital Medical Center, United StatesFabio Gabriel Teixeira, Instituto de Pesquisa em Ciências da Vida e da Saúde (ICVS), Portugal
Copyright © 2017 Zhang, Yang, Hu, Lu, Zhou, He, Wu and Zhu. This is an open-access article distributed under the terms of the Creative Commons Attribution License (CC BY). The use, distribution or reproduction in other forums is permitted, provided the original author(s) or licensor are credited and that the original publication in this journal is cited, in accordance with accepted academic practice. No use, distribution or reproduction is permitted which does not comply with these terms.
*Correspondence: Jian-Hong Zhu, jhzhu@wmu.edu.cn; jianhong.zhu@gmail.com Hong-Mei Wu, hmwu@wmu.edu.cn