 Federica Murgia1
 Antonella Muroni2
 Monica Puligheddu3
 Lorenzo Polizzi2
 Luigi Barberini3
 Gianni Orofino3
 Paolo Solla3
 Simone Poddighe1,4
 Francesco Del Carratore1,5
 Julian L. Griffin6
 Luigi Atzori1†
 Francesco Marrosu3*†
- 1Department of Biomedical Science, University of Cagliari, Cagliari, Italy
- 2Azienda Ospedaliera Universitaria (A.O.U) of Cagliari, Cagliari, Italy
- 3Department of Medical Sciences and Public Health, University of Cagliari, Cagliari, Italy
- 4Unité de Chimie Environnementale et Interactions sur le Vivant, Université du Littoral Côte d’Opale, Dunkerque, France
- 5Faculty of Life Sciences, Manchester Institute of Biotechnology, University of Manchester, Manchester, United Kingdom
- 6Department of Biochemistry, University of Cambridge, Cambridge, United Kingdom
Purpose: Drug resistance is a critical issue in the treatment of epilepsy, contributing to clinical emergencies and increasing both serious social and economic burdens on the health system. The wide variety of potential drug combinations followed by often failed consecutive attempts to match drugs to an individual patient may mean that this treatment stage may last for years with suboptimal benefit to the patient. Given these challenges, it is valuable to explore the availability of new methodologies able to shorten the period of determining a rationale pharmacologic treatment. Metabolomics could provide such a tool to investigate possible markers of drug resistance in subjects with epilepsy.
Methods: Blood samples were collected from (1) controls (C) (n = 35), (2) patients with epilepsy “responder” (R) (n = 18), and (3) patients with epilepsy “non-responder” (NR) (n = 17) to the drug therapy. The samples were analyzed using nuclear magnetic resonance spectroscopy, followed by multivariate statistical analysis.
Key findings: A different metabolic profile based on metabolomics analysis of the serum was observed between C and patients with epilepsy and also between R and NR patients. It was possible to identify the discriminant metabolites for the three classes under investigation. Serum from patients with epilepsy were characterized by increased levels of 3-OH-butyrate, 2-OH-valerate, 2-OH-butyrate, acetoacetate, acetone, acetate, choline, alanine, glutamate, scyllo-inositol (C < R < NR), and decreased concentration of glucose, lactate, and citrate compared to C (C > R > NR).
Significance: In conclusion, metabolomics may represent an important tool for discovery of differences between subjects affected by epilepsy responding or resistant to therapies and for the study of its pathophysiology, optimizing the therapeutic resources and the quality of life of patients.
Introduction
Drug resistance is a critical issue in patients suffering from epilepsy. Indeed, a sufficient control of seizures is only obtained in half the population of patients with epilepsy, while in the remaining half, a subset of about 30% are classified as resistant to antiepileptic drugs (AEDs) (1). Although still debated, the definition of “drug resistance in epilepsy” can be broadly stated as “…a partial or no response to drugs that determines the presence of disabling seizures, which lead the affected individual to a significant neuropsychiatric and social impairment, lowering the quality of life, causing increased morbidity and higher risk of sudden death” (2). Moreover, it is worth noting that such clinical failures in controlling seizures correspond to a severe economic impact given that 6,000,000 patients are estimated in Europe alone as having active epilepsy, with an annual cost of € 20 billion euro (3), plus the associated familiar and social excruciating burden. Perhaps, one of the less discussed problems is represented by the urgency of determining the correct combination of drugs to treat epilepsy or indeed whether there is a combination of drugs that do indeed work for a given patient. This problem is well illustrated by the fact that the pursuit of the most efficient AEDs can take years to even attempt the ideal combination (4). Moreover, since most of these patients can be eligible for non-pharmacological or resective treatment or vagal nerve stimulation (VNS® Cyberonics USA), there is an urgent need to find biomarkers that timely gage an individual’s drug resistance. To investigate this issue, in the present study, we have applied a metabolomics approach to identify the metabolic profile of AEDs pharmacoresistance. Metabolomics is an effective postgenomics research tool that, through the metabolic study of biological fluids, has been applied to many disciplines including the study of human diseases, food control, and plant physiology (5–7). In addition, metabolomics has recently been used for studying several neurological diseases (8–10). The study of biofluids has been associated with the use of several analytical techniques of separation and detection, including gas chromatography or liquid chromatography coupled to mass spectrometry and nuclear magnetic resonance (NMR) spectroscopy (11–13). Depending on the instrument used to generate the metabolomics profile, a different panel of metabolites is obtained. In particular, NMR is characterized by lower sensitivity, but higher reproducibility and relatively easy quantification compared to MS analysis. Following this approach, the metabolic phenotype of an individual can be characterized according to how the individual’s metabolism is influenced by many disparate factors such as genes, environment, nutrition, microbiota, and drugs. The application of metabolomics is an important step toward the understanding of the role that metabolic components have in disease and has been considered a real “quantum leap” advance in diagnosis, in staging, and, eventually, in categorizing different clusters of the same disease (14). On the basis of the results obtained in the present investigation, we suggest that the metabolomics approach is a viable new tool for neuroscience and in this case could help the clinician in the diagnosis of pharmacoresistance in epilepsy.
Materials and Methods
Subjects Selection
Subjects affected by epilepsy, either pharmacologically controlled or pharmacoresistant, were enrolled from patients monitored in the Epilepsy Diagnostic and Treatment Centre of the University of Cagliari (Italy), along with matched healthy controls (Table 1). The study was approved by the ethical committee of the University Hospital of Cagliari, and written informed consent was obtained from each patient before inclusion. Subjects enrolled were not on ketogenic diet (KD).
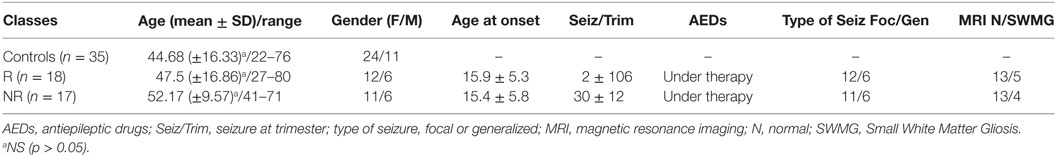
Table 1. Summary of the patients enrolled in the study: healthy controls, responders (R), and non-responders (NR) under therapy with AEDs.
As shown in Table 2, 17 individuals affected by drug-resistant, complex focal or generalized epilepsy were enrolled in the study. Among them, 15 subjects received AEDs in various combinations, while 2 in addition to AEDs had been implanted with a VNS device. The group of responders (R) was represented by 18 subjects, comparable with the AEDs-resistant group for type of seizures and mean age (Table 2) as well as for similar AEDs. Patients on monotherapy were not included in the study to better match the two epileptic groups. In subjects affected by focal seizures, the most probable type of seizure was determined both on the basis of reports from the patients themselves or from family members who witnessed events, as well as by ictal and interictal digital video-EEG and by 24-h EEG (Holter-EEG) recordings. On the basis of these criteria, the group of AEDs-resistant subjects included 6 patients with generalized epilepsy and 11 affected by focal seizures, while among the AEDs-responder patients, 6 suffered from generalized and 12 from focal seizures. No pathological signals were observed by magnetic resonance imaging (MRI) analysis. Small white matter altered microvascular spots were considered by neuroradiologist as age compatible (Table 2). The selection criteria included relative stability of clinical features related to interictal EEG activity, while the AEDs range in the serum was monthly assessed in optimal dosage in responder (R) and non-responder (NR) patients. The subjects affected by generalized and focal epilepsy were considered eligible if they had been monitored for more than 4 years. Further selection criteria for inclusion in the study were as follows: (i) stable clinical symptomatology and EEG features from the last three months; (ii) normal neurological examination and psychiatric evaluations according to DSM-V; (iii) recent brain MRI negative for potentially epileptogenic alterations (stroke, tumors, MAV, infectious diseases); and (iv) AEDs treatment in both pharmacoresistant and R groups given at stable dose from at least 3 months (Table 2). All selected patients did not receive KD. Seizure frequency occurrence was determined by the number of seizures reported in a personal diary (either by patient and/or caregivers). These data were standardized by considering the number of seizures during the 3-month period before the study; this period was arbitrarily selected (15). The selected subjects exhibited their first seizure between 8 and 26 years of age, and the seizure frequency of the AEDs-resistant subjects ranged from 14 to 52 episodes in the trimester preceding the day of the metabolomics study, while the AEDs controlled group presented from 0 to a maximum of 4 seizures in the trimester preceding the study (Table 2).
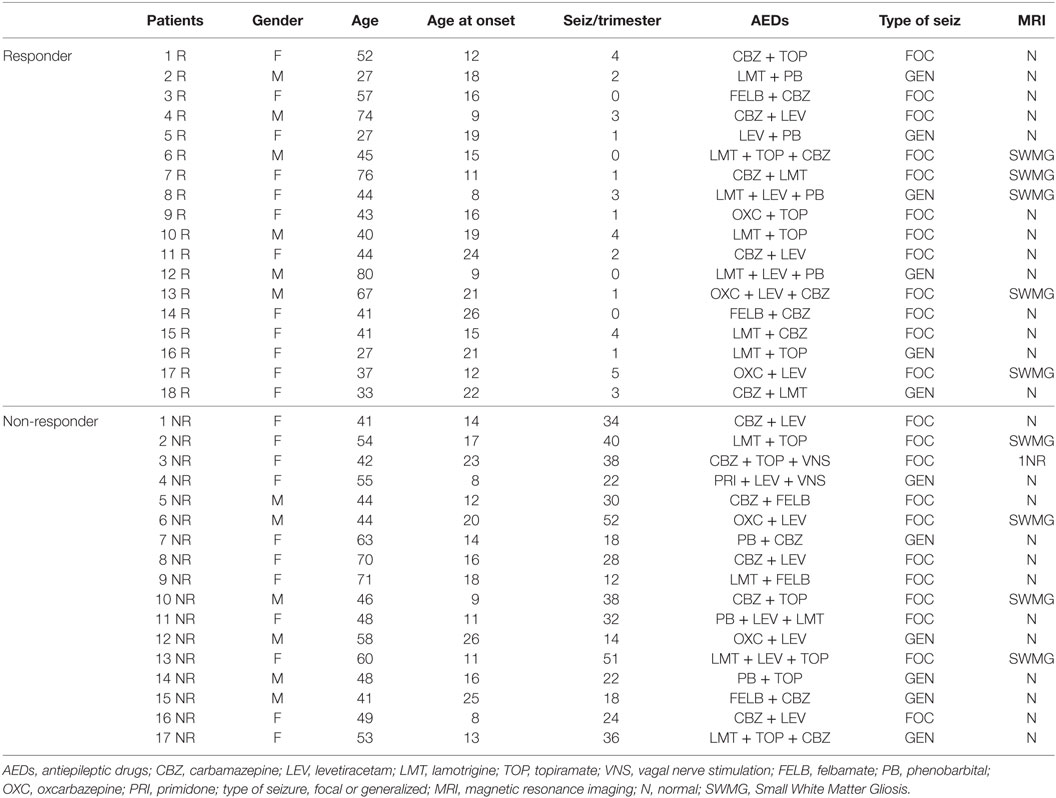
Table 2. Summary of the epileptic patients enrolled in the study: responders (R) and non-responders (NR) under therapy with AEDs.
The controls were matched by age and gender and were healthy subjects without neurological symptoms and chronic diseases.
Blood samples of patients and controls were collected after overnight fasting to minimize the immediate effects of the food.
Patients receiving valproic acid and lacosamide were excluded because the NMR resonances of these compounds affect the recognition of certain metabolites in the NMR spectra of serum.
Samples Preparation and Acquisition
The blood samples were centrifuged for 10 min at 1,700 g, afterward the serum was obtained, carefully collected into aliquots of 1 ml, and stored at −80°C until analysis. All procedures related to samples preparation and acquisition of the data were performed according to internal standard protocols, previously published (16). Serum samples were thawed and centrifuged at 2,500 g for 10 min at 4°C. An aliquot of 800 µl of serum was used, and a solution of chloroform/methanol 1:1 (2,400 µl) plus 350 µl of distilled water was added. Samples were vortexed for 1 min and centrifuged for 30 min at 1,700 g at RT. After the centrifugation, hydrophilic and hydrophobic phases were collected. The first was concentrated overnight using a speed vacuum instrument (Eppendorf concentrator plus, Eppendorf AG, Hamburg, Germany) and then resuspended in 630 µl of D2O and 70 µl trimethylsilylpropanoic acid (TSP) 5.07 mM (f.c. = 0.507 mM). TSP was added to provide an internal reference for the chemical shifts of the spectrum obtained with the NMR analysis. Six hundred and fifty microliters of the solution were transferred into 5 mm NMR tubes. NMR experiments were acquired with a Varian UNITY INOVA 500 spectrometer (Agilent technologies, Inc., Santa Clara, CA, USA) operating at 499 MHz equipped with a 5 mm triple resonance probe with z-axis pulsed field gradients and autosampler. One-dimensional 1H-NMR spectra were collected at 300 K with a NOESY pulse sequence to suppress the residual signal of water by using 0.100 ms of mixing time. Spectra were recorded with a spectral width of 6,000, 2 Hz, acquisition time of 1.5 s, relaxation delay of 2 ms, 90° pulse of 9.2 µs, and number of scan of 256. Each free induction decay was zero-filled to 64K points and multiplied by a 0.5-Hz exponential line-broadening function. Spectra were manually phased, baseline corrected, and chemical shifts referred to the internal standard TSP (at δ = 0.0 ppm) using MestReNova software (version 8.1, Mestrelab Research S.L. Spain).
Statistical Analysis
All spectra from NMR analysis were processed as previously reported (16). Each spectrum was divided into consecutive “bins” 0.04 ppm wide. The spectral area under investigation was the region between 0.6 and 8.6 ppm. To remove variations in the presaturation of the residual water resonance and spectral regions of noise, the regions between 4.64 and 5.2 ppm and between 5.28 and 6.6 ppm were excluded. The integrated area within each bin was normalized to percent values to minimize the effects of the different concentrations of serum samples. No interference from the drug metabolites, apart from valproic acid and lacosamide (which were excluded from analysis), was observed.
The final data set consisted of a 159 by 70 matrix (variables-bin × samples-subjects) values. Multivariate statistical analysis was performed on the generated matrix using SIMCA-P + software (version 13.0, Umetrics, Umeå, Sweden). NMR’s variables were scaled using Pareto scaling. Initial data analyses were conducted using principal components analysis (PCA). Then partial least square discriminant analysis and orthogonal partial least square discriminant analysis (OPLS-DA) were applied. The quality of the model was assessed with two parameters: R2 and Q2 cumulative. R2 estimates goodness of fit and Q2 estimates goodness of prediction. Each mathematical model was validated by permutation test. This test was used to validate the model and to assess the degree of overfitting, by means of -n random permutations (n = 500). The resulting plot displays the correlation coefficient between the original y-variable and the permuted y-variable vs the cumulative R2 and Q2, and the regression line. The scores values from each OPLS-DA model were subjected to CV-ANOVA to test the significance of the model, and the validation was considered successful with p < 0.05. Through the analysis of the S-plot, visualizing both the covariance and the correlation structure between the X-variables and the predictive score, and through the analysis of the set of VIPs (important variables on the projection), it was possible to identify the variables characterizing each class. These most significantly variables were quantified using Chenomx NMR Suite 7.1 and literature (17). A representative NMR spectrum showing the discriminate attribution is represented in Figure S1 in Supplementary Material. The concentrations were used to perform a non-parametric test, in particular, U-Mann–Whitney test, followed by a Holm–Bonferroni correction (GraphPad Prism software version 7.01, GraphPad Software, Inc., CA, USA).
Results
As an initial step, the possible presence of outliers in our population was tested through the analysis of all the NMR spectra of blood serum by PCA. All samples passed this initial filtering step. Then, OPLS-DA was performed between the two groups and validated: controls and patients with epilepsy (Figures 1A,B). A significant different distribution of metabolites for the two groups was observed (p < 0.001). Model parameters for the explained variation (R2X and R2Y) and the predictive capability (Q2) were significantly high (R2X = 0.571; R2Y = 0.790; Q2 = 0.690), indicating robust classification of the two groups.
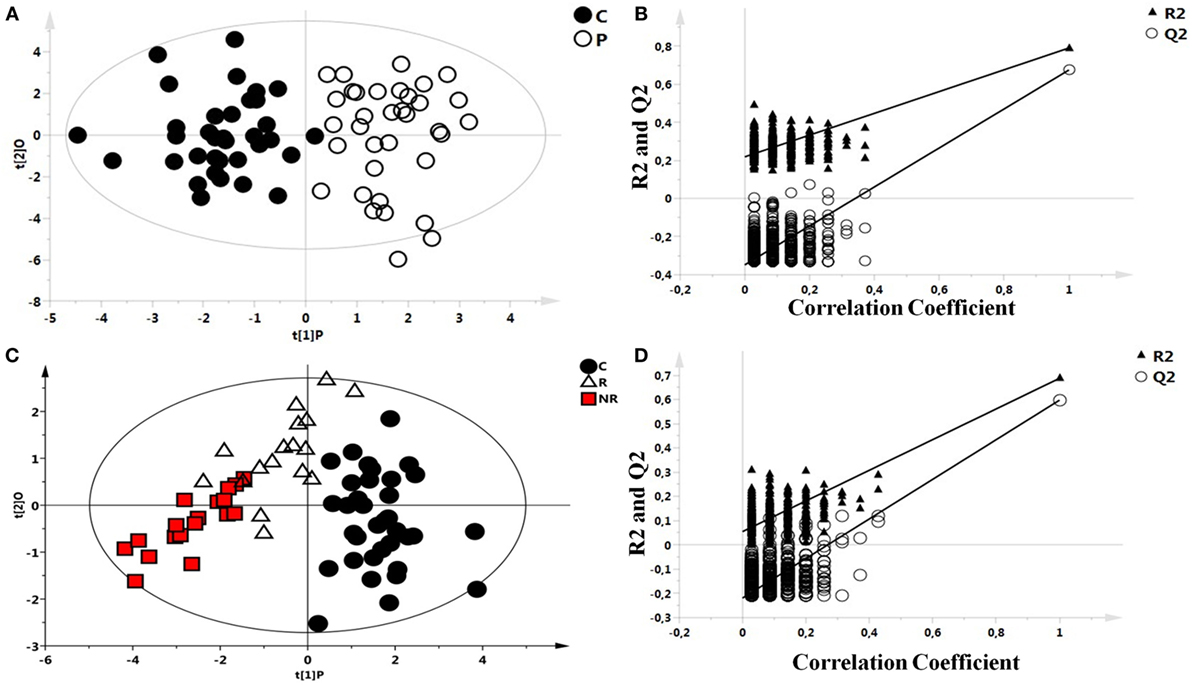
Figure 1. Scores plots obtained from nuclear magnetic resonance spectra of serum samples from controls and patients with epilepsy. (A) Scores plot from the multivariate orthogonal partial least square discriminant analysis model between controls (C): C (●) and patients with epilepsy: P (O): each point represents a single serum spectrum, with the position determined by the contribution of the 159 variables. (B) Validation of the corresponding model by permutation test (n = 500). (C) Scores plot from the multivariate orthogonal partial least square discriminant analysis of a three classes model: healthy subjects (●), responder (R) patients (Δ), and non-responder (NR) patients ( ). (D) Statistical validation of the corresponding model by permutation test.
After observing a different metabolic profile between controls and patients with epilepsy, a possible difference between R and NR patients was investigated, too. OPLS-DA analysis of a three classes model, controls, R, and NR patients (Figure 1C), indicated a significant p value (p < 0.001) validated with the permutation test (Figure 1D).
Statistical parameters of this model were R2X = 0.664, R2Y = 0.615, and Q2 = 0.488. Validation of the model was performed by permutation test.
Each class was individually compared with the others by OPLS-DA and results validated by a permutation test (Figures 2A–F). All the analysis showed significant statistical values positive both in terms of variance of predictive capability and p value. Statistical parameters are reported in Table 3.
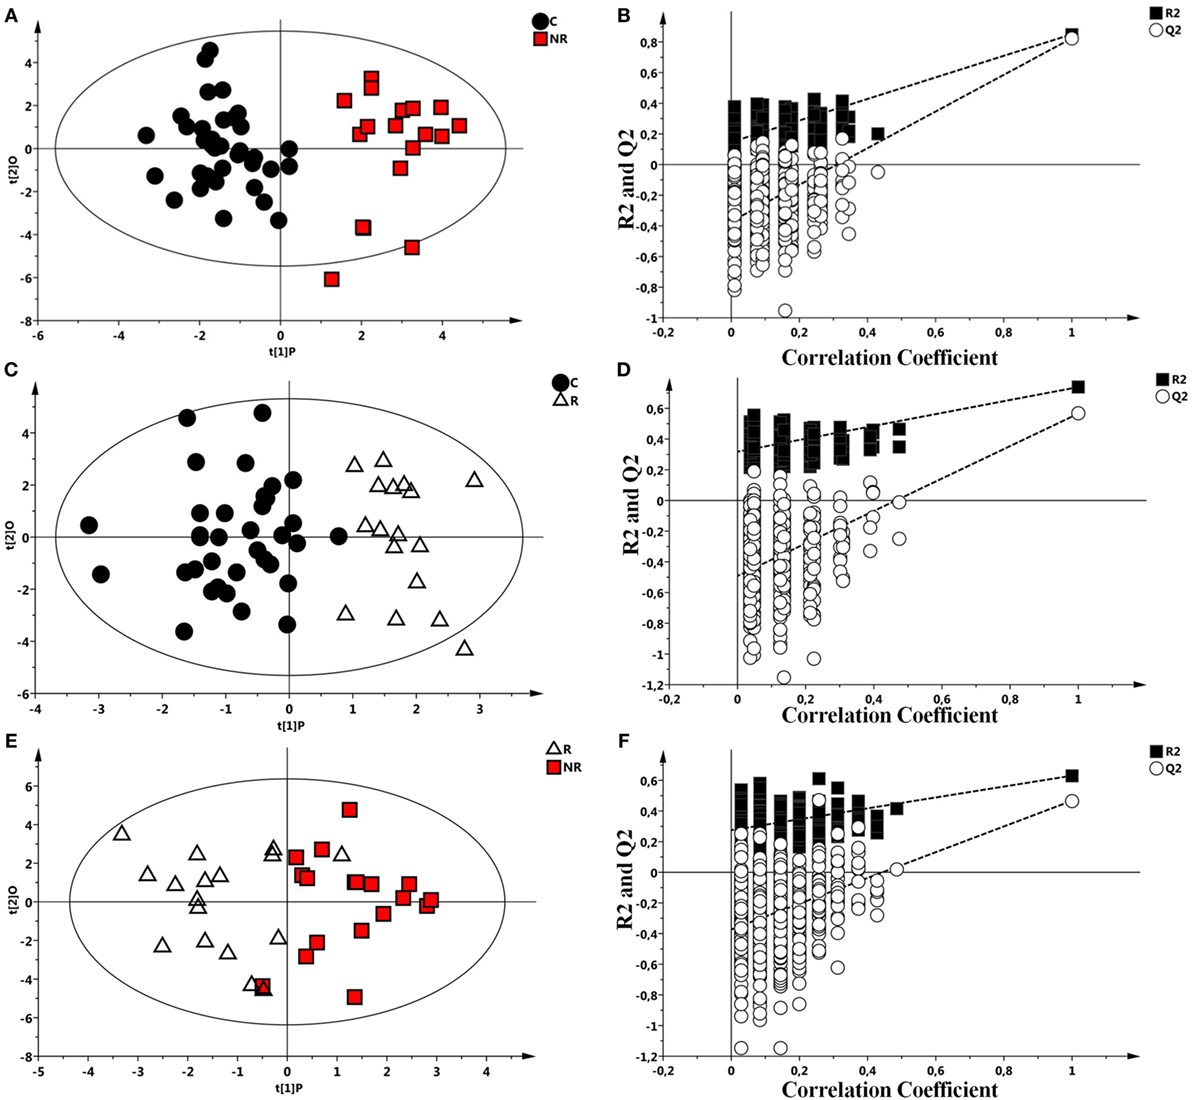
Figure 2. Scores plots obtained from nuclear magnetic resonance spectra of serum samples from controls and responder (R) and non-responder (NR) patients. (A) Scores plot from the multivariate orthogonal partial least square discriminant analysis (OPLS-DA) model between controls (●) and NR patients (). (B) Statistical validation of the corresponding model by permutation test (n = 500). (C) OPLS-DA between controls (●) and R patient (Δ) and (D) statistical validation of the corresponding model by permutation test (n = 500). (E) OPLS-DA model between R (Δ) and NR patients (). (F) Statistical validation of the corresponding model by permutation test (n = 500).
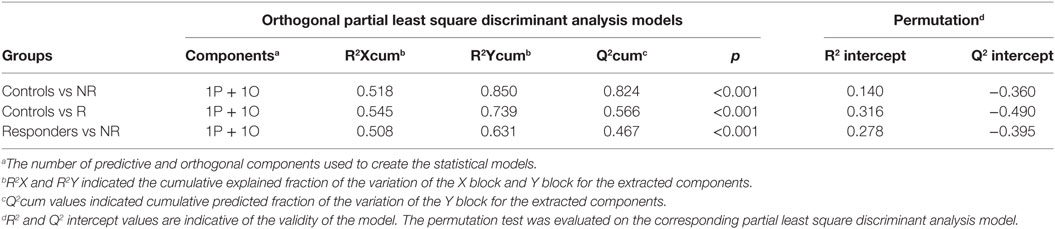
Table 3. Summary of the statistical parameters of the models C vs non-responder (NR), C vs responder (R), and R vs NR.
For each OPLS-DA model, it was possible to identify the discriminant metabolites for the three classes under investigation. The metabolites corresponding to the discriminants variables were identified and quantified by using Chenomx software. Metabolic discriminants were similar among the different groups. Serum from epileptics patients were characterized by increased levels of 3-OH-butyrate, 2-OH-valerate, 2-OH-butyrate, acetoacetate, acetone, acetate, choline, alanine, glutamate, and scyllo-inositol (C < R < NR) and decreased concentration of glucose, lactate, and citrate compared to controls (C > R > NR) as showed in Table S1 in Supplementary Material.
The matrix containing the concentrations of discriminant metabolites for each patient belonging to the three groups was analyzed to carry out an analysis of the variance with multivariate and univariate tests. The multivariate analysis showed that the discriminating metabolites of each mathematical models previously analyzed were similar. Moreover, this analysis showed differences in terms of concentration depending on the classes, suggesting a possible role of the therapeutic effect in R patients. 2-OH-butyrate and 2-OH-valerate were not quantified because signals overlapped in the same spectral region (triplet at 0.92 ppm). Univariate analysis using metabolite concentrations as variable was conducted on all groups. U-Mann–Whitney test was used to explore and compare the mean differences between the groups (Table 4), and then Holm–Bonferroni correction was applied. The results are showed in Table 4.
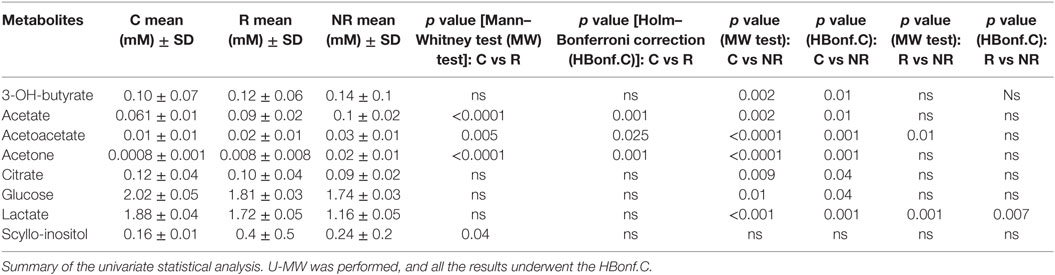
Table 4. Metabolites significant altered among the classes control (C), responder (R), and non-responder (NR).
A different metabolic profile was identified for the three different groups; in particular the group of the patients with epilepsy was characterized by an increase of acetate, acetoacetate, acetone, and scyllo-inositol (R in particular) with respect to the control group, while it showed a decrease of lactate, glucose, and citrate.
Discussion
The present study in patients with drug-resistant epilepsy shows that the concentrations of glucose, citrate, and lactate are decreased and ketone bodies (3-OH-butyrate, acetate, acetoacetate, and acetone) increased compared to R patients with epilepsy and controls. At first glance, our result appears in line with the observations that, in cases of refractory epilepsy, the energetic failure is reflected by uncompensated brain glucose levels (18). On the other hand, the increased concentrations of KBs in NR patients seem unexpected and at variance with the traditional studies that demonstrated the efficacy of the KD in controlling pharmacoresistant seizures (19). However, the key role of the KD, which represents the largest source of KBs, in the treatment of severe forms of infantile epilepsy (20) as well as in adult seizures (21, 22) is still challenging (23–25). According to our data, subjects affected by frequent and intractable seizures show an increase of KBs compared to patients pharmacologically controlled, despite being treated with similar dose of AEDs (Table 2). The reduction of citrate, glucose, and lactate concentrations in NR patients compared with R and C patients suggest a switch from glucose metabolism, the suitable energetic substrate of the brain, to ketogenic metabolites. Indeed, previous studies reported similar variations including a reduction in 13C-labeled citrate in an experimental seizure model in the hippocampus (26, 27). It is also worth noting that in these studies the concentrations of citrate and glucose showed a parallel decrease similar to the lactate profile. These observations suggest that in conditions of frequent/uncontrolled convulsions the biochemical response of the cellular machinery might be forced toward alternative energy resources such as those derived from KBs utilization. The antiseizure effects induced by KD suggest several mechanisms encompassing bioenergetics and mitochondrial changes (28), activity of cellular oxidation via poly-unsaturated fatty acids (29), and regulation of neuroprotective factors (30–32). Moreover, as glutamate and γ-aminobutyric acid (GABA), respectively, are the major excitatory and inhibitory neurotransmitters in the brain several studies focused their main issues on how KBs affect levels of these neurotransmitters and their receptor activity (33). Following magnetic resonance spectroscopy investigations, it has been demonstrated that increased levels of GABA neurotransmission are detected in cerebrospinal fluid of patients with KD (34, 35) underlining a possible action of ketone bodies upon the modulation of GABA-A receptors by increasing the synaptic inhibition (35, 36). The increase of synaptic inhibition might not be per se sufficient in contrasting AEDs-resistant epileptogenesis since the brain networks under sustained seizure activity show a poor affinity of GABA receptors (37, 38). Moreover, several alternative mechanisms for the KD effects have been proposed recently. The antiepileptic action of medium-chain triglyceride, a good source of KBs, has been widely documented (39, 40). Recently, Chang et al. demonstrate that medium-chain triglyceride, rich in decanoic acid, provides an antiseizure effect acting through direct AMPA receptor inhibition (41).
Finally, the high production of KBs in patients with frequent seizure could be important to balance the increase of glutamate through the modification of the behavior of vesicular glutamate transporters (42). Together the effects of KBs emerge as a complex pleiotropic mechanism, which contains an apparent paradox: while the KBs are the most relevant part of a KD; nonetheless, their antiepileptic effects still needs to be proved (31). It seems possible to suggest that the increase of KBs in patients with epilepsy can be interpreted as an attempt to activate spontaneous biochemical processes aimed to optimize ultimate energetic resources.
The results of the present study represent an interesting finding that can help the clinician in evaluating subjects affected by severe epilepsy as potential pharmacoresistant patients, thus prompting new investigations addressed to find alternative therapeutic solutions. However, several lines of criticism emerge in commenting the present data. Among them (i) we cannot rule out that the population of R and NR might show a metabolomic pattern related to the level of seizure control and drug sensitivity; (ii) despite supporting data also from the literature, we cannot point at the metabolomic profile as the sole predictor mechanism of anticonvulsant effects, given the manifold players of epileptogenesis and pharmacoresistance (43, 44); (iii) there are no sufficient data that a possible seizure control might reverberate in a given metabolomic pattern; (iv) the metabolomic profile described in the present study has been derived from a single sample of each individual, while possible variations (e.g., related with seizure frequency or time of seizure) can be better assessed by multiple samples.
In conclusion, the results suggest that metabolomic can help to better understand some aspects of pharmacoresistant epilepsy and contribute to target some peculiar biochemical mechanisms involved in the epileptogenesis. A larger cohort of selected patients affected by drug-resistant epilepsy and a multicentric carefully planned study are needed to validate the present findings.
Ethics Statement
This study was carried out in accordance with the recommendations of Ethical Committee of the University Hospital of Cagliari with written informed consent from all subjects. All subjects gave written informed consent in accordance with the Declaration of Helsinki. The protocol was approved by the Ethical Committee of the University Hospital of Cagliari.
Author Contributions
LA and FM: equally contributing authors. LA, JLG and FM: conceived the study, directed the project and designed the experiments, and contributed to the final version. FM and SP: performed experiments and data analysis, performed metabolomics experiments and data analysis, wrote the first draft of the manuscript, critically reviewed the data and the manuscript, and read and approved the final version of the manuscript. AM, MP, LO, GO, and PS: obtained the samples and clinical details and performed data analysis. LB and FC: performed metabolomics experiments and data analysis. All authors critically reviewed the data and the manuscript. All authors read and approved the final version of the manuscript.
Conflict of Interest Statement
The authors declare that the research was conducted in the absence of any commercial or financial relationships that could be construed as a potential conflict of interest.
Funding
This work was supported by Regione Autonoma Sardegna, LR7/2007, grant code CRP 18488 (to LA).
Supplementary Material
The Supplementary Material for this article can be found online at http://journal.frontiersin.org/article/10.3389/fneur.2017.00459/full#supplementary-material.
Figure S1. Assignments in an nuclear magnetic resonance spectrum of the discriminant metabolites resulting from the groups [control (C), responder (R), and non-responder (NR)] comparison. (1) 3-OH-butyrate; (2) lactate; (3) alanine; (4) acetate; (5) acetone; (6) acetoacetate;(7) glutamate; (8) citrate; (9) choline; (10) glucose; (11) scyllo-Inositol.
References
1. Forsgren L, Beghi E, Õun A, Sillanpää M. The epidemiology of epilepsy in Europe – a systematic review. Eur J Neurol (2005) 12:245–53. doi:10.1111/j.1468-1331.2004.00992.x
2. Pati S, Alexopoulos AV. Pharmacoresistant epilepsy: from pathogenesis to current and emerging therapies. Cleve Clin J Med (2010) 77:457–67. doi:10.3949/ccjm.77a.09061
3. Cross JH. Epilepsy in the WHO European region: fostering epilepsy care in Europe. Epilepsia (2011) 52:187–8. doi:10.1111/j.1528-1167.2010.02903.x
4. Perucca E, Grimaldi R, Frigo GM, Sardi A, Mönig H, Ohnhaus EE. Comparative effects of rifabutin and rifampicin on hepatic microsomal enzyme activity in normal subjects. Eur J Clin Pharmacol (1988) 34:595–9. doi:10.1007/BF00615223
5. Kaddurah-Daouk R, Kristal BS, Weinshilboum RM. Metabolomics: a global biochemical approach to drug response and disease. Annu Rev Pharmacol Toxicol (2008) 48:653–83. doi:10.1146/annurev.pharmtox.48.113006.094715
6. Wishart DS. Metabolomics: applications to food science and nutrition research. Trends Trends Food Sci Technol (2008) 19:482–93. doi:10.1016/j.tifs.2008.03.003
7. Griffin JL, Atherton H, Shockcor J, Atzori L. Metabolomics as a tool for cardiac research. Nat Rev Cardiol (2011) 8:630–43. doi:10.1038/nrcardio.2011.138
8. Kaddurah-Daouk R, Krishnan KRR. Metabolomics: a global biochemical approach to the study of central nervous system diseases. Neuropsychopharmacology (2009) 34:173–86. doi:10.1038/npp.2008.174
9. Bogdanov M, Matson WR, Wang L, Matson T, Saunders-Pullman R, Bressman SS, et al. Metabolomic profiling to develop blood biomarkers for Parkinson’s disease. Brain (2008) 131:389–96. doi:10.1093/brain/awm304
10. Hassan-Smith G, Wallace GR, Douglas MR, Sinclair AJ. The role of metabolomics in neurological disease. J Neuroimmunol (2012) 248:48–52. doi:10.1016/j.jneuroim.2012.01.009
11. Blasco H, Corcia P, Moreau C, Veau S, Fournier C, Vourc’h P, et al. 1H-NMR-based metabolomic profiling of CSF in early amyotrophic lateral sclerosis. PLoS One (2010) 5:e13223. doi:10.1371/journal.pone.0013223
12. Wang D, Wang X, Kong J, Wu J, Lai M. GC-MS-based metabolomics discovers a shared serum metabolic characteristic among three types of epileptic seizures. Epilepsy Res (2016) 126:83–9. doi:10.1016/j.eplepsyres.2016.07.003
13. Fauvelle F, Boccard J, Cavarec F, Depaulis A, Deransart C. Assessing susceptibility to epilepsy in three rat strains using brain metabolic profiling based on HRMAS NMR spectroscopy and chemometrics. J Proteome Res (2015) 14:2177–89. doi:10.1021/pr501309b
14. Nicholson JK, Holmes E, Kinross JM, Darzi AW, Takats Z, Lindon JC. Metabolic phenotyping in clinical and surgical environments. Nature (2012) 491:384–92. doi:10.1038/nature11708
15. Kwan P, Arzimanoglou A, Berg AT, Brodie MJ, Hauser WA, Mathern G, et al. Definition of drug resistant epilepsy: consensus proposal by the ad hoc task force of the ILAE commission on therapeutic strategies. Epilepsia (2010) 51:1069–77. doi:10.1111/j.1528-1167.2009.02397.x
16. Cocco E, Murgia F, Lorefice L, Barberini L, Poddighe S, Frau J, et al. 1H-NMR analysis provides a metabolomic profile of patients with multiple sclerosis. Neurol Neuroimmunol Neuroinflamm (2016) 3:e185. doi:10.1212/NXI.0000000000000185
17. Weljie AM, Newton J, Mercier P, Carlson E, Slupsky CM. Targeted profiling: quantitative analysis of 1H NMR metabolomics data. Anal Chem (2006) 78:4430–42. doi:10.1021/ac060209g
18. Reid CA, Mullen S, Kim TH, Petrou S. Epilepsy, energy deficiency and new therapeutic approaches including diet. Pharmacol Ther (2014) 144:192–201. doi:10.1016/j.pharmthera.2014.06.001
19. Huttenlocher P, Wilbourn A, Signore J. Medium-chain triglycerides as a therapy for intractable childhood epilepsy. Neurology (1971) 21:1097–103. doi:10.1212/WNL.21.11.1097
20. Hartman AL, Gasior M, Vining EPG, Rogawski MA. The neuropharmacology of the ketogenic diet. Pediatr Neurol (2007) 37:281–92. doi:10.1016/j.pediatrneurol.2007.02.008
21. Klein P, Janousek J, Barber A, Weissberger R. Ketogenic diet treatment in adults with refractory epilepsy. Epilepsy Behav (2010) 19:575–9. doi:10.1016/j.yebeh.2010.09.016
22. Mady MA, Kossoff EH, McGregor AL, Wheless JW, Pyzik PL, Freeman JM. The ketogenic diet: adolescents can do it, too. Epilepsia (2003) 44:847–51. doi:10.1046/j.1528-1157.2003.57002.x
23. Rho JM, Sankar R. The ketogenic diet in a pill: is this possible? Epilepsia (2008) 49:127–33. doi:10.1111/j.1528-1167.2008.01857.x
24. Rho JM, Stafstrom CE. The ketogenic diet: what has science taught us? Epilepsy Res (2012) 100:210–7. doi:10.1016/j.eplepsyres.2011.05.021
25. Rho JM. How does the ketogenic diet induce anti-seizure effects? Neurosci Lett (2015) 637:4–10. doi:10.1016/j.neulet.2015.07.034
26. Hadera MG, Smeland OB, McDonald TS, Tan KN, Sonnewald U, Borges K. Triheptanoin partially restores levels of tricarboxylic acid cycle intermediates in the mouse pilocarpine model of epilepsy. J Neurochem (2014) 129:107–19. doi:10.1111/jnc.12610
27. Smeland OB, Hadera MG, McDonald TS, Sonnewald U, Borges K. Brain mitochondrial metabolic dysfunction and glutamate level reduction in the pilocarpine model of temporal lobe epilepsy in mice. J Cereb Blood Flow Metab (2013) 33:1090–7. doi:10.1038/jcbfm.2013.54
28. Rowley S, Patel M. Mitochondrial involvement and oxidative stress in temporal lobe epilepsy. Free Radic Biol Med (2013) 62:121–31. doi:10.1016/j.freeradbiomed.2013.02.002
29. Fraser DD, Whiting S, Andrew RD, Macdonald EA, Musa-Veloso K, Cunnane SC. Elevated polyunsaturated fatty acids in blood serum obtained from children on the ketogenic diet. Neurology (2003) 60:1026–9. doi:10.1212/01.WNL.0000049974.74242.C6
30. Rahman M, Muhammad S, Khan MA, Chen H, Ridder DA, Müller-Fielitz H, et al. The β-hydroxybutyrate receptor HCA2 activates a neuroprotective subset of macrophages. Nat Commun (2014) 5:3944. doi:10.1038/ncomms4944
31. Boison D. New insights into the mechanisms of the ketogenic diet. Curr Opin Neurol (2017) 30(2):187–92. doi:10.1097/WCO.0000000000000432
32. Schoeler NE, Bell G, Yuen A, Kapelner AD, Heales SJR, Cross JH, et al. An examination of biochemical parameters and their association with response to ketogenic dietary therapies. Epilepsia (2017) 58:893–900. doi:10.1111/epi.13729
33. McNally MA, Hartman AL. Ketone bodies in epilepsy. J Neurochem (2012) 121:28–35. doi:10.1111/j.1471-4159.2012.07670.x
34. Wang ZJ, Bergqvist C, Hunter JV, Jin D, Wang D-J, Wehrli S, et al. In vivo measurement of brain metabolites using two-dimensional double-quantum MR spectroscopy – exploration of GABA levels in a ketogenic diet. Magn Reson Med (2003) 49:615–9. doi:10.1002/mrm.10429
35. Dahlin M, Elfving AU, Ungerstedt U, Åmark P. The ketogenic diet influences the levels of excitatory and inhibitory amino acids in the CSF in children with refractory epilepsy. Epilepsy Res (2005) 64:115–25. doi:10.1016/j.eplepsyres.2005.03.008
36. Yudkoff M, Daikhin Y, Nissim I, Horyn O, Lazarow A, Luhovyy B, et al. Response of brain amino acid metabolism to ketosis. Neurochem Int (2005) 47:119–28. doi:10.1016/j.neuint.2005.04.014
37. Gibbs JW, Shumate MD, Coulter DA. Differential epilepsy-associated alterations in postsynaptic GABA(A) receptor function in dentate granule and CA1 neurons. J Neurophysiol (1997) 77:1924–38.
38. Cohen AS, Lin DD, Quirk GL, Coulter DA. Dentate granule cell GABAA receptors in epileptic hippocampus: enhanced synaptic efficacy and altered pharmacology. Eur J Neurosci (2003) 17:1607–16. doi:10.1046/j.1460-9568.2003.02597.x
39. Chang P, Terbach N, Plant N, Chen PE, Walker MC, Williams RSB. Seizure control by ketogenic diet-associated medium chain fatty acids. Neuropharmacology (2013) 69:105–14. doi:10.1016/j.neuropharm.2012.11.004
40. Wlaź P, Socała K, Nieoczym D, Zarnowski T, Zarnowska I, Czuczwar SJ, et al. Acute anticonvulsant effects of capric acid in seizure tests in mice. Prog Neuropsychopharmacol Biol Psychiatry (2015) 57:110–6. doi:10.1016/j.pnpbp.2014.10.013
41. Chang P, Augustin K, Boddum K, Williams S, Sun M, Terschak JA, et al. Seizure control by decanoic acid through direct AMPA receptor inhibition. Brain (2016) 139:431–43. doi:10.1093/brain/awv325
42. Juge N, Gray JA, Omote H, Miyaji T, Inoue T, Hara C, et al. Metabolic control of vesicular glutamate transport and release. Neuron (2010) 68:99–112. doi:10.1016/j.neuron.2010.09.002
43. Tang F, Hartz A, Bauer B. Drug-resistant epilepsy: multiple hypotheses, few answers. Front Neurol (2017) 8:301. doi:10.3389/fneur.2017.00301
Keywords: metabolomics, epilepsy, drug-resistant epilepsy, biomarkers, ketone bodies
Citation: Murgia F, Muroni A, Puligheddu M, Polizzi L, Barberini L, Orofino G, Solla P, Poddighe S, Del Carratore F, Griffin JL, Atzori L and Marrosu F (2017) Metabolomics As a Tool for the Characterization of Drug-Resistant Epilepsy. Front. Neurol. 8:459. doi: 10.3389/fneur.2017.00459
Received: 26 June 2017; Accepted: 18 August 2017;
Published: 04 September 2017
Edited by:
Fernando Cendes, Universidade Estadual de Campinas, BrazilReviewed by:
Marino M. Bianchin, Federal University of Rio Grande do Sul (UFRGS), BrazilSusan A. Masino, Trinity College, United States
Copyright: © 2017 Murgia, Muroni, Puligheddu, Polizzi, Barberini, Orofino, Solla, Poddighe, Del Carratore, Griffin, Atzori and Marrosu. This is an open-access article distributed under the terms of the Creative Commons Attribution License (CC BY). The use, distribution or reproduction in other forums is permitted, provided the original author(s) or licensor are credited and that the original publication in this journal is cited, in accordance with accepted academic practice. No use, distribution or reproduction is permitted which does not comply with these terms.
*Correspondence: Francesco Marrosu, francescomarrosu@gmail.com
†These authors have contributed equally to this work.