Background Music Dependent Reduction of Aversive Perception and Its Relation to P3 Amplitude Reduction and Increased Heart Rate
 Masahiro Matsuo1
  Fumi Masuda1,2
  Yukiyoshi Sumi1
  Masahiro Takahashi1 Atsushi Yoshimura1
  Naoto Yamada1
  Hiroshi Kadotani3*
- 1Department of Psychiatry, Shiga University of Medical Science, Otsu, Japan
- 2Department of Neuropsychiatry, Keio University School of Medicine, Tokyo, Japan
- 3Department of Sleep and Behavioral Science, Shiga University of Medical Science, Otsu, Japan
Music is commonly used to modify mood and has attracted attention as a potential therapeutic intervention. Despite the well-recognized effects of music on mood, changes in affective perception due to music remain majorly unknown. Here, we examined if the perception of aversive stimuli could be altered by mood-changing background music. Using subjective scoring data from 17 healthy volunteers, we assessed the effect of relaxing background music (RelaxBGM), busy background music (BusyBGM), or no background music (NoBGM) conditions on response to aversive white noise stimulation. Interestingly, affective response to the white noise was selectively alleviated, and white noise-related P3 component amplitude was reduced in BusyBGM. However, affective responses as well as P3 amplitude to reference pure tone stimuli were similar regardless of background music conditions. Interestingly, heart rate (HR) increased in BusyBGM, whereas no increase in HR was found in similar distress, NoBGM condition. These findings suggest that increase in HR, which happens during BusyBGM exposure, can be a reflecting feature of music that ameliorates the affective response to aversive stimuli, possibly through selective reduction in neurophysiological responses.
Introduction
From majestic operas to a casual humming, music plays an indispensable and extensive role in human life. One reason for the ubiquity of music is its ability to change mood (Sloboda and Juslin, 2001). For example, the choice of background music in a movie can dramatically change the impact of visual scenery perception, even if the music itself is not being consciously listened to Boltz (2004). The mood adjusting effects of background music are not only applicable to movies, but are widely used in environments, such as shopping malls and restaurants, to enhance the behavior of customers (Milliman, 1982, 1986). Background music is not limited to composed melodies: several online music streaming services provide artificial mixtures of daily noise claimed to serve as “concentration helping” background music (Zhang et al., 2013).
Recently, an increasing number of studies have elucidated the efficacy of music therapy (Bradt et al., 2013; Aalbers et al., 2017; van der Steen et al., 2018). Interestingly, a relaxing effect is not the only expected outcome of some music therapies. For example, in music therapy for pain, the main outcome is the alleviation of pain perception (Lee, 2016). This suggests that music can regulate cognitive perception, beyond a direct effect on mood. Another interesting aspect of music therapy is continuous attention to music is not necessary because passive listening is as effective as active listening in several cases (Mercadie et al., 2015; Millett and Gooding, 2018). Indeed, the music used in music therapy is played at normative loudness; it need not be loud or boisterous as in a concert hall. These findings suggest that unconscious listening to background music in daily life can affect mood and consequently modify affective perception.
Such change in affective perception can be assumed as a kind of affective bias. In relation to the clinical consideration, the affective perceptions are negatively biased in patients with depression, which is paralleled by reduced P3 amplitudes related to happy-face perception (Cavanagh and Geisler, 2006). In the basic cognitive science study, it is reported that auditory-induced pleasant mood enhances the cognitive inhibition that is paralleled with pronounced amplitudes in event-related potential (ERP) components between 150 and 550 ms (Yuan et al., 2011). In addition, these early components of ERP are thought to be involved in the mechanism of affective bias (Huang and Luo, 2006). For example, P3 component is related to the valence perception (Conroy and Polich, 2007). Early posterior negativity (EPN) is also considered to be the early stage of affective process, mirroring the fast and effortless detection of emotional stimuli (Olofsson et al., 2008; Ullrich et al., 2016). Consistently, in a recent article, we reported that the sounds of different aversiveness were associated with different neuroelectric activities in this time range. Briefly, aversive white noise stimuli involved more activity in the parietal region than pure tone stimuli in the time range corresponding to EPN and P3 components (Masuda et al., 2018).
Intriguingly, the effects of background music on cognitive function are not conclusive. For example, one study reported that background music has beneficial effect on reasoning or memory performance (Rauscher et al., 1993) whereas another study found detrimental effects on memory and comprehension tasks (Furnham and Strbac, 2002). These contrasting results could be attributable to the difference in the methodologies, targeted cognitive function, or applied choice of music. Choice of music type is important because it is reported that music interferes with the learning process depending on the congruency of the learning material and the kind of background music (Sousou, 1997). Similarly, music with increased arousal and positive affect can improve the performance of certain tests of spatial abilities (Thompson et al., 2001). The difference in the autonomic nervous system (ANS) might be involved in the inconsistent results because the autonomic nervous activity is related to type of music (Zatorre, 2015).
Thus, to establish the basis of affective bias caused by daily loudness music therapy, we performed a multimodal study that examined neurocognitive responses as well as the ANS changes. As an ANS measure that is closely related to mood, we examined changes in heart rate (HR) along with the subjective measurement of mood (Sammler et al., 2007).
We hypothesized that calming music can alleviate the aversive perception paralleled with reduced amplitudes of aversive-related EPN/P3 and reduction of corresponding neural activity in parietal region. In addition, we expected such music to have a soothing effect on ANS activity, such that it would be observable as decreased HR. This report is an extension of our recent work that reported the appraisal mechanism of white noise and pure tone (Masuda et al., 2018).
Materials and Methods
Subjects
Advertisements were used to recruit 17 healthy adult participants for this study (10 men; mean age ± standard deviation, 21.6 ± 2.06 years). The participants were compensated with a gift card with a value equivalent to ¥2,500. Interview by a psychiatrist confirmed that the participants had no psychiatric disorders, hearing problems, or smoking history and did not habitually take medication or consume caffeine on the day of the study. All the subjects were right-handed, which was confirmed using Edinburgh handedness score being not <50 (Oldfield, 1971). All subjects had normal hearing ability. Four subjects had experience of taking music lessons in their childhood, but no subject was taking music education at the time of the experiment. This study was in accordance with the recommendations of the ethical committee at Shiga University of Medical Science with written informed consent from all subjects. All subjects gave written informed consent in accordance with the Declaration of Helsinki. The protocol was approved by the ethical committee at Shiga University of Medical Science (Approved #26-227).
Experimental Design and Settings
Background Music and Sound Stimuli
Two types of background music were used to induce changes in mood. Relaxing background music (RelaxBGM) was a privately composed music that was spacious and ethereal, such as music typically played for yoga or meditation. Busy background music (BusyBGM) was an artificial mixture of traffic noise that was reminiscent of a busy highway. The background music was played at the same loudness in all conditions, at an average loudness of 40 dB[A]. In addition, no background music (NoBGM) condition [<30 dB(A) silence] was used.
A 500-ms burst of 50 dB[A] white noise with instantaneous (10 ms) rise/fall times was used as an aversive stimulus. The white noise included all frequency bands within the audible range. A 1,000-Hz pure tone was used as a reference. Pure tone was used as a reference because sounds with 1,000 Hz peaks are most ubiquitously observed (Kim et al., 2012) and less affected by age-related losses in hearing sensitivity (Cruickshanks et al., 1998). We presented the stimuli in a passive task context, where subjects were instructed to simply view a presented fixation point without special attention to sound or background music.
Subjective Measures of Mood and Affective Response
The subjects were asked to score their subjective emotional responses using the Self-Assessment Manikin (SAM), a two-dimensional subjective scoring system developed for assessing affective stimuli of the International Affective Picture System (Bradley and Lang, 1994). This is a nine-point rating scale comprising sets of figures to measure valence (1 = unpleasant; 9 = pleasant) and arousal responses (1 = arousing; 9 = calming). We used the Profile of Mood States (POMS), which has high levels of reliability and validity, to measure psychological distress. In the scale, participants were required to rate 65 mood-related adjectives on a 5-point scale (0 = not at all to 4 = extremely). The scores of 65 adjectives were combined to make six sub-scale scores, and Total Mood Disturbance (TMD) was then calculated based on the sub-scale scores. A larger TMD score indicates an increased state of distress.
Procedures and Settings
Subjects underwent three background music experiments, in which one of the three background music options (RelaxBGM, BusyBGM, or NoBGM) was played (Figure 1, upper panel). The background music was selected following randomized counterbalanced crossover design. During the experiment, subjects remained seated on a chair placed 70 cm in front of a cathode ray tube (CRT) display in a sound proof and electromagnetic shield room. The illumination in the room was maintained at 80 lux. The subjects were instructed to look at a white-cross fixation point that appeared against the black CRT background during the entire experiments. Auditory stimulation was provided through headphones (AKG closed-back headphones, K404, Vienna, Austria).
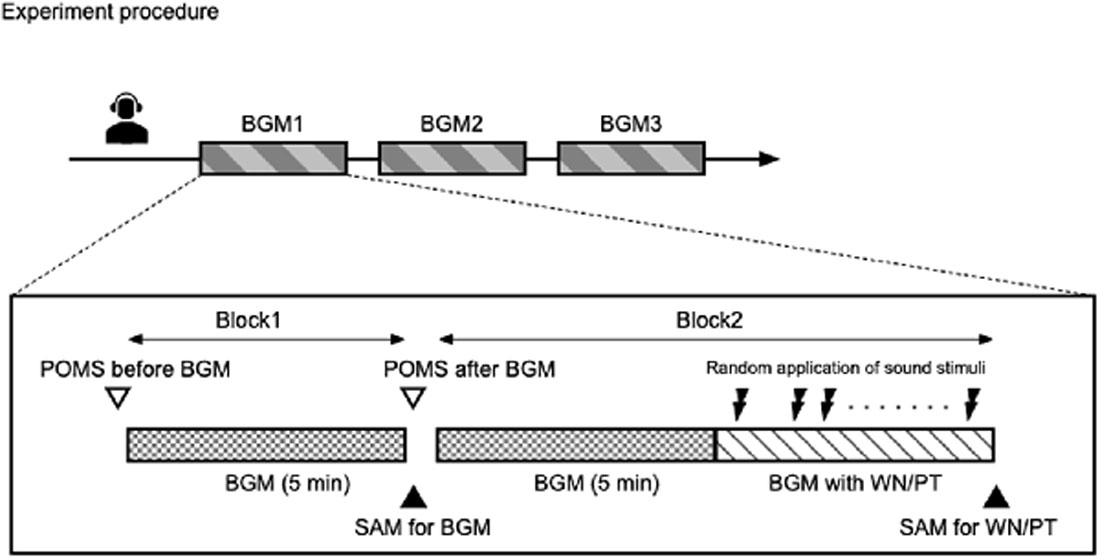
Figure 1. Schematic representation of the study. The study was conducted following randomized counterbalanced crossover design. Each participant underwent three experiments with different background music conditions. In each background music condition, two blocks of experiments were conducted. In block 1, participants were exposed to selected background music for 5 min. In block 2, participants were exposed to the background music for 5 min, followed by exposure to the same background music with intermittent sound stimuli.
One experiment was consisted with two major blocks (Figure 1, lower panel). In the first block, participants were only exposed to the background music. The effect of background music on mood was examined by TMD before and after a 5-min exposure to the background music. In addition, the participants were asked to use SAM to rate their appraisal evaluation of the background music. After completion of the ratings, the subjects immediately proceeded to the second block.
In the second block, the participants were exposed to the same background music for 5 min as in the first block, followed by the administration of pure tone and white noise sound stimuli with background music lasting approximately 5 min. The pure tone and white noise sound stimuli were programmed to randomly produce each frequency 75 times, with randomized stimulus intervals of 2,000 ± 200 ms using E-Prime v 2.0 software (Psychology Software Tools, Pittsburgh PA, USA). The participants completed SAM for both white noise and pure tone stimuli immediately after each experiment.
Electroencephalography Data Acquisition
Electroencephalography (EEG) signals were recorded using NetStation software [Electrical Geodesics Inc (EGI), Eugene, OR, USA] with 64-channel recordings made through a HydrocCel Geodesic Sensor Net v.1.0. gel cap. Data were sampled using a high-input impedance amplifier (200 MΩ, EGI Inc., Model: GES 300), at 500 Hz and referenced to Cz. Electrode impedances were kept at <60 kΩ throughout the experiments, following the guideline recommending the electrode impedance to be less than the input impedance of the amplifier by a factor of at least 100 (Picton et al., 2000). The participants were asked to remain awake, and a vigilant state was qualitatively confirmed by online observation of the EEG signal by a somnologist during the study.
Event-Related Potential (ERP) Data Processing
EEG data processing was performed using EEGLAB (version 14.1.2; Delorme and Makeig, 2004), an open source toolbox that runs on MATLAB version 2017a (Mathworks Inc. Natick, MA, USA). Briefly, EEG data were re-referenced to the average of the left and right mastoids, and bandpass filtered offline by 0.1–50 Hz using linear finite impulse response filtering method. Gross artifacts were visually rejected following independent component analysis based artifact correction embedded in EEGLAB, excluding 1–3 components produced by eye movement or muscle activity. We epoched all data segments 500 ms prior to and 1,500 ms post stimulations, and baseline corrections were done by subtracting the average of 100 ms prior to stimulation using ERPLAB (version 7.0.0; Lopez-Calderon and Luck, 2014). Epochs for ERP calculation were first selected using the simple voltage threshold function of ERPLAB using 100 μV as the threshold. Finally, an examiner, without the knowledge of the experiment conditions, visually confirmed artifact-free epochs for ERP calculation. The average number of epochs used for ERP calculation was as follows: 55.76 ± 2.57 for pure tone and 53.94 ± 2.44 for white noise in NoBGM; 54.29 ± 2.69 for pure tone and 51.88 ± 2.77 for white noise in RelaxBGM; and 48.59 ± 3.54 for pure tone and 48.76 ± 3.43 for white noise in BusyBGM. To compare component amplitudes, we calculated the mean relative-to-baseline amplitude value between the specified time range from each electrode. To compare ERP component amplitudes on region-of-interest basis, we averaged the potentials of four electrodes (Pz, Cz, C3, and C4). We focused on these four electrodes because EPN/P3 related potentials were most pronounced in these electrodes (Supplementary Figure S1). To investigate the regions involved in the differential processes between pure tone and white noise, we used time series standardized low resolution brain electromagnetic tomography analysis (sLORETA) every 2 ms to estimate the current source density distribution for each ERP component (Pascual-Marqui et al., 1994).
Heart Rate and Calculation of Autonomic Features
Kubios HRV (version 2.1, Kubios, Finland) was used for HR detection (Tarvainen et al., 2014). The type II lead of electrocardiogram was simultaneously recorded during EEG recordings, and the data were later processed by Kubios HRV. HR was calculated from 20 s data at the beginning or end of BGM exposure.
Statistical Analyses
Data are shown as mean ± standard error of mean, unless otherwise stated. For the examination of effects by background music and sound stimuli, a two-way repeated measures (3 × 2) analysis of variance (ANOVA) with three background music conditions and two sound stimuli as the within-subjects factors was conducted unless otherwise described. Greenhouse-Geisser correction was used when the sphericity was violated. Bonferroni pairwise comparison was used to adjust for multiple comparisons. SPSS statistics software Version 22 (IBM, Armonk, NY, USA) was used to perform statistical analysis. sLORETA images were statistically compared between sound conditions using the voxel-by-voxel t-test, which was corrected by Statistical non-Parametric Mapping (SnPM) randomization (number of randomizations = 5,000). The threshold of statistical significance was set at P < 0.05.
Comparisons of Components of Event-Related Potentials
To examine the changes in sound stimulation related potentials in each background music condition, we focused on 200–300 and 300–450 ms because these time ranges were pivotal in the aversive process of pure tone and white noise (Masuda et al., 2018).
Results
Subjective Ratings of Appraisal Response and Consequential Mood by Background Music
First, to investigate how participants experienced the background music, the two-way repeated measures (2 × 2) ANOVA within the subject factors background music (RelaxBGM and BusyBGM) and subjective evaluations (SAM scores in valence and arousal) was performed. This analysis showed significant effect of background music (F(1,16) = 94.298, P < 0.01, partial η2 = 0.855), and SAM (F(1,16) = 28.810, P < 0.01, partial η2 = 0.643) as well as their interaction between background music and SAM (F(1,16) = 24.800, P < 0.01, partial η2 = 0.608). BusyBGM was perceived as more aversive than RelaxBGM (valence score: BusyBGM, 2.71 ± 0.24; RelaxBGM, 6.24 ± 0.22, Figure 2A, t(16) = 13.631, P < 0.01). In addition, BusyBGM was more arousing than RelaxBGM (arousing score: BusyBGM, 5.18 ± 0.33; RelaxBGM, 6.88 ± 0.32, t(16) = 6.5884, P < 0.01).
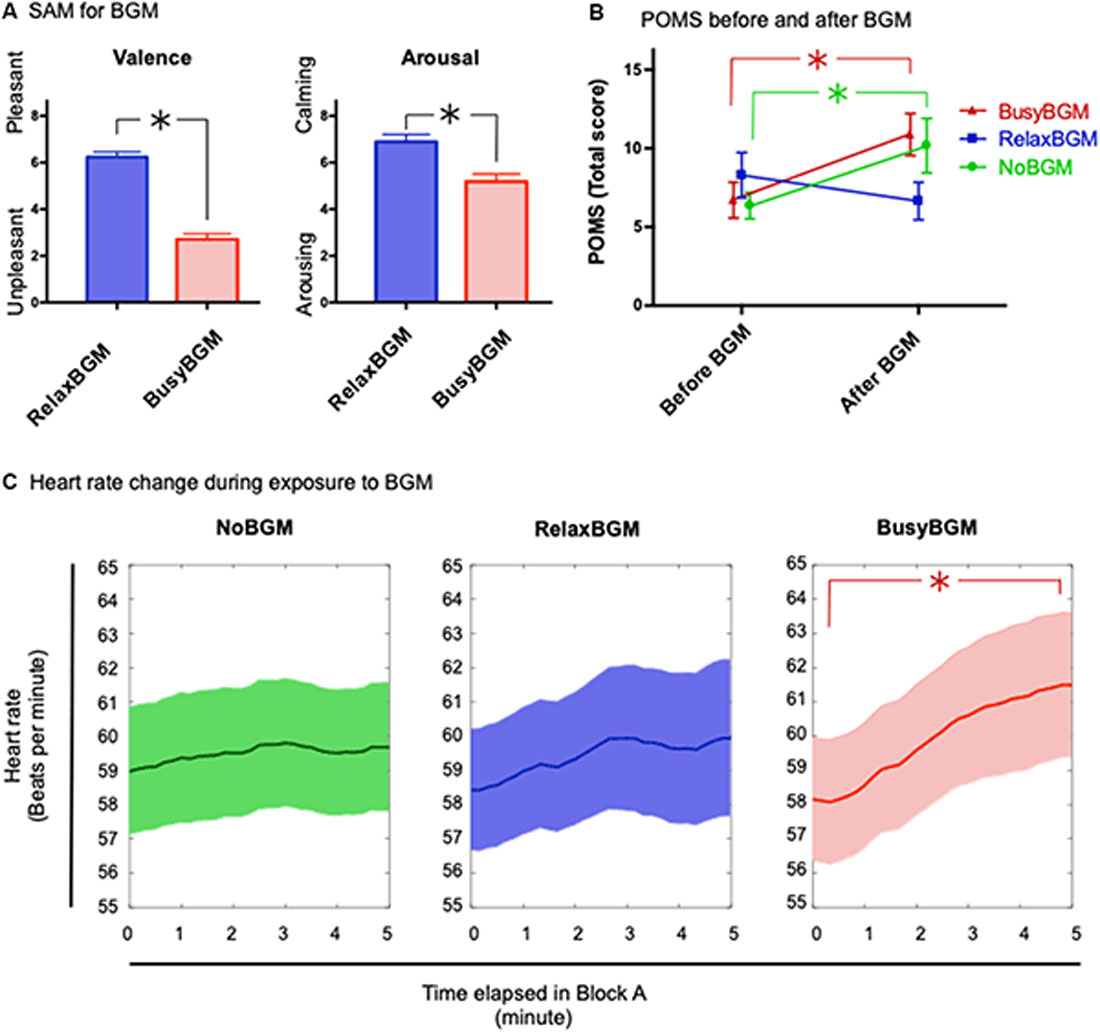
Figure 2. Affective responses and consequential mood for each background music condition. (A) Affective responses to relaxing background music (RelaxBGM) and busy background music (BusyBGM) are shown based on two-dimensional evaluation: valence and arousal. Note that RelaxBGM was more pleasant and calming than BusyBGM. (B) Emotional consequences of listening to each background music for 5 min are shown. Note that mood worsened in BusyBGM and no background music (NoBGM) conditions, whereas RelaxBGM prevented the worsening. (C) Heart rate (HR) changes were noted during exposure to each background music. HR increased in BusyBGM, while HRs at the beginning were similar in all conditions. Asterisk shows significant difference between the indicated pair.
Thereafter, we examined the mood changes caused by 5-min exposure to RelaxBGM, BusyBGM, and NoBGM using TMD calculated from POMS questionnaire. TMD score had high internal consistency in our study sample (Cronbach’s Alpha = 0.915). The two-way repeated measures ANOVA with background music and the time (before or after background music exposure) as within subject factors found simple main effect by time (F(1,16) = 11.437, P < 0.01, partial η2 = 0.417) and no effect of background music (F(2,32) = 1.251, P = 0.300, partial η2 = 0.073), and significant interaction between background music and time (F(2,32) = 10.159, P < 0.01, partial η2 = 0.388). Following planned comparisons, to check background music specific change of the mood, found worsening of TMD in BusyBGM (pre vs. post: 6.71 ± 1.14 vs. 10.88 ± 1.34, t(32) = 4.077, P < 0.01, Figure 2B) and NoBGM (pre vs. post: 6.35 ± 0.84 vs. 10.18 ± 1.73, t(32) = 3.733, P < 0.01), although no worsening was observed in RelaxBGM (pre vs. post: 8.29 ± 1.44 vs. 6.65 ± 1.19, t(32) = 1.608, P = 0.353).
Heart Rate Changes Due to the Background Music
Similar to the analysis of the mood changes due to background music, we performed the two-way repeated measures ANOVA on HR with background music and time as within subject factors. We used two representative average HR from two time windows, the first and the last 20 s of BGM exposure (Figure 2C). This analysis found significant main effect of the time (F(1,16) = 9.061, P = 0.008, partial η2 = 0.362). However, no significant effect of background music was found (F(2,32) = 0.319, P = 0.729, partial η2 = 0.020) and marginal interaction was found (F(2,32) = 3.014, P = 0.063, partial η2 = 0.159). In following planned comparisons, an increase in HR was found to be specific to BusyBGM condition (pre vs. post: 58.16 ± 1.79 vs. 61.49 ± 2.10, t(32) = 4.291, P < 0.01), and HR remained constant in NoBGM (pre vs. post: 58.97 ± 1.86 vs. 59.68 ± 1.89, t(32) = 0.901, P > 0.900) and RelaxBGM conditions (pre vs. post: 58.43 ± 1.77 vs. 59.94 ± 2.29, t(32) = 1.945, P = 0.182).
Changes in Affective Response to White Noise/Pure Tone in the Three Background Music Conditions
We examined if pure tone and white noise caused different affective responses in the three background music conditions using the two-way repeated measures ANOVA. The analysis on valence found significant main effect for the sound stimuli (F(1,16) = 16.812, P = 0.001, partial η2 = 0.512) and marginal significance for background music (F(2,32) = 2.744, P = 0.079, partial η2 = 0.146), although the interaction between them was not significant (F(2,32) = 0.232, P = 0.794, partial η2 = 0.014). Planned comparisons within the same sound stimulus found aversive response to white noise significantly reduced in BusyBGM compared to those in NoBGM (BusyBGM vs. NoBGM: 3.47 ± 0.34 vs. 2.76 ± 0.28, t(32) = 3.339, P < 0.01, Figure 3A), although no significant reduction of aversiveness was found in RelaxBGM compared to NoBGM (RelaxBGM vs. NoBGM: 3.06 ± 0.33 vs. 2.76 ± 0.28, t(32) = 1.391, P = 0.521). Interestingly, aversive response to pure tone was comparable to NoBGM in both RelaxBGM (RelaxBGM vs. NoBGM: 4.24 ± 0.32 vs. 3.94 ± 0.31, t(32) = 1.391, P = 0.521) and BusyBGM (BusyBGM vs. NoBGM: 4.47 ± 0.21 vs. 3.94 ± 0.31, t(32) = 2.504, P = 0.052).
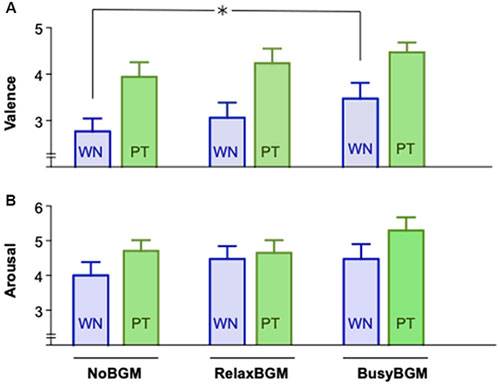
Figure 3. Affective response to white noise and pure tone for each background music condition. Self-Assessment Manikin (SAM) scores for white noise and pure tone are graphically presented. Panel (A) shows the valence scores, whereas Panel (B) shows the arousal scores. Significant difference due to background music condition is shown by asterisk.
The same analysis on arousal found marginal effect of sound stimuli (F(1.000,16.000) = 4.176, P = 0.058, partial η2 = 0.207) but no significant effect of background music (F(1.916,30.656) = 1.171, P = 0.322, partial η2 = 0.068) as well as no significant interaction (F(1.471,23.539) = 2.368, P = 0.127, partial η2 = 0.129).
Planned comparisons found no significant difference in arousal responses to white noise, which was similar to NoBGM condition in both RelaxBGM (RelaxBGM vs. NoBGM: 4.47 ± 0.37 vs. 4.00 ± 0.38, t(16) = 1.095, P = 0.869) and BusyBGM (BusyBGM vs. NoBGM: 4.47 ± 0.43 vs. 4.00 ± 0.38, t(16) = 1.000, P > 0.900 in BusyBGM, Figure 3B). Similarly, comparable arousal responses were found for pure tone (arousal response to pure tone: RelaxBGM vs. NoBGM: 4.65 ± 0.36 vs. 4.71 ± 0.31, t(16) = 0.203, P > 0.900) and in BusyBGM (BusyBGM vs. NoBGM: 5.29 ± 0.38 vs. 4.71 ± 0.31, t(16) = 2.163, P = 0.138).
Neurophysiological Response to Sound Stimulations
The two-way ANOVA analysis on P3 component amplitude found simple main effect of background music (F(2,32) = 7.601, P < 0.01, partial η2 = 0.322) and sound stimuli (F(1,16) = 77.962, P < 0.01, partial η2 = 0.830), although there was no significant interaction (F(2,32) = 0.929, P = 0.405, partial η2 = 0.055). Following comparison within each sound stimuli found that white noise-related amplitude was significantly smaller in BusyBGM (BusyBGM vs. NoBGM: 3.36 ± 0.58 vs. 5.64 ± 0.64 μV, t(32) = 3.906, P < 0.01; Figure 4), although amplitude was comparable between RelaxBGM and NoBGM (RelaxBGM vs. NoBGM: 4.54 ± 0.42 vs. 5.64 ± 0.64 μV, t(32) = 1.885, P = 0.21). Interestingly, the pure tone–related amplitude in BusyBGM was comparable to NoBGM (BusyBGM vs. NoBGM: 0.98 ± 0.34 vs. 2.15 ± 0.58 μV, t(32) = 1.999, P = 0.16) as well as in RelaxBGM (RelaxBGM vs. NoBGM: 1.47 ± 0.42 vs. 2.15 ± 0.58 μV, t(32) = 1.175, P = 0.75).
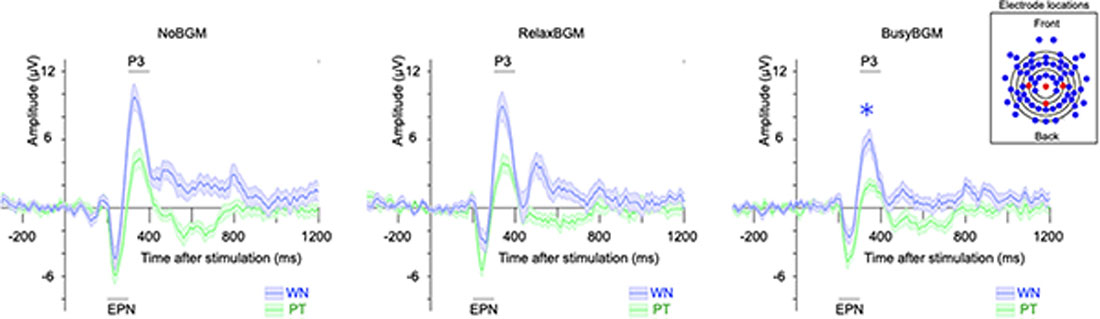
Figure 4. Event-related potentials (ERPs) to white noise and pure tone for each background music condition. Each panel shows the grand average ERP for each BGM condition. ERPs evoked by white noise (blue line), and pure tone (green line) are presented. Shaded colors represent the mean ± standard error. (The inset box) The electrodes used in the calculation of ERP (Pz, Cz, C3, and C4) are shown in red, while others are in blue.
For EPN component, simple main effect of sound stimuli (F(1,16) = 31.617, P < 0.01, partial η2 = 0.664) was found, although there was no main effect of background music (F(2,32) = 0.361, P = 0.700, partial η2 = 0.022) and no significant interaction (F(2,32) = 0.591, P = 0.560, partial η2 = 0.036). Planned comparisons of amplitudes within each sound stimuli found EPN in BusyBGM (BusyBGM vs. NoBGM: −0.64 ± 0.38 vs. −0.89 ± 0.72 μV, t(32) = 0.587) and RelaxBGM (RelaxBGM vs. NoBGM: −1.17 ± 0.69 vs. −0.89 ± 0.72 μV, t(32) = 0.634) were comparable to those in NoBGM for white noise. Pure tone–related EPN in BusyBGM (BusyBGM vs. NoBGM: −2.69 ± 0.40 vs. −3.35 ± 0.60 μV, t(32) = 1.524, P = 0.412) and RelaxBGM (RelaxBGM vs. NoBGM: −2.96 ± 0.45 vs. −3.35 ± 0.60 μV, t(32) = 0.890, P > 0.900) were also comparable to those in NoBGM.
Source Localization of ERP
Time series analysis using sLORETA between white noise and pure tone revealed significantly greater electrical activity induced by white noise than pure tone under NoBGM and RelaxBGM, whereas no difference was found for BusyBGM (Figure 5). In the NoBGM condition, significant difference between white noise and pure tone were found for the time window between 294 and 328 ms after sound stimulation, as previously reported (Masuda et al., 2018). During this time range, significantly increased electrical activity was found in the parietal lobe centering at the left inferior parietal lobule, for white noise compared with pure tone (left parietal lobe, BA 40, Figure 5A). In RelaxBGM, the difference between white noise and pure tone at the same time range was not found. However, there was a significantly increased electrical activity in the posterior cingulate cortex (PCC) in white noise compared with pure tone (Brodmann 40) at 340 ms in RelaxBGM (Figure 5B).
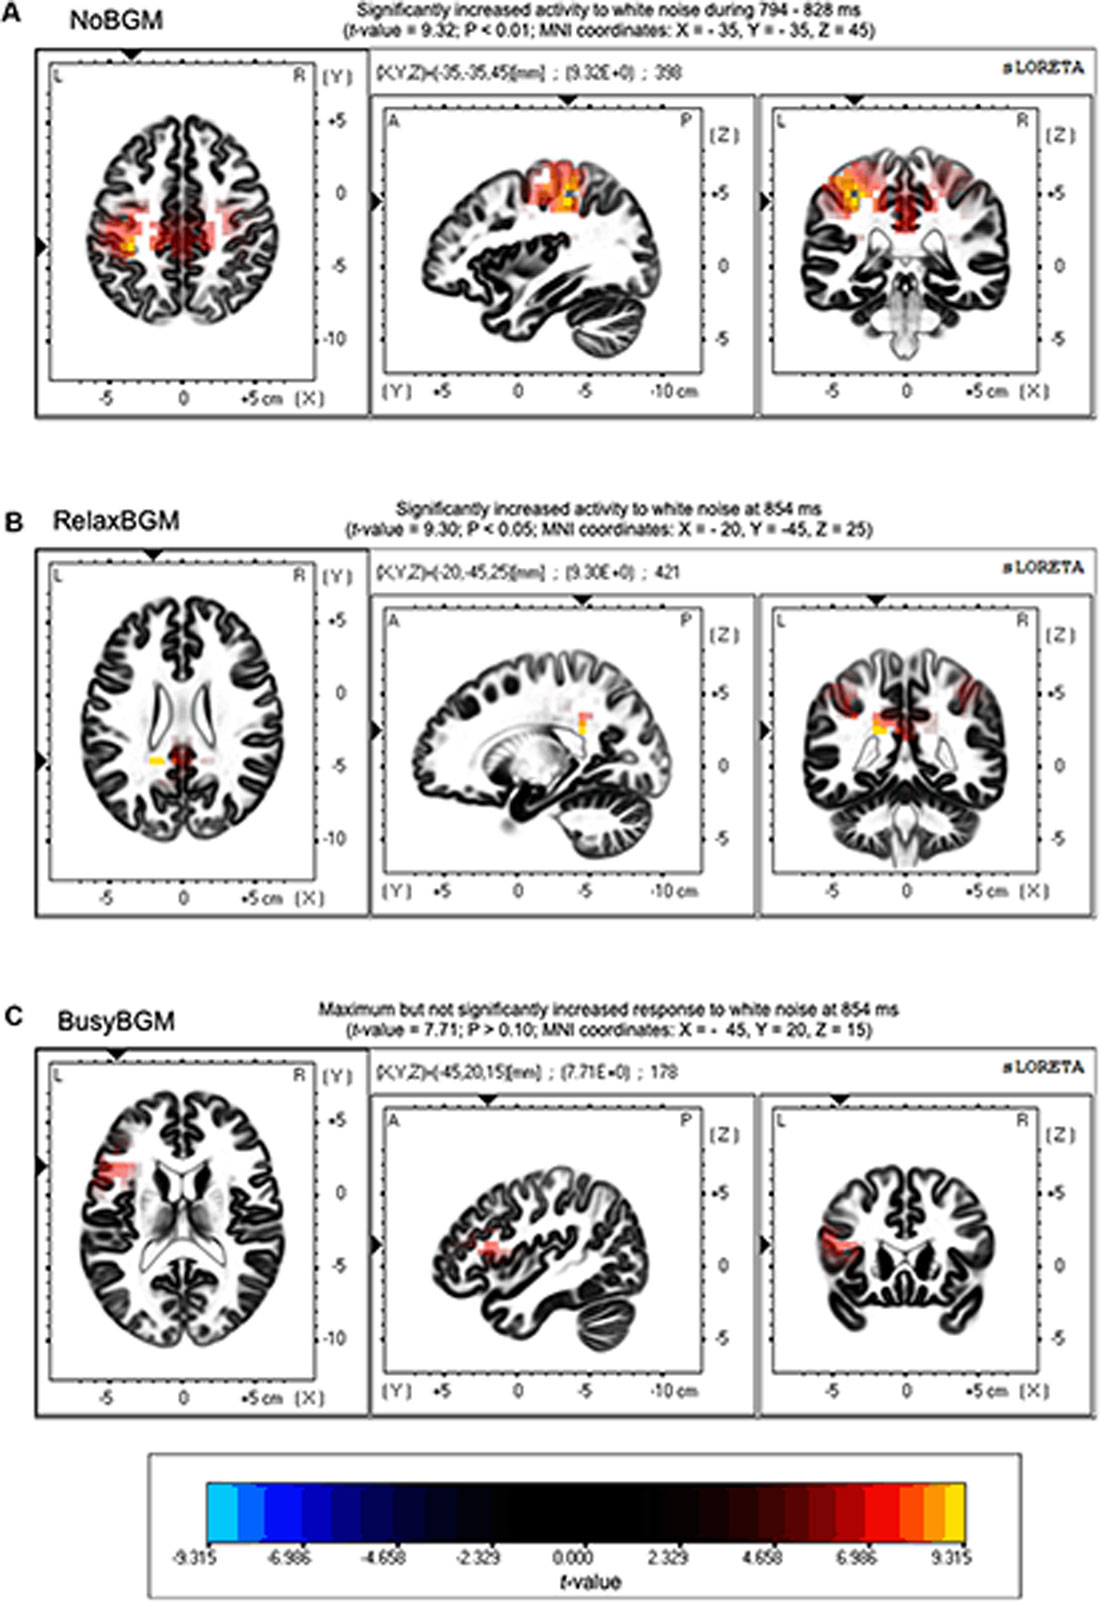
Figure 5. Source localization of differences in ERPs. Differences in neuroelectric activity induced by white noise and pure tone are presented. Regions with significantly increased neuroelectric activity responding to white noise stimulus are shown in yellow to red gradations. (A) Increased activities were found around Brodmann area 40 in no background music (NoBGM) condition. (B) Increased activities were found around Brodmann area 31 in relaxing background music (RelaxBGM) condition. (C) No statistically different responses were found in busy background music (BusyBGM) condition. Color bars show the locations of extreme t-values that close to the significant level (P < 0.05, corrected for multiple comparisons). Maximum t-value and corresponding P-value are described above in corresponding figures, and the regions of maximum difference are shown as Montreal Neurological Institute (MNI) coordinates.
Discussion
In this study, we examined the effect of mood-changing background music on affective perception. Because music therapy is reportedly used in pain clinics to reduce pain perception, we predicted that calming background music would help to reduce aversive reaction to white noise.
We used two newly composed background music, aiming to change the mood. The initial assessment of appraisal response to RelaxBGM and BusyBGM revealed that they had intended appraisal effects. As we expected, BusyBGM had mood worsening effect. Slightly different from our initial expectation, the mood was worsened in NoBGM condition possibly because of the stress of sitting still. RelaxBGM appeared to prevent such mood worsening, if not improved the mood. The mood in BusyBGM or NoBGM was not at an evidently stressful level, as the POMS total disturbance scores in the present study were low compared to that in studies assessing a stressful condition using the same measure (Rosenzweig et al., 2003). Intriguingly, even with the similar level of mood worsening in BusyBGM and NoBGM, ANS activity selectively changed in BusyBGM as shown by the increased HR. Considering that the initial HR was similar at the beginning of background music exposure, HR increase was specifically attributable to BusyBGM. The result is consistent with a previous study that showed HR changes depend on music (Koelsch and Jäncke, 2015), particularly in the presence of discomforting music (Sammler et al., 2007). Thus, the absence of HR increase in the NoBGM condition suggests that ANS activity could be differentially modulated even in the same subjective distress level. This is consistent with a report that showed differential ANS modulation by different type of stressors (Hu et al., 2016).
In examination of the background music effect on affective perception of white noise and pure tone, we found unexpected reduction in aversive response to white noise in BusyBGM. The reduction was specific to white noise, suggesting that low level aversiveness, as that found against pure tone, was less prone to the background music effect. One possible psychological explanation for these unexpected results is that moderate distress can reduce the effect of aversive stimulation. It is often indicated that moderate stress is more facilitating for human performance than no stress because the presence of stress often leads to improved performance (Smeets et al., 2008; Hupbach and Fieman, 2012) and emotion (Marin et al., 2010).
In this study, the neurophysiological responses showed the effect of background music similar to subjective response: white noise-related P3 amplitude was reduced in BusyBGM, whereas that in RelaxBGM remained comparable to NoBGM. The reduction in P3 amplitudes in BusyBGM was not due to simple phonic masking effects of the stimulus sounds by background music because the same loudness RelaxBGM did not show the same effects. In addition, P3 amplitude related to pure tone was comparable in all background music, suggesting that the observed amplitude change was white noise-specific. The reduction in P3 amplitude could be assumed as a reflection of reduced cognitive capacity to the sound stimulation, according to the processing capacity model (Kok, 2001). A study using a similar sound stimulation technique reported reduced ERP amplitudes in a state with increased mental concentration (Ullsperger et al., 2001). The amplitude reduction in sound-related ERP due to mental state is reminiscent of distress-dependent ERP changes in the present study. Thus, it is suggested that passive hearing of BusyBGM continuously consumes cognitive capacity, thereby reducing the white noise-related P3 component, although RelaxBGM did not have such an effect. In addition, a similar sound probe experiment showed the P3 amplitude related to startling loud sound was reduced while subjects were looking at emotional pictures (Keil et al., 2007). Because our study used normative loudness sound (50 dB) stimulation, instead of loud sound (95 dB) as in Keil’s study, the present results expand the knowledge that appraisal response to everyday level loudness sound could also be modulated by background music. Contrary to our findings, a study addressing the effects of similar background music conditions (excited background music, relax background music, and NoBGM) on cognitive inhibitory function reported that N2d and P3 component amplitudes are not affected (Burkhard et al., 2018). These findings suggest that the interference of background music might be a cognitive function specific, although this idea awaits further examination.
The time range corresponding to P3 (300–650 ms) is thought to be involved in linking sound stimuli and emotion (Koelsch, 2010). Our previous findings also support the involvement of P3 in the valence determination for white noise perception (Masuda et al., 2018). To further examine the mechanism of reduced P3 amplitude, we performed the current source density analysis on aversive perception related potentials. This analysis showed significantly different neuroelectric activities between white noise and pure tone in NoBGM and RelaxBGM, whereas no significant difference was found in BusyBGM.
The absence of significantly different neuroelectric activity in BusyBGM was consistent with the decreased P3 amplitude difference in BusyBGM, whereas significantly different neuroelectric activities were consistent with the significant ERP amplitudes difference in NoBGM and RelaxBGM. The increased neuroelectric activity of the parietal region in NoBGM may have resulted from the additional process associated with white noise, presumably resolving the sound feature (Masuda et al., 2018). In RelaxBGM, increased neuroelectric activity was found in the PCC. The PCC is generally believed to function as one of the nodes in default mode network (Buckner et al., 2008), and thus, increased activity in white noise compared with pure tone process is unexpected. However, a report mentioned that the PCC also plays a role in the cognitive perception of tintius (Vanneste and De Ridder, 2012), suggesting that the activity in the area may be involved in the perception of discomfort auditory experience. These results suggested that background music exert effects on process later than 300 ms, explaining why we did not find background music effect on EPN.
Considering that the HR increase was the difference between NoBGM and BusyBGM, HR increase could be a physiological feature predicting reduced perception of aversiveness. Because increased HR is associated with increased mental workload (Liu et al., 2017), HR increase in BusyBGM may reflect increased mental workload related to continuous auditory processing of busy noise. This assumption fits aforementioned cognitive capacity model. Thus, the P3 amplitude reducing effect may be exerted by background music that accompanies an increase in HR possibly through increased mental activity, which was typically found in BusyBGM in this study.
Although we have discussed the results of the present study in relation to music and possible link to music therapy in general, there are several limitations. First, we used white noise as aversive stimulation, although it was only shown to be aversive relative to 1,000 Hz pure tone. Thus, we should be careful when interpreting the findings of the present study as a common mechanism underlying all aversive stimuli. In addition, we used two background music, as a representative of busy music and relaxing music. However, it is not warranted that all music within one category will have the same effect. In fact, RelaxBGM did not improve the mood in this study, although it apparently prevented mood worsening. Thus, it is inappropriate to conclude the effect of the mood improving music based on the results of the present study. It should also be noted that we used city noise as BusyBGM. Further studies in this field are required to generalize the effects of background music on affective perception. Regarding the statistics, we reported the results of planned comparisons in all analyses based on the suggestion that comparisons are meaningful even when interaction was not significant (Wei et al., 2012). Last, our study sample included four participants who had history of music education. We included these participants to keep statistical power, but we also confirmed that results were largely similar even after excluding these participants (Supplementary Material).
Overall, this study concluded that background music can modulate affective perception via changes in neuroelectric response to certain stimulation. We hope these findings facilitate the optimization of music therapy and cognitive control.
Ethics Statement
All subjects gave written informed consent in accordance with the Declaration of Helsinki. The protocol was approved by the ethical committee at Shiga University of Medical Science (Approved #26-227).
Author Contributions
HK and MM conceived the study. FM and YS recruited participants and conducted the study, under management by NY. AY conducted the mathematical analysis, and MT conducted the statistical analysis. MM prepared the manuscript and HK confirmed the final version of the manuscript.
Funding
The study was funded by research support from YAMAHA corporation and JSPS KAKENHI (15K16565, 17H00872, 16K20817).
Conflict of Interest Statement
Background music source was provided by YAMAHA corporation.
The authors declare that the research was conducted in the absence of any commercial or financial relationships that could be construed as a potential conflict of interest.
Acknowledgments
We would like to thank Enago (www.enago.jp) for the English language review.
Abbreviations
NoBGM, no background music; RelaxBGM, relaxing background music; BusyBGM, busy background music; ANOVA, analysis of variance; ANS, autonomic nervous system; CRT, cathode ray tube; HR, heart rate; POMS, Profile of Mood States; TMD, Total Mood Disturbance; SAM, Self-Assessment Manikin; ERP, event-related potential; EPN, early posterior negativity; LORETA, low resolution brain electromagnetic tomography; PCC, posterior cingulate cortex.
Supplementary Material
The Supplementary Material for this article can be found online at: https://www.frontiersin.org/articles/10.3389/fnhum.2019.00184/full#supplementary-material
References
Aalbers, S., Fusar-Poli, L., Freeman, R. E., Spreen, M., Ket, J. C., Vink, A. C., et al. (2017). Music therapy for depression. Cochrane Database Syst. Rev. 11:CD004517. doi: 10.1002/14651858.CD004517.pub3
Boltz, M. G. (2004). The cognitive processing of film and musical soundtracks. Mem. Cognit. 32, 1194–1205. doi: 10.3758/bf03196892
Bradley, M. M., and Lang, P. J. (1994). Measuring emotion: the self-assessment Manikin and the semantic differential. J. Behav. Ther. Exp. Psychiatry 25, 49–59. doi: 10.1016/0005-7916(94)90063-9
Bradt, J., Dileo, C., and Potvin, N. (2013). Music for stress and anxiety reduction in coronary heart disease patients. Cochrane Database Syst. Rev. 12:CD006577. doi: 10.1002/14651858.cd006577.pub3
Buckner, R. L., Andrews-Hanna, J. R., and Schacter, D. L. (2008). The brain’s default network: anatomy, function, and relevance to disease. Ann. N Y Acad. Sci. 1124, 1–38. doi: 10.1196/annals.1440.011
Burkhard, A., Elmer, S., Kara, D., Brauchli, C., and Jäncke, L. (2018). The effect of background music on inhibitory functions: an ERP study. Front. Hum. Neurosci. 12:293. doi: 10.3389/fnhum.2018.00293
Cavanagh, J., and Geisler, M. W. (2006). Mood effects on the ERP processing of emotional intensity in faces: a P3 investigation with depressed students. Int. J. Psychophysiol. 60, 27–33. doi: 10.1016/j.ijpsycho.2005.04.005
Conroy, M. A., and Polich, J. (2007). Affective valence and P300 when stimulus arousal level is controlled. Cogn. Emot. 21, 891–901. doi: 10.1080/02699930600926752
Cruickshanks, K. J., Wiley, T. L., Tweed, T. S., Klein, B. E., Klein, R., Mares-Perlman, J. A., et al. (1998). Prevalence of hearing loss in older adults in Beaver Dam, Wisconsin. The Epidemiology of Hearing Loss Study. Am. J. Epidemiol. 148, 879–886. doi: 10.1093/oxfordjournals.aje.a009713
Delorme, A., and Makeig, S. (2004). EEGLAB: an open source toolbox for analysis of single-trial EEG dynamics including independent component analysis. J. Neurosci. Methods 134, 9–21. doi: 10.1016/j.jneumeth.2003.10.009
Furnham, A., and Strbac, L. (2002). Music is as distracting as noise: the differential distraction of background music and noise on the cognitive test performance of introverts and extraverts. Ergonomics 45, 203–217. doi: 10.1080/00140130210121932
Hu, M. X., Lamers, F., de Geus, E. J., and Penninx, B. W. (2016). Differential autonomic nervous system reactivity in depression and anxiety during stress depending on type of stressor. Psychosom. Med. 78, 562–572. doi: 10.1097/PSY.0000000000000313
Huang, Y. X., and Luo, Y. J. (2006). Temporal course of emotional negativity bias: an ERP study. Neurosci. Lett. 398, 91–96. doi: 10.1016/j.neulet.2005.12.074
Hupbach, A., and Fieman, R. (2012). Moderate stress enhances immediate and delayed retrieval of educationally relevant material in healthy young men. Behav. Neurosci. 126, 819–825. doi: 10.1037/a0030489
Keil, A., Bradley, M. M., Junghöfer, M., Russmann, T., Lowenthal, W., and Lang, P. J. (2007). Cross-modal attention capture by affective stimuli: evidence from event-related potentials. Cogn. Affect. Behav. Neurosci. 7, 18–24. doi: 10.3758/cabn.7.1.18
Kim, K. H., Ho, D. X., Brown, R. J., Oh, J. M., Park, C. G., and Ryu, I. C. (2012). Some insights into the relationship between urban air pollution and noise levels. Sci. Total Environ. 424, 271–279. doi: 10.1016/j.scitotenv.2012.02.066
Koelsch, S. (2010). Towards a neural basis of music-evoked emotions. Trends Cogn. Sci. 14, 131–137. doi: 10.1016/j.tics.2010.01.002
Koelsch, S., and Jäncke, L. (2015). Music and the heart. Eur. Heart J. 36, 3043–3049. doi: 10.1093/eurheartj/ehv430
Kok, A. (2001). On the utility of P3 amplitude as a measure of processing capacity. Psychophysiology 38, 557–577. doi: 10.1017/s0048577201990559
Lee, J. H. (2016). The effects of music on pain: a meta-analysis. J. Music Ther. 53, 430–477. doi: 10.1093/jmt/thw012
Liu, Y., Ayaz, H., and Shewokis, P. A. (2017). Multisubject “learning” for mental workload classification using concurrent EEG, fNIRS and physiological measures. Front. Hum. Neurosci. 11:389. doi: 10.3389/fnhum.2017.00389
Lopez-Calderon, J., and Luck, S. J. (2014). ERPLAB: an open-source toolbox for the analysis of event-related potentials. Front. Hum. Neurosci. 8:213. doi: 10.3389/fnhum.2014.00213
Marin, M. F., Pilgrim, K., and Lupien, S. J. (2010). Modulatory effects of stress on reactivated emotional memories. Psychoneuroendocrinology 35, 1388–1396. doi: 10.1016/j.psyneuen.2010.04.002
Masuda, F., Sumi, Y., Takahashi, M., Kadotani, H., Yamada, N., and Matsuo, M. (2018). Association of different neural processes during different emotional perceptions of white noise and pure tone auditory stimuli. Neurosci. Lett. 665, 99–103. doi: 10.1016/j.neulet.2017.11.046
Mercadie, L., Mick, G., Guetin, S., and Bigand, E. (2015). Effects of listening to music versus environmental sounds in passive and active situations on levels of pain and fatigue in fibromyalgia. Pain Manag. Nurs. 16, 664–671. doi: 10.1016/j.pmn.2015.01.005
Millett, C. R., and Gooding, L. F. (2018). Comparing active and passive distraction-based music therapy interventions on preoperative anxiety in pediatric patients and their caregivers. J. Music Ther. 54, 460–478. doi: 10.1093/jmt/thx014
Milliman, R. E. (1982). Using background music to affect the behavior of supermarket shoppers. J. Mark. 46, 86–91. doi: 10.2307/1251706
Milliman, R. E. (1986). The influence of background music on the behavior of restaurant patrons. J. Consum. Res. 13, 286–289. doi: 10.1086/209068
Oldfield, R. C. (1971). The assessment and analysis of handedness: the Edinburgh inventory. Neuropsychologia 9, 97–113. doi: 10.1016/0028-3932(71)90067-4
Olofsson, J. K., Nordin, S., Sequeira, H., and Polich, J. (2008). Affective picture processing: an integrative review of ERP findings. Biol. Psychol. 77, 247–265. doi: 10.1016/j.biopsycho.2007.11.006
Pascual-Marqui, R. D., Michel, C. M., and Lehmann, D. (1994). Low resolution electromagnetic tomography: a new method for localizing electrical activity in the brain. Int. J. Psychophysiol. 18, 49–65. doi: 10.1016/0167-8760(84)90014-x
Picton, T. W., Bentin, S., Berg, P., Donchin, E., Hillyard, S. A., Johnson, R. Jr., et al. (2000). Guidelines for using human event-related potentials to study cognition: recording standards and publication criteria. Psychophysiology 37, 127–152. doi: 10.1017/s0048577200000305
Rauscher, F. H., Shaw, G. L., and Ky, K. N. (1993). Music and spatial task performance. Nature 365:611. doi: 10.1038/365611a0
Rosenzweig, S., Reibel, D. K., Greeson, J. M., Brainard, G. C., and Hojat, M. (2003). Mindfulness-based stress reduction lowers psychological distress in medical students. Teach. Learn. Med. 15, 88–92. doi: 10.1207/S15328015TLM1502_03
Sammler, D., Grigutsch, M., Fritz, T., and Koelsch, S. (2007). Music and emotion: electrophysiological correlates of the processing of pleasant and unpleasant music. Psychophysiology 44, 293–304. doi: 10.1111/j.1469-8986.2007.00497.x
Sloboda, J. A., and Juslin, P. N. (2001). “Psychological perspectives on music and emotion,” in Series in Affective Science, Music and Emotion: Theory and Research, eds P. N. Juslin and J. A. Sloboda (New York, NY: Oxford University Press), 71–104.
Smeets, T., Otgaar, H., Candel, I., and Wolf, O. T. (2008). True or false? Memory is differentially affected by stress-induced cortisol elevations and sympathetic activity at consolidation and retrieval. Psychoneuroendocrinology 33, 1378–1386. doi: 10.1016/j.psyneuen.2008.07.009
Sousou, S. D. (1997). Effects of melody and lyrics on mood and memory. Percept. Mot. Skills 85, 31–40. doi: 10.2466/pms.85.5.31-40
Tarvainen, M. P., Niskanen, J. P., Lipponen, J. A., Ranta-Aho, P. O., and Karjalainen, P. A. (2014). Kubios HRV—heart rate variability analysis software. Comput. Methods Programs Biomed. 113, 210–220. doi: 10.1016/j.cmpb.2013.07.024
Thompson, W. F., Schellenberg, E. G., and Husain, G. (2001). Arousal, mood, and the Mozart effect. Psychol. Sci. 12, 248–251. doi: 10.1111/1467-9280.00345
Ullrich, S., Kotz, S. A., Schmidtke, D. S., Aryani, A., and Conrad, M. (2016). Phonological iconicity electrifies: an ERP study on affective sound-to-meaning correspondences in German. Front. Psychol. 7:1200. doi: 10.3389/fpsyg.2016.01200
Ullsperger, P., Freude, G., and Erdmann, U. (2001). Auditory probe sensitivity to mental workload changes—an event-related potential study. Int. J. Psychophysiol. 40, 201–209. doi: 10.1016/s0167-8760(00)00188-4
van der Steen, J. T., Smaling, H. J., van der Wouden, J. C., Bruinsma, M. S., Scholten, R. J., and Vink, A. C. (2018). Music-based therapeutic interventions for people with dementia. Cochrane Database Syst. Rev. 7:CD003477. doi: 10.1002/14651858.CD003477.pub4
Vanneste, S., and De Ridder, D. (2012). The auditory and non-auditory brain areas involved in tinnitus. An emergent property of multiple parallel overlapping subnetworks. Front. Syst. Neurosci. 6:31. doi: 10.3389/fnsys.2012.00031
Wei, J., Carroll, R. J., Harden, K. K., and Wu, G. (2012). Comparisons of treatment means when factors do not interact in two-factorial studies. Amino Acids 42, 2031–2035. doi: 10.1007/s00726-011-0924-0
Yuan, J., Xu, S., Yang, J., Liu, Q., Chen, A., Zhu, L., et al. (2011). Pleasant mood intensifies brain processing of cognitive control: ERP correlates. Biol. Psychol. 87, 17–24. doi: 10.1016/j.biopsycho.2011.01.004
Zatorre, R. J. (2015). Musical pleasure and reward: mechanisms and dysfunction. Ann. N Y Acad. Sci. 1337, 202–211. doi: 10.1111/nyas.12677
Keywords: background music, affective response, mood changes, event-related potentials, modulation of affective perception
Citation: Matsuo M, Masuda F, Sumi Y, Takahashi M, Yoshimura A, Yamada N and Kadotani H (2019) Background Music Dependent Reduction of Aversive Perception and Its Relation to P3 Amplitude Reduction and Increased Heart Rate. Front. Hum. Neurosci. 13:184. doi: 10.3389/fnhum.2019.00184
Received: 08 January 2019; Accepted: 20 May 2019;
Published: 27 June 2019.
Edited by:
Ryouhei Ishii, Osaka Prefecture University, JapanReviewed by:
Lutz Jäncke, University of Zurich, SwitzerlandChristopher J. Brush, Rutgers University, The State University of New Jersey, United States
Copyright © 2019 Matsuo, Masuda, Sumi, Takahashi, Yoshimura, Yamada and Kadotani. This is an open-access article distributed under the terms of the Creative Commons Attribution License (CC BY). The use, distribution or reproduction in other forums is permitted, provided the original author(s) and the copyright owner(s) are credited and that the original publication in this journal is cited, in accordance with accepted academic practice. No use, distribution or reproduction is permitted which does not comply with these terms.
*Correspondence: Hiroshi Kadotani, kadotanisleep@gmail.com