 Haochen Liu
 Chunxiang Wei
 Hua He
 Xiaoquan Liu
 the Alzheimer's Disease Neuroimaging Initiative
- Center of Drug Metabolism and Pharmacokinetics, China Pharmaceutical University, Nanjing, China
Aβ, tau, and P-tau have been widely accepted as reliable markers for Alzheimer's disease (AD). The crosstalk between these markers forms a complex network. AD may induce the integral variation and disruption of the network. The aim of this study was to develop a novel mathematic model based on a simplified crosstalk network to evaluate the disease progression of AD. The integral variation of the network is measured by three integral disruption parameters. The robustness of network is evaluated by network disruption probability. Presented results show that network disruption probability has a good linear relationship with Mini Mental State Examination (MMSE). The proposed model combined with Support vector machine (SVM) achieves a relative high 10-fold cross-validated performance in classification of AD vs. normal and mild cognitive impairment (MCI) vs. normal (95% accuracy, 95% sensitivity, 95% specificity for AD vs. normal; 90% accuracy, 94% sensitivity, 83% specificity for MCI vs. normal). This research evaluates the progression of AD and facilitates AD early diagnosis.
Introduction
Alzheimer's disease (AD), the most common form of dementia, is characterized by a decline in cognitive ability (Ewers et al., 2012; Farah, 2014). Current estimates suggest that 36 million people worldwide have AD and the number is expected to almost triple in the next few decades (Grammas and Martinez, 2014). Since the symptomatic drugs currently on the market for AD have limited efficacy and only provides symptomatic relief without long-term cure, an important area to understand the disease progression and identify the potential vital pathological biomarkers for the progression has recently received increasing attention (Zhou et al., 2013; Salem et al., 2014).
Neuropsychological tests such as Mini Mental State Examination (MMSE) and Clinical Dementia Rating (CDR) are widely used in the clinical evaluation of patients with suspected dementia (Powell et al., 2006). However, neuropsychological tests alone are inadequate to diagnose AD at the early stages (Zamrini et al., 2004). The biomarker-based assessment of AD has been proposed to enhance the clinical detection of AD in early prodromal stages of the disease (Dubois et al., 2007). The use of biomarkers in clinical diagnostics may help us to determine whether some mild cognitive impairment (MCI) symptoms are due to AD (Ewers et al., 2012). Several researches have suggested that cerebrospinal fluid (CSF) based biomarkers are high precision risk factors in the disease process (Blennow and Hampel, 2003; Brys et al., 2009).
AD has two major pathological hallmarks in CSF including senile plaques and neurofibrillary tangles (NFT) (Kimura et al., 2014). NFTs make up from intracellular aggregates of hyperphosphorylated tau protein (P-tau) and senile plaques consist mainly of amyloid β peptide (Aβ) (Small, 2008; Kimura et al., 2014). Previous researches have shown the interaction of tau, P-tau, and Aβ (Figure 1). On one hand, P-tau can increase activity of acetyl-cholinesterase (AChE). Then the increased AChE activity can elevate Aβ production by modulating the levels of the γ-secretase catalytic subunit presenilin-1 (PS1) (García-Ayllón et al., 2011). On the other hand, Aβ may affect the level of P-tau through two pathways. Firstly, Aβ can raise the activity of AChE which can activate the tau kinase glycogen synthase kinase-3β (GSK-3β) inducing tau hyperphosphorylation (García-Ayllón et al., 2011). Secondly, Aβ can activate the voltage-dependent Ca2+ channels (VVCD) and N-methyl-D-aspartic acid (NMDA) receptors which results in the release of intracellular Ca2+ (Shen et al., 2006; Bezprozvanny and Mattson, 2008). Then the increased levels of intracellular Ca2+ might initiate a signal transduction pathway to activate Ca2+-sensitive protein kinases which are responsible for the hyperphosphorylation of tau (Shen et al., 2006). Furthermore, previous researches have expounded the role of Aβ and tau pathology. On one hand, Aβ plays a vital role in progression of AD which may lead in turn to a series of downstream events ranging from synapse loss to plaque deposition to inflammation to the triggering of tau hyperphosphorylation to the death of susceptible neurons (Herrup, 2010). On the other hand, tau pathology plays a complicated role in the progression of AD. Tau pathology may affect DNA repair, neuronal activity, and inter-neuronal signaling (Hanger et al., 2014). Though the mechanism and roles of tau pathology are not yet fully elucidated, a consensus that the tau pathology can enhance cognitive decline and cause dementia is widely accepted (Salminen et al., 2011).
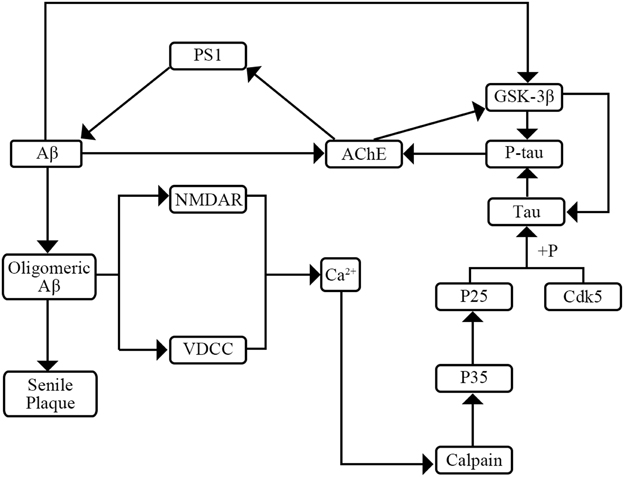
Figure 1. The interaction of Aβ, tau, and P-tau.
In this study, a cross-talk network is established by integrating the interactions among CSF biomarkers. As a complex biology system, cross-talk network has two properties. The first is small-worldness which means that most pairs of nodes can be linked to each other by relatively short chains (Maslov and Ispolatov, 2007; Zhao et al., 2010). Secondly, robustness is the capacity of keeping homeostasis under a range of condition which may be disrupted by disease (He et al., 2013; Nijhout and Reed, 2014).
The aim of this research is to provide novel insight into the progression from the perspective of crosstalk network disruption. Nevertheless, cross-talk network is a large complicated system, evaluating the entire network robustness is less practical. To address this issue, a simplified cross-talk network termed as mini network is established. The widely accepted key markers are selected to form the skeleton of the mini network. The cross-talk among key markers is modeled by transit compartments model. Robustness and the integral variation of the mini network are proposed to be used as a good proxy for complex disease progression. In our model, three mini network integral disruption parameters U, K, and φ are introduced to evaluate integral variation of the network and mini network disruption probability is employed to measure the robustness of mini network.
Materials and Method
Subject
Data used in the preparation of this article were obtained from the Alzheimer's Disease Neuroimaging Initiative (ADNI) database (adni.loni.usc.edu). The initial goal of ADNI was to recruit 800 subjects but ADNI has been followed by ADNI-GO and ADNI-2. To date these three protocols have recruited over 1500 adults, ages 55–90, to participate in the research, consisting of cognitively normal older individuals, people with early or late MCI, and people with early AD. For up-to-date information, see http://www.adni-info.org.
In this study, the longitudinal biomarker data (4 years, version: 2012-09-06) in ADNI-1 is used to develop the model. The data set includes three CSF markers: Tau protein, Aβ, and Phosphorylated tau protein (P-tau). Details of the CSF analysis and quality control measures have previously been published (Shaw et al., 2009). The patients are divided into three groups: AD, MCI, and normal control group. The CSF samples are collected at four time points: 12, 24, 36, and 48 months. Patients with missing data are excluded in our experiments. The demographic information of subjects used in this study at different time points is given in Table 1.
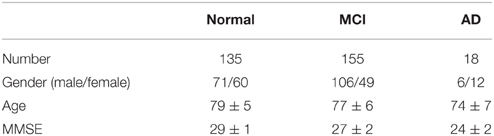
Table 1. Demographic information of subjects.
Model Development
In this study, the mini network is established based on the property of small-worldness. Then the robustness of the mini network is evaluated by Monte Carlo Simulation and disruption parameters. In addition, our model can identify the potential vital biomarkers in the disease progression. The framework of the model is shown in Figure 2.
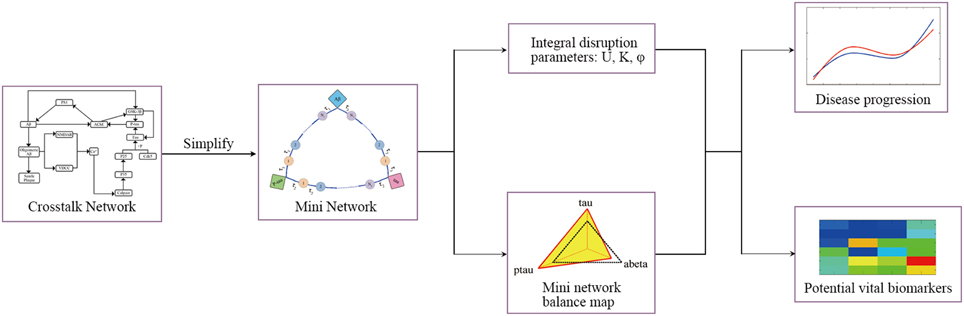
Figure 2. The framework of model.
Modeling Mini Network
The structure of mini network is shown in Figure 3. The mini network is established based on small-worldness property which means that the markers in the network can affect each other. The interaction among markers involves multiple middle links. For example, Aβ increases the activity of AChE. Then the AChE activates the GSK-3β inducing the hyperphosphorylation of tau. In contrast, P-tau can also affect Aβ by elevating AChE. In our model, these middle links between the biomarkers are represented by transit compartments. The mathematic model of mini network is given in Supplementary Material.
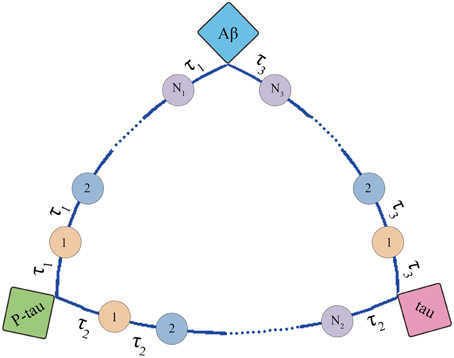
Figure 3. Structure of mini network. Transit compartments with a mean transit time constant τ are used to descript the indirect interactions between these markers.
Estimation of Mini Network Integral Disruption Parameters
In this study, three mini network integral disruption parameters U, K, and φ are used to evaluate the integral variation of the mini network.
Va is a vector including levels of all the markers in the mini network in pathogenic state. Vb is a vector including levels of all the markers in the mini network in normal state. |Va| and |Vb| are their modular. The symbol “T” in Equation (3) represents vector transposition. Moreover, a simulation experiment is performed for investigating the physiological significance of the disruption parameters (shown in Investigation of Disruption Parameters Physiological Significance).
Estimation of Mini Network Disruption Probability
In this study Monte Carlo Simulation is used to estimate probability of mini network disruption. At the beginning, generate random perturbations for all the biomarkers in the mini network and assess the mini network disruption by U, K, and φ after random perturbation. Finally, calculate probability of network disruption (Equation 4) and its relative error (Equation 5), and repeat the above steps until the relative error is less than 5%.
tα∕2 is unilateral threshold of t distribution. pf is the probability of mini network disruption. n is the predefined iterative number. d is number of network disruption. D is the current iterative number.
Recognition of Potential Vital Biomarkers
We define the marker with the greatest contribution to the mini network disruption as the potential vital biomarker during the disease progression, and its contribution can be measured by the probability of mini network disruption calculated when only a single marker or a group of markers with interaction is disturbed. For the recognition of potential vital biomarkers, the first step of Monte Carlo simulation needs a minor modification. When evaluating the contribution of the ith marker, it needs to be disturbed and the other markers remain invariant. The joint contribution of multi-marker can be estimated in the same way: disturb the group of the markers to be evaluated and keep the other markers constant.
Model Performance Evaluation
In this study, we evaluate model performance in two ways. First, check if the mini network disorder probability can be used as a proxy for the disease progression by performing regression analysis of mini network and MMSE.
Second, check if the model can improve the accuracy of AD diagnosis by comparing classification accuracy of AD vs. normal and MCI vs. normal. Two Support vector machines (SVM) are trained for measure the classification performance: SVM based on mini network disruption parameters (U, K, φ) and mini network disorder probability and SVM based on CSF markers (tau, P-tau, and Aβ). The classification performance is evaluated by 10-fold cross-validation.
Investigation of Disruption Parameters Physiological Significance
To illustrate significance of U, K, and φ, we perform a simulation experiment. The change of biomarkers is simulated in three cases. The three situations are shown as follows:
• Single marker changing simulation: Only one marker changes as the gradient.
• Multi-marker changing simulation 1: All the markers increase as the gradient. For instance, the gradient is 10%. At this situation, all three markers increase 10%.
• Multi-marker changing simulation 2: The first marker increases as the gradient and the other two markers decrease as the gradient. For instance, marker A increases 10% and markers B and C decrease 10%.
Finally, observe the change of the three dynamic parameters U, K, and φ.
For a further insight into the significance of mini network integral disruption parameters, an addition test is performed. Three SVMs are trained for evaluating the contribution of mini network integral disruption parameters in the classification: SVM based on K and φ for assessing the contribution of parameter U, SVM based on K and U for assessing the contribution of parameter φ, SVM based on φ and U for assessing the contribution of parameter K. Then observe the performance of these three SVMs.
Result
Model Performance
Figure 4 indicates that mini network disorder probability has good linear relationship with MMSE suggesting that mini network disorder may be a good proxy for disease progression. Figure 5 shows that our model may improve the classification accuracy and specificity of AD vs. normal and MCI vs. normal. Our model may enhance the classification sensitivity of MCI vs. normal.
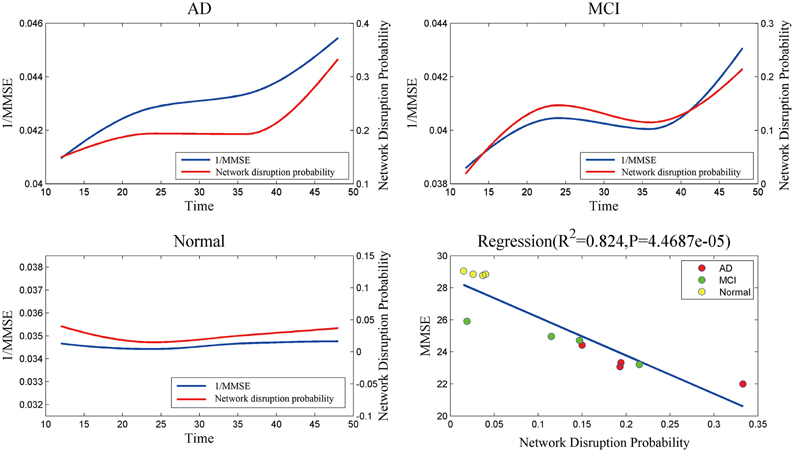
Figure 4. The relationship and correlation analysis between estimated mini network disruption probability and MMSE. As plot AD, MCI, and normal shown, mini network disruption probability coincides with 1/MMSE. In plot regression, least squares regression is used to analyze the correlation between mini network disruption probability and MMSE.
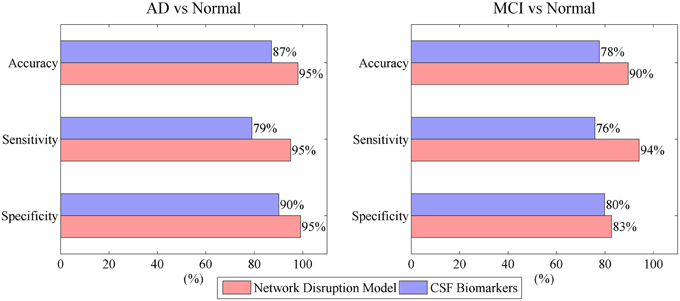
Figure 5. Model performance in classification of AD vs. normal and MCI vs. normal.
Evaluation of Mini Network Balance
Mini network balance map (see Figure 6) is used to describe mini network imbalance visually. The closer to equilateral triangle the shape is, the less serious the mini network imbalance is. The results (Figure 6B) show that mini network imbalance deteriorates rapidly from 12 to 24 and 36 to 48 months while there is a plateau between the above two periods in both AD and MCI group, which coincide with the changes of MMSE.
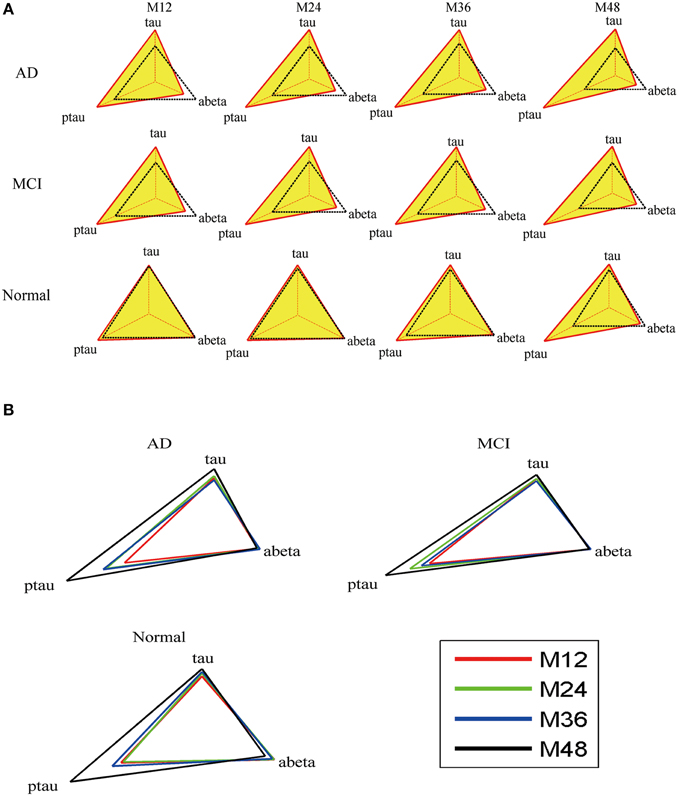
Figure 6. Mini network balance map of AD based on CSF biomarkers panel. (A) Mini network balance maps for the three groups at different time points. (B) Longitudinal mini network balance maps for the three groups. In normal state, the shape of mini network balance map is equilateral triangle. With the shape deformation, the mini network imbalance gets serious.
The results of mini network disruption probability and MMSE are shown in the Figure 4. In AD group and MCI group, the mini network disruption probability increases rapidly between 12 and 24 months and there is a platform period from 24 to 36 months, then the disease progression turn into a rapid deterioration period until 48 months. In the normal control group, the mini network disruption probability keeps fluctuating during this study.
Significance of Mini Network Disruption Parameters
The mini network disruption parameters U, K, and φ can be used to evaluate mini network imbalance integrally. According to Equations (1–3), with the mini network variation gets smaller, the K-value gets closer to 1 whereas the values of U and φ get closer to 0.
The simulation experiment result is presented in the Table 2. The results of single marker changing simulation indicate that the parameters U and φ are related to the variation of single marker. The results of multi-marker changing simulation 1 suggest that parameter K is related to the consistency multi-marker changing and U is sensitive to the great consistency variation of multi-marker. The results of multi-marker changing simulation 2 indicate that parameters U and φ are related to the multi-marker inconsistency variation. We summarize physiological significance of U, K, and φ with the simulation experiment evidence. U is responses to both consistency variation and inconsistency variation comprehensively. K responds to multi-marker consistency variation. φ is response to the multi-marker inconsistency variation.
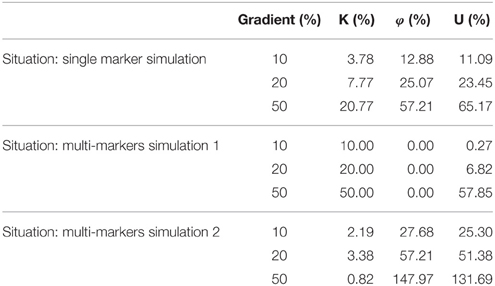
Table 2. The mini network integral disruption parameters changes in simulation experiment.
The boxplot of mini network disruption parameters (Figure 7A) shows that these three parameters in both AD and MCI groups are significantly greater than those in normal group (P < 0.01, based on One-way ANOVA, Table 3) which suggests that if mini network disruption parameters U, K, and φ are higher than the upper whisker of normal group, the patient may have high disease risk. Moreover, the trajectory figure (Figure 7B) shows that the variation of parameter U is similar to the disease progression.
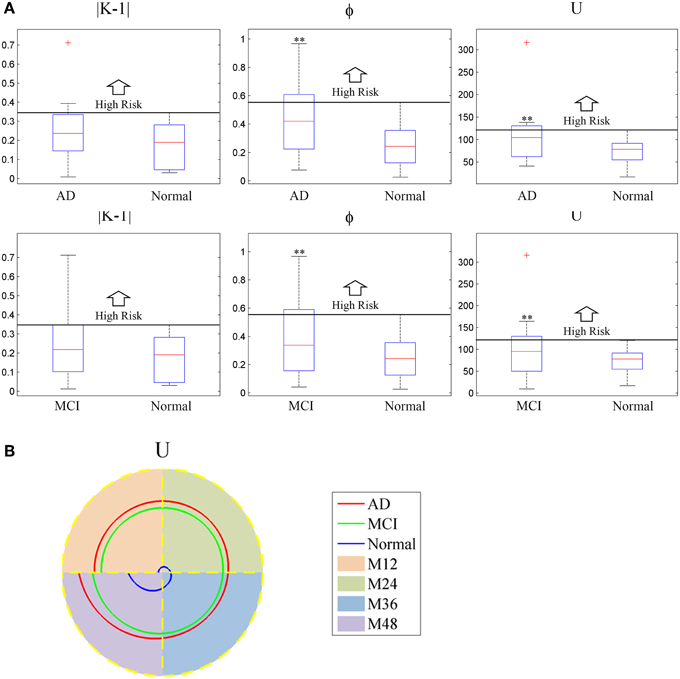
Figure 7. (A) Box plot of mini network integral disruption parameters. “+” represents data points beyond the whiskers. (B) The trajectory figure of the mini network integral disruption parameter U. The different colors of the area under the curve indicate different time period. With the curves of U farther to the center, mini network imbalance gets worse. **P < 0.01 vs. normal.
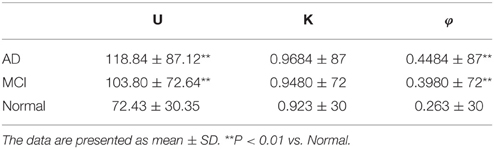
Table 3. Estimation of disruption parameters U, K, and φ.
The contribution of the mini network integral disruption parameters are shown in the Figure 8. The SVM based on all three parameters has the best classification performance compared with the other SVMs. The SVM without parameter U has the poorest performance which is same as the SVM based on CSF markers.
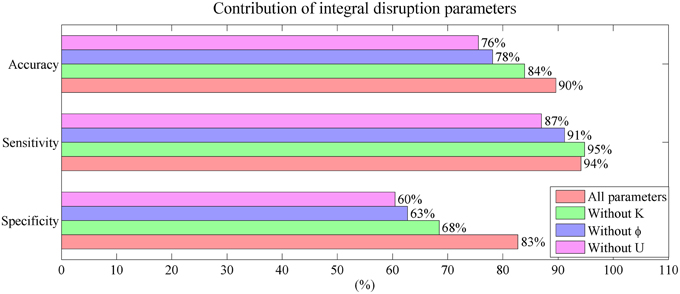
Figure 8. Mini network integral disruption parameters' contribution to the performance in classification.
Contribution of Biomarkers to Mini Network Disruption
The biomarker contribution to the mini network disruption is given in the Figure 9. For the single marker, P-tau is the major contributor to the mini network in the disease progression in both AD and MCI. However, effects of other two markers Aβ and tau on aggravating mini network disruption cannot be neglected at the end stage (at 48 month). The joint contribution of P-tau and Aβ may play a more important role in the deterioration of the disease.
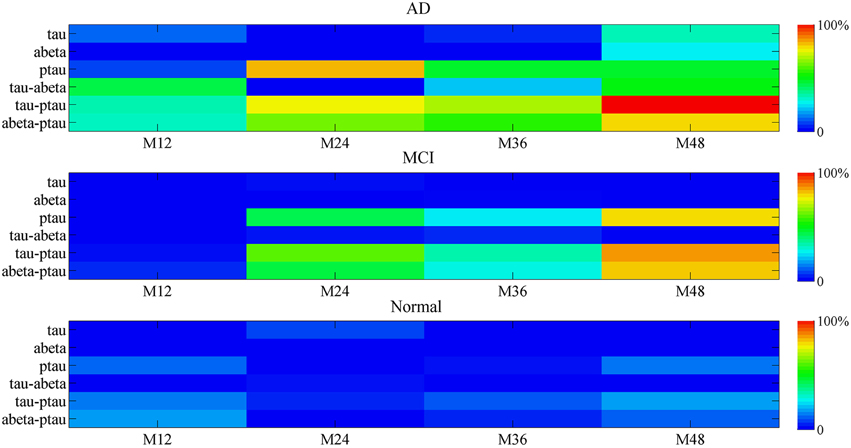
Figure 9. The percentage contribution to mini network disruption of the markers. Color-coded scale is used to present the percentage contribution to mini network disruption of the markers in this plot. The joint contribution of tau and P-tau as well as P-tau and Aβ both are potential vital factors of disease.
Discussion
In this study, we propose a disease progression model termed as mini network balance model. The mini network balance model evaluates the disease progression in three ways. Firstly, the mini network balance map describes mini network imbalance visually. Secondly, the robustness of mini network is measured by mini network disruption probability which is a proxy for the disease progression. Thirdly, the integral variation of mini network is evaluated by the mini network disruption parameters U, K, and φ. The variation of mini network is usually complex. These three parameters decompose the complicated variation into simple variation. Firstly, parameter K is response to the consistency variation of biomarkers in mini network. Secondly, parameter φ represents the inconsistency variation of biomarkers in mini network. Parameter U is response to the total variation. With value of mini network integral parameters greater, the disease risk gets higher. The clinical relevance of mini network integral disruption parameters is that they can help enhance the accuracy and specificity of AD and MCI diagnosis. Especially, parameter U has the greatest contribution to the accuracy and specificity of the classification.
Compared to several previous researches based on CSF markers list in Table 4, the mini network balance model achieves relatively high performance on the classification of AD vs. normal and MCI vs. normal. Furthermore, the comparison to researches based on imaging markers shows that CSF markers and imaging markers may play similar roles in classification of AD vs. normal. Because, AD may cause atrophy in multiple region in brain and CSF markers reflect these change (Reiman and Jagust, 2012; Rosenmann, 2012). However, these two different types may play different roles in classification of MCI vs. normal. On one hand, imaging methods are often recommended to help rule out potentially reversible brain abnormalities like tumors or subdural hematomas in patients with MCI (Reiman and Jagust, 2012). On the other hand, CSF markers have better accuracy and specificity in classification of MCI vs. normal and they can be employed to identify the prodromal AD (Blennow and Zetterberg, 2015).
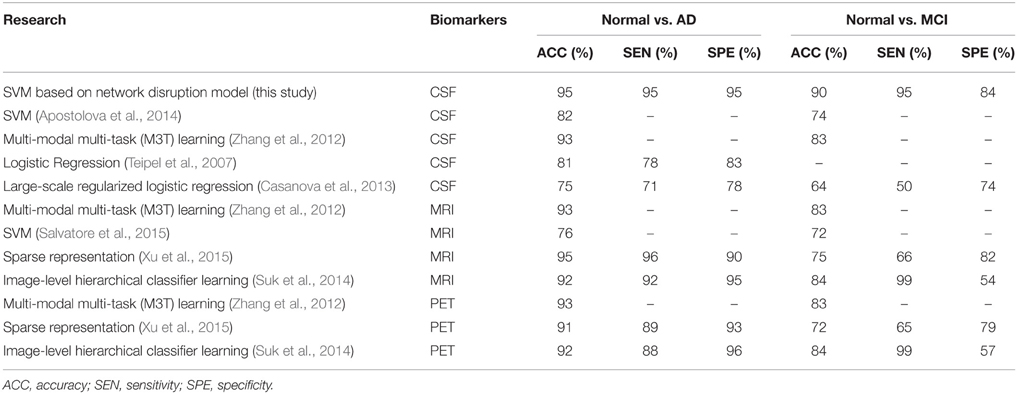
Table 4. Comparison to previous researches.
The amyloid cascade hypothesis has been widely accepted as AD etiology. However, our model shows that Aβ accumulation may not be the sole factor in AD etiology. Joint contribution of P-tau and Aβ may be another potential major contributor to the AD progression. Consistent with Prior studies, Aβ toxicity is P-tau dependent (Kayed, 2010; Desikan et al., 2012). In other word, Aβ in the absence of P-tau is not necessarily associated with loss of cognitive function. Previous researches have proposed a possible mechanism for the interaction of P-tau and Aβ. On one hand, P-tau can increase the activity of AChE which can elevate the level of PS-1 and then accelerate the Aβ deposition (García-Ayllón et al., 2011; Silveyra et al., 2012). On the other hand, Aβ can activate tau hyperphosphorylation pathways (García-Ayllón et al., 2011). The crosstalk between Aβ and P-tau forms a vicious cycle in which they elevate each other and trigger cognitive decline.
Furthermore, more and more evidences in clinical trials suggest the multifactorial nature of AD. For example, Anti-bodies bapineuzumab and solanezumab targeted at Aβ have failed to meet their primary endpoints in the high-profile phase 3 clinical trials (Castello et al., 2014). Doody et al. attribute the failure to administering the therapy at late stages and propose that it should be instituted in early stages (Doody et al., 2014). However, the proposed model suggests that even at early stage the therapies targeted at Aβ only may have limited effect on AD. The presented results suggest that P-tau may also play a vital role in AD progression. Several prior studies have proved that immunotherapies targeted at P-tau can reduce cognitive impairment in animal model (Boutajangout et al., 2010; Kayed, 2010; Lim et al., 2013). In addition, our results suggested that single marker might play a limited role in disease progression and joint contribution of P-tau and Aβ might be the potential vital factors in the disease progression. Therefore, the single-target immunotherapies may have limited effects on AD. According to our results, combination therapy of reducing both P-tau and Aβ may be an effective strategy for AD treatment.
Conclusion
This paper provides a novel method for modeling the complex disease progression. The mini network balance model has good performance on evaluating the AD progression which is beneficial on AD early diagnosis and facilitating therapeutic strategies.
Author Contributions
HL, CW, HH, and XL developed the model. HL and CW do the computational work. HL wrote the manuscript.
Conflict of Interest Statement
The authors declare that the research was conducted in the absence of any commercial or financial relationships that could be construed as a potential conflict of interest.
Acknowledgments
This study was supported by the National Natural Science Foundation of the People's Republic of China (No. 81273588 and No. 81473274). Data collection and sharing for this project was funded by the Alzheimer's Disease Neuroimaging Initiative (ADNI) (National Institutes of Health Grant U01 AG024904) and DOD ADNI (Department of Defense award number W81XWH-12-2-0012). ADNI is funded by the National Institute on Aging, the National Institute of Biomedical Imaging and Bioengineering, and through generous contributions from the following: Alzheimer's Association; Alzheimer's Drug Discovery Foundation; Araclon Biotech; BioClinica, Inc.; Biogen Idec Inc.; Bristol-Myers Squibb Company; Eisai Inc.; Elan Pharmaceuticals, Inc.; Eli Lilly and Company; EuroImmun; F. Hoffmann-La Roche Ltd and its affiliated company Genentech, Inc.; Fujirebio; GE Healthcare; IXICO Ltd.; Janssen Alzheimer Immunotherapy Research & Development, LLC.; Johnson & Johnson Pharmaceutical Research & Development LLC.; Medpace, Inc.; Merck & Co., Inc.; Meso Scale Diagnostics, LLC.; NeuroRx Research; Neurotrack Technologies; Novartis Pharmaceuticals Corporation; Pfizer Inc.; Piramal Imaging; Servier; Synarc Inc.; and Takeda Pharmaceutical Company. The Canadian Institutes of Rev December 5, 2013 Health Research is providing funds to support ADNI clinical sites in Canada. Private sector contributions are facilitated by the Foundation for the National Institutes of Health (www.fnih.org). The grantee organization is the Northern California Institute for Research and Education, and the study is coordinated by the Alzheimer's Disease Cooperative Study at the University of California, San Diego. ADNI data are disseminated by the Laboratory for Neuro Imaging at the University of Southern California.
Supplementary Material
The Supplementary Material for this article can be found online at: http://journal.frontiersin.org/article/10.3389/fnins.2015.00523
Footnotes
† ^Data used in preparation of this article were obtained from the Alzheimer's Disease Neuroimaging Initiative (ADNI) database (adni.loni.usc.edu). As such the investigators within the ADNI contributed to the design implementation of ADNI and/or provided data but did not participate in analysis or writing of this report. A complete listing of ADNI investigators can be found at: http://adni.loni.usc.edu/wp-content/uploads/how_to_apply/ADNI_Acknowledgement_List.pdf
References
Apostolova, L. G., Hwang, K. S., Kohannim, O., Avila, D., Elashoff, D., Jack, C. R. Jr., et al. (2014). ApoE4 effects on automated diagnostic classifiers for mild cognitive impairment and Alzheimer's disease. Neuroimage Clin. 4, 461–472. doi: 10.1016/j.nicl.2013.12.012
Bezprozvanny, I., and Mattson, M. P. (2008). Neuronal calcium mishandling and the pathogenesis of Alzheimer's disease. Trends Neurosci. 31, 454–463. doi: 10.1016/j.tins.2008.06.005
Blennow, K., and Hampel, H. (2003). CSF markers for incipient Alzheimer's disease. Lancet Neurol. 2, 605–613. doi: 10.1016/S1474-4422(03)00530-1
Blennow, K., and Zetterberg, H. (2015). The past and the future of Alzheimer's disease CSF biomarkers-a journey toward validated biochemical tests covering the whole spectrum of molecular events. Front. Neurosci. 9:345. doi: 10.3389/fnins.2015.00345
Boutajangout, A., Quartermain, D., and Sigurdsson, E. M. (2010). Immunotherapy targeting pathological tau prevents cognitive decline in a new tangle mouse model. J. Neurosci. 30, 16559–16566. doi: 10.1523/JNEUROSCI.4363-10.2010
Brys, M., Glodzik, L., Mosconi, L., Switalski, R., De Santi, S., Pirraglia, E., et al. (2009). Magnetic resonance imaging improves cerebrospinal fluid biomarkers in the early detection of Alzheimer's disease. J. Alzheimers Dis. 16, 351–362. doi: 10.3233/JAD-2009-0968
Casanova, R., Hsu, F. C., Sink, K. M., Rapp, S. R., Williamson, J. D., Resnick, S. M., et al. (2013). Alzheimer's disease risk assessment using large-scale machine learning methods. PLoS ONE 8:e77949. doi: 10.1371/journal.pone.0077949
Castello, M. A., Jeppson, J. D., and Soriano, S. (2014). Moving beyond anti-amyloid therapy for the prevention and treatment of Alzheimer's disease. BMC Neurol. 14:169. doi: 10.1186/s12883-014-0169-0
Desikan, R. S., McEvoy, L. K., Thompson, W. K., Holland, D., Brewer, J. B., Aisen, P. S., et al. (2012). Amyloid-beta–associated clinical decline occurs only in the presence of elevated P-tau. Arch. Neurol. 69, 709–713. doi: 10.1001/archneurol.2011.3354
Doody, R. S., Thomas, R. G., Farlow, M., Iwatsubo, T., Vellas, B., Joffe, S., et al. (2014). Phase 3 trials of solanezumab for mild-to-moderate Alzheimer's disease. N. Engl. J. Med. 370, 311–321. doi: 10.1056/NEJMoa1312889
Dubois, B., Feldman, H. H., Jacova, C., DeKosky, S. T., Barberger-Gateau, P., Cummings, J., et al. (2007). Research criteria for the diagnosis of Alzheimer's disease: revising the NINCDS–ADRDA criteria. Lancet Neurol. 6, 734–746. doi: 10.1016/S1474-4422(07)70178-3
Ewers, M., Walshc, C., Trojanowskid, J. Q., Shawd, L. M., Petersene, R. C., Jack, C. R. Jr., et al. (2012). Prediction of conversion from mild cognitive impairment to Alzheimer's disease dementia based upon biomarkers and neuropsychological test performance. Neurobiol. Aging 33, 1203–1214. doi: 10.1016/j.neurobiolaging.2010.10.019
Farah, B. A. (2014). Effects of caprylic triglyceride on cognitive performance and cerebral glucose metabolism in mild Alzheimer's disease: a single-case observation. Front. Aging Neurosci. 6:133. doi: 10.3389/fnagi.2014.00133
García-Ayllón, M. S., Small, D. H., Avila, J., and Sáez-Valero, J. (2011). Revisiting the role of acetylcholinesterase in Alzheimer's disease: cross-talk with P-tau and beta-Amyloid. Front. Mol. Neurosci. 4:22. doi: 10.3389/fnmol.2011.00022
Grammas, P., and Martinez, J. M. (2014). Targeting thrombin: an inflammatory neurotoxin in Alzheimer's disease. J. Alzheimers Dis. 42(Suppl. 4), S537–S544. doi: 10.3233/JAD-141557
Hanger, D. P., Lau, D. H., Phillips, E. C., Bondulich, M. K., Guo, T., Woodward, B. W., et al. (2014). Intracellular and extracellular roles for tau in neurodegenerative disease. J. Alzheimers Dis. 40(Suppl. 1), S37–S45. doi: 10.3233/JAD-132054
He, H., Wang, S., Li, X., Wang, H., Zhang, W., Yuan, L., et al. (2013). A novel metabolic balance model for describing the metabolic disruption of and interactions between cardiovascular-related markers during acute myocardial infarction. Metab. Clin. Exp. 62, 1357–1366. doi: 10.1016/j.metabol.2013.04.011
Herrup, K. (2010). Reimagining Alzheimer's disease–an age-based hypothesis. J. Neurosci. 30, 16755–16762. doi: 10.1523/JNEUROSCI.4521-10.2010
Kayed, R. (2010). Anti-tau oligomers passive vaccination for the treatment of Alzheimer disease. Hum. Vaccin. 6, 931–935. doi: 10.4161/hv.6.11.12689
Kimura, T., Ishiguro, K., and Hisanaga, S.-I. (2014). Physiological and pathological phosphorylation of tau by Cdk5. Front. Mol. Neurosci. 7:65. doi: 10.3389/fnmol.2014.00065
Lim, Y. Y., Maruff, P., Pietrzak, R. H., Ames, D., Ellis, K. A., Harrington, K., et al. (2013). Effect of amyloid on memory and non-memory decline from preclinical to clinical Alzheimer's disease. Brain 137, 221–231. doi: 10.1093/brain/awt286
Maslov, S., and Ispolatov, I. (2007). Propagation of large concentration changes in reversible protein-binding networks. Proc. Natl. Acad. Sci. U.S.A. 104, 13655–13660. doi: 10.1073/pnas.0702905104
Nijhout, H. F., and Reed, M. C. (2014). Homeostasis and dynamic stability of the phenotype link robustness and plasticity. Integr. Comp. Biol. 54, 264–275. doi: 10.1093/icb/icu010
Powell, M. R., Smith, G. E., Knopman, D. S., Parisi, J. E., Boeve, B. F., Petersen, R. C., et al. (2006). Cognitive measures predict pathologic Alzheimer disease. Arch. Neurol. 63, 865–868. doi: 10.1001/archneur.63.6.865
Reiman, E. M., and Jagust, W. J. (2012). Brain imaging in the study of Alzheimer's disease. Neuroimage 61, 505–516. doi: 10.1016/j.neuroimage.2011.11.075
Rosenmann, H. (2012). CSF biomarkers for amyloid and tau pathology in Alzheimer's disease. J. Mol. Neurosci. 47, 1–14. doi: 10.1007/s12031-011-9665-5
Salem, A. M., Ahmed, H. H., Atta, H. M., Ghazy, M. A., and Aglan, H. A. (2014). Potential of bone marrow mesenchymal stem cells in management of Alzheimer's disease in female rats. Cell Biol. Int. 38, 1367–1383. doi: 10.1002/cbin.10331
Salminen, A., Ojala, J., Kaarniranta, K., Hiltunen, M., and Soininen, H. (2011). Hsp90 regulates tau pathology through co-chaperone complexes in Alzheimer's disease. Prog. Neurobiol. 93, 99–110. doi: 10.1016/j.pneurobio.2010.10.006
Salvatore, C., Cerasa, A., Battista, P., Gilardi, M. C., Quattrone, A., Castiglioni, I., et al. (2015). Magnetic resonance imaging biomarkers for the early diagnosis of Alzheimer's disease: a machine learning approach. Front. Neurosci. 9:307. doi: 10.3389/fnins.2015.00307
Shaw, L. M., Vanderstichele, H., Knapik-Czajka, M., Clark, C. M., Aisen, P. S., Petersen, R. C., et al. (2009). Cerebrospinal fluid biomarker signature in Alzheimer's disease neuroimaging initiative subjects. Ann. Neurol. 65, 403–413. doi: 10.1002/ana.21610
Shen, Y., He, P., Zhong, Z., McAllister, C., and Lindholm, K. (2006). Distinct destructive signal pathways of neuronal death in Alzheimer's disease. Trends Mol. Med. 12, 574–579. doi: 10.1016/j.molmed.2006.10.002
Silveyra, M. X., García-Ayllón, M. S., Serra-Basante, C., Mazzoni, V., García-Gutierrez, M. S., Manzanares, J., et al. (2012). Changes in acetylcholinesterase expression are associated with altered presenilin-1 levels. Neurobiol Aging 33, 627, e627–e637. doi: 10.1016/j.neurobiolaging.2011.04.006
Small, D. H. (2008). Network dysfunction in Alzheimer's disease: does synaptic scaling drive disease progression? Trends Mol. Med. 14, 103–108. doi: 10.1016/j.molmed.2007.12.006
Suk, H. I., Lee, S. W., Shen, D., and Alzheimer's Disease Neuroimaging Initiative. (2014). Hierarchical feature representation and multimodal fusion with deep learning for AD/MCI diagnosis. Neuroimage 101, 569–582. doi: 10.1016/j.neuroimage.2014.06.077
Teipel, S. J., Born, C., Ewers, M., Bokde, A. L., Reiser, M. F., Möller, H. J., et al. (2007). Multivariate deformation-based analysis of brain atrophy to predict Alzheimer's disease in mild cognitive impairment. Neuroimage 38, 13–24. doi: 10.1016/j.neuroimage.2007.07.008
Xu, L., Wu, X., Chen, K., and Yao, L. (2015). Multi-modality sparse representation-based classification for Alzheimer's disease and mild cognitive impairment. Comput. Methods Programs Biomed. 122, 182–190. doi: 10.1016/j.cmpb.2015.08.004
Zamrini, E., De Santi, S., and Tolar, M. (2004). Imaging is superior to cognitive testing for early diagnosis of Alzheimer's disease. Neurobiol. Aging 25, 685–691. doi: 10.1016/j.neurobiolaging.2004.02.009
Zhang, D., Shen, D., and Alzheimer's Disease Neuroimaging Initiative. (2012). Multi-modal multi-task learning for joint prediction of multiple regression and classification variables in Alzheimer's disease. Neuroimage 59, 895–907. doi: 10.1016/j.neuroimage.2011.09.069
Zhao, J., Geng, C., Tao, L., Zhang, D., Jiang, Y., Tang, K., et al. (2010). Reconstruction and analysis of human liver-specific metabolic network based on CNHLPP data. J. Proteome Res. 9, 1648–1658. doi: 10.1021/pr9006188
Keywords: Alzheimer's disease, disease progression, crosstalk network, diagnosis, multi-marker
Citation: Liu H, Wei C, He H, Liu X for the Alzheimer's Disease Neuroimaging Initiative (2016) Evaluating Alzheimer's Disease Progression by Modeling Crosstalk Network Disruption. Front. Neurosci. 9:523. doi: 10.3389/fnins.2015.00523
Received: 07 November 2015; Accepted: 27 December 2015;
Published: 19 January 2016.
Edited by:
Olcay Akman, Illinois State University, USAReviewed by:
Ying Xu, The State University of New York at Buffalo, USAPengyue Zhang, Indiana University, USA
Copyright © 2016 Liu, Wei, He, Liu for the Alzheimer's Disease Neuroimaging Initiative. This is an open-access article distributed under the terms of the Creative Commons Attribution License (CC BY). The use, distribution or reproduction in other forums is permitted, provided the original author(s) or licensor are credited and that the original publication in this journal is cited, in accordance with accepted academic practice. No use, distribution or reproduction is permitted which does not comply with these terms.
*Correspondence: Hua He, huahe827@163.com;
Xiaoquan Liu, lxq@cpu.edu.cn