 Michael P. Endsley1
 Georgette Moyle-Heyrman1
 Subbulakshmi Karthikeyan1
 Daniel D. Lantvit1David A. Davis1
 Jian-Jun Wei2
 Joanna E. Burdette1*
- 1Department of Medicinal Chemistry and Pharmacognosy, College of Pharmacy, University of Illinois at Chicago, Chicago, IL, USA
- 2Department of Pathology, Northwestern University, Chicago, IL, USA
High-grade serous carcinoma (HGSC) is the most lethal ovarian cancer histotype. The fallopian tube secretory epithelial cells (FTSECs) are a proposed progenitor cell type. Genetically altered FTSECs form tumors in mice; however, a spontaneous HGSC model has not been described. Apart from a subpopulation of genetically predisposed women, most women develop ovarian cancer spontaneously, which is associated with aging and lifetime ovulations. A murine oviductal cell line (MOELOW) was developed and continuously passaged in culture to mimic cellular aging (MOEHIGH). The MOEHIGH cellular model exhibited a loss of acetylated tubulin consistent with an outgrowth of secretory epithelial cells in culture. MOEHIGH cells proliferated significantly faster than MOELOW, and the MOEHIGH cells produced more 2D foci and 3D soft agar colonies as compared to MOELOW MOEHIGH were xenografted into athymic female nude mice both in the subcutaneous and the intraperitoneal compartments. Only the subcutaneous grafts formed tumors that were negative for cytokeratin, but positive for oviductal markers, such as oviductal glycoprotein 1 and Pax8. These tumors were considered to be poorly differentiated carcinoma. The differential molecular profiles between MOEHIGH and MOELOW were determined using RNA-Seq and confirmed by protein expression to uncover pathways important in transformation, like the p53 pathway, the FOXM1 pathway, WNT signaling, and splicing. MOEHIGH had enhanced protein expression of c-myc, Cyclin E, p53, and FOXM1 with reduced expression of p21. MOEHIGH were also less sensitive to cisplatin and DMBA, which induce lesions typically repaired by base-excision repair. A model of spontaneous tumorogenesis was generated starting with normal oviductal cells. Their transition to cancer involved alterations in pathways associated with high-grade serous cancer in humans.
Introduction
Epithelial ovarian cancer (EOC) has a disproportionately high-mortality rate in comparison to other gynecologic malignancies, ranking first overall (1). The American Cancer Society estimates that 14,180 women will succumb to this disease annually and 21,290 will be newly diagnosed in 2015 (2). EOC can be divided into five common histotypes including mucinous, endometrioid, clear cell, low-grade serous, and high-grade serous carcinoma (HGSC) (3). HGSC is the most prominent EOC histotype and accounts for nearly 75% of all EOC-related mortality. Moreover, the 5-year survival rate from 2003 to 2009 was 44%, a mere 8% improvement from the mortality rates observed 30 years earlier (1). The underlying molecular events contributing to initiation and progression are still lacking, leading to patients rarely being diagnosed in stage I (4). Aspects contributing to this high-mortality rate are the debatable cellular origin of the disease and the paucity of models representing spontaneous tumor formation (5).
The source of EOC is currently being investigated with both the ovarian surface epithelia (OSE) and the fallopian tube secretory epithelial cell (FTSEC) serving as possible progenitor populations (6). The ovarian surface was considered the source of EOC for decades with recent evidence pointing to the fallopian tube or both. For example, women undergoing prophylactic salpingo-oophorectomies due to germ-line mutations in either BRCA1 or BRCA2 provided pathologists with tissue specimens that contained neoplastic lesions in the fimbriae of the fallopian tubes (7). Fallopian tube lesions occurred in women with HGSC and with serous tubal epithelial carcinomas (STICs), leading to the hypothesis that the fallopian tube secretory epithelium is a potential source of HGSC (8). Recent evidence specifically demonstrates that the secretory epithelial cells of the fallopian tube (or oviduct in mice) are the source of tubal-derived HGSC (9–11).
There are many well-established cellular and animal models used to study FTSEC or oviductal epithelial cell transformation by using SV40, which functionally inhibits both the Rb and p53 tumor-suppressor pathways (12–15). The concern with using SV40 is that blocking these two important tumor-suppressor pathways as well as overexpressing oncoproteins, such as c-Myc or H-Ras, will induce tumorigenesis in many, if not all cell types and that mutation and loss of p53 function are not equivalent (16). Mutation in p53 is the defining event that is common to 96–100% of HGSC (17). Genetically modified models have been generated from both the OSE and FTSECs (18, 19) generally targeting the specific genes associated with human HGSC (18, 19). This targeted approach to tumorigenesis has provided important evidence that both OSE and oviductal cells (murine equivalent of fallopian tube) can form tumors, but lacks information regarding the mechanisms for these changes to occur. Furthermore, in human disease, it is unclear whether these commonly mutated genes are normally involved in disease initiation and/or progression.
The development of spontaneous models of HGSC would assist in understanding the origins and progression of this disease. For decades, the OSE was the primary cell type thought to give rise to HGSC with numerous cellular and transgenic animal models supporting this theory (20–24). For example, both rat and murine OSE cells isolated and passaged in culture have provided evidence that the OSE can give rise to tumors that exhibit many phenotypic and genetic similarities to the human disease (25–28). Another critical model of spontaneous ovarian cancer is the laying hen, which mainly develops endometrioid EOC, instead of HGSC, and has a unique oviduct that primarily functions as a shell gland (29–31). Therefore, this study focused on the development of a new spontaneous model of ovarian cancer derived from outbred CD1 oviducts. Similar to OSE models, continuous passaging produced transformed cells that demonstrated unique changes in transcription consistent with the human disease. This model provides a unique tool for understanding aspects of tumorigenesis from oviductal cells. This model may also be used to understand how cells develop resistance to chemotherapy.
Materials and Methods
Animals
Female CD1 mice were purchased from Harlan (Indianapolis, IN, USA) and NCr nu/nu athymic (nude) female mice from Taconic (Hudson, NY, USA). Animals were treated in direct compliance with the National Institutes of Health (NIH) Guide for the Care and Use of Laboratory Animals, using protocols approved by the Animal Care Committee at the University of Illinois at Chicago (UIC). Mice were housed in a temperature and light controlled environment (12 h light, 12 h dark) and provided food and water ad libitum. Nude mice were euthanized when tumors developed and based on loss of wellness and humane endpoints. All mice were euthanized by CO2 asphyxiation followed by cervical dislocation.
Isolation of Murine Oviductal Epithelial Cells
Primary murine oviductal epithelial (MOE) cells (also called murine tubal epithelial cells or MTEC) were pooled from multiple oviducts to establish one cell line from 8-week-old female CD1 mice, as previously described (32). To ensure purity, oviducts were carefully excised, and using a dissecting scope, removed the ovaries, bursa, uterus, and fat pads. MOE cells were maintained in complete medium containing α-MEM modified Eagle’s medium (CellGro, Manassas, VA, USA) supplemented with ribonucleosides, deoxynucleosides, and l-glutamine and supplemented with 10% fetal bovine serum, 2 mM l-glutamine (Life Technologies, Grand Island, NY, USA), 2 μg/ml epithelial growth factor, 5 μg/ml insulin, 5 μg/ml transferrin, 5 ng/ml sodium selenite (Roche; Indianapolis, IN, USA), 1 mg/ml gentamycin (CellGro; Manassas, VA, USA), and 18.2 μg/ml β-estradiol (Sigma Aldrich; St Louis, MO, USA). MOE cells were maintained in a humidified atmosphere containing 5% CO2 at 37°C.
Once the primary isolated MOE cells became established in culture, the MOELOW cells (passages 8–25) were continuously passaged to generate the experimentally aged, MOEHIGH cells (passages 85–120). The MOE cells were verified to be clean of Mycoplasma spp. and 12 other rodent pathogens after analysis using the IMPACT III Profile test (IDEXX BioResearch, Columbia, MO, USA).
Western Immunoblotting
Murine oviductal epithelial cells were lysed in modified RIPA buffer and protein concentration was determined, as previously described (33). Whole cell lysates in RIPA buffer (30 μg/well) were separated, transferred to nitrocellulose membrane (GE Healthcare Life Sciences, Pittsburgh, PA, USA), blocked, and incubated with primary antibody shaking at 4°C overnight. Membranes were incubated with HRP-conjugated secondary antibody and exposed to SuperSignal West Femto substrate (Thermo Scientific, Waltham, MA, USA). All blots were photographed using the FluorChem E documentation system (Protein Simple; Santa Clara, CA, USA). Densitometry is calculated from three blots.
Primary antibodies include the following: phosphorylated-Rb1 (Ser780), c-myc, p53, E-cadherin, and α-tubulin were all obtained from Cell Signaling Technology, Inc. (Danvers, MA, USA); cyclin E1, N-cadherin, and OVGP1 were from Abcam (Cambridge, MA, USA); p21, p16INK4A, and FoxM1 from Santa Cruz Biotechnologies (Santa Cruz, CA, USA); and PAX8 from Proteintech (Chicago, IL, USA).
MOE Cell RNA Preparation and Sequencing Using Next-Generation RNA-Sequencing Technology
MOELOW (passages 8, 9, and 10) and MOEHIGH (passages 90, 103, and 113) cells were plated and at 75% confluency, they were washed with PBS, lysed, and total RNA extracted in Trizol reagent (Life Technologies), according to manufacturer’s protocol. To ensure that there was no residual genomic DNA contamination, samples were treated with RNase-free DNase I and RNA was further purified using RNeasy Mini cleanup (Qiagen Inc., Valencia, CA, USA). The concentration of the total RNA was determined using the NanoVue Plus spectrophotometer provided by the UIC Resource Research Center Core (GE Healthcare Bio-Sciences, Piscataway, NJ, USA) and RNA purity as determined by the RNA integrity number (RIN) was verified using TapeStation 2200 (Agilent Technologies, Palo Alto, CA, USA).
Each total RNA sample had ribosomal RNA removed using TruSeq Stranded Total RNA with Ribo-Zero (Illumina, San Diego, CA, USA). Strand-specific libraries were constructed and quantitated using Qubit, and cDNAs verified by qPCR. The resulting six libraries were pooled and sequenced using TruSeq SBS sequencing kit 3 for 101 cycles on a HiSeq2000 (Illumina) and processed with Casava (version 1.8.2.), according to the manufacturer’s protocol.
RNA-Seq Transcriptome Analysis
The quality of DNA reads (fastq format) was evaluated using FastQC. The data were analyzed following the previously described procedure (34). Briefly, the reads were aligned to the Mus musculus genome (mm10) using TopHat, version 2.0.8b1. Aligned reads were used to determine the expression of known mmu10 gene annotations from the University of California-Santa Cruz website using Cufflinks version 2.1.12. The individual transcript files generated by Cufflinks were merged into a single gene annotation file and used to determine the differential expression analysis feature in Cuffdiff.
Differential expression was determined to be statistically significant by Cuffdiff using a false discovery rate (FDR)-adjusted p-value, where significance was set to p ≤ 0.05 (35). Differential expression analysis was processed using R-package (cummeRbund) and used to compare the MOELOW and MOEHIGH cells. The cummeRbund results were used to create a dendrogram comparing the differences between all MOELOW and MOEHIGH cell passages. Furthermore, pathway analysis was performed on transcript lists from both cell lines using GeneCoDis to identify the KEGG and Panther pathways that are significantly different between MOELOW and MOEHIGH cell lines (36–38). RNA-sequencing technology (RNA-seq) and data analysis were supported by the Northwestern University Next-Generation Sequencing Core Facility and Dr. Matthew Schipma.
Quantitative PCR Analysis
Total RNA (1.0 μg) was reverse transcribed using the iScript cDNA synthesis kit (BioRad), according to manufacturer’s instructions. cDNA was amplified and analyzed using ViiA7 iCycler real-time SYBR PCR detection system (Life Technologies). Samples are normalized relative to the internal control Gapdh and MOEHIGH cells were compared to the MOELOW cells (ΔΔCt expressions) of Cdkn1a, Foxm1, Trp53, Ovgp1, and Pax8.
Cell Proliferation
Sulforhodamine B (SRB) assays were used to determine proliferation of MOE cells, as described previously (33). Briefly, MOE cells (1.0 × 10³/well) were incubated for 0, 12, 24, 48, and 72 h. Absorbance was measured at 505 nm using a BioTek Synergy 2 microplate reader (BioTek). All assays were repeated in at least three biological replicates. For experiments using doxorubicin, cisplatin, paclitaxel, and DMBA, cells were treated with eight concentrations in four independent experiments and the data plotted represent the average cell viability for each concentration. The values of LC50 were determined from the averaged data that were fit to the curve using Prism.
Clonogenic Assay
MOELOW and MOEHIGH cells were plated (200 cells/60 mm-dish) and incubated for 6 days. After incubation, cells were washed, fixed with 4% (w/v) paraformaldehyde, and stained with 0.04% (w/v) crystal violet for 30 min at room temperature. Plates were washed with deionized H2O, dry, and photographed using the FluorChem E documentation system (Protein Simple, Santa Clara, CA, USA). Numbers of foci were analyzed using Image J software (NIH) from four biological replicates.
Soft Agar Colony Formation Assay
Murine oviductal epithelial (1.5 × 10⁴) cells were suspended in 0.35% (w:v) agar on top of a 0.5% (w:v) base agar layer (39). Cells were incubated for 14 days with media changed every 3 days. Final colonies were imaged on a Nikon Eclipse TS100 microscope and colonies were counted using Image J software from three biological replicates.
Tumorgenicity in Nude Mice
The procedure of injections was performed, as previously described (13). Briefly, both s.c. (1.0 × 10⁶ cells in Matrigel/animal) and i.p. (1.0 × 10⁷ cells in PBS/animal) injections were done into all mice (n = 5 mice/group). Once palpable, tumor growth was monitored weekly using digital calipers. Animals were sacrificed at humane endpoints and tumors were excised, weighed, and either embedded in paraffin for immunohistochemistry (IHC) or flash frozen in liquid nitrogen for protein and mRNA analysis. Additionally, gross internal anatomy was inspected for any signs of i.p. disease.
Immunohistochemistry
Paraffin-embedded tissues sectioning, H&E staining, and IHC were completed, as described previously (40). Tissue sections were incubated with the following primary antibodies overnight at 4°C: anti-CK8 (1:200; Developmental Studies Hybridoma Bank, Iowa City, IA, USA); anti-Pax8 (1:200; Proteintech, Chicago, IL, USA); anti-Ki67 and anti-OVGP1 (1:100; Abcam, Cambridge, MA, USA). DAB staining was used to detect protein expression in tissue sections. Stained sections were analyzed by a pathologist (Dr. Jian-Jun Wei, Northwestern University). Slides were imaged on a Nikon Eclipse E600 microscope using the 40× objective.
Immunofluorescence
Murine oviductal epithelial (5.0 × 10⁴ cells/well) cells were plated in an eight-well chamber slide and stained for various proteins, as previously described (41). Briefly, cells were fixed in 4% (w/v) PFA, permeabilized with 0.2% (v/v) Triton X-100, blocked with 10% (v/v) goat serum, incubated with primary antibody for 1 h at room temperature. The primary antibodies used were anti-Pax8 (1:200; Proteintech, Chicago, IL, USA); and anti-OVGP1 (1:200; Abcam, Cambridge, MA, USA). Proteins were visualized by incubation with AlexaFluor488 (green) secondary antibodies and slides were mounted using Vectashield Mounting Medium containing DAPI (Vector Laboratories; Burlingame, CA, USA). Slides were imaged on a Nikon Eclipse E600 microscope and captured using Nikon DigitalSight DS-Ri1 camera.
Statistical Methods
Statistical analysis was carried out using GraphPad Prism software (GraphPad Software, La Jolla, CA, USA). All values are expressed as the means of samples ± SEM. Statistical significance was determined by unpaired t-test a p < 0.05 was considered to be statistically significant.
Results
MOEHIGH Demonstrate In Vitro and In Vivo Evidence of Spontaneous Cellular Transformation
In order to derive an oviductal cell line, CD1 mice were utilized as a source of primary cells because they are an outbred strain that might provide a model for human disease. Murine cells were used to compare to existing ovarian surface models, and because they typically can be immortalized on plastic without the use of viral oncoproteins. CD1 cells were confirmed to be of epithelial origin, as previously described (32). The CD1 cells were then continuously cultured to up to 130 passages to generate two cell models, MOELOW (passages 5–25) and MOEHIGH (passages 85–120). Both MOELOW and MOEHIGH expressed oviductal glycoprotein 1 (OVGP1) and PAX8 based on RNA (Figure 1A) and protein expression (Figure 1B; Figure S1 in Supplementary Material) (42, 43). MOEHIGH cells lost acetylated tubulin and expressed Pax8, consistent with other oviductal models cultured on plastic that tend to undergo senescence and lose cilia function that produce an outgrowth of the secretory subtype of epithelium. Recent evidence suggests that most HGSC originate from the FTSECs (44). The outgrowth of secretory cells in fallopian tube fimbria is often described by pathologists as a putative preneoplastic lesion called a SCOUT (11).
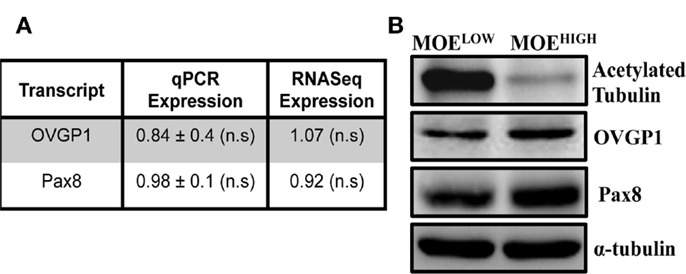
Figure 1. MOEHIGH lose acetylated tubulin upon serial passaging. (A) OVGP-1 and Pax8 expression levels were similar in qPCR and RNA sequencing and not significant (n.s.) between MOEHIGH and MOELOW. (B) Western blotting on MOEHIGH and MOELOW cell lysates probed for acetylated tubulin, OVGP-1, PAX8, and normalized to α-tubulin.
MOEHIGH cells were tested for in vitro aspects of transformation. First, the rate of proliferation of MOEHIGH was compared to MOELOW. MOEHIGH cells proliferated significantly more than MOELOW after 48 and 72 h (Figure 2A). The average doubling time of MOEHIGH cells was 17.3 h as compared to the MOELOW doubling time of 24.1 h. Next, a clonogenic assay was employed to monitor the ability of MOEHIGH cells to form colonies as compared to MOELOW. MOEHIGH cells formed significantly more clonogenic colonies than MOELOW after 6 days (Figure 2B). MOEHIGH demonstrated on average 76 ± 3 colonies or about 38% of the cells plated formed foci as compared to MOELOW, where only 9.8% formed foci. Finally, the cells were grown in soft agar to test whether they exhibited anchorage independent growth. MOEHIGH cells formed a significant number of soft agar colonies (14 ± 1) after 14 days, while MOELOW did not form colonies and persisted as single cells in agar (Figure 2C).
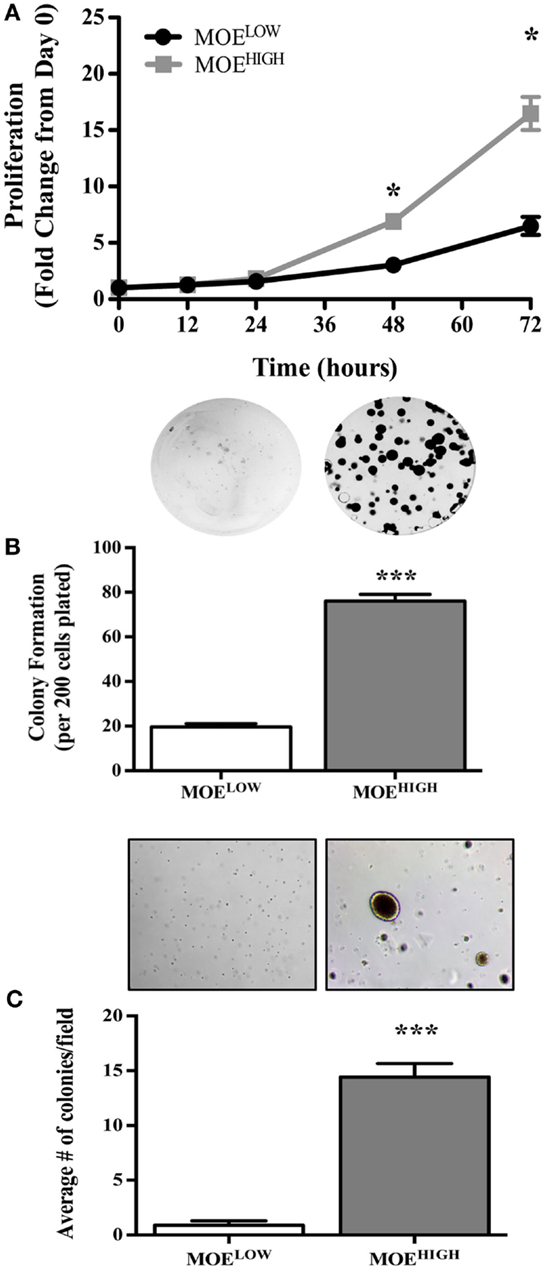
Figure 2. MOEHIGH cells demonstrate in vitro aspects of transformation, such as enhanced proliferation, foci formation, and soft agar colony growth, as compared to MOELOW. (A) Proliferation of MOEHIGH and MOELOW cells was analyzed using SRB assay and data calculated as the fold change from day 0. (B) MOEHIGH and MOELOW cells were tested for 2D colony formation after 6 days using a clonogenic assay. (C) MOEHIGH and MOELOW cells were analyzed for soft agar colony formation after 14 days. *p-value >0.01.
In order to confirm whether the in vitro characteristics of transformation identified in MOEHIGH contributed to tumor formation, female athymic nude mice (n = 5 MOEHIGH and MOELOW) were injected subcutaneously with 1 × 10⁶ cells and intraperitoneally with 1 × 10⁷ cells. All of the mice injected with MOEHIGH cells developed subcutaneous tumors that grew over time and ultimately mice were sacrificed for humane endpoints after an average of 117 ± 9 days (Figure 3A). MOEHIGH cells failed to develop any tumors when injected into the peritoneal space. MOELOW failed to develop tumors in either the s.c. or i.p. sites. Subcutaneous tumors derived from MOEHIGH cells were evaluated by a pathologist based on morphological features from H&E staining as well as using a variety of immunohistochemical stains. Tumors were solid with spindle-like structures and were highly cellular with moderate nuclear atypia and abundant mitosis (Figure 3B). The morphology was sarcoma like with infiltration of the tumor identified in the skeletal muscle. The tumors were highly mesenchymal exhibiting little or no cytokeratin 8 (Figure 3C) positivity or WT1 staining (not shown). OVGP1 and Pax8 are markers of Müllerian origin, and PAX8 is used to classify tumors as the serous histotype. Tumors were OVGP1 positive (Figure 3D), demonstrated some Pax8 positivity, but it was both nuclear and cytoplasmic as well as sporadic (Figure 3E). A high percentage of tumor cells stained with Ki67 indicating increased proliferation (Figure 3F). Tumors did not express stabilized p53 (Figure 3G). Overall, the tumors were considered poorly differentiated spindle cell neoplasia of oviductal origin.
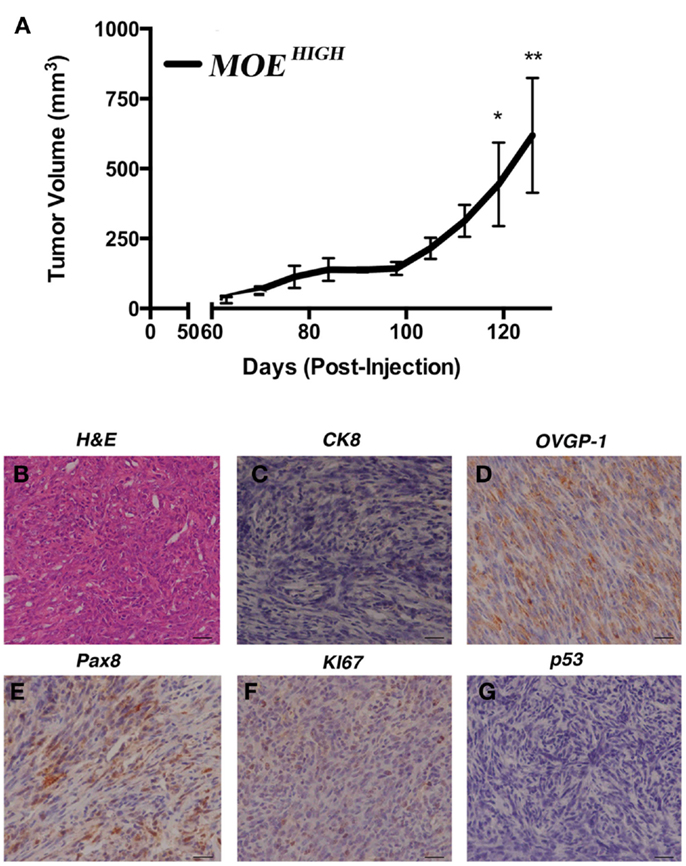
Figure 3. MOEHIGH cells undergo spontaneous transformation and form tumors. (A) Athymic female nude mice were injected subcutaneously and intraperitoneally with MOEHIGH and MOELOW cells. MOEHIGH formed subcutaneous tumors but not intraperitoneal explants. MOELOW cells failed to form any tumors. Tumor volume was measured with calipers. Hematoxylin and Eosin staining (B) and immunohistochemistry (C–G) performed on s.c. MOEHIGH tumors. Tumors were malignant, undifferentiated, and mesenchymal and were negative for CK8 (C). Tumors were of oviductal origin staining positive for OVGP1 (D) and Pax8 (E). Tumors were highly proliferative based on positive Ki67 (F) and did not demonstrate stabilized p53 (G). Scale bars = 100 μm.
Transcriptome of MOEHIGH Reveals Changes Responsible for Transformation
In order to reveal some of the pathways that might contribute to tumor formation of MOEHIGH cells, RNA sequencing was performed on three different passages of MOELOW (8, 9, 10) as compared to MOEHIGH (90, 103, 113). Samples were barcoded and sequenced using Illumina HiSeq2500 sequencing. Samples clustered based on passage number using a dendrogram analysis (Figure S2 in Supplementary Material). The top 20 most significantly up- and down-regulated transcripts are shown in Table 1. Pathway analysis revealed that the most highly upregulated biological processes involved the splicesome, RNA transport, the cell cycle, and DNA replication (Figure 4). Biological processes that were repressed included processing in the endoplasmic reticulum, focal adhesion, pathways in cancer, and the lysosome.
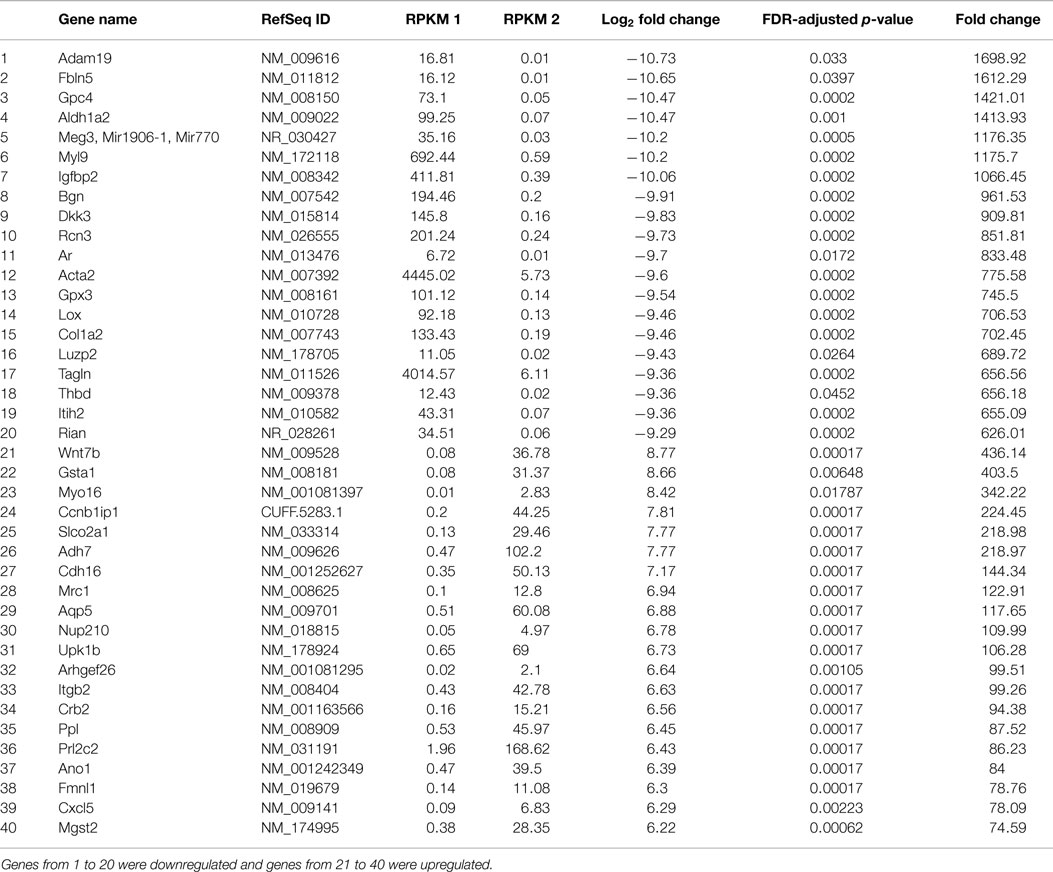
Table 1. Table showing the list of genes that were significantly regulated in MOEHIGH cells from RNA sequencing analysis.
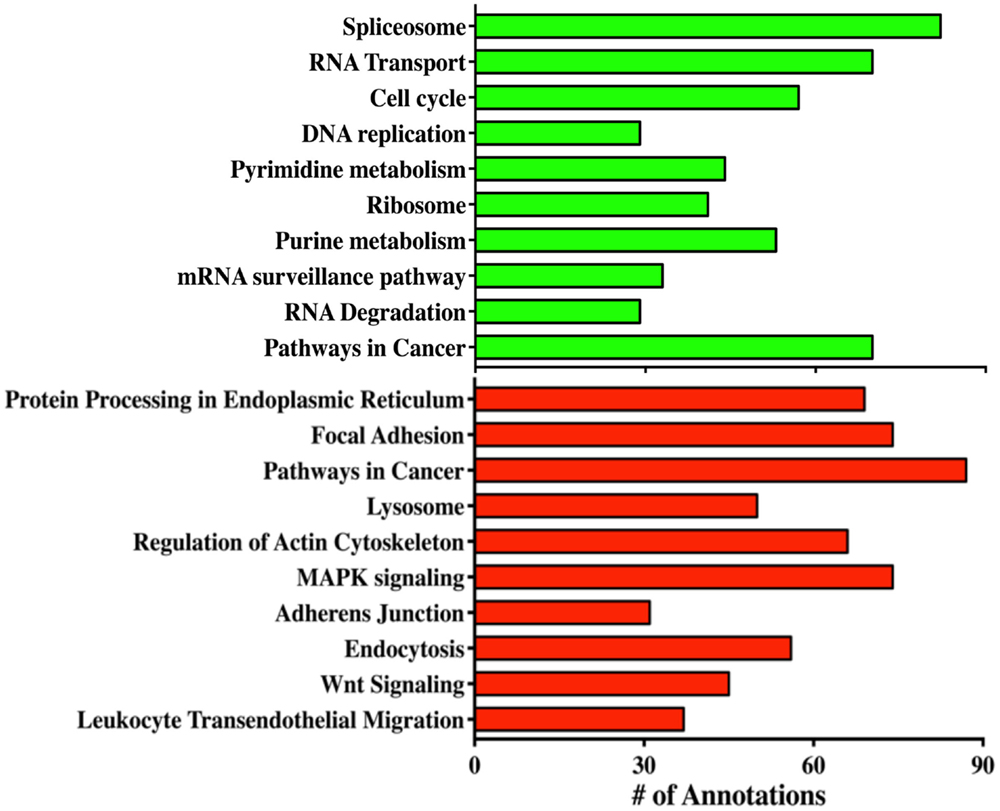
Figure 4. RNA sequencing reveals biological processes altered in MOEHIGH cells. Gene ontology analysis of the pathways that were altered in MOEHIGH cells compared to MOELOW. Green bars represent pathways that were upregulated and red bars indicate the downregulated pathways.
MOEHIGH Cells Harbor Splice Variant of p53 with Differential Action on Target Genes
The cancer genome atlas helped to define critical pathways altered in high-grade serous tumors (17). In order to compare MOEHIGH to human tumor samples, pathways implicated in human disease were interrogated. RNA sequencing revealed that p53 in MOELOW and MOEHIGH cells was not mutated; however, MOEHIGH cells had a significant upregulation of a splice variant of p53 that has the last 26 amino acids eliminated and has 16 unique residues replaced (SLQPRAFQALIKEESPNC). This splice variant due to the elimination of 26 amino acids has 6 phosphorylation site removed that serve as regulatory domains important for MDM2-mediated ubiquitination (45). As a result, western blots revealed a more intense band for p53. Several p53 target genes of p53 were investigated from the RNA-seq data to help characterize the transcriptional action of the p53 alternative splice variant (Table 2). FoxM1 is typically repressed by wild-type (WT) p53 and amplified when p53 has a DNA-binding mutation (46, 47). Cdkn1a (or p21) is also positively regulated by p53 and mutation or loss of p53 results in a lack of induction (33, 48). Thbs1 is enhanced in the presence of WT p53 and p53 null cells compared to those harboring a missense mutation (49). In MOEHIGH, FoxM1 RNA was enhanced by 1.59-fold in the RNA-seq data, p21 was repressed by 1.98-fold, and Thbs1 was repressed 17-fold. Therefore, RNA expression for FoxM1, p21, and Thbs1 indicated that these genes were regulated by the p53AS in a similar manner to missense or gain-of-function mutations in p53. WT p53 induces MDM2 expression, while mutation typically results in poor or repressed activation of the MDM2 promoter, but no significant change was found at the RNA level of MDM2 (50). IGFBP3 has a possible 11 p53-responsive elements in the promoter and also in an intronic sequence that is frequently methylated, which can block p53 induction of this target (51). The MOEHIGH that express a splice variant of p53 also expressed a 4.86 induction of the RNA (IGFBP3) transcript compared to MOELOW. These results suggest that the p53AS has mixed functions acting more like WT p53 on some transcriptional targets, such as IGFBP3, and more like missense p53 on FoxM1, p21, and Thbs1 gene regulation.
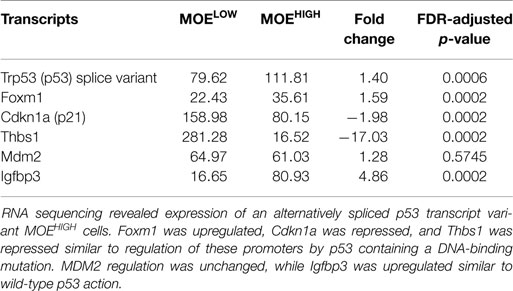
Table 2. p53 splice variant alters the mRNA expression of p53 target genes.
Key Pathways Altered in Human HGSC are also Modified in MOEHIGH
The TCGA highlighted several players that were altered in a large percentage of human tissue samples. These targets were investigated using western blot in MOEHIGH compared to MOELOW (Figure 5A). While the p53 DNA-binding domain was not mutated, the protein expression was higher in MOEHIGH. WT p53 induces p21 expression, yet p21 was repressed at the protein level, similar to human tumors that have a reduction due to mutation and/or downregulation in 7% of tumors. Cyclin E1 is amplified in about 20% of human HGSCs and the protein was elevated in the MOEHIGH cells. Differential regulation of the Rb pathway was reported in TCGA data, and the MOEHIGH showed an increase in phospho-Rb protein, a loss of p16INK4A protein, and amplified CCND1 transcript (RNA sequencing) (17). Lastly, c-myc and FoxM1 proteins were elevated in MOEHIGH as compared to MOELOW.
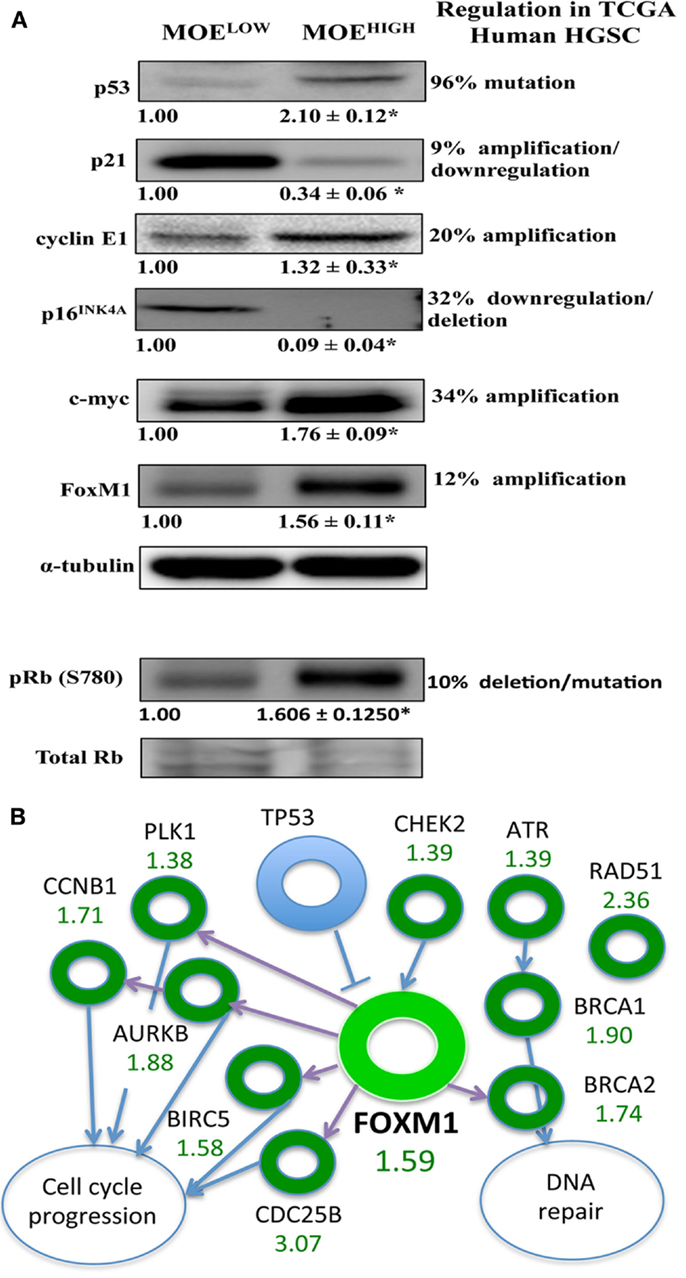
Figure 5. MOEHIGH cells have several pathways regulated similarly to human high-grade serous tumors. (A) Western blotting analysis on MOEHIGH and MOELOW cells probed for targets that have differential regulation in human tissue samples based on the TCGA database. p53 protein levels were elevated in MOEHIGH cells due to overexpression of p53 splice variant. Cyclin E, pRB (S780), c-Myc, and FoxM1 expression levels were increased and p21 and p16INK4A expression levels were decreased in MOEHIGH compared to MOELOW. Numbers under blots for Cyclin E, c-Myc, and FoxM1 represent fold change in densitometry between MOEHIGH and MOELOW normalized to tubulin. Number under pRB (S780) blot represent fold change in densitometry between MOEHIGH and MOELOW normalized to total RB. (B) FoxM1 pathway modified in MOEHIGH similar to human high-grade serous tumors. Fold increase in RNA expression from MOEHIGH compared to MOELOW from RNA-seq is shown in green.
The FOXM1 pathway was amplified in roughly 90% of high-grade serous tumors according to the TCGA analysis (17). Since FoxM1 was amplified at an RNA and protein level, the pathways noted by the TCGA that were altered in human tissue samples were monitored in the RNA-seq results. The TCGA reported on the following transcripts that are regulated in the FOXM1 pathway, all of which (or their mouse homolog) were amplified in the TCGA data set and in the MOEHIGH cell model: CHEK2, ATR, BRCA1, BRCA2, RAD51, CDC25B, BIRC5, AURKB, PLK1, and CCNB1 (Figure 5B).
MOEHIGH are Resistant to DNA Bulky Strand Adducting Pathways
One of the hallmarks of HGSC is the development of resistance to chemotherapy, and typically resistance occurs to carboplatin, although patients can also become resistant to paclitaxel (52). In order to determine if MOEHIGH exhibited any differential response to chemotherapy, concentration-dependent growth curves were generated in response to the commonly used front-line therapies for ovarian cancer, cisplatin, and paclitaxel. The MOEHIGH cells were less sensitive to cisplatin demonstrating an LC50 of 541 nM, which was almost double that of MOELOW (245 nM) (Figure 6B). Similarly, DMBA, which forms DNA adducts repaired by nucleotide excision repair, was able to induce cell death in MOELOW at an LC50 of 297 nM, while MOEHIGH required 10.3 μM to induce death (Figure 6A). Interestingly, the cells displayed no significant differences in response to doxorubicin and paclitaxel (Figure S3 in Supplementary Material). Therefore, the MOEHIGH transformed cellular model may also provide some insights into changes that allow oviductal-derived tumor cells to develop resistance to cisplatin and other bulky adducting compounds, like DMBA.
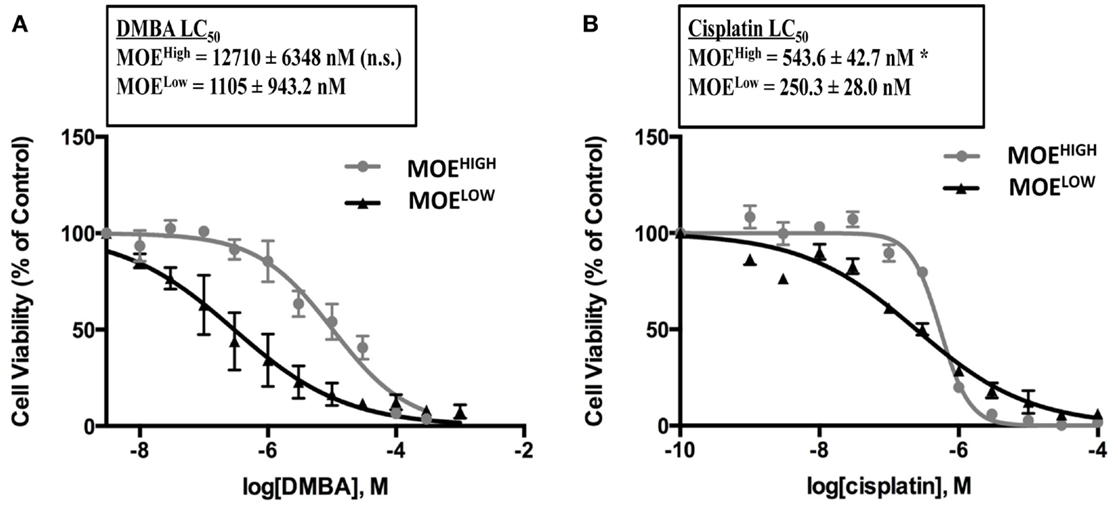
Figure 6. MOEHIGH cells display chemoresistance. MOEHIGH and MOELOW cells were treated with DMBA (A) and cisplatin (B). Mean ± SEM *p-value ≤0.05 and not significant (n.s.).
Discussion
While several transgenic mouse models and engineered cell models have demonstrated that oviductal epithelium can form HGSC, a spontaneous model of tumor formation from the oviduct has not yet been reported. Spontaneous models of OSE after continuous passage have been used for many studies including studies that help to understand the progression of cancer and the properties of the cells, such as aneuploidy, transcriptional alterations, enhanced stem-cell like properties, response to chemotherapy, and as a syngeneic model (26, 28). Continuous passaging of primary, non-tumor forming CD1 oviductal cells revealed that they became more secretory dominated in culture, proliferated more rapidly, formed 2D foci and soft agar colonies. RNA profiling revealed several pathways modified in the cellular model that were also altered in HGSC, such as FoxM1. Similar to models derived from OSE, the tumors were mostly undifferentiated, but they expressed oviductal markers. The MOEHIGH cells demonstrated a resistance to cisplatin and DMBA, but not to doxorubicin, H2O2, and paclitaxel. Overall, these studies provide a unique cellular model that can be used to monitor the changes that accumulate over time to produce a spontaneous tumor from oviductal cells exposed to continuous passaging.
MOEHIGH represent the first spontaneous cellular model of cancer derived from an oviductal cell line. This model serves as a complimentary model system to several similar ones derived from the OSE of rats and mice (25, 28, 53–55). While all of these models are tumorigenic, almost all of them produced undifferentiated tumors, similar to the MOEHIGH in this study. Only recently, a spontaneous OSE model was generated that exhibited not only phenotypic aspects of HGSC but also molecular ones (28). MOEHIGH while lacking expression for several common immunohistochemical markers for HGSC, such as cytokeratin 8, did express Pax8 and oviductal glycoprotein confirming their oviductal origin. MOEHIGH is also the first spontaneous model from an outbred strain, as previous OSE models have been generated from C57Bl/6 or FVB strains. MOEHIGH could potentially be grafted into immune competent hosts, but difficulty has been reported in the literature for allografting into outbred hosts, such as CD1 mice (56). The enhanced genetic diversity on an outbred strain may provide a better tool to uncovering mechanisms behind spontaneous tumor formation.
The most common mutation in human HGSC is in p53, typically found in the DNA-binding domain. While MOEHIGH cells did not display a standard DNA-binding mutation, the protein was alternatively spliced such that it lacks negative c-terminal regulatory domains. Interestingly, this splice variant could function similarly to truncation mutations found in the c-terminus of the human gene, which was demonstrated to lack growth arrest and apoptotic functions (57). Ceramide, an inhibitor of SRSF1 splicing activity, was recently shown to restore WT p53 function and could be a potential way to re-activate WT p53 in “deletion” mutated cells (58). Given that the model is of murine origin, and rodents have been shown to have unique splicing of p53, certain aspects of this model may be species specific (59). In addition, the MOEHIGH cellular model did not demonstrate any mutations in BRCA1 or 2, but consistent with human disease, had amplification of cyclin E1. Human tumors exhibit a mutual exclusivity between BRCA mutations and cyclin E amplifications (60). MOEHIGH did recapitulate some of the pathway modifications typically seen in HGSC, such as amplification of FoxM1 and its targets, amplification of the c-myc protein, cyclin E, reduced Rb function, and a loss of p16INK4a. This is important because most of the original evidence supporting the origin of HGSC came from women with mutations in BRCA1/2 or from genetically engineered mouse models with BRCA1/2 floxed alleles deleted in fallopian (oviductal) cells. The MOEHIGH model demonstrates that in the absence of BRCA mutation and/or loss, those oviductal cells can become tumorigenic, and recapitulate many of the dysfunctional pathways associated with HGSC.
RNA sequencing of MOEHIGH cells revealed the important biological processes or pathways that were modified included splicing, WNT signaling, and DNA synthesis. While DNA synthesis is not surprising given the high rate of proliferation, pathway modification of splicing, and WNT are consistent with findings from HGSC and represent possible therapeutic targets (61–63). WNT signaling is essential in the developmental origins of the oviductal cells, and the dual role of many developmental factors is linked with tumor formation. HGSC has a variety of WNT factors dysregulated including Wnt5a, Wnt11, Wnt7a, and Sox7 (64–66), and inhibition of certain WNT targets, such as GSK3β, has shown efficacy in preclinical xenograft models (67). While several WNT pathway members were downregulated, such as Fzd2, 4, 5, and 8, soluble ligands, such as WNT4, and target genes, such as cyclin D1 and Myc, were amplified. Interestingly, a recently defined spontaneous ovarian tumor model from the OSE also displayed changes in Wnt signaling, suggesting that regardless of cellular origin, certain pathways may provide ideal new drug targets for HGSC cancers (28).
The MOEHIGH cellular model did not form peritoneal disease, and was only able to form tumors in the subcutaneous space, which was reflected in a downregulation of “pathways in cancer” in the KEGG results where most of the genes were metastatic or tumor suppressors. Perhaps, the cellular model does not form widely disseminated tumors because key pathways in ovarian cancer were not disrupted, such as BRCA or PTEN. Another possible explanation is that there are key signaling molecules that block peritoneal dissemination that are still present in the cells, and perhaps uncovering these will provide new targets to exploit for reducing peritoneal spread. One such pathway that was still present in the cells was Pax2 (data not shown). Pax2 is typically lost in early lesions of HGSC, and studies have demonstrated that re-expression of Pax2 in HGSC can induce cellular death (68). Several other in vitro-derived models of fallopian or oviductal cancer have primarily been xenografted into SCID mice, and perhaps the difference in background strain influences the spread of the disease. Lastly, xenografting directly into the ovarian bursa may increase the chance of developing an early stage tumor that may be required before subsequent peritoneal spread.
In summary, a spontaneous model of oviductal cancer was derived by continuously passaging using an outbred CD1 murine cell line that developed features of HGSC, such as amplification of FOXM1 and c-myc, resistance to cisplatin, and loss of Cdkn2a. The model produced tumors only in the s.c. compartment and may represent early disease or a model that lacks key regulators of peritoneal spread. Further investigation is warranted to understand the role of splicing and WNT signaling in this model system. This model offers the opportunity to uncover a step-wise progression of tumor formation from an oviductal origin to be compared to human disease, derived from possibly both the ovarian surface and the oviduct.
Conflict of Interest Statement
The authors declare that the research was conducted in the absence of any commercial or financial relationships that could be construed as a potential conflict of interest.
Acknowledgments
This work was supported by grant to JB from the American Cancer Society (ACS) Illinois Division Research (RSG-12-230- 01-TBG).
Supplementary Material
The Supplementary Material for this article can be found online at http://journal.frontiersin.org/article/10.3389/fonc.2015.00154
Footnotes
References
1. Jayson GC, Kohn EC, Kitchener HC, Ledermann JA. Ovarian cancer. Lancet (2014) 384(9951):1376–88. doi: 10.1016/S0140-6736(13)62146-7
2. Siegel R, Ma J, Zou Z, Jemal A. Cancer statistics, 2014. CA Cancer J Clin (2014) 64:9–29. doi:10.3322/caac.21208
3. Crum CP, Herfs M, Ning G, Bijron JG, Howitt BE, Jimenez CA, et al. Through the glass darkly: intraepithelial neoplasia, top-down differentiation, and the road to ovarian cancer. J Pathol (2013) 231:402–12. doi:10.1002/path.4263
4. Banerjee S, Kaye SB. New strategies in the treatment of ovarian cancer: current clinical perspectives and future potential. Clin Cancer Res (2013) 19:961–8. doi:10.1158/1078-0432.CCR-12-2243
5. Auersperg N. The origin of ovarian cancers – hypotheses and controversies. Front Biosci (Schol Ed) (2013) 5:709–19. doi:10.2741/S401
6. Dubeau L, Drapkin R. Coming into focus: the nonovarian origins of ovarian cancer. Ann Oncol (2013) 24(8):viii28–35. doi:10.1093/annonc/mdt308
7. Piek JM, van Diest PJ, Zweemer RP, Jansen JW, Poort-Keesom RJ, Menko FH, et al. Dysplastic changes in prophylactically removed Fallopian tubes of women predisposed to developing ovarian cancer. J Pathol (2001) 195:451–6. doi:10.1002/path.1000
8. Kurman RJ, Shih IeM. Molecular pathogenesis and extraovarian origin of epithelial ovarian cancer – shifting the paradigm. Hum Pathol (2011) 42:918–31. doi:10.1016/j.humpath.2011.03.003
9. Crum CP, Drapkin R, Miron A, Ince TA, Muto M, Kindelberger DW, et al. The distal fallopian tube: a new model for pelvic serous carcinogenesis. Curr Opin Obstet Gynecol (2007) 19:3–9. doi:10.1097/GCO.0b013e328011a21f
10. Lee Y, Miron A, Drapkin R, Nucci MR, Medeiros F, Saleemuddin A, et al. A candidate precursor to serous carcinoma that originates in the distal fallopian tube. J Pathol (2007) 211:26–35. doi:10.1002/path.2091
11. Mehra K, Mehrad M, Ning G, Drapkin R, McKeon FD, Xian W, et al. STICS, SCOUTs and p53 signatures; a new language for pelvic serous carcinogenesis. Front Biosci (2011) 3:625–34. doi:10.2741/e275
12. Jazaeri AA, Bryant JL, Park H, Li H, Dahiya N, Stoler MH, et al. Molecular requirements for transformation of fallopian tube epithelial cells into serous carcinoma. Neoplasia (2011) 13:899–911. doi:10.1593/neo.11138
13. Karst AM, Levanon K, Drapkin R. Modeling high-grade serous ovarian carcinogenesis from the fallopian tube. Proc Natl Acad Sci U S A (2011) 108:7547–52. doi:10.1073/pnas.1017300108
14. Miyoshi I, Takahashi K, Kon Y, Okamura T, Mototani Y, Araki Y, et al. Mouse transgenic for murine oviduct-specific glycoprotein promoter-driven simian virus 40 large T-antigen: tumor formation and its hormonal regulation. Mol Reprod Dev (2002) 63:168–76. doi:10.1002/mrd.10175
15. Shan W, Mercado-Uribe I, Zhang J, Rosen D, Zhang S, Wei J, et al. Mucinous adenocarcinoma developed from human fallopian tube epithelial cells through defined genetic modifications. Cell Cycle (2012) 11:2107–13. doi:10.4161/cc.20544
16. Hahn WC, Dessain SK, Brooks MW, King JE, Elenbaas B, Sabatini DM, et al. Enumeration of the simian virus 40 early region elements necessary for human cell transformation. Mol Cell Biol (2002) 22:2111–23. doi:10.1128/MCB.22.10.3562.2002
17. Cancer Genome Atlas Research Network. Integrated genomic analyses of ovarian carcinoma. Nature (2011) 474:609–15. doi:10.1038/nature10166
18. Orsulic S, Li Y, Soslow RA, Vitale-Cross LA, Gutkind JS, Varmus HE. Induction of ovarian cancer by defined multiple genetic changes in a mouse model system. Cancer Cell (2002) 1:53–62. doi:10.1016/S1535-6108(01)00002-2
19. King SM, Burdette JE. Evaluating the progenitor cells of ovarian cancer: analysis of current animal models. BMB Rep (2011) 44:435–45. doi:10.5483/BMBRep.2011.44.7.435
20. Auersperg N, Edelson MI, Mok SC, Johnson SW, Hamilton TC. The biology of ovarian cancer. Semin Oncol (1998) 25:281–304.
21. Choi KC, Kang SK, Nathwani PS, Cheng KW, Auersperg N, Leung PC. Differential expression of activin/inhibin subunit and activin receptor mRNAs in normal and neoplastic ovarian surface epithelium (OSE). Mol Cell Endocrinol (2001) 174:99–110. doi:10.1016/S0303-7207(00)00447-0
22. Garson K, Shaw TJ, Clark KV, Yao DS, Vanderhyden BC. Models of ovarian cancer – are we there yet? Mol Cell Endocrinol (2005) 239:15–26. doi:10.1016/j.mce.2005.03.019
23. Szabova L, Yin C, Bupp S, Guerin TM, Schlomer JJ, Householder DB, et al. Perturbation of Rb, p53, and Brca1 or Brca2 cooperate in inducing metastatic serous epithelial ovarian cancer. Cancer Res (2012) 72:4141–53. doi:10.1158/0008-5472.CAN-11-3834
24. Wu R, Baker SJ, Hu TC, Norman KM, Fearon ER, Cho KR. Type I to type II ovarian carcinoma progression: mutant Trp53 or Pik3ca confers a more aggressive tumor phenotype in a mouse model of ovarian cancer. Am J Pathol (2013) 182:1391–9. doi:10.1016/j.ajpath.2012.12.031
25. Roby KF, Taylor CC, Sweetwood JP, Cheng Y, Pace JL, Tawfik O, et al. Development of a syngeneic mouse model for events related to ovarian cancer. Carcinogenesis (2000) 21:585–91. doi:10.1093/carcin/21.4.585
26. Godwin AK, Testa JR, Handel LM, Liu Z, Vanderveer LA, Tracey PA, et al. Spontaneous transformation of rat ovarian surface epithelial cells: association with cytogenetic changes and implications of repeated ovulation in the etiology of ovarian cancer. J Natl Cancer Inst (1992) 84:592–601. doi:10.1093/jnci/84.8.592
27. Testa JR, Getts LA, Salazar H, Liu Z, Handel LM, Godwin AK, et al. Spontaneous transformation of rat ovarian surface epithelial cells results in well to poorly differentiated tumors with a parallel range of cytogenetic complexity. Cancer Res (1994) 54:2778–84.
28. McCloskey CW, Goldberg RL, Carter LE, Gamwell LF, Al-Hujaily EM, Collins O, et al. A new spontaneously transformed syngeneic model of high-grade serous ovarian cancer with a tumor-initiating cell population. Front Oncol (2014) 4:53. doi:10.3389/fonc.2014.00053
29. Barua A, Bitterman P, Abramowicz JS, Dirks AL, Bahr JM, Hales DB, et al. Histopathology of ovarian tumors in laying hens: a preclinical model of human ovarian cancer. Int J Gynecol Cancer (2009) 19:531–9. doi:10.1111/IGC.0b013e3181a41613
30. Gonzalez Bosquet J, Peedicayil A, Maguire J, Chien J, Rodriguez GC, Whitaker R, et al. Comparison of gene expression patterns between avian and human ovarian cancers. Gynecol Oncol (2011) 120:256–64. doi:10.1016/j.ygyno.2010.10.030
31. Johnson PA, Giles JR. The hen as a model of ovarian cancer. Nat Rev Cancer (2013) 13:432–6. doi:10.1038/nrc3535
32. Quartuccio SM, Lantvit DD, Bosland MC, Burdette JE. Conditional inactivation of p53 in mouse ovarian surface epithelium does not alter MIS driven Smad2-dominant negative epithelium-lined inclusion cysts or teratomas. PLoS One (2013) 8:e65067. doi:10.1371/journal.pone.0065067
33. O hAinmhire E, Quartuccio SM, Cheng W, Ahmed RA, King SM, Burdette JE. Mutation or loss of p53 differentially modifies TGFbeta action in ovarian cancer. PLoS One (2014) 9:e89553. doi:10.1371/journal.pone.0089553
34. Trapnell C, Roberts A, Goff L, Pertea G, Kim D, Kelley DR, et al. Differential gene and transcript expression analysis of RNA-seq experiments with TopHat and Cufflinks. Nat Protoc (2012) 7:562–78. doi:10.1038/nprot.2012.016
35. Trapnell C, Hendrickson DG, Sauvageau M, Goff L, Rinn JL, Pachter L. Differential analysis of gene regulation at transcript resolution with RNA-seq. Nat Biotechnol (2013) 31:46–53. doi:10.1038/nbt.2450
36. Carmona-Saez P, Chagoyen M, Tirado F, Carazo JM, Pascual-Montano A. GENECODIS: a web-based tool for finding significant concurrent annotations in gene lists. Genome Biol (2007) 8:R3. doi:10.1186/gb-2007-8-1-r3
37. Nogales-Cadenas R, Carmona-Saez P, Vazquez M, Vicente C, Yang X, Tirado F, et al. GeneCodis: interpreting gene lists through enrichment analysis and integration of diverse biological information. Nucleic Acids Res (2009) 37:W317–22. doi:10.1093/nar/gkp416
38. Tabas-Madrid D, Nogales-Cadenas R, Pascual-Montano A. GeneCodis3: a non-redundant and modular enrichment analysis tool for functional genomics. Nucleic Acids Res (2012) 40:W478–83. doi:10.1093/nar/gks402
39. King SM, Quartuccio SM, Vanderhyden BC, Burdette JE. Early transformative changes in normal ovarian surface epithelium induced by oxidative stress require Akt upregulation, DNA damage and epithelial-stromal interaction. Carcinogenesis (2013) 34:1125–33. doi:10.1093/carcin/bgt003
40. King SM, Hilliard TS, Wu LY, Jaffe RC, Fazleabas AT, Burdette JE. The impact of ovulation on fallopian tube epithelial cells: evaluating three hypotheses connecting ovulation and serous ovarian cancer. Endocr Relat Cancer (2011) 18:627–42. doi:10.1530/ERC-11-0107
41. Quartuccio SM, Karthikeyan S, Eddie SL, Lantvit DD, O. hAinmhire E, Modi DA, et al. Mutant p53 expression in fallopian tube epithelium drives cell migration. Int J Cancer (2015). doi:10.1002/ijc.29528
42. Maines-Bandiera S, Woo MM, Borugian M, Molday LL, Hii T, Gilks B, et al. Oviductal glycoprotein (OVGP1, MUC9): a differentiation-based mucin present in serum of women with ovarian cancer. Int J Gynecol Cancer (2010) 20:16–22. doi:10.1111/IGC.0b013e3181bcc96d
43. Verhage HG, Fazleabas AT, Mavrogianis PA, O’Day-Bowman MB, Donnelly KM, Arias EB, et al. The baboon oviduct: characteristics of an oestradiol-dependent oviduct-specific glycoprotein. Hum Reprod Update (1997) 3:541–52. doi:10.1093/humupd/3.6.541
44. Perets R, Wyant GA, Muto KW, Bijron JG, Poole BB, Chin KT, et al. Transformation of the fallopian tube secretory epithelium leads to high-grade serous ovarian cancer in Brca;Tp53;Pten models. Cancer Cell (2013) 24:751–65. doi:10.1016/j.ccr.2013.10.013
45. Rodriguez MS, Desterro JM, Lain S, Lane DP, Hay RT. Multiple C-terminal lysine residues target p53 for ubiquitin-proteasome-mediated degradation. Mol Cell Biol (2000) 20:8458–67. doi:10.1128/MCB.20.22.8458-8467.2000
46. Halasi M, Gartel AL. Targeting FOXM1 in cancer. Biochem Pharmacol (2013) 85:644–52. doi:10.1016/j.bcp.2012.10.013
47. Raychaudhuri P, Park HJ. FoxM1: a master regulator of tumor metastasis. Cancer Res (2011) 71:4329–33. doi:10.1158/0008-5472.CAN-11-0640
48. Garritano S, Inga A, Gemignani F, Landi S. More targets, more pathways and more clues for mutant p53. Oncogenesis (2013) 2:e54. doi:10.1038/oncsis.2013.15
49. Alvarez Secord A, Bernardini MQ, Broadwater G, Grace LA, Huang Z, Baba T, et al. TP53 status is associated with thrombospondin1 expression in vitro. Front Oncol (2013) 3:269. doi:10.3389/fonc.2013.00269
50. Terzian T, Suh YA, Iwakuma T, Post SM, Neumann M, Lang GA, et al. The inherent instability of mutant p53 is alleviated by Mdm2 or p16INK4a loss. Genes Dev (2008) 22:1337–44. doi:10.1101/gad.1662908
51. Hanafusa T, Shinji T, Shiraha H, Nouso K, Iwasaki Y, Yumoto E, et al. Functional promoter upstream p53 regulatory sequence of IGFBP3 that is silenced by tumor specific methylation. BMC Cancer (2005) 5:9. doi:10.1186/1471-2407-5-9
52. Galluzzi L, Vitale I, Michels J, Brenner C, Szabadkai G, Harel-Bellan A, et al. Systems biology of cisplatin resistance: past, present and future. Cell Death Dis (2014) 5:e1257. doi:10.1038/cddis.2013.428
53. Lv L, Zhang T, Yi Q, Huang Y, Wang Z, Hou H, et al. Tetraploid cells from cytokinesis failure induce aneuploidy and spontaneous transformation of mouse ovarian surface epithelial cells. Cell Cycle (2012) 11:2864–75. doi:10.4161/cc.21196
54. Roberts PC, Mottillo EP, Baxa AC, Heng HH, Doyon-Reale N, Gregoire L, et al. Sequential molecular and cellular events during neoplastic progression: a mouse syngeneic ovarian cancer model. Neoplasia (2005) 7:944–56. doi:10.1593/neo.05358
55. Urzua U, Roby KF, Gangi LM, Cherry JM, Powell JI, Munroe DJ. Transcriptomic analysis of an in vitro murine model of ovarian carcinoma: functional similarity to the human disease and identification of prospective tumoral markers and targets. J Cell Physiol (2006) 206:594–602. doi:10.1002/jcp.20522
56. Reichenbach DK, Li Q, Hoffman RA, Williams AL, Shlomchik WD, Rothstein DM, et al. Allograft outcomes in outbred mice. Am J Transplant (2013) 13:580–8. doi:10.1111/ajt.12056
57. Hamard PJ, Lukin DJ, Manfredi JJ. p53 basic C terminus regulates p53 functions through DNA binding modulation of subset of target genes. J Biol Chem (2012) 287:22397–407. doi:10.1074/jbc.M111.331298
58. Patwardhan GA, Hosain SB, Liu DX, Khiste SK, Zhao Y, Bielawski J, et al. Ceramide modulates pre-mRNA splicing to restore the expression of wild-type tumor suppressor p53 in deletion-mutant cancer cells. Biochim Biophys Acta (2014) 1841:1571–80. doi:10.1016/j.bbalip.2014.08.017
59. Laverdiere M, Beaudoin J, Lavigueur A. Species-specific regulation of alternative splicing in the C-terminal region of the p53 tumor suppressor gene. Nucleic Acids Res (2000) 28:1489–97. doi:10.1093/nar/28.6.1489
60. Etemadmoghadam D, Weir BA, Au-Yeung G, Alsop K, Mitchell G, George J, et al. Synthetic lethality between CCNE1 amplification and loss of BRCA1. Proc Natl Acad Sci U S A (2013) 110:19489–94. doi:10.1073/pnas.1314302110
61. Iborra S, Hirschfeld M, Jaeger M, Zur Hausen A, Braicu I, Sehouli J, et al. Alterations in expression pattern of splicing factors in epithelial ovarian cancer and its clinical impact. Int J Gynecol Cancer (2013) 23:990–6. doi:10.1097/IGC.0b013e31829783e3
62. He X, Arslan AD, Pool MD, Ho TT, Darcy KM, Coon JS, et al. Knockdown of splicing factor SRp20 causes apoptosis in ovarian cancer cells and its expression is associated with malignancy of epithelial ovarian cancer. Oncogene (2011) 30:356–65. doi:10.1038/onc.2010.426
63. He X, Ee PL, Coon JS, Beck WT. Alternative splicing of the multidrug resistance protein 1/ATP binding cassette transporter subfamily gene in ovarian cancer creates functional splice variants and is associated with increased expression of the splicing factors PTB and SRp20. Clin Cancer Res (2004) 10:4652–60. doi:10.1158/1078-0432.CCR-03-0439
64. Liu H, Yan ZQ, Li B, Yin SY, Sun Q, Kou JJ, et al. Reduced expression of SOX7 in ovarian cancer: a novel tumor suppressor through the Wnt/beta-catenin signaling pathway. J Ovarian Res (2014) 7:87. doi:10.1186/s13048-014-0087-1
65. Ford CE, Punnia-Moorthy G, Henry CE, Llamosas E, Nixdorf S, Olivier J, et al. The non-canonical Wnt ligand, Wnt5a, is upregulated and associated with epithelial to mesenchymal transition in epithelial ovarian cancer. Gynecol Oncol (2014) 134:338–45. doi:10.1016/j.ygyno.2014.06.004
66. Yoshioka S, King ML, Ran S, Okuda H, MacLean JA II, McAsey ME, et al. WNT7A regulates tumor growth and progression in ovarian cancer through the WNT/beta-catenin pathway. Mol Cancer Res (2012) 10:469–82. doi:10.1158/1541-7786.MCR-11-0177
67. Hilliard TS, Gaisina IN, Muehlbauer AG, Gaisin AM, Gallier F, Burdette JE. Glycogen synthase kinase 3beta inhibitors induce apoptosis in ovarian cancer cells and inhibit in-vivo tumor growth. Anticancer Drugs (2011) 22(10):978–85. doi:10.1097/CAD.0b013e32834ac8fc
Keywords: carcinogenesis, fallopian tube, cancer, ovarian cancer, and model system
Citation: Endsley MP, Moyle-Heyrman G, Karthikeyan S, Lantvit DD, Davis DA, Wei J-J and Burdette JE (2015) Spontaneous transformation of murine oviductal epithelial cells: a model system to investigate the onset of fallopian-derived tumors. Front. Oncol. 5:154. doi: 10.3389/fonc.2015.00154
Received: 08 May 2015; Accepted: 29 June 2015;
Published: 17 July 2015
Edited by:
Viive Maarika Howell, University of Sydney, AustraliaReviewed by:
Emily K. Colvin, University of Sydney, AustraliaRuth Perets, Rambam Health Care Campus, Israel
Copyright: © 2015 Endsley, Moyle-Heyrman, Karthikeyan, Lantvit, Davis, Wei and Burdette. This is an open-access article distributed under the terms of the Creative Commons Attribution License (CC BY). The use, distribution or reproduction in other forums is permitted, provided the original author(s) or licensor are credited and that the original publication in this journal is cited, in accordance with accepted academic practice. No use, distribution or reproduction is permitted which does not comply with these terms.
*Correspondence: Joanna E. Burdette, Department of Medicinal Chemistry and Pharmacognosy, Center for Pharmaceutical Biotechnology (M/C 870), University of Illinois at Chicago, Molecular Biology Research Building (MBRB), 900 South Ashland Avenue, Chicago, IL 60607-7173, USA, joannab@uic.edu