 Benjamin Berger1,2
 Massimiliano Donzelli1,2Swarna Maseneni1,2Franziska Boess3Adrian Roth3
 Stephan Krähenbühl1,2,4
 Manuel Haschke1,2*
- 1Division of Clinical Pharmacology and Toxicology, University Hospital Basel, Basel, Switzerland
- 2Department of Biomedicine, University of Basel, Basel, Switzerland
- 3Roche Innovation Center Basel, Pharmaceutical Sciences, Hoffmann-La Roche Ltd., Basel, Switzerland
- 4Swiss Center for Applied Human Toxicology, Basel, Switzerland
Currently used hepatocyte cell systems for in vitro assessment of drug metabolism include hepatoma cell lines and primary human hepatocyte (PHH) cultures. We investigated the suitability of the validated in vivo Basel phenotyping cocktail (caffeine [CYP1A2], efavirenz [CYP2B6], losartan [CYP2C9], omeprazole [CYP2C19], metoprolol [CYP2D6], midazolam [CYP3A4]) in vitro and characterized four hepatocyte cell systems (HepG2 cells, HepaRG cells, and primary cryopreserved human hepatocytes in 2-dimensional [2D] culture or in 3D-spheroid co-culture) regarding basal metabolism and CYP inducibility. Under non-induced conditions, all CYP activities could be determined in 3D-PHH, CYP2B6, CYP2C19, CYP2D6, and CYP3A4 in 2D-PHH and HepaRG, and CYP2C19 and CYP3A4 in HepG2 cells. The highest non-induced CYP activities were observed in 3D-PHH and HepaRG cells. mRNA expression was at least four-fold higher for all CYPs in 3D-PHH compared to the other cell systems. After treatment with 20 μM rifampicin, mRNA increased 3- to 50-fold for all CYPs except CYP1A2 and 2D6 for HepaRG and 3D-PHH, 4-fold (CYP2B6) and 17-fold (CYP3A4) for 2D-PHH and four-fold (CYP3A4) for HepG2. In 3D-PHH at least a two-fold increase in CYP activity was observed for all inducible CYP isoforms while CYP1A2 and CYP2C9 activity did not increase in 2D-PHH and HepaRG. CYP inducibility assessed in vivo using the same phenotyping probes was also best reflected by the 3D-PHH model. Our studies show that 3D-PHH and (with some limitations) HepaRG are suitable cell systems for assessing drug metabolism and CYP induction in vitro. HepG2 cells are less suited to assess CYP induction of the 2C and 3A family. The Basel phenotyping cocktail is suitable for the assessment of CYP activity and induction also in vitro.
Introduction
Cytochrome P450 enzymes (CYPs) are involved in the oxidative metabolism of the majority of the commonly used low molecular weight drugs, thereby influencing the pharmacokinetics of these drugs and having an important role in drug-drug interactions (Wilkinson, 2005). Genetic variants and exogenous factors such as diet, smoking habits, and concomitant medication can affect the activity of CYPs. All of these factors are responsible for wide interindividual variations in CYP activity and drug plasma concentrations, which can be associated with either increased toxicity or an insufficient pharmacological effect.
Simultaneous determination of the activity of different CYPs in an individual patient can be performed by administering a combination (“cocktail”) of specific probe drugs (Fuhr et al., 2007). Several cocktails have been characterized in clinical studies and are used in individual patients, including the Karolinska cocktail (Christensen et al., 2003), the Cooperstown 5+1 cocktail (Chainuvati et al., 2003), the Geneva cocktail (Bosilkovska et al., 2014) and the Basel Cocktail (Donzelli et al., 2014). These cocktails have also been shown to be valuable tools to assess the capacity of drugs to induce or inhibit CYPs (Bosilkovska et al., 2014; Derungs et al., 2016). Drug cocktails have also been used to perform in vitro studies, in particular when assessing the CYP inhibition and induction potential of chemical compounds (Youdim et al., 2007; Mori et al., 2009; Spaggiari et al., 2014).
Suitable in vitro systems to assess drug metabolism are mainly liver microsomes, hepatocarcinoma cell cultures (e.g., HepG2 and HepaRG cells) and primary human hepatocytes (PHHs). Monolayer-grown PHHs or hepatocarcinoma cell-lines are currently the gold standard for in vitro drug-drug interaction and hepatotoxicity studies. However, monolayer hepatocyte culture systems have major drawbacks. PHH cultures suffer from a rapid loss of cell polarity and of specific hepatic functions, which limits their applicability for drug metabolism experiments to a few days. Furthermore, they exhibit a large variation in cell functions, especially in CYP activities, as well as a variable response to CYP inducers (Abadie-Viollon et al., 2010; Godoy et al., 2013). In comparison, hepatocarcinoma cell line cultures can be used over extended periods of time, but their metabolic activity and response to CYP inducers are generally limited (Donato and Castell, 2003). As an alternative to 2D cultures of PHHs or hepatocarcinoma cell lines, a variety of different 3D liver models are being explored, as they are thought to approximate the in vivo tissue structure and cell behavior more closely (Godoy et al., 2013; Roth and Singer, 2014).
Limited availability of phenotyping probe drugs is a frequent limitation of published in vivo phenotyping cocktails. To facilitate clinical application of phenotyping, we therefore developed a new low-dose cocktail, which is based on probe drugs that are widely used in clinical practice (Donzelli et al., 2014). In a subsequent study, we characterized this cocktail in healthy male subjects treated with a combination of different CYP inhibitors and a CYP inducer (Derungs et al., 2016). Since we now have a detailed in vivo characterization of this cocktail, it was of interest to also test the cocktail in vitro. The two principle aims of our investigation were therefore (i) to assess the performance and usability of the Basel cocktail in vitro by comparing in vitro with in vivo results and (ii) to assess the suitability of different hepatocyte cell models for the investigation of drug metabolism and CYP induction.
In order to accomplish these aims, we tested the metabolism of the Basel cocktail (containing caffeine, metoprolol, omeprazole, losartan, efavirenz, and midazolam) in HepG2 cells, HepaRG cells, and primary cryopreserved human hepatocytes grown in 2D and in 3D culture under basal conditions and after CYP induction with rifampicin. CYP induction achieved by rifampicin in vitro could then be compared with the extent of in vivo CYP induction.
Materials and Methods
Chemicals and Reagents
8′-hydroxyefavirenz, efavirenz-d4, losartan, losartan-carboxylic acid (E3174), losartan-d4, omeprazole, 5′-hydroxyomeprazole, omeprazole-d3, metoprolol, α-hydroxymetoprolol, and metoprolol-d7 were purchased from TRC (Toronto, Canada). 1′-hydroxymidazolam and midazolam-d6 were acquired from Lipomed (Arlesheim, Switzerland), whereas rifampicin and β-glucuronidase (type HP-2 from Helix pomatia) were obtained from Sigma-Aldrich (Sigma- Aldrich Chemie GmbH, Buchs, Switzerland). Midazolam (F. Hoffmann-La Roche, Basel, Switzerland) and efavirenz (Merck, NJ, USA) were kindly provided by the respective manufacturers. The chemical structures of the probe drugs and their phase I metabolites are provided in Supplementary Figure 2. Formic acid, HPLC grade methanol, and HPLC grade water were purchased from Merck (Darmstadt, Germany). Media used were purchased from GIBCO (Lucerne, Switzerland).
Stock solutions, calibration, and quality control spiking solutions were prepared in DMSO. Calibration standards and quality controls were prepared by enriching the respective medium with the corresponding spiking solutions. Internal standard solutions containing the deuterated cocktail probe drugs were prepared in methanol.
Cell Cultures
The human hepatoma cell line HepG2 was obtained from ATCC (Manassas, VA, USA). HepG2 cells were cultured in Dulbecco's modified Eagle's medium (DMEM; with 2 mM GlutaMAX®, 1.0 g/l glucose and sodium bicarbonate) supplemented with 10% (v/v) heat-inactivated fetal calf serum (FCS), and 10 mM HEPES buffer, pH 7.2. In general, all cells were kept at 37°C in a humidified 5% CO2 cell culture incubator and passaged using trypsin, while the cell number was determined using a Neubauer hemacytometer. Viability was checked using the tryptan blue exclusion method. For the experiments, HepG2 cells were seeded at 10,000 cells/well in 96-well plates or 150,000 cells/well in 12-well plates.
HepaRG cells were purchased from Biopredic International (Rennes, France) as undifferentiated cryopreserved cells with the associated medium. Freshly split HepaRG cells were seeded at 9000 cells/well in 96-well plates and treated over the course of the next 4 weeks as previously described (Aninat et al., 2006).
Primary cryopreserved human hepatocytes (Life Technologies, Lot Hu8119, female donor) were plated at 50,000 cells/ well in collagen type-1 precoated 96-well plates in William's E medium supplemented with 10% FBS (v/v), 1% L-Glutamine 200 mM (v/v), 1% Pen Strep (v/v), 0.1% dexamethasone 100 μM (v/v), and 0.1% insulin 100 μM (v/v) and left to incubate at 37°C, 95% humidity, 5% CO2.
For the 3D-hepatocyte co-culture model originally described by Ohkura et al. (2014), 3T3 fibroblast cells from Swiss albino mouse embryo tissue (3T3 Balb/clone A31, ATCC product number CCL 163) were seeded at a density of 8000 cells/well in 96-well plates or at 40,000 cells/well in 24-well plates into micro-patterned plates (Cell-able®, Cosmo Bio USA Inc., CA, USA) in Dulbecco's Modified Eagle's medium (DMEM; with 2 mM GlutaMAX®), supplemented with 10% FBS. The cells were cultured in a 5% CO2, 95% air humidified environment at 37°C. After 2 days, cryopreserved human hepatocytes (Life Technologies Lot Hu8119) were seeded at a density of 25,000 cells/well in the same 96-well plates containing the 3T3 cells (or 125,000 cells/well in 24-well plates). The 3T3-cryopreserved human hepatocyte co-culture was maintained for a minimum of 2 days to allow for spheroid formation, using the same medium as for the conventional two-dimensional (2D) cryopreserved hepatocyte culture.
Cryopreserved human hepatocyte preparations were only used for experiments if their morphological characteristics and viability (>85%) were acceptable.
Markers of CYP450 Activity
CYP activity was assessed by the addition of a CYP probe drug cocktail consisting of caffeine (CYP1A2, 80 μM), efavirenz (CYP2B6, 10 μM), losartan (CYP2C9, 14 μM), omeprazole (CYP2C19, 17 μM), metoprolol (CYP2D6, 23 μM), and midazolam (CYP3A4, 5 μM). The substrates were used at concentrations close to their Km values previously published.
A previously developed liquid chromatography tandem mass spectrometry (LC-MS/MS) method (Donzelli et al., 2014) was used to analyze the phase I metabolites of the probe drugs. Chromatographic separation was performed on a Shimadzu HPLC system (Shimadzu AG, Reinach, Switzerland) coupled to a triple quadrupole tandem mass spectrometer (API4000, AB/MDS Sciex, Concord, Canada) operating in positive electrospray ionization mode, except for 8′-hydroxyefavirenz, which was detected in negative mode. Total run time was 2.9 min. Inter-assay accuracy (determined as the % bias) ranged from −10.7 to 9.8 and inter-assay precision (determined as the CV%) was lower than 11.3 for all analytes. The lower limit of quantification (LLOQ) was 0.25 ng/ml for hydroxymetoprolol, 8-hydroxyefavirenz, 1′-hydroxymidazolam, 5-hydroxyomeprazole, E-3174, and 0.5 ng/ml for paraxanthine.
Cyp450 Induction Experiments
Evaluation of mRNA Expression
HepG2 cells, HepaRG cells, 2D-cultured human hepatocytes, and 3D-cultured human hepatocytes were seeded in 24-well plates and treated for 48 h with rifampicin 20 μM. Three hundred and fifty microliters of RLT buffer (Qiagen, Hombrechtikon, Switzerland) was used to lyse the respective hepatocytes, after which the lysate was transferred to Qiashredder columns and centrifuged for 2 min at 13,000 rpm. From the eluate, total RNA was extracted and purified according to the manufacturer's instructions (Qiagen, RNeasy mini extraction kit). The concentration of the extracted RNA was measured spectrophotometrically at 260 nm on a NanoDrop 2000 (Thermo Fisher Scientific, Wohlen, Switzerland). cDNA was reverse-transcribed from the isolated RNA using the Qiagen omniscript system. For quantitative RT-PCR 10 ng cDNA was used. Forward and reverse primers for all CYPs tested and endogenous references, hypoxanthine phosphoribosyltransferase 1 (HPRT1) and Glyceraldehyde 3-phosphate dehydrogenase (GAPDH), were purchased from Microsynth (Balgach, Switzerland; listed in Table 1). RT-PCR was performed using SYBR green (Roche Diagnostics, Rotkreuz, Switzerland) on an ABI PRISM 7700 sequence detector (PE Biosystems, Rotkreuz, Switzerland). Quantification of mRNA expression levels was performed using the comparative-threshold cycle method (Livak and Schmittgen, 2001).
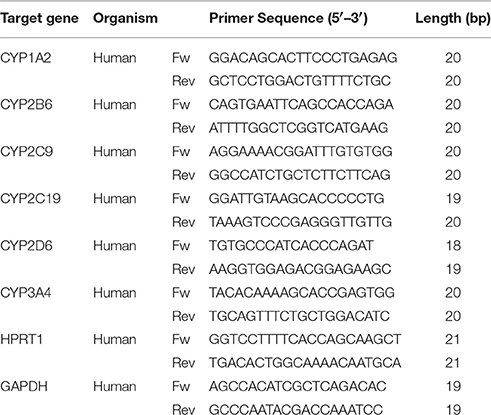
Table 1. Gene-specific primers for RT-PCR.
Functional Assessment of CYP Induction
HepG2 cells, HepaRG cells, cryopreserved human hepatocytes, as well as three-dimensionally seeded co-cultured cryopreserved human hepatocyte spheroids, were cultured in a 5% CO2 and 95% air humidified atmosphere at 37°C. Induction treatment (rifampicin 20 μM) lasted for 72 h, with the medium being changed every 24 h. Rifampicin stock solution was prepared in DMSO and further diluted in the appropriate culture medium to achieve a final DMSO concentration of 0.1% (v/v). Experimental control culture wells were treated with solvent [DMSO, 0.1% (v/v)] alone. Following induction treatment, CYP activity was assessed by the addition of fresh medium containing the cocktail probe drugs to the control and pre-treated cells. Substrates were dissolved and serially diluted in DMSO to the required concentrations. The final concentration of DMSO during the cocktail incubation was 0.2% (v/v). At selected time points (0, 15, 30, 45, 60, 90, and 120 min) the incubation was stopped by the addition of a threefold volume of ice-cold methanol containing the respective internal standards. The bottom of the wells was scraped using a pipette tip, after which the contents were transferred to an autosampler vial. After vigorous shaking (10 min) and centrifugation (3220 g, 30 min, 10°C) the supernatants were stored at −20°C until quantification by LC-MS/MS.
To determine the velocity of midazolam 1′-hydroxylation and efavirenz 8′-hydroxylation, the entire content of the autosampler vials were evaporated using a minivap microplate evaporator (Porvair Sciences Ltd., King's Lynn, Norfolk, UK). The analytes were then resuspended in 45 μl of the respective culture medium to which 5 μl (500 units) of β-glucuronidase was added. Following a 12 h incubation at 37°C, the reaction was terminated by the addition of methanol, after which the samples were treated as described above.
In vivo Assessment of CYP Induction
The in vivo characterization of the Basel cocktail has been described in previous publications (Donzelli et al., 2014; Derungs et al., 2016). Fifteen healthy volunteers were treated with 600 mg rifampicin per day for 7 days to induce CYP activity (Derungs et al., 2016). Genotyping identified one subject as a CYP2D6 intermediate metabolizer (CYP2D6*4/*41) and another subject as a CYP2C19 poor metabolizer (CYP2C19*2/*2). Data from these two subjects were not included in the analysis for CYP2C19 (n = 14) and CYP2D6 (n = 14), respectively. Clearance ratios of the probe drugs (induced vs. non-induced) were used to assess the extent of CYP induction.
Data Analysis
CYP activities were determined as the respective metabolite formation rates corresponding to the slope in the metabolite concentration vs. time graphs. Metabolite concentrations were quantified using standard curves of pure compounds as previously described (Donzelli et al., 2014).
For induction experiments, formation rates were determined and the fold change vs. the basal conditions was calculated as the ratio of the metabolite formation rate in wells exposed to an inducer and control wells.
Means were compared with the two-tailed Student's t-test using GraphPad Prism 6.0 (GraphPad Software, San Diego, CA, USA). Data are presented as mean ± SEM unless stated otherwise.
Results
CYP mRNA expression and CYP activities were investigated using four different liver cell cultures: HepG2 cells, HepaRG cells, PHHs seeded two-dimensionally (2D), and primary hepatocytes from the same donor in three-dimensional (3D) spheroid co-culture.
Basal mRNA Expression of CYPs in the Different Liver Cell Models
Basal CYP mRNA expression relative to GAPDH was detectable in all cell systems investigated and was highest in 3D-cultured PHHs (Figure 1). For HepG2 cells, the CYP mRNA expression was lower than for every other cell system investigated. In comparison to 3D-cultured PHHs, HepaRG cells showed a 4 times lower mRNA expression of CYP3A4 and 2C19, whereas the mRNA expression of the other CYPs investigated was more than 10 times lower. In 2D-cultured PHHs, CYP2C19 mRNA expression was ~4 times lower than in 3D-cultured hepatocytes, whereas the mRNA expression of the other CYPs was more than 10 times lower.
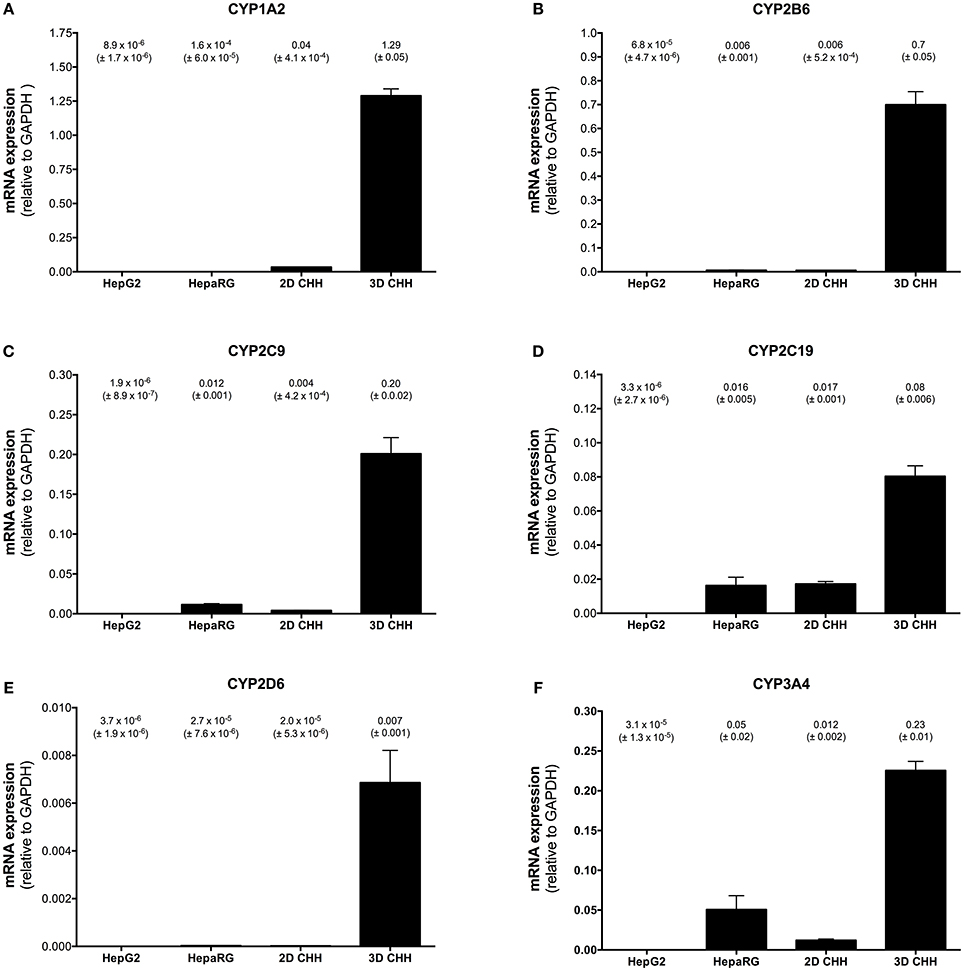
Figure 1. Basal mRNA expression of CYP1A2 (A), 2B6 (B), 2C9 (C), 2C19 (D), 2D6 (E), and 3A4 (F) in HepG2, HepaRG, 2D-, and 3D-cultured primary cryopreserved human hepatocytes. mRNA expression was determined by rt-PCR as described in the Materials and Methods Section. Results are expressed as mean ± SEM relative to GAPDH of at least three independent experiments. PHH, primary human hepatocytes.
Basal Metabolic Activity of the Liver Cell Models Used
Experiments using single substrates instead of the entire cocktail showed no mutual interactions between the probe drugs, except for 10 μM efavirenz, which was associated with a 30% decrease in CYP2C9 and a 20% decrease in CYP2C19 activity (results not shown). For HepaRG and conventional hepatocyte incubations, the use of 10 μM efavirenz was necessary, as lower efavirenz concentrations did not yield quantifiable concentrations of 8′-hydroxyefavirenz. All experiments were performed with the entire cocktail, hence the slight inhibitory effect of efavirenz was present in both conditions (basal and induced). In the in vivo cocktail, this interaction had been avoided by using efavirenz at a very low dose (Derungs et al., 2016).
Basal activities for all substrates investigated could be determined in HepaRG cells, 2D- and 3D-cultured PHHs, but not in HepG2 cells (Table 2). The highest activities were observed for CYP3A4, CYP2C19, and CYP2D6 in 3D-cultured PHHs and in HepaRG cells. In HepG2 cells, only activities of CYP3A4 and CYP2C19 could reliably be determined; metabolite formation remained below the limit of detection for the other CYPs.
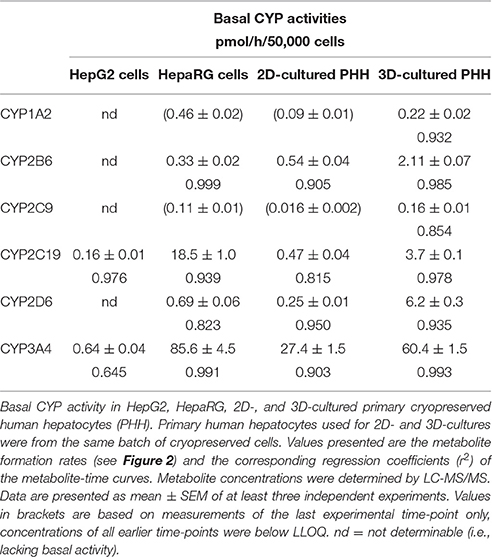
Table 2. Basal CYP activities.
Figure 2 shows the metabolite formation rates for the two CYP isoforms (CYP2C19 and CYP3A4) with activity in all four cell models using omeprazole and midazolam as probe drugs. Metabolite accumulation was linear with time up to 45 min for CYP3A4 and up to 1 h for CYP2C19, respectively. The metabolite formation rates were highest for HepaRG cells and lowest for HepG2 cells. Formation rates in 3D-cultured primary hepatocytes were higher than in 2D-cultures, illustrating a benefit of the 3D spheroid co-culture.
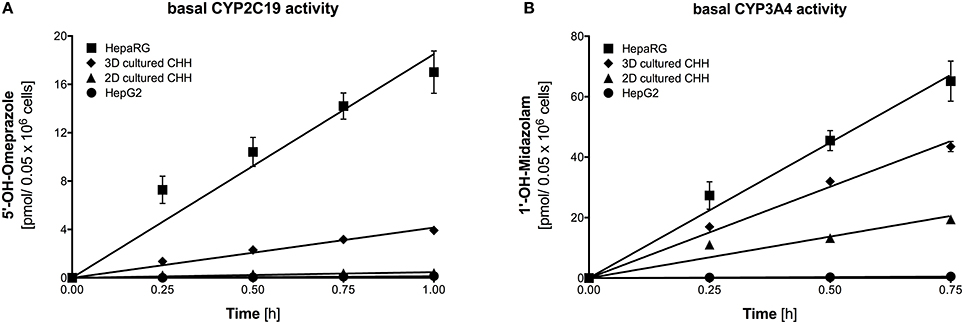
Figure 2. Basal activity of CYP2C19 and CYP3A4 assessed using formation rates of 5-hydroxyomeprazole (A) and 1′-hydroxymidazolam (B) in HepG2, HepaRG, 2D-, and 3D-cultured primary cryopreserved human hepatocytes. Primary hepatocytes were from the same batch of cryopreserved cells. Metabolite concentrations were determined by LC-MS/MS. The corresponding velocities and regressions are given in Table 2. Data are presented as mean ± SEM of at least three independent experiments. PHH, primary human hepatocytes.
Induced mRNA Expression of CYPs in Liver Cell Models Exposed to Rifampicin
Liver cell models were exposed to 20 μM rifampicin for 48 h and mRNA expression of the 6 CYPs isoforms was determined. In HepG2 cells, mRNA expression increased only for CYP3A4 (Figure 3). In HepaRG cells, mRNA expression increased for CYP2B6, 2C9, 2C19, and 3A4, but not for CYP1A2 and 2D6. A similar pattern of CYP induction was obtained for 3D-cultured PHHs, showing induction for CYP2B6, 2C9, 2C19, and 3A4, but not for CYP2D6 and 1A2. In comparison, when primary hepatocytes from the same batch were cultured conventionally (2D), induced mRNA expression could only be found for CYP3A4 and CYP2B6.
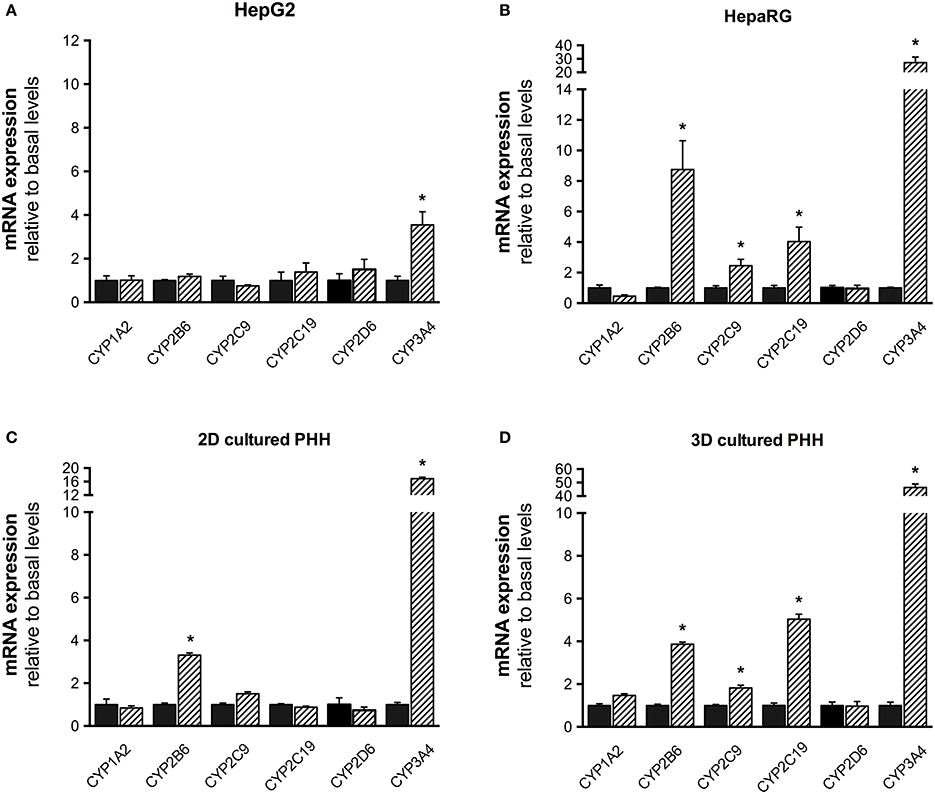
Figure 3. mRNA expression of CYP1A2, 2B6, 2C9, 2C19, 2D6, and 3A4 in HepG2 (A), HepaRG (B), 2D- (C), and 3D-cultured primary cryopreserved human hepatocytes (D) after treatment with 20 μM rifampicin for 48 h. mRNA expression was determined by rt-PCR as described in the Materials and Methods Section. Values were normalized to GAPDH expression. Results are expressed as the mean ± SEM fold increase after treatment with rifampicin relative to levels observed in control cultures. PHH, primary human hepatocytes. *p < 0.05 vs. control culture.
Since rifampicin is only a weak inducer of CYP1A2, we exposed 3D-cultured PHHs also to 3-methylcholanthrene, which is a well-established in vitro CYP1A2 inducer (Morel et al., 1990; Rodríguez-Antona et al., 2000). As shown in Supplementary Figure 1, in 3D-cultured PHHs CYP1A2 mRNA was induced ~13 times by 3-methylcholathrene, which was also reflected in an ~6 times higher production of paraxanthine from caffeine.
CYP Activity after Treatment of Liver Cell Models with Rifampicin
Metabolite formation was assessed after treatment of liver cells with 20 μM rifampicin for 72 h. As shown in Figure 4, treatment of 3D-cultured PHHs was associated with increased metabolite formation by all tested CYP isoforms. The metabolite production rates were linear for at least 45 min (midazolam) and up to 120 min (caffeine and efavirenz).
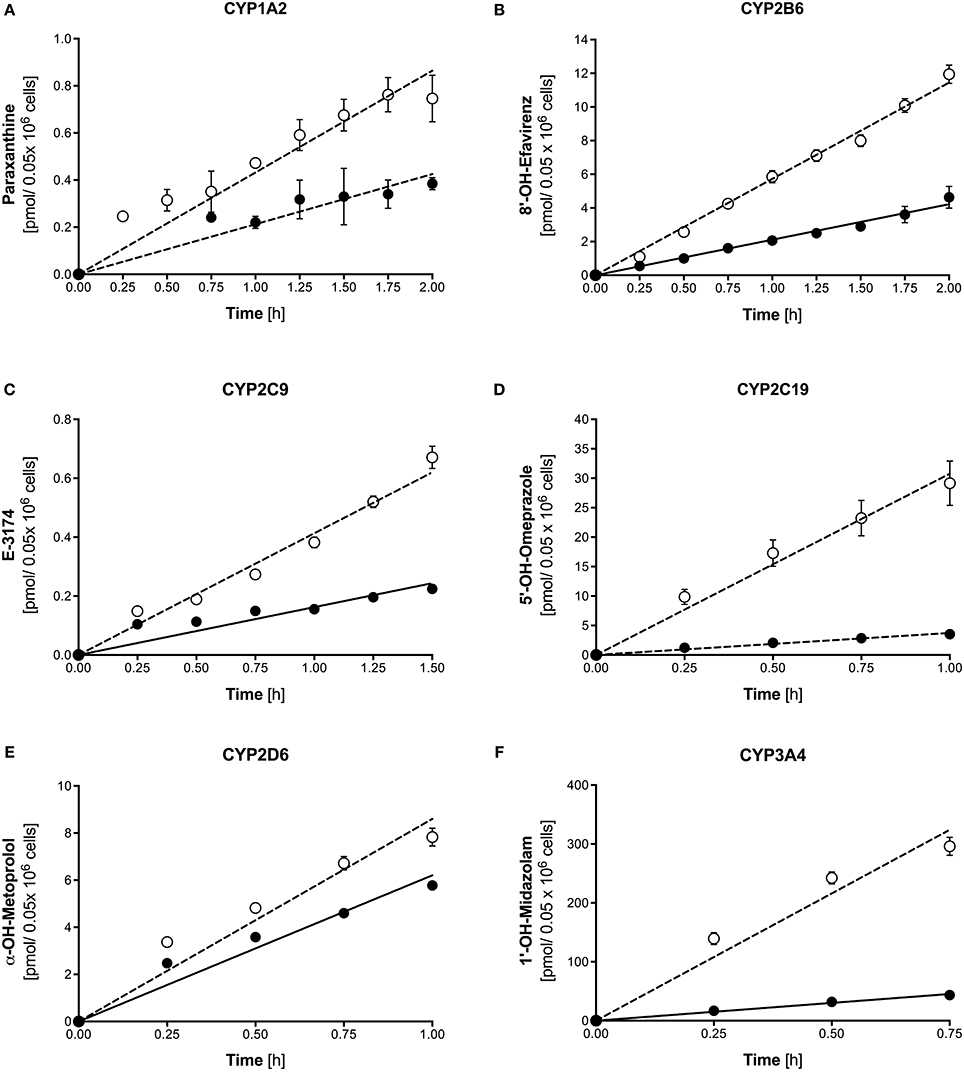
Figure 4. Formation of paraxanthine (A), 8′-OH-efavirenz (B), E-3174 (C), 5-OH-omeprazole (D), α-OH-metoprolol (E), and 1′-hydroxymidazolam (F) by 3D-cultured primary human hepatocytes after treatment with 20 μM rifampicin for 72 h (open symbols) compared to control cultures (closed symbols). Metabolite concentrations were determined by LC-MS/MS. The corresponding formation rates and regression coefficients in control cultures and after treatment with 20 μM rifampicin are given in Tables 2, 3. Data are presented as mean ± SEM of at least three independent experiments.
In agreement with the mRNA expression data after induction with rifampicin and basal CYP activity, metabolite formation could be determined for all substrates in HepaRG cells, and in 2D- and 3D-cultured PHHs, but not in HepG2 cells (Table 3). The highest activities were detected for CYP3A4 and CYP2C19 in 3D-cultured PHHs and in HepaRG cells. In HepG2 cells, only activities of CYP3A4 and 2C19 could be detected.
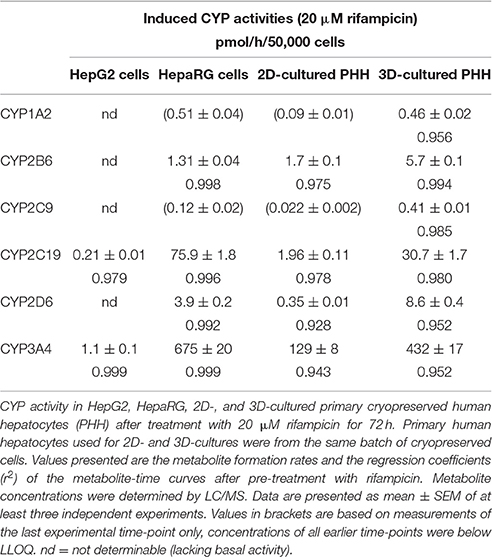
Table 3. Induced CYP activities.
Comparison Rifampicin-Induced CYP Activity In vitro and In vivo
Compared to baseline, CYP2C9 and CYP3A4 activities were increased 1.5–2 times in HepG2 cells without reaching statistical significance (Figure 5). In HepaRG cells, activities of CYP3A4, CYP2D6, 2C19, and 2B6 were increased significantly, with the exception of CYP2D6 matching well with the mRNA induction data. An almost identical result was obtained for 2D-cultured PHHs. In 3D-cultured PHHs, CYP activities of all inducible CYP isoforms were increased at least two-fold after rifampicin induction.
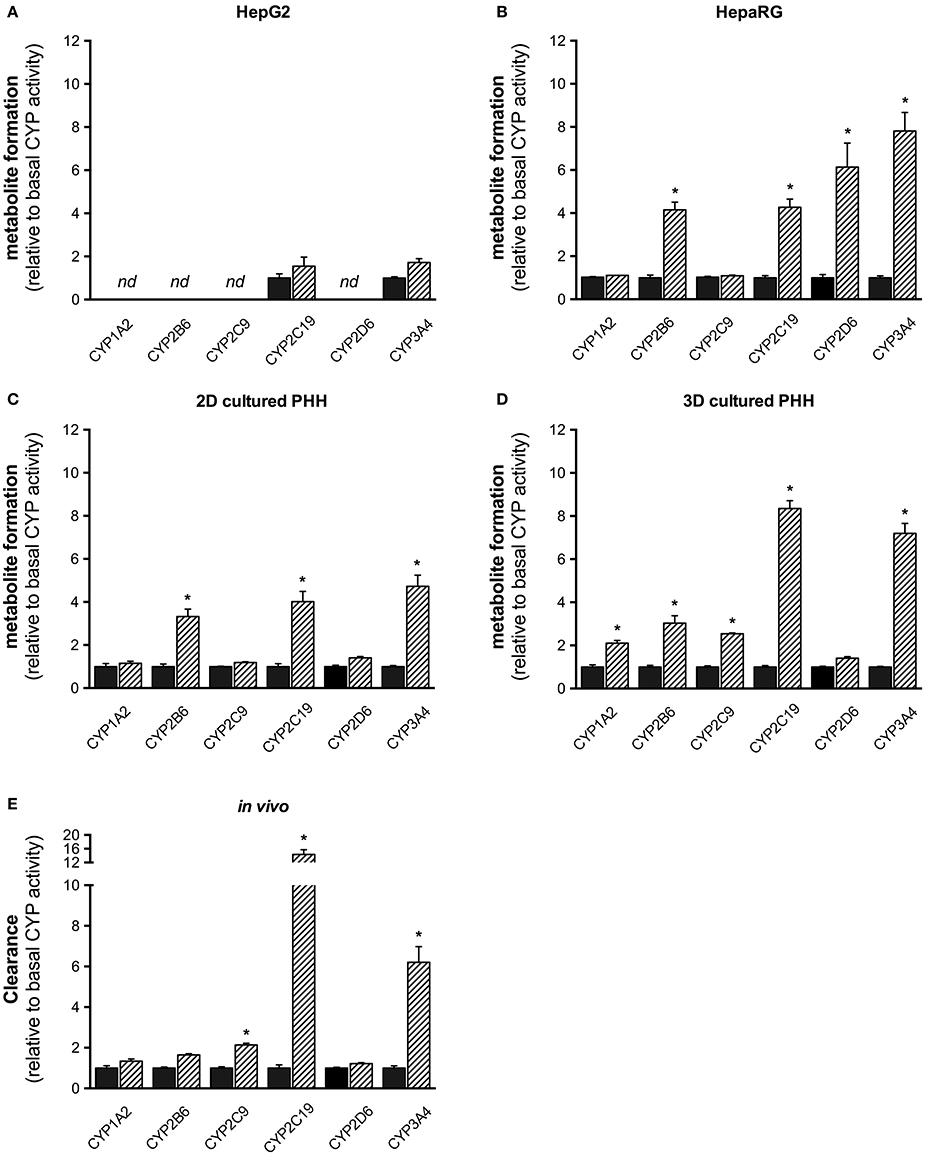
Figure 5. Fold increase (relative to non-induced control) of CYP activity in vitro in HepG2 (A), HepaRG (B), 2D-, and 3D-cultured primary human hepatocytes (C,D), and in vivo in healthy male subjects (E, n = 14 for CYP2C19 and CYP2D6; n = 15 for all other CYP isoforms) after treatment with rifampicin. Hepatocyte cell lines were treated with 20 μM rifampicin for 72 h and healthy volunteers with 600 mg rifampicin per day for 7 days as described in the Materials and Methods Section. Metabolite and parent drug concentrations were determined by LC-MS/MS. Results are expressed as mean ± SEM. PHH, primary human hepatocytes. *p < 0.05 vs. control.
Treatment of healthy volunteers with rifampicin (Derungs et al., 2016) was associated with an approximately seven-fold induction of CYP3A4, a 14-fold induction of CYP2C19, a doubling of CYP2C9 activity and an ~1.7-fold increase in CYP2B6 activity. When compared to the liver cell models investigated, this pattern was reflected best by the 3D-cultured PHHs.
Discussion
This study confirms that basal mRNA expression and CYP activity as well as CYP inducibility show large differences between in vitro used hepatocyte cell models and, depending on the hepatocyte model used, that the in vivo characterized Basel phenotyping cocktail is suitable for CYP induction experiments in vitro.
HepG2 cells represent a hepatoma cell line, which is used extensively for toxicological studies but less frequently for studies of drug metabolism (Yoshitomi et al., 2001; Xu et al., 2004; Zahno et al., 2011). Drug metabolism is difficult to assess with this cell line since CYPs show weak mRNA expression and activity (Donato and Castell, 2003; Westerink and Schoonen, 2007a; Gerets et al., 2012). In this point, the results of the current investigation are in agreement with these previous studies. In the basal state, mRNA expression was clearly lower than in the other cell types for every CYP investigated and the activity could reliably be determined only for CYP3A4 and CYP2C19. CYP induction with rifampicin resulted in a significant four-fold increase in the CYP3A4 mRNA, which was only partially reflected in a corresponding increase in CYP3A4 activity. A limited inducibility of the CYP3A and CYP2C families in HepG2 cells has also been shown in other studies (Donato and Castell, 2003; Gerets et al., 2012) and has been attributed to a low expression of the nuclear receptors CAR and PXR (Aninat et al., 2006; Guillouzo et al., 2007), which are mediating the induction of the CYP2C and 3A families (Xu et al., 2005). In contrast, inducibility of CYP1A2 (which we did not determine in our studies) has been shown to be maintained in HepG2 cells (Choi et al., 2015). CYP1A2 induction is mediated by the aryl hydrocarbon receptor (Xu et al., 2005), which is highly expressed in HepG2 cells (Aninat et al., 2006). In contrast to phase I enzyme activities, conjugation reactions appear to be maintained quite well in HepG2 cells (Westerink and Schoonen, 2007b). HepG2 cells can therefore only be used to answer very specific questions regarding drug metabolism.
HepaRG cells represent a hepatoma cell line, which has first been described in 2002 as a cell model suitable for HBV infection and propagation (Gripon et al., 2002). Soon after their first description, HepaRG cells were characterized and proposed for their use as a model for drug metabolism studies (Aninat et al., 2006). The gene expression profile shows profound differences compared to HepG2 cells, explaining the observed differences in their drug metabolism phenotype (Jennen et al., 2010). HepaRG cells have also been used in drug toxicity studies, particularly, when active metabolites are suspected (Guillouzo et al., 2007; Gerets et al., 2012). Considering the current study, HepaRG cells were clearly a more suitable hepatocyte model for studying drug metabolism than HepG2 cells. mRNA expression could be detected for all CYPs investigated and was inducible except for CYP1A2 and 2D6. Lack of CYP1A2 induction is not a problem of the cell line, but of rifampicin, which was used as a CYP inducer. As shown in vitro (Gerets et al., 2012; Choi et al., 2015) and in vivo (Derungs et al., 2016), rifampicin is a good inducer for the CYP2C and 3A families, but not for CYP1A2. With specific CYP1A2 inducers such as 3-methylcholanthrene CYP1A2 can be induced in HepaRG cells on both the mRNA and the activity level (Aninat et al., 2006; Guillouzo et al., 2007). CYP2D6 has a low activity in HepaRG cells, possibly because the cell line originates from a slow CYP2D6 metabolizer (Guillouzo et al., 2007), and it cannot be induced with rifampicin (Gerets et al., 2012).
Interestingly, the activity for CYP3A4 and 2C19 were higher in HepaRG cells as compared to 3D-cultured PHHs, whereas the corresponding mRNA expressions (relative to GAPDH) were lower. This could be a problem of standardization to GAPDH (different GAPDH expression in HepaRG cells and primary hepatocytes) or a bad correlation between mRNA levels and protein expression and/or activity. In the study of Choi et al. (2015), GAPDH mRNA expression was quite stable among different hepatocyte cell lines, arguing against the first possibility. On the other hand, it is well established that posttranslational modifications such as acetylation, glycosylation, and phosphorylation can have a large impact on protein activity (Glanemann et al., 2003), favoring the second possibility. In our study, the CYP activity profile and inducibility of HepaRG cells were more closely related to primary hepatocytes than to HepG2 cells.
Primary hepatocytes are currently considered to be the gold standard for drug metabolism studies. By using the same batch of human cryopreserved hepatocytes in the 2D- and 3D-cultures, we were able to estimate whether the 3D environment would lead to differences in CYP activity and/or expression compared to the 2D-cultures. Indeed, in comparison to 2D-cultures, 3D-cultured PHHs exhibited a higher CYP mRNA expression, a higher basal CYP activity and a better inducibility. In comparison to the in vivo results regarding CYP induction, 3D-cultured PHHs showed a better agreement than the other cell lines tested, suggesting that they could be usable to predict the induction potential of new drugs. Hepatocyte 3D-cultures are currently being developed and characterized as an alternative to 2D-cultures in order to overcome well-known drawbacks of 2D-cultures such as varying expression of CYP activities, varying CYP inducibility and loss of differentiation over time (Aninat et al., 2006; Halladay et al., 2012). Assuming that 3D-cultures of PHHs may offer advantages compared to the corresponding 2D-cultures, many 3D-hepatocyte models have been and are currently being explored for drug metabolism and drug toxicity studies (Godoy et al., 2013; Schyschka et al., 2013; Astashkina and Grainger, 2014; Roth and Singer, 2014).
We performed our studies with a co-culture system using 3T3-Swiss albino mouse fibroblasts as feeder cells for human cryopreserved primary hepatocytes. This system has originally been described in detail by Ohkura et al. (2014) who characterized it regarding the mRNA expression of phase I and phase II drug metabolism enzymes and demonstrated its capacity to produce metabolites from different drugs. The model uses special plates coated with a block co-polymer that allows the fibroblasts and hepatocytes to only adhere to certain areas of the wells. In time, the mouse fibroblasts and human cryopreserved hepatocytes are able to form 3D structures described as spheroids. Spheroids can be regarded as a cell aggregation with an energy- and surface-minimized structure that, according to van Zijl et al. (van Zijl and Mikulits, 2010) mimic the in vivo situation quite efficiently regarding cell shape and cellular environment. The results of our study support this assumption.
After having been characterized in vivo (Donzelli et al., 2014; Derungs et al., 2016), the substrate cocktail showed a satisfactory performance also in vitro. Critical substrates were losartan (CYP2C9) and caffeine (CYP1A2), which were metabolized at a low rate even in 3D-cultured PHHs and showed no significant metabolism in HepG2 cells. On the other hand, they correctly reflected CYP2C9 induction by rifampicin and CYP1A2 induction by 3-methylcholanthrene. Depending on the question to be answered and on the cell system used, they could be replaced by phenacetin (CYP1A2) and diclofenac (CYP2C9), which have been shown to be suitable substrates in vitro (Youdim et al., 2007; Mori et al., 2009; Halladay et al., 2012).
In conclusion, our studies demonstrate that the 3D-PHH spheroid culture system is suitable for the assessment of drug metabolism and CYP induction in vitro. Among the four tested cell systems, 3D-cultured PHHs best reflect CYP inducibility in vivo. HepaRG cells are close to 3D-cultured PHHs but induced CYP activities correlate less well with CYP induction in vivo. HepG2 cells are known to predict CYP1A2 induction but are less suitable for CYPs of the 2C and 3A family. The substrates of the Basel phenotyping cocktail only show minimal interactions in vitro and the cocktail is thus usable for the assessment of CYP induction in vitro.
Author Contributions
BB performed research, interpreted data, and wrote manuscript. MD performed research, interpreted data. SM provided research tools. FB provided research tools, interpreted data. AR provided research tools, interpreted data. SK designed research, interpreted data, wrote manuscript. MH designed research, interpreted data, wrote manuscript.
Funding
SK was supported by a grant of the Swiss National Science Foundation (SNF 31003A_156270).
Conflict of Interest Statements
The authors declare that the research was conducted in the absence of any commercial or financial relationships that could be construed as a potential conflict of interest.
Acknowledgments
We would like to thank Nathalie Schaub, Evelyne Durr, François Singh, Annalisa Bonifacio, Beatrice Vetter, and Urs Duthaler for their valuable advice and technical support.
Supplementary Material
The Supplementary Material for this article can be found online at: http://journal.frontiersin.org/article/10.3389/fphar.2016.00443/full#supplementary-material
Supplementary Figure 1. (A) Activity of CYP1A2 assessed using caffeine-N3-demethylation in 3D-cultured primary cryopreserved human hepatocytes after treatment with 3-methylcholanthrene (2 μM; open symbols) for 72 h compared to control cultures (closed symbols). (B) Fold increase (relative to non-induced control) of CYP1A2 mRNA levels after treatment of 3D-cultured primary human hepatocytes with 3-methylcholanthrene (2 μM) for 72 h. mRNA levels were determined using rtPCR as described in the Materials and Methods Section. mRNA expression in control cultures and after treatment with 3-methylcholanthrene was first normalized to the respective GAPDH expression. Data are given as mean ± SEM of at least three independent experiments. *p < 0.05 vs. control.
Supplementary Figure 2. Chemical structures of the probe drugs and their phase I metabolites of the Basel phenotyping cocktail.
References
Abadie-Viollon, C., Martin, H., Blanchard, N., Pekthong, D., Bachellier, P., Mantion, G., et al. (2010). Follow-up to the pre-validation of a harmonised protocol for assessment of CYP induction responses in freshly isolated and cryopreserved human hepatocytes with respect to culture format, treatment, positive reference inducers and incubation conditions. Toxicol. In Vitro 24, 346–356. doi: 10.1016/j.tiv.2009.05.021
Aninat, C., Piton, A., Glaise, D., Le Charpentier, T., Langouët, S., Morel, F., et al. (2006). Expression of cytochromes P450, conjugating enzymes and nuclear receptors in human hepatoma HepaRG cells. Drug Metab. Dispos. 34, 75–83. doi: 10.1124/dmd.105.006759
Astashkina, A., and Grainger, D. W. (2014). Critical analysis of 3-D organoid in vitro cell culture models for high-throughput drug candidate toxicity assessments. Adv. Drug Deliv. Rev. 69–70, 1–18. doi: 10.1016/j.addr.2014.02.008
Bosilkovska, M., Samer, C. F., Déglon, J., Rebsamen, M., Staub, C., Dayer, P., et al. (2014). Geneva cocktail for cytochrome p450 and P-glycoprotein activity assessment using dried blood spots. Clin. Pharmacol. Ther. 96, 349–359. doi: 10.1038/clpt.2014.83
Chainuvati, S., Nafziger, A. N., Leeder, J. S., Gaedigk, A., Kearns, G. L., Sellers, E., et al. (2003). Combined phenotypic assessment of cytochrome p450 1A2, 2C9, 2C19, 2D6, and 3A, N-acetyltransferase-2, and xanthine oxidase activities with the “Cooperstown 5+1 cocktail”. Clin. Pharmacol. Ther. 74, 437–447. doi: 10.1016/S0009-9236(03)00229-7
Choi, J. M., Oh, S. J., Lee, S. Y., Im, J. H., Oh, J. M., Ryu, C. S., et al. (2015). HepG2 cells as an in vitro model for evaluation of cytochrome P450 induction by xenobiotics. Arch. Pharm. Res. 38, 691–704. doi: 10.1007/s12272-014-0502-6
Christensen, M., Andersson, K., Dalén, P., Mirghani, R. A., Muirhead, G. J., Nordmark, A., et al. (2003). The Karolinska cocktail for phenotyping of five human cytochrome P450 enzymes. Clin. Pharmacol. Ther. 73, 517–528. doi: 10.1016/S0009-9236(03)00050-X
Derungs, A., Donzelli, M., Berger, B., Noppen, C., Krähenbühl, S., and Haschke, M. (2016). Effects of cytochrome P450 inhibition and induction on the phenotyping metrics of the basel cocktail: a randomized crossover study. Clin. Pharmacokinet. 55, 79–91. doi: 10.1007/s40262-015-0294-y
Donato, M. T., and Castell, J. V. (2003). Strategies and molecular probes to investigate the role of cytochrome P450 in drug metabolism: focus on in vitro studies. Clin. Pharmacokinet. 42, 153–178. doi: 10.2165/00003088-200342020-00004
Donzelli, M., Derungs, A., Serratore, M. G., Noppen, C., Nezic, L., Krähenbühl, S., et al. (2014). The basel cocktail for simultaneous phenotyping of human cytochrome P450 isoforms in plasma, saliva and dried blood spots. Clin. Pharmacokinet. 53, 271–282. doi: 10.1007/s40262-013-0115-0
Fuhr, U., Jetter, A., and Kirchheiner, J. (2007). Appropriate phenotyping procedures for drug metabolizing enzymes and transporters in humans and their simultaneous use in the “cocktail” approach. Clin. Pharmacol. Ther. 81, 270–283. doi: 10.1038/sj.clpt.6100050
Gerets, H. H., Tilmant, K., Gerin, B., Chanteux, H., Depelchin, B. O., Dhalluin, S., et al. (2012). Characterization of primary human hepatocytes, HepG2 cells, and HepaRG cells at the mRNA level and CYP activity in response to inducers and their predictivity for the detection of human hepatotoxins. Cell Biol. Toxicol. 28, 69–87. doi: 10.1007/s10565-011-9208-4
Glanemann, C., Loos, A., Gorret, N., Willis, L. B., O'Brien, X. M., Lessard, P. A., et al. (2003). Disparity between changes in mRNA abundance and enzyme activity in Corynebacterium glutamicum: implications for DNA microarray analysis. Appl. Microbiol. Biotechnol. 61, 61–68. doi: 10.1007/s00253-002-1191-5
Godoy, P., Hewitt, N. J., Albrecht, U., Andersen, M. E., Ansari, N., Bhattacharya, S., et al. (2013). Recent advances in 2D and 3D in vitro systems using primary hepatocytes, alternative hepatocyte sources and non-parenchymal liver cells and their use in investigating mechanisms of hepatotoxicity, cell signaling and ADME. Arch. Toxicol. 87, 1315–1530. doi: 10.1007/s00204-013-1078-5
Gripon, P., Rumin, S., Urban, S., Le Seyec, J., Glaise, D., Cannie, I., et al. (2002). Infection of a human hepatoma cell line by hepatitis B virus. Proc. Natl. Acad. Sci. U.S.A. 99, 15655–15660. doi: 10.1073/pnas.232137699
Guillouzo, A., Corlu, A., Aninat, C., Glaise, D., Morel, F., and Guguen-Guillouzo, C. (2007). The human hepatoma HepaRG cells: a highly differentiated model for studies of liver metabolism and toxicity of xenobiotics. Chem. Biol. Interact. 168, 66–73. doi: 10.1016/j.cbi.2006.12.003
Halladay, J. S., Wong, S., Khojasteh, S. C., and Grepper, S. (2012). An ‘all-inclusive’ 96-well cytochrome P450 induction method: measuring enzyme activity, mRNA levels, protein levels, and cytotoxicity from one well using cryopreserved human hepatocytes. J. Pharmacol. Toxicol. Methods 66, 270–275. doi: 10.1016/j.vascn.2012.07.004
Jennen, D. G., Magkoufopoulou, C., Ketelslegers, H. B., van Herwijnen, M. H., Kleinjans, J. C., and van Delft, J. H. (2010). Comparison of HepG2 and HepaRG by whole-genome gene expression analysis for the purpose of chemical hazard identification. Toxicol. Sci. 115, 66–79. doi: 10.1093/toxsci/kfq026
Livak, K. J., and Schmittgen, T. D. (2001). Analysis of relative gene expression data using real-time quantitative PCR and the 2(-Delta Delta C(T)) Method. Methods (San Diego, Calif) 25, 402–408. doi: 10.1006/meth.2001.1262
Morel, F., Beaune, P., Ratanasavanh, D., Flinois, J. P., Guengerich, F. P., and Guillouzo, A. (1990). Effects of various inducers on the expression of cytochromes P-450 IIC8, 9, 10 and IIIA in cultured adult human hepatocytes. Toxicol. In vitro 4, 458–460. doi: 10.1016/0887-2333(90)90100-8
Mori, K., Hashimoto, H., Takatsu, H., Tsuda-Tsukimoto, M., and Kume, T. (2009). Cocktail-substrate assay system for mechanism-based inhibition of CYP2C9, CYP2D6, and CYP3A using human liver microsomes at an early stage of drug development. Xenobiotica 39, 415–422. doi: 10.1080/00498250902822204
Ohkura, T., Ohta, K., Nagao, T., Kusumoto, K., Koeda, A., Ueda, T., et al. (2014). Evaluation of human hepatocytes cultured by three-dimensional spheroid systems for drug metabolism. Drug Metab. Pharmacokinet. 29, 373–378. doi: 10.2133/dmpk.DMPK-13-RG-105
Rodríguez-Antona, C., Jover, R., Gómez-Lechón, M. J., and Castell, J. V. (2000). Quantitative RT-PCR measurement of human cytochrome P-450s: application to drug induction studies. Arch. Biochem. Biophys. 376, 109–116. doi: 10.1006/abbi.2000.1697
Roth, A., and Singer, T. (2014). The application of 3D cell models to support drug safety assessment: opportunities & challenges. Adv. Drug Deliv. Rev. 69–70, 179–189. doi: 10.1016/j.addr.2013.12.005
Schyschka, L., Sánchez, J. J., Wang, Z., Burkhardt, B., Müller-Vieira, U., Zeilinger, K., et al. (2013). Hepatic 3D cultures but not 2D cultures preserve specific transporter activity for acetaminophen-induced hepatotoxicity. Arch. Toxicol. 87, 1581–1593. doi: 10.1007/s00204-013-1080-y
Spaggiari, D., Geiser, L., Daali, Y., and Rudaz, S. (2014). A cocktail approach for assessing the in vitro activity of human cytochrome P450s: an overview of current methodologies. J. Pharm. Biomed. Anal. 101, 221–237. doi: 10.1016/j.jpba.2014.03.018
van Zijl, F., and Mikulits, W. (2010). Hepatospheres: three dimensional cell cultures resemble physiological conditions of the liver. World J. Hepatol. 2, 1–7. doi: 10.4254/wjh.v2.i1.1
Westerink, W. M., and Schoonen, W. G. (2007a). Cytochrome P450 enzyme levels in HepG2 cells and cryopreserved primary human hepatocytes and their induction in HepG2 cells. Toxicol. In vitro 21, 1581–1591. doi: 10.1016/j.tiv.2007.05.014
Westerink, W. M., and Schoonen, W. G. (2007b). Phase II enzyme levels in HepG2 cells and cryopreserved primary human hepatocytes and their induction in HepG2 cells. Toxicol. In vitro 21, 1592–1602. doi: 10.1016/j.tiv.2007.06.017
Wilkinson, G. R. (2005). Drug metabolism and variability among patients in drug response. N. Engl. J. Med. 352, 2211–2221. doi: 10.1056/NEJMra032424
Xu, C., Li, C. Y., and Kong, A. N. (2005). Induction of phase I, II and III drug metabolism/transport by xenobiotics. Arch. Pharm. Res. 28, 249–268. doi: 10.1007/BF02977789
Xu, J. J., Diaz, D., and O'Brien, P. J. (2004). Applications of cytotoxicity assays and pre-lethal mechanistic assays for assessment of human hepatotoxicity potential. Chem. Biol. Interact. 150, 115–128. doi: 10.1016/j.cbi.2004.09.011
Yoshitomi, S., Ikemoto, K., Takahashi, J., Miki, H., Namba, M., and Asahi, S. (2001). Establishment of the transformants expressing human cytochrome P450 subtypes in HepG2, and their applications on drug metabolism and toxicology. Toxicol. In vitro 15, 245–256. doi: 10.1016/S0887-2333(01)00011-X
Youdim, K. A., Tyman, C. A., Jones, B. C., and Hyland, R. (2007). Induction of cytochrome P450: assessment in an immortalized human hepatocyte cell line (Fa2N4) using a novel higher throughput cocktail assay. Drug Metab. Dispos. 35, 275–282. doi: 10.1124/dmd.106.012864
Keywords: cytochrome P450 (CYP), basel cocktail, 3-dimensional spheroid primary human hepatocyte culture, CYP induction, liquid chromatography tandem mass spectrometry
Citation: Berger B, Donzelli M, Maseneni S, Boess F, Roth A, Krähenbühl S and Haschke M (2016) Comparison of Liver Cell Models Using the Basel Phenotyping Cocktail. Front. Pharmacol. 7:443. doi: 10.3389/fphar.2016.00443
Received: 07 September 2016; Accepted: 04 November 2016;
Published: 21 November 2016.
Edited by:
Olavi R. Pelkonen, University of Oulu, FinlandReviewed by:
John G. Quigley, University of Illinois at Chicago, USAGuanghua Zhao, China Agricultural University, China
Copyright © 2016 Berger, Donzelli, Maseneni, Boess, Roth, Krähenbühl and Haschke. This is an open-access article distributed under the terms of the Creative Commons Attribution License (CC BY). The use, distribution or reproduction in other forums is permitted, provided the original author(s) or licensor are credited and that the original publication in this journal is cited, in accordance with accepted academic practice. No use, distribution or reproduction is permitted which does not comply with these terms.
*Correspondence: Manuel Haschke, manuel.haschke@unibas.ch