Commentary: Energetic particle forcing of the Northern Hemisphere winter stratosphere: comparison to solar irradiance forcing
 Yoshihiro Tomikawa
- 1Space and Upper Atmospheric Sciences Group, National Institute of Polar Research, Tokyo, Japan
- 2Department of Polar Science, School of Multidisciplinary Sciences, SOKENDAI (The Graduate University for Advanced Studies), Tokyo, Japan
A commentary on
Energetic particle forcing of the Northern Hemisphere winter stratosphere: comparison to solar irradiance forcing
by Seppälä, A., and Clilverd, M. A. (2014). Front. Phys. 2:25. doi: 10.3389/fphy.2014.00025
The latest solar cycle minimum sometime around 2009 showed unusually low solar activity and suggested the possibility of a grand solar minimum in the near future [1]. This event caused much attention to be focused on studies regarding solar influence on the Earth's climate. The recent review by Gray et al. [2] classified solar forcing on the Earth's climate to be of four types: galactic cosmic rays, total solar irradiance (TSI), solar ultraviolet radiation (UV), and energetic particle precipitations (EPP). Although EPP has not attracted much attention compared with TSI and UV in the past, several recent studies indicate that EPP could have a significant impact on the Earth's climate, comparable with that of TSI and UV [3–5]. Seppälä and Clilverd ([6]; hereafter SC14) divided the past 54 boreal winters into solar maximum, solar minimum, and high energetic particle forcing (EPF) years based on the F10.7 radio flux and the Ap index. SC14 produced composite figures for each group using the latest meteorological reanalysis data. SC14 identified a downward-propagating zonal wind anomaly during high EPF years and attributed it to the top-down mechanism common to the downward-propagating zonal wind anomaly induced by UV variations [7]. Although the stimulating results of SC14 are attracting much attention, I would like to point out that there is a significant error in these results.
Figure 2 in SC14 shows composites of monthly- and zonal-mean zonal wind anomalies for October through February for high EPF, solar minimum, and solar maximum conditions. Figure 1 of this manuscript was created using the same method (i.e., a composite of monthly- and zonal-mean zonal wind anomalies in each month for each condition) and the same blended ERA-40 (i.e., 1958–1988; [8]) and ERA-Interim (i.e., 1989–2012; [9]) reanalysis data. It has been found that these two figures (i.e., Figure 2 of SC14 and Figure 1 of this manuscript) are the same in January and February, but clearly different from October through December. However, the figures from October through December become the same when those data are shifted back by 1 year as shown in Figure S1 in the Supplementary Material. This indicates that the analysis in SC14 was applied not to five consecutive months (i.e., 10, 11, 12, 1, and 2) but to 5 months in the same year (i.e., 1, 2, 10, 11, and 12). This error has a significant impact on the results presented in SC14. In particular, no significant difference between the high EPF and the solar maximum conditions is observed in November, which indicates that the difference of circulation anomalies between the high EPF and the solar maximum conditions reported cannot be detected in the reanalysis data. It is probably because November is dynamically less active than the subsequent months and there are eight overlapping years between the high EPF (13 years) and the solar maximum (12 years) conditions.
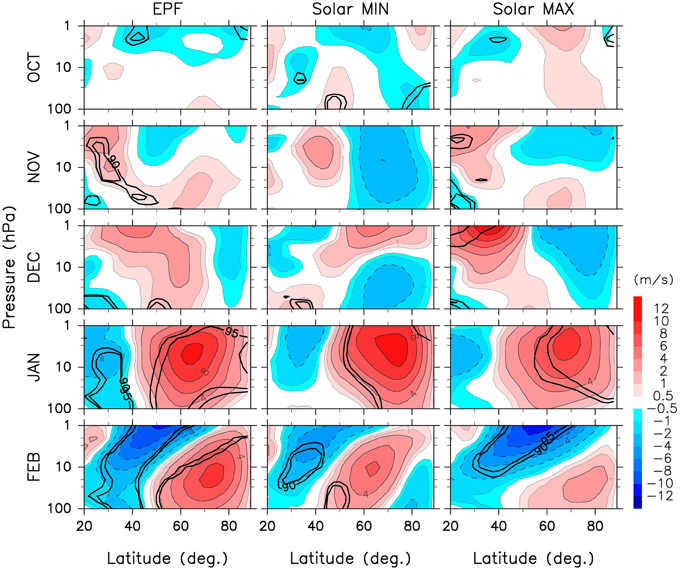
Figure 1. Latitude–pressure sections of monthly- and zonal-mean zonal wind anomalies from October through February in the northern hemisphere for high EPF (left), solar minimum (middle), and solar maximum (right) conditions. Thin contour lines are shown for ±0.5, ±1, ±2, ±4, ±6, ±8, ±10, and ±12 m/s. Thick solid lines represent the 90 and 95% confidence levels obtained by the two-tailed Student's t-test.
Another issue in SC14 is that the authors show anomalies from the climatology (i.e., a 54-year average). Although the years where stratospheric sudden warmings (SSW) that occurred in the northern hemisphere were excluded from the above three groups, the SSW years were included in the climatology. It means that the anomaly of each group from the climatology included the effect of absence of SSWs. Thus, it is impossible to identify whether their anomalies from the climatology are induced by the absence of SSWs or by the status of solar activity and EPP.
The authors of SC14 have published many advanced, intriguing studies concerning solar influences on the Earth's climate. However, the interpretation of the results in this area requires extra care because of the short period of available reanalysis data (i.e., about 60 years) and contamination by other factors, such as global warming or cooling, quasi-biennial oscillation, El Niño-Southern Oscillation, and volcanic eruptions, as pointed out by the authors themselves [10]. Since the authors of SC14 are leading the research community on climate impact of energetic particle precipitations and many researchers pay attention to their conclusions, publication of any results requires extreme caution.
Funding
The production of this study was supported by an NIPR publication subsidy.
Conflict of Interest Statement
The author declares that the research was conducted in the absence of any commercial or financial relationships that could be construed as a potential conflict of interest.
Acknowledgments
A figure was drawn using Dennou Club Library (DCL). The author would like to thank Enago (www.enago.jp) for the English language review.
Supplementary Material
The Supplementary Material for this article can be found online at: https://www.frontiersin.org/article/10.3389/fphy.2015.00068
Figure S1. Same as Figure 1 except that the data from October through December are shifted back by 1 year.
References
1. Steinhilber F, and Beer J. Prediction of solar activity for the next 500 years. J Geophys Res. (2013) 118:1861–7. doi: 10.1002/jgra.50210
2. Gray LJ, Beer J, Geller M, Haigh JD, Lockwood M, Matthes K, et al. Solar influences on climate. Rev Geophys. (2010) 48:RG4001. doi: 10.1029/2009rg000282
3. Lu H, Clilverd MA, Seppälä A, and Hood LL. Geomagnetic perturbations on stratospheric circulation in late winter and spring. J Geophys Res. (2008) 113:D16106. doi: 10.1029/2007jd008915
4. Jackman CH, Marsh DR, Vitt FM, Garcia RR, Randall CE, Fleming EL, et al. Long-term middle atmospheric influence of very large solar proton events. J Geophys Res. (2009) 114:D11304. doi: 10.1029/2008jd011415
5. Seppälä A, Lu H, Clilverd MA, and Rodger CJ. Geomagnetic activity signatures in winter time stratosphere wind, temperature, and wave response. J Geophys Res. (2013) 118:2169–83. doi: 10.1002/jgrd.50236
6. Seppälä A, and Clilverd MA. Energetic particle forcing of the Northern Hemisphere winter stratosphere: comparison to solar irradiance forcing. Front Phys. (2014) 2:25. doi: 10.3389/fphy.2014.00025
7. Kodera K, Kuroda Y. Dynamical response to the solar cycle: winter stratopause and lower stratosphere. J Geophys Res. (2002) 107:4749. doi: 10.1029/2002jd002224
8. Uppala SM, Kållberg PW, Simmons AJ, Andrae U, Bechtold VDC, Fiorino M, et al. The ERA-40 re-analysis. Q J R Meteorol Soc. (2005) 131:2961–3012. doi: 10.1256/qj.04.176
9. Dee DP, Uppala SM, Simmons AJ, Berrisford P, Poli P, Kobayashi S, et al. The ERA-Interim reanalysis: configuration and performance of the data assimilation system. Q J R Meteorol Soc. (2011) 137:553–97. doi: 10.1002/qj.828
Keywords: energetic particle precipitation, statistical significance, reanalysis data, stratosphere, solar cycle
Citation: Tomikawa Y (2015) Commentary: Energetic particle forcing of the Northern Hemisphere winter stratosphere: comparison to solar irradiance forcing. Front. Phys. 3:68. doi: 10.3389/fphy.2015.00068
Received: 08 July 2015; Accepted: 13 August 2015;
Published: 27 August 2015.
Edited by:
Eugene V. Rozanov, Physikalisch-Meteorologisches Observatorium Davos and World Radiation Center, SwitzerlandReviewed by:
Andreas Josef Gerhard Baumgaertner, University of Colorado, USAIrina Alexandrovna Mironova, St. Petersburg State University, Russia
Copyright © 2015 Tomikawa. This is an open-access article distributed under the terms of the Creative Commons Attribution License (CC BY). The use, distribution or reproduction in other forums is permitted, provided the original author(s) or licensor are credited and that the original publication in this journal is cited, in accordance with accepted academic practice. No use, distribution or reproduction is permitted which does not comply with these terms.
*Correspondence: Yoshihiro Tomikawa, tomikawa@nipr.ac.jp