Hydrodynamic Red Blood Cells Deformation by Quantitative Phase Microscopy and Zernike Polynomials
 Pasquale Memmolo
 Lisa Miccio
  Francesco Merola
 Martina Mugnano
- National Research Council of Italy, Institute of Applied Sciences and Intelligent Systems “E. Caianiello”, Pozzuoli, Italy
Red Blood Cells (RBCs) deformability is an important parameter for evaluating their health status. Its quantification is performed through the measurement of erythrocyte's shape stiffness when subjected to external stimuli. Here, we exploit the hydrodynamic deformation of RBCs in microfluidic channels to quantify the shape variations through quantitative phase imaging by digital holography. In particular, two main processing steps have been employed, i.e., the morphological analysis based on quantitative phase variations and a new way to monitor the entire cell's deformation, based on modeling RBCs as a micro-lenses array. In fact, taking advantage of the RBC lens behavior, it is possible to correlate optical aberrations generated by the mechanical stimulus to the entire membrane deformation itself, through a numerical analysis based on Zernike polynomials. We provide a proof of principle of how to use Zernike analysis for characterizing RBCs' deformability under hydrodynamic stress. We demonstrate that new optical parameters of RBCs can be measured and analyzed, thus opening the route to the exploitation of the bio-lens model as a biomechanical marker of RBCs.
Introduction
Microfluidics engineering for lab-on-chip devices has been largely investigated in the last years as it provides miniaturization down to micro scale to realize cheap portable devices for point-of-care diagnostics [1–3]. Many reasons exist for microfluidics development such as more precise fabrication processes or the possibility, in biology, to achieve single-cell analysis [2, 3]. Hydrodynamic forces are fundamental components in the microfluidics environment and they have been exploited for many purposes as dissociation of cell aggregates [4] or cell sorting [5] besides industrial applications concerning liquid-liquid emulsions [6].
Here, the hydrodynamic pressure is investigated for inducing mechanical deformation of erythrocytes in micro-channels [7]. Red Blood Cells (RBCs) are responsible for gas exchanges in all the tissues of the body, so they are continuously flowing and need a high degree of deformability to pass across veins and capillaries. Modifications of RBC deformability is an indication of blood diseases [8]. In addition, aging effects can impact the RBC deformability in stored blood [9–11]. Several techniques have been adopted for studying mechanical properties of RBCs. Many of them are based on the design of specific microfluidic channels [12–15], and on various electrical/optical techniques, such as atomic force microscopy [16], dielectrophoresis [17], and optical trapping techniques [18, 19] or acoustic-based approaches [20].
Recently, we demonstrated that, by combining Holographic Optical Tweezers (HOT) and Digital Holography (DH), it is possible to measure the mechanical deformation induced on RBCs [21]. DH is a label-free imaging technique able to measure the complex wavefield diffracted by a sample object thus providing the Quantitative Phase Map (QPM) of the optical path displacement it introduces [22]. Moreover, DH is particularly suited in the microfluidic environment and very efficient in characterizing pure phase object as biological samples [23–25]. Specifically, in the case of RBCs, it has been demonstrated that they behave as microfluidic lenses with proper focal lengths and magnifications [26]. This property allows to model the wavefront diffracted by an RBC as a linear combination of Zernike polynomials. This paradigm has been theoretically demonstrated and experimentally verified also for diagnostic purposes [27–29].
Here, we exploit the modeling of RBCs as microlenses arrays for the label-free characterization of their hydrodynamic deformation, thus demonstrating for the first time, to the best of our knowledge, an alternative analysis tool with respect to the conventional ones. Actually, we provided the proof of principle of the proposed analytical tool, by extending the paradigm proposed in Merola et al. [21] to the case of hydrodynamic deformation of RBCs, as it is employed to measure the changes in the Zernike coefficient to quantify morphological changes in a more accurate and comprehensive modality. In particular, the improvement of the presented work stands in avoiding OT for exerting mechanical stresses on the RBC, thus simplifying the optical set-up, and exploiting the hydrodynamic forces exerted on the cell by the same fluid where these are immersed in. Holographic recordings of the RBCs subjected to the hydrodynamic stress are numerically processed for retrieving the morphometric features from the reconstructed QPMs. Then, the biomechanics of the RBC is evaluated by implementing the Zernike analysis. We show that new parameters can be measured and analyzed, thus opening the route in considering these as novel biomechanical markers of RBCs.
Materials and Methods
Sample Preparation and Isolation of Erythrocytes
The blood samples were collected from a healthy volunteer (one of the co-authors), who gave the informed consent according to European Ethics Guidelines. In particular, the experiments were conducted with the full respect for the European Charter of Fundamental Rights (2000/C 364/01, Article 3, Article 8). All experiments are performed with the heparinized blood drawn within the hour before use. The sample is prepared as follows: ~3 mL of heparinized whole blood are withdrawn into a hematocrit tube. Blood is centrifuged at the room temperature, for 15 min at 2,500 rpm in order to separate it into its component parts (plasma, buffy coat and RBCs at the bottom of the centrifuge tube). The pellet (≈1.5 mL) is collected and 100 μL of erythrocytes are diluted with a saline solution of 0.90% w/v of Sodium chloride (NaCl) in sterile water up to a final volume of 2 mL. Then, two cell concentrations were used for the experiment, i.e., ~10,000 and ~50,000/ml. Cells were counted by using a Burker chamber hemocytometer. It is worth noting that a higher concentration can be used up to a limit corresponding to the number of cells attached to the bottom of the channel in a single monolayer. The osmolarity of the medium is about 308 mOsm/L and it is isotonic with the membrane of RBCs. No visible hemolysis occurs.
Experimental Set-Up and Procedure
The experimental setup is described in Merola et al. [28]. Essentially, a microfluidic chip is imaged by a 532 nm continuous wave green laser, acting as the coherent source for a Mach-Zehnder interferometer. A microscope objective (60x, 1.2 NA) provides the magnification of the system and a CCD camera (1,024 × 1,024 pixels in full frame) records the generated interference patterns.
Two hundred microliter of RBC suspension, opportunely separated from plasma, and other blood components as described above, are injected into the microchannel by a syringe pump. After 10 min, RBCs are deposited and attached on the bottom of the channel. At this point, a hydrodynamic pressure through the flow is applied by the syringe and it is reflected in a deformation exerted on the cells lying on the ground of the channel. This pressure is able to deform the RBC along the direction of the flow, as sketched in Figure 1. Depending on the pressure, i.e., on the flow speed, it is possible to regulate the amount of the cell's shape deformation. This, in turn, will affect the optical properties of the RBC modeled as a lens, generating different orders of aberrations.
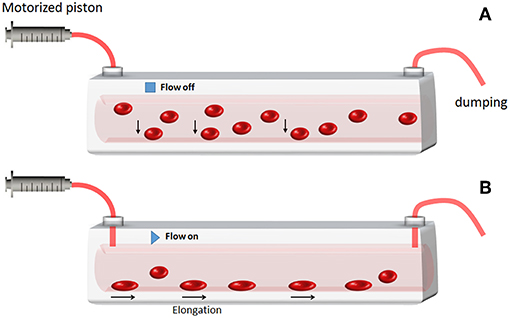
Figure 1. Sketch of the RBC deformation under hydrodynamic pressure. (A) Some RBCs injected in the channel fall under gravity at the bottom. (B) After 10 min time, RBCs are deposited and attached on the bottom of the channel. Then, by enhancing the flow speed/pressure the RBCs that were anchored at the bottom undergo membrane deformation.
Results
We record holographic videos to investigate the hydrodynamic effect of the microfluidic flow on attached RBCs. Each digital hologram is reconstructed by looking for the focus plane of the assembled RBCs through the Tamura metric [30]. Then, the wrapped phase image is recovered from the reconstructed complex wavefield. Therefore, the variation of the RBCs shape, caused by the fluid pressure, can be monitored, and quantified in real-time by QPMs. In the Figure 2, we show two experimental cases, with different initial concentration of cells in the field of view, in which attached RBCs are monitored before (Figures 2A,C) and after (Figures 2B,D) applying the hydrodynamic stress. The RBCs shape deformation is clearly visible, as highlighted by the cell in the red squares in Figures 2A,B (Supplementary Videos 1, 2 report two holographic reconstruction sequences in which the hydrodynamic stress is applied for about 30 s). In order to quantify such shape deformations, we compare two methods, i.e., the morphological characterization of the RBCs shape and the equivalent aberration changes when RBCs are modeled as micro-lenses. In both cases, each phase image of the holographic reconstruction sequence is segmented to isolate all RBCs and calculate their morphometric features as well as aberrations through Zernike polynomials.
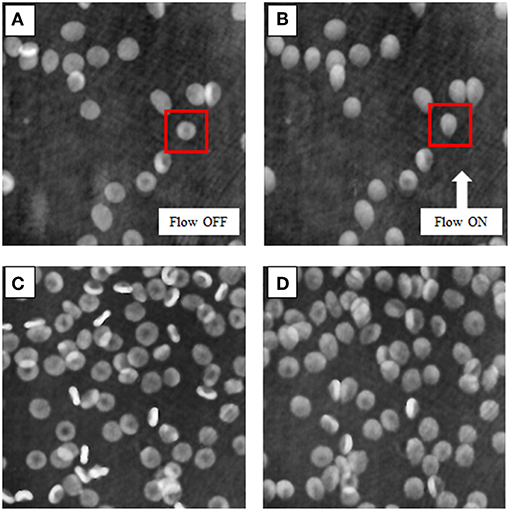
Figure 2. Quantitative phase reconstructions of RBCs. (A,C) report the RBCs before the deformation induced by the flow pressure in the two experimental cases, i.e., with different concentrations, ~10,000/ml and ~50,000/ml, respectively. (B,D) show the effect of the hydrodynamic stress on the RBC membranes when the flow is activated. The red squares highlight the higher shape change in this example (see Supplementary Videos 1, 2 for the entire holographic reconstruction sequences).
Morphological Analysis
We investigate the morphological variation of the RBCs' shape by calculating morphometric operators on reconstructed phase images. Let ΦRBC(k) be the phase shift of a single RBC at the frame k, isolated after the image segmentation process. We calculate the deformation coefficients, εF(k) and εO(k), related to the deformation along flow and orthogonal directions, respectively, the projected surface area S(k), the eccentricity E(k), the maximum phase value MPV(k) and the phase volume V(k).
In Equations (1–5), LF and LO are the RBC lengths in flow and orthogonal directions, respectively, N is the number of pixels within the cell region, p denotes the pixel size, M is the magnification of the optical systems, dfoci(k) is the distance between the foci of the best fitted ellipse and AM(k) denotes its major axis length.
In Figure 3 we report the evaluation of the RBC morphological changes in terms of the deformation coefficients of Equation 1. In particular, Figure 3A shows the phase difference between two frames acquired with 3.5 s time gap, while in Figure 3B, the deformation coefficients are evaluated by averaging the deformation of 13 RBCs in the field of view of Figure 3A, for each frame in that time interval, and the error bars are the corresponding standard deviations. The red circle in Figure 3B highlights the time when the pump pressure starts to work. Then, theRBCs' shapes change in a few milliseconds, reaching a constant deformation (see Supplementary Videos 1, 2). Actually, the lengths of the RBCs along the flow direction increases by about 5%, while the lengths decrease byabout 8% in the orthogonal one, thus showing a morphological variation that leads to an elliptical shape. Moreover, the projected surface area seems to be smaller than the initial one. In order to assess the effect of such shape changes on the biomechanical properties of RBCs, we evaluate the average behavior of deformed RBCs by calculating local and global phase variations through the MPV and the phase volume, respectively. In Figure 4 we report such metrics along with the average measure of the eccentricity and the surface area of monitored RBCs, along with their standard deviations indicated as error bars. It is worth noting that the eccentricity increases (Figure 4A), while the increase of the MPV is balanced by the decreasing of the projected surface area (see Figures 4B,C). However, these two variations do not influence the cell volume, as reported in Figure 4D. Therefore, eccentricity along with projected surface area and changes in MPV correspond to a redistribution of the hemoglobin content inside RBCs, caused by the hydrodynamic stress, which represents the main effect of the biomechanical deformation.
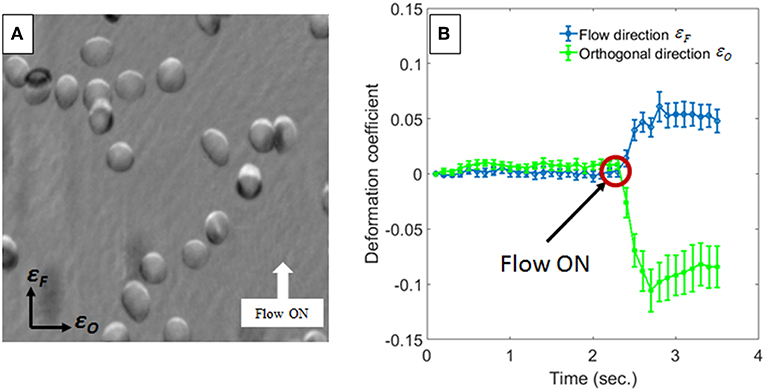
Figure 3. Measurements of RBCs deformation. In (A) the phase difference between two images taken before and after the hydrodynamic stress is reported. In (B) the average deformation coefficients with the corresponding standard deviations (i.e., the error bars), along orthogonal to the flow direction, calculated for all RBCs in (A), are shown. The red circle highlights the instant of time in which the pump pressure starts to work.
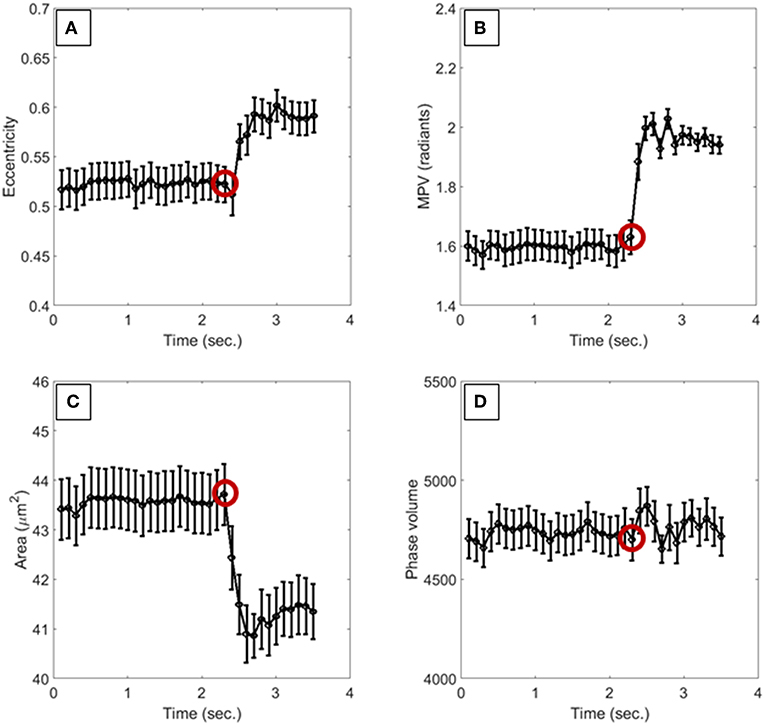
Figure 4. Morphological metrics used to monitor the biomechanical deformation of RBCs. (A) is the eccentricity, (B) reports the MVP, (C) is the surface area, and (D) measures the phase volume. The red circles highlight the instant of time in which the pump pressure starts to work. All values are averaged over the total number of cells, and the corresponding standard deviations are reported as error bars.
Bio-lensing Analysis
The modeling of RBCs as microlenses array has been recently demonstrated [26], successfully applied for diagnostics [28, 29], and to investigate biophysical properties of RBCs. In fact, in analogy to well-established wavefront analysis, based on the fitting by Zernike polynomials, it is possible to measure RBCs' morphological variations as lenses with specific aberrations, distorted by the transmitted light. In particular, the monitoring of RBCs' membranes' fluctuations [27] and the mechanical stress [21] induced by external forces, has been demonstrated. In the last case, HOT was employed to trap and stretch the cell membrane. Then, an accurate analysis of the wavefront allowed to retrieve the three-dimensional deformations experienced by RBCs under the action mechanical stress.
Here we employ the same paradigm to investigate the RBCs' deformation induced by hydrodynamic stresses. To do this, we apply the Zernike polynomials to fit the phase shift of each RBC during our experiments. Actually, we use the first 28 Zernike basis functions to fit the RBC shape, as denoted in the following equation.
In Equation 6 (x,y), are the pixel coordinates, Zj(x,y) is the jth Zernike basis function and cj is the jth Zernike coefficient. In the previous work [21], it has been demonstrated that the mechanical deformation of an RBC can be monitored through three main contribution of aberrations, namely FPA (Focus shift + Primary Astigmatism), SSA (Spherical aberration + Secondary Astigmatisms) and TC (Total Coma). In Equation 7 we highlight the aberration contributions used to define FPA, SSA and TC.
We apply this approach to all RBCs in Figure 2, from which three cases are reported, namely RBC 1, RBC 2, RBC 3, before (Figure 5A) and after (Figure 5C) the hydrodynamic stress. By analyzing the aberration contributions in Figures 5B,D, it is evident that the effect of hydrodynamic stress increases the TC intensity, mainly related to the vertical coma. Moreover, the vertical primary astigmatism in the FPA component becomes dominant with respect to the oblique one and the maximum value of FPA after the stress application is greater than the one obtained before.
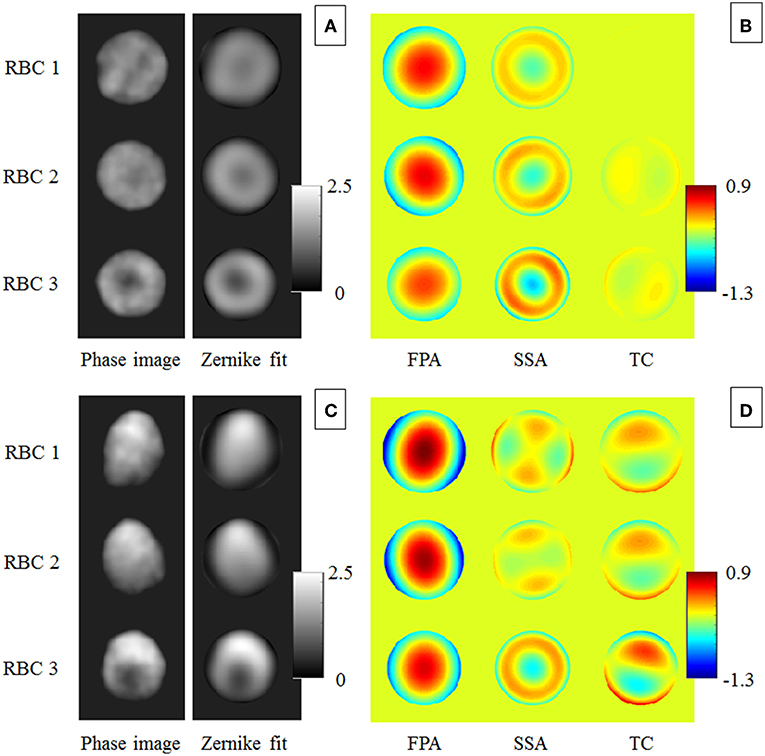
Figure 5. Bio-lensing metrics used to monitor the biomechanical deformation of RBCs. (A,C) report three RBCs, namely RBC1, RBC 2, and RBC 3 and the corresponding Zernike polynomials fitting before and after applying the hydrodynamic stress, respectively. In (B,D) the measured aberration contributions, namely FPA, SSA and TC are shown.
This means that the focal plane of the equivalent micro-lens moves farther from the RBC plane, i.e., the corresponding 4th Zernike coefficient increases. On the other hand, the third order spherical aberration, clearly visible in the SSA component of Figure 5A, becomes close to zero since the concavities of deformed RBCs vanish, except for RBC 3. These behaviors are summarized in Figure 6 where the normalized Zernike coefficients related to the vertical astigmatism, the vertical coma, the focus shift, and the third order spherical aberration are reported for the three RBCs in Figure 5. It is important to note that all morphological features, typically used to quantify particles deformation, are related to 2D shape variations. In fact, the deformation along flow and orthogonal directions, the projected surface area and the eccentricity measure a 2D effect of the hydrodynamic stress, while MVP just provides a qualitative evaluation of the 3D shape changes. Finally, the phase volume looks not affected by deformations, thus it does not provide any further information. Instead, the proposed analysis by Zernike polynomials adds new insights due to the 3D evaluation of the aberration changes. Although the single Zernike coefficient variations reported in Figure 6 provide similar information with respect the morphological parameters in Figure 4, the aberration contributions monitored by FPA, SSA and TC clearly show the 3D shape variation after the hydrodynamic stress. This open to the possibility to more detailed models for the deformation analysis of RBCs under flow stress by merging both morphological and Zernike analysis.
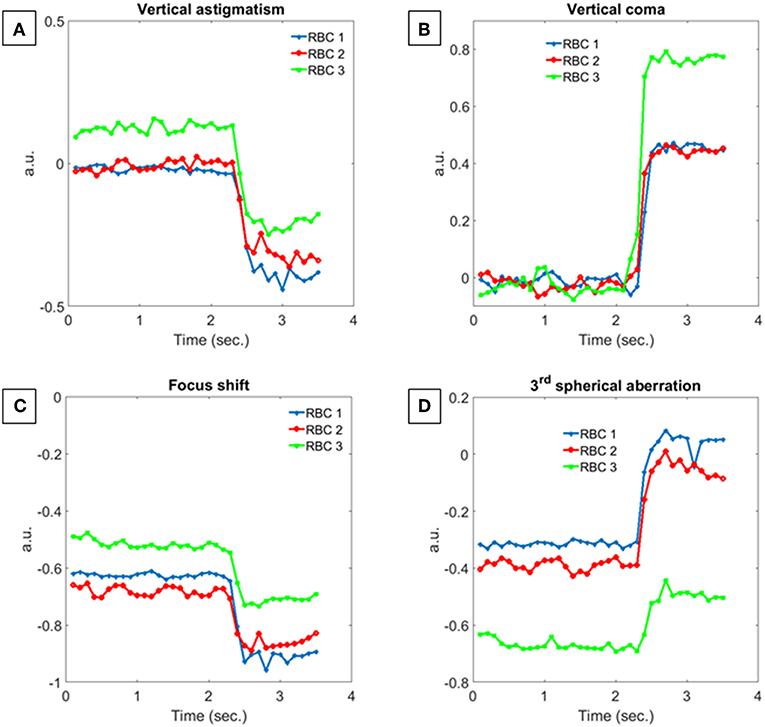
Figure 6. Normalized Zernike coefficients trend calculated for RBC 1, RBC 2 and RBC 3. (A) Vertical astigmatism, (B) vertical coma, (C) focus shift, and (D) third order spherical aberration.
Discussion
The proposed investigation focuses on an all-optical method for quantifying the hydrodynamic stress in a microfluidic environment. It has been demonstrated that the RBC lens effect allows to define a marker that identifies the strain exerted on the cells more efficiently than classical morphological video-based parameters. Our results demonstrate the possibility to study the biomechanical properties of RBCs thanks to the quantitative phase information provided by holographic imaging. In particular, two main processing have been employed, i.e., a 3D morphology analysis based on classical deformation parameters along with quantitative phase deformations related to phase peaks and volume variations. Then, we proposed a new way to monitor the entire cells' deformation, based on modeling RBCs as micro-lenses array. In this case, we test new markers for deformation measurements based on suitable combinations of the bio-lenses aberrations. Indeed, a suitable combination of Zernike polynomials clearly and quantitatively identifies the squeezing of the RBC into the flow. Specifically, the optical marker consisting of FPA, SSA, and TC is very sensitive to hydrodynamic stresses, along with the real and virtual focal spots related to focus-shift and spherical aberration that was previously used for RBCs' characterization [26, 27].
The present work extends the potentiality of the Zernike analysis to a wide range of experiments where the use of OT (as in the case of Merola et al. [21]) is not necessary. Indeed, such optical fingerprint could be regarded as a powerful tool for the characterization of cells into microfluidic circuits. A single cell analysis but also a self-assembled cells array can be analyzed thus measuring collective behaviors under the effect of the shear flow.
In conclusion, we provided the proof of principle of a new marker, concerning modeling RBCs as micro-lenses array, able to characterize their biomechanical behavior when hydrodynamic stress occurs. Since the deformation is mainly caused by a redistribution of the hemoglobin content, the proposed marker could be used to identify different RBCs populations. For example, further investigations could allow the phenotyping of anemia samples [29], that are typically characterized by a lower hemoglobin, thus making their hydrodynamic deformation suitable as biomechanical marker for diagnostic purposes. A future development of the technique will be in the direction of the identification of optical biomarkers suitable for other cell types. We hypothesize that more complex cell structures, like nuclei and organelles, will be better characterized by considering the higher-order of aberrations in Zernike analysis thus paving the way for all-optical classification and sorting of cell populations in microfluidics.
Author Contributions
PM, LM, and PF conceived and designed the research. FM and MM performed the experiments and took care of the sample preparation. PM made all the numerical models and numerical analysis and supervised the project. All the authors wrote the manuscript and revised the results.
Conflict of Interest Statement
The authors declare that the research was conducted in the absence of any commercial or financial relationships that could be construed as a potential conflict of interest.
Supplementary Material
The Supplementary Material for this article can be found online at: https://www.frontiersin.org/articles/10.3389/fphy.2019.00111/full#supplementary-material
Supplementary Video 1. Quantitative phase reconstructions of the RBCs deformation under the hydrodynamic stress in the case of the concentration of about 10,000 cells per ml.
Supplementary Video 2. Quantitative phase reconstructions of the RBCs deformation under the hydrodynamic stress in the case of the concentration of about 50,000 cells per ml.
References
1. Stone HA, Stroock AD, Ajdari A. Engineering flows in small devices: microfluidics toward a lab-on-a-chip. Ann Rev Fluid Mechan. (2004) 36:381–411. doi: 10.1146/annurev.fluid.36.050802.122124
2. Zhu H, Isikman SO, Mudanyali O, Greenbaum A, Ozcan A. Optical imaging techniques for point-of-care diagnostics. Lab Chip. (2013) 13:51–67. doi: 10.1039/C2LC40864C
3. Pandey CM, Augustine S, Kumar S, Kumar S, Nara S, Srivastava S, et al. Microfluidics based point-of-care diagnostics. Biotechnol J. (2018) 13:1700047. doi: 10.1002/biot.201700047
4. Qiu X, Huang JH, Westerhof TM, Lombardo JA, Henrikson KM, Pennell M, et al. Microfluidic channel optimization to improve hydrodynamic dissociation of cell aggregates and tissue. Sci Rep. (2018) 8:2774. doi: 10.1038/s41598-018-20931-y
5. Shen Y, Song Z, Yan Y, Song Y, Pan X, Wang Q. Automatic and selective single cell manipulation in a pressure-driven microfluidic lab-on-chip device. Micromachines. (2017) 8:172. doi: 10.3390/mi8060172
6. Jovanović J, Rebrov EV, Nijhuis TA, Kreutzer MT, Hessel V, Schouten JC. Liquid–liquid flow in a capillary microreactor: hydrodynamic flow patterns and extraction performance. Ind Eng Chem Res. (2012) 51:1015–26. doi: 10.1021/ie200715m
7. Gossett DR, Tse HTK, Lee SA, Ying Y, Lindgren AG, Yang OO, et al. Hydrodynamic stretching of single cells for large population mechanical phenotyping. Proc Natl Acad Sci USA. (2012) 109:7630–5. doi: 10.1073/pnas.1200107109
8. Tomaiuolo G. Biomechanical properties of red blood cells in health and disease towards microfluidics. Biomicrofluidics. (2014) 8:051501. doi: 10.1063/1.4895755
9. Zheng Y, Chen J, Cui T, Shehata N, Wang C, Sun Y. Characterization of red blood cell deformability change during blood storage. Lab Chip. (2014) 14:577–83. doi: 10.1039/C3LC51151K
10. Hod EA, Brittenham GM, Billote GB, Francis RO, Ginzburg YZ, Hendrickson E, et al. Transfusion of human volunteers with older, stored red blood cells produces extravascular hemolysis and circulating non – transferrin-bound iron. Blood. (2011) 118:6675–82. doi: 10.1182/blood-2011-08-371849
11. Ciasca G, Papi M, Di Claudio S, Chiarpotto M, Palmieri V, Maulucci G, et al. Mapping viscoelastic properties of healthy and pathological red blood cells at the nanoscale level. Nanoscale. (2015) 7:17030–7. doi: 10.1039/C5NR03145A
12. Guo Q, Reiling SJ, Rohrbach P, Ma H. Microfluidic biomechanical assay for red blood cells parasitized by Plasmodium falciparum. Lab Chip. (2012) 12:1143–50. doi: 10.1039/c2lc20857a
13. Zheng Y, Nguyen J, Wang C, Sun Y. Electrical measurement of red blood cell deform-ability on a microfluidic device. Lab Chip. (2013) 13:3275–83. doi: 10.1039/c3lc50427a
14. Henon Y, Sheard GJ, Fouras A. Erythrocyte deformation in a microfluidic cross-slot channel. RSC Adv. (2014) 4:36079. doi: 10.1039/C4RA04229H
15. Tomaiuolo G, Lannote L, D'Apolito R, Cassinese A, Guido S. Micro-confined flow behavior of red blood cells in vitro. Med Eng Phys J. (2016) 38:11–6. doi: 10.1016/j.medengphy.2015.05.007
16. Kuo FJ, Ho MS, Dai J, Fan MH. Atomic force microscopy for dynamic observation of human erythrocytes in a microfluidic system. RSC Adv. (2015) 5:101319–26. doi: 10.1039/C5RA17864A
17. Haque MM, Moisescu MG, Valkai S, Der A, Savopol T. Stretching of red blood cells using an electro-optics trap. Biomed Opt Express. (2015) 6:118–23. doi: 10.1364/BOE.6.000118
18. Guck J, Ananthakrishnan R, Mahmood H, Moon TJ, Cunningham CC, Kas J. The optical stretcher: a novel laser tool to micro-manipulate cells. Biophys. J. (2001) 81:767–84. doi: 10.1016/S0006-3495(01)75740-2
19. Gu M, Kuriakose S, Gan X. A single beam near-field laser trap for optical stretching, folding and rotation of erythrocytes. Opt Express. (2007) 15:1369–75. doi: 10.1364/OE.15.001369
20. Mishra P, Hill M, Glynne-Jones P. Deformation of red blood cells using acoustic radiation forces. Biomicrofluidics. (2014) 8:034109. doi: 10.1063/1.4882777
21. Merola F, Barroso A, Miccio L, Memmolo P, Mugnano M, Ferraro P, et al. Biolens behavior of RBCs under optically-induced mechanical stress. Cytometry Part A. (2017) 91:527–33. doi: 10.1002/cyto.a.23085
22. Paturzo M, Pagliarulo V, Bianco V, Memmolo P, Miccio L, Merola F, et al. Digital Holography, a metrological tool for quantitative analysis: trends and future applications. Optics Lasers Eng. (2018) 104:32–47. doi: 10.1016/j.optlaseng.2017.11.013
23. Merola F, Miccio L, Memmolo P, Paturzo M, Grilli S, Ferraro P. Simultaneous optical manipulation, 3-d tracking, and imaging of micro-objects by digital holography in microfluidics. IEEE Photon J. (2012) 4:451–4. doi: 10.1109/JPHOT.2012.2190980
24. Barroso Á, Woerdemann M, Vollmer A, Von Bally G, Kemper B, Denz C. Three-dimensional exploration and mechano-biophysical analysis of the inner structure of living cells. Small. (2013) 9:885–93. doi: 10.1002/smll.201201851
25. Miccio L, Memmolo P, Merola F, Fusco S, Embrione V, Paciello A, et al. Particle tracking by full-field complex wavefront subtraction in digital holography microscopy. Lab Chip. (2014) 14:1129–34. doi: 10.1039/C3LC51104A
26. Miccio L, Memmolo P, Merola F, Netti PA, Ferraro P. Red blood cell as an adaptive optofluidic microlens. Nat Commun. (2015) 6:6502. doi: 10.1038/ncomms7502
27. Memmolo P, Merola F, Miccio L, Mugnano M, Ferraro P. Investigation on dynamics of red blood cells through their behavior as biophotonic lenses. J Biomed Opt. (2016) 21:121509. doi: 10.1117/1.JBO.21.12.121509
28. Merola F, Memmolo P, Miccio L, Savoia R, Mugnano M, Fontana A, et al. Tomographic flow cytometry by digital holography. Light Sci Appl. (2017) 5:e16241. doi: 10.1038/lsa.2016.241
29. Mugnano M, Memmolo P, Miccio L, Merola F, Bianco V, Bramanti A, et al. Label-free optical marker for red-blood-cell phenotyping of inherited anemias. Anal Chem. (2018) 90:7495–501. doi: 10.1021/acs.analchem.8b01076
Keywords: red blood cells (RBC), microfluidics, digital holography (DH), zernike polynomials, wavefront analysis
Citation: Memmolo P, Miccio L, Merola F, Mugnano M and Ferraro P (2019) Hydrodynamic Red Blood Cells Deformation by Quantitative Phase Microscopy and Zernike Polynomials. Front. Phys. 7:111. doi: 10.3389/fphy.2019.00111
Received: 30 January 2019; Accepted: 16 July 2019;
Published: 02 August 2019.
Edited by:
Qiyin Fang, McMaster University, CanadaReviewed by:
Adam Wax, Duke University, United StatesJulien Reboud, University of Glasgow, United Kingdom
Copyright © 2019 Memmolo, Miccio, Merola, Mugnano and Ferraro. This is an open-access article distributed under the terms of the Creative Commons Attribution License (CC BY). The use, distribution or reproduction in other forums is permitted, provided the original author(s) and the copyright owner(s) are credited and that the original publication in this journal is cited, in accordance with accepted academic practice. No use, distribution or reproduction is permitted which does not comply with these terms.
*Correspondence: Pasquale Memmolo, p.memmolo@isasi.cnr.it