 Hongjia Ouyang
 Zhijun Wang
 Xiaolan Chen1,2
 Jiao Yu
 Zhenhui Li
 Qinghua Nie
- 1Department of Animal Genetics, Breeding and Reproduction, College of Animal Science, South China Agricultural University, Guangzhou, China
- 2Guangdong Provincial Key Lab of Agro-Animal Genomics and Molecular Breeding, and Key Lab of Chicken Genetics, Breeding and Reproduction, Ministry of Agriculture, Guangzhou, China
Embryonic growth and development of skeletal muscle is a major determinant of muscle mass, and has a significant effect on meat production in chicken. To assess the protein expression profiles during embryonic skeletal muscle development, we performed a proteomics analysis using isobaric tags for relative and absolute quantification (iTRAQ) in leg muscle tissues of female Xinghua chicken at embryonic age (E) 11, E16, and 1-day post hatch (D1). We identified 3,240 proteins in chicken embryonic muscle and 491 of them were differentially expressed (fold change ≥ 1.5 or ≤ 0.666 and p < 0.05). There were 19 up- and 32 down-regulated proteins in E11 vs. E16 group, 238 up- and 227 down-regulated proteins in E11 vs. D1 group, and 13 up- and 5 down-regulated proteins in E16 vs. D1 group. Protein interaction network analyses indicated that these differentially expressed proteins were mainly involved in the pathway of protein synthesis, muscle contraction, and oxidative phosphorylation. Integrative analysis of proteome and our previous transcriptome data found 189 differentially expressed proteins that correlated with their mRNA level. The interactions between these proteins were also involved in muscle contraction and oxidative phosphorylation pathways. The lncRNA-protein interaction network found four proteins DMD, MYL3, TNNI2, and TNNT3 that are all involved in muscle contraction and may be lncRNA regulated. These results provide several candidate genes for further investigation into the molecular mechanisms of chicken embryonic muscle development, and enable us to better understanding their regulation networks and biochemical pathways.
Introduction
Skeletal muscle is a highly complex and heterogeneous tissue, and serves several important metabolic functions (Bentzinger et al., 2012). In domestic animal, skeletal muscle is the largest contributor to mass and is therefore directly related to meat production (Güeller and Russell, 2010). Muscle mass depends on the number of muscle fibers and muscle hypertrophy. The number of muscle fiber is set at the time of birth, and this limitation can only be partially compensated by muscle hypertrophy after birth (Wigmore and Stickland, 1983; Ylihärsilä et al., 2007). Thus, embryonic myogenesis is a crucial process for increasing muscle mass.
Myogenesis is the formation of muscle fibers from somites and is highly regulated by many genes, transcription factors or non-coding RNAs (Buckingham, 2001; Bassel-Duby and Olson, 2006; Cesana et al., 2011). In chicken, skeletal muscle form in the limb from progenitor cells during embryogenesis. These progenitor cells are originated from somites and migrate into the limb bud. Subsequently, they proliferate and differentiate into skeletal muscle in limb (Buckingham et al., 2003). Numerous regulatory genes involved in myogenesis have been identified, such as Myf5 (myogenic factor 5), MyoD (myogenic differentiation 1), Mrf4 (myogenic regulatory factor 4) MyoG (myogenin), MEF2 (myocyte enhancer binding factor 2), Myostatin, IGF2 (insulin-like growth factors 2), PAX3 (paired box 3), and PAX7 (paired box 7) (Bismuth and Relaix, 2010; Braun and Gautel, 2011). However, the regulations of skeletal muscle development in the chicken are far from clear, more genes or proteins, and non-coding RNAs and their interactions need to further elucidate. Our previous study identified differentially expressed chicken mRNAs and long non-coding RNAs (lncRNA) during embryonic skeletal muscle development, and provides a functional interaction network between lncRNAs and protein-coding genes (Li et al., 2017). However, proteins and mRNA levels do not often directly correlate and proteins also provides post-translational modified information and more direct evidence (Greenbaum et al., 2003; Zhan et al., 2016). Thus, we aimed to assess the protein expression profiles during embryonic skeletal muscle development for this study.
The iTRAQ is a reliable and accurate technique for quantitative analysis in proteomics study (Wiese, 2007). This technique uses stable isotopically-labeled molecules that can be covalently bonded to the N-terminus and side chain amines of proteins, and have been increasingly applied to investigate the proteome in different organisms (Liu et al., 2016a; Minjarez et al., 2016; Xiong et al., 2016; Campos et al., 2017). In this study, we performed iTRAQ-based proteomics analysis using embryonic muscle samples, and identified differentially expressed proteins during skeletal muscle development in chickens. We further combined analysis this proteome data with our previous RNA sequencing to identify proteins whose expression directly correlated with mRNA as well as lncRNA expression patterns (Li et al., 2017).
Materials and Methods
Ethics Statement
Animal experiments were carried out in compliance with animal care protocols and all efforts were made to minimize suffering. The protocol was approved by the Animal Care Committee of South China Agricultural University (Guangzhou, China) with approval number SCAU#0014.
Animals and Samples Preparation
Xinghua (XH) chickens at E10 were obtained from the Chicken Breeding Farm of South China Agricultural University (Guangzhou, China) and incubated in Automatic Incubator (Oscilla, Shandong, China) at 37.8°C, 50–70% relative humidity. Chicken embryo sexes were identified by PCR amplification of the CHD1 (chromodomain helicase DNA binding protein 1) gene (Fridolfsson and Ellegren, 1999). Leg muscles of female Xinghua chickens in three different development stages (E11, E16, and D1) were used for iTRAQ analysis.
iTRAQ Assays
Two female chickens of each stage E11, E16, and D1 were used for iTRAQ assays (Applied Biosystems, Foster city, CA, USA). Total proteins were extracted by using a urea lysis buffer (7 M urea, 2 M thiourea, and 1% SDS) containing 1 mM PMSF. Proteins were quantified using a BCA Assay Kit (Pierce, Thermo, USA) and detected by SDS-electrophoresis. Total proteins were treated follow reduction, cysteine alkylation, and trypsin digestion to obtain peptides, and then equal amounts of peptides from six samples were labeled individually with different iTRAQ reagents (E11, labeled by 113 and 114; E16, labeled by 115 and 116; and D1, labeled by 119 and 121) using instructions provided by the manufacturer. After iTRAQ-labeling, peptides were desalted using a C18 solid-phase extraction and submitted for Nano Liquid Chromatography–Mass Spectrometry/Mass Spectrometry (LC-MS/MS) analysis.
The experiments were performed on a Nano Aquity UPLC system (Waters Corporation, Milford, MA) connected to a quadrupole-Orbitrap mass Spectrometer (Q-Exactive) (Thermo Fisher Scientific, Bremen, Germany) equipped with an online nano-electrospray ion source. The Q-Exactive mass spectrometer was operated in the data-dependent mode to switch automatically between MS and MS/MS acquisition. Survey full-scan MS spectra (m/z 350–1,200) were acquired with a mass resolution of 70K, followed by fifteen sequential high energy collisional dissociation MS/MS scans with a resolution of 17.5K. In all cases, one microscan was recorded using dynamic exclusion of 60 s. MS/MS fixed first mass was set at 100.
iTRAQ Data Analysis
The MS/MS data were analyzed with Proteome Discoverer software v1.4 (Thermo Scientific), and search in the Uniprot database (Gallus gallus). The target-decoy based strategy was applied to control peptide level false discovery rates (FDR) lower than 1%. Only unique peptides were used for protein quantification and normalization on protein medians was used to correct experimental bias, the minimum number of proteins that must be observed to allow was set to 200. For protein quantitation, the ratios of each sample were weighted and normalized by comparing the control group (sample tagged as 113) as the denominator. For quantitative changes, we set a >1.5 or <0.66-fold change cutoff and p-value (t-test) <0.05 for differentially expressed proteins.
All identified proteins were annotated and classified by GO (Gene Ontology, http://www.geneontology.org/) and KEGG (Kyoto Encyclopedia of Genes and Genomes, http://www.genome.jp/kegg/) pathway. The differentially expressed proteins were further processed by DAVID 6.8 Functional Annotation Tool (http://david.abcc.ncifcrf.gov/) for term enrichment analysis (Huang et al., 2009a). The results were filtered based on a Fisher Exact statistic methodology as previously described (Huang et al., 2009b). The GO biological network was assessed using the ClueGO of Cytoscape software (http://www.cytoscape.org/). Protein-protein interaction analysis was performance by String v10.0 (http://www.string-db.org/), and a high coefficient value of 0.7 was used as a cutoff (Szklarczyk et al., 2015). Cluster analysis was performed to identify the expression patterns of differentially expressed proteins (fold change ≥ 1.2 or ≤ 0.8 and p < 0.05) using hcluster (https://pypi.python.org/pypi/hcluster/0.2.0).
Integrative Analysis of the Proteome and Transcriptomes Data
Transcriptomes data (including mRNAs and lncRNAs) obtained from our previous study were using for integrative analysis with the proteome data (Li et al., 2017). Differentially expressed proteins were compared with the differentially expressed mRNAs, to identify proteins that were consistently expressed at the RNA and protein levels. The correlation between these consistently expressed proteins was analyzed by String v10.0 with a coefficient value of 0.7. The differentially expressed proteins were also compared with the predicted potential target genes of differentially expressed lncRNAs. The interaction network of the corresponding proteins and lncRNAs were constructed by String v10.0 and Cytoscape software.
Western Blotting
Proteins were extracted from muscle tissues by using a urea lysis buffer (7 M urea, 2 M thiourea and 1% SDS) containing 1 mM PMSF. Total proteins (50 μg) were separated on a 12% SDS-PAGE, and transferred to a polyvinylidene difluoride membrane (Millipore, Bedford, MA). The membrane was blocked in 5% BSA blocking solution for 1 h at room temperature and incubated overnight at 4°C with primary antibodies (Abcam, Cambridge, UK) as follows: MYL1 (ab97427, diluted 1:500), MYL3 (ab137767, diluted 1:1,000), RPL4 (ab154907, diluted 1:1,000), STMN1(ab194670, diluted 1:1,000), RPS3A (ab101690, diluted 1:500), and TNNT3 (ab82784, diluted 1:500). After that, the membrane was washed with PBS-T and then developed with anti-mouse or rabbit horseradish peroxidase conjugated secondary antibodies (Sigma-Aldrich, diluted 1:5,000). Protein bands were visualized using enhanced chemiluminescence (ECL) system (GE Healthcare, USA) and quantified with an ImageQuant LAS4000 system (Fujifilm, Tokyo, Japan).
Results
Proteomic Expression Profiling of Embryonic Muscle in Chickens
Embryonic growth and development of skeletal muscle has a significant effect on muscle mass in chickens (Halevy et al., 2004, 2006). To assess the protein expression profiles during embryonic skeletal muscle development, we used the same samples as our previous RNA sequencing (leg muscle tissues of female XH chicken at E11, E16, and D1; each stage two individuals) for iTRAQ-based proteomics analysis (Li et al., 2017).
The LC-MS/MS data analysis generated a total of 58,815 match spectra, 19,659 peptides, and 15,495 unique peptides. We could identify 3,240 proteins possessing at least one unique peptide with a confidence level above 95% (Table S1). All proteins were grouped according to biological process, cellular component, and molecular function by GO analysis (Table S2). The cellular process, metabolic process and biological regulation were mainly categories for these proteins in biological processes, and the binding and catalytic activity were the two most abundant categories in molecular function (Figure 1A). The KEGG analysis indicated that these proteins were primarily involved in pathway of signal transduction, translation, and transport and catabolism (Figure 1B).
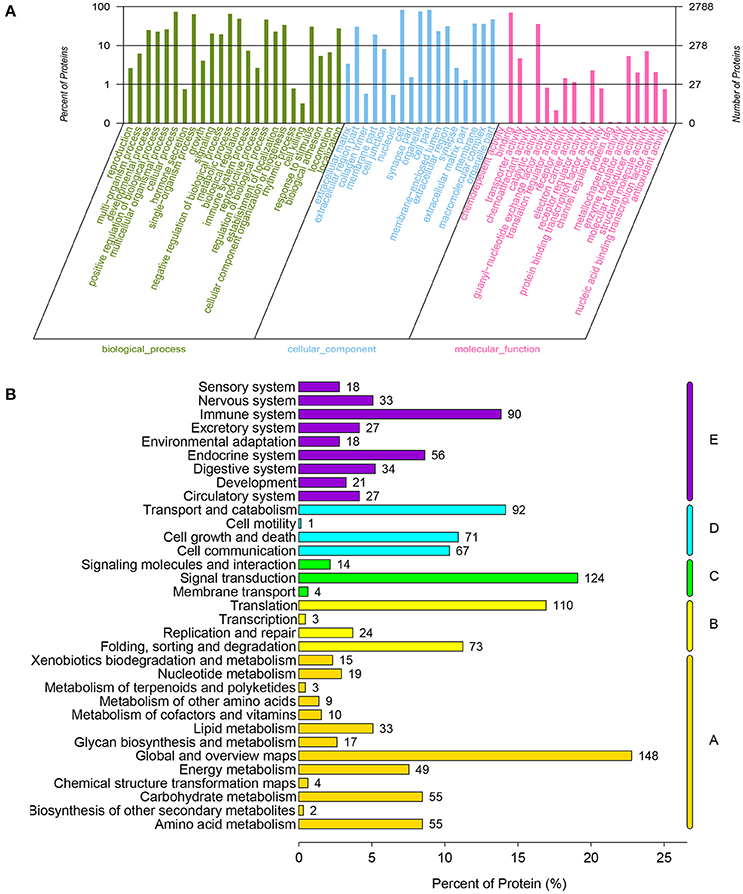
Figure 1. Functional classification of all annotated proteins in chicken embryonic muscle. (A) Proteins as classified into three main categories by GO analysis: biological process, cellular component, and molecular function. The left y-axis indicates the percentage of a specific category of genes in that category. The right y-axis indicates the number of genes in a category. (B) Proteins as classified into five main categories by KEGG analysis: metabolism, genetic information processing, environmental information processing, cellular processes and organismal systems. The x-axis indicates the percentage genes within that specific category.
Identification of Differentially Expressed Proteins
To access proteins dynamic changes during embryonic development of skeletal muscle, we identified 491 differentially expressed proteins (fold change ≥ 1.5 or ≤ 0.666 and p < 0.05) from the three different developmental groups (Figure 2A). There were 19 up- and 32 down-regulated proteins in E11 vs. E16 (Table S3) group, 238 up- and 227 down-regulated proteins in E11 vs. D1 (Table S4) group, and 13 up- and 5 downregulated proteins in E16 vs. D1 (Table S5) group (Figures 2B,C). According to the p-values, the top 10 differentially expressed proteins of each comparison group were listed in Table 1. These differentially expressed proteins could play an important role on development of embryonic muscle, and served as candidate genes for further study.
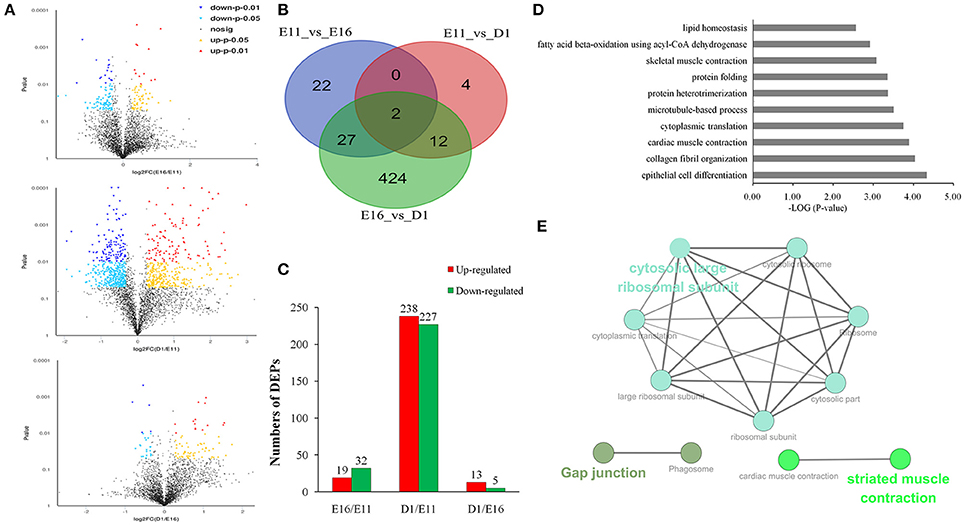
Figure 2. Differentially expressed proteins in three different development stages of embryonic muscle. (A) Volcano plots of differentially expressed proteins in three comparisons: E11 vs. E16, E11 vs. D1, and E16 vs. D1. (B) Venn diagrams of differentially expressed proteins (n = 491; P < 0.05, fold change > 1.5 or < 0.66). (C) Number of differentially expressed proteins in three comparisons: E11 vs. E16, E11 vs. D1, and E16 vs. D1. (D) The top 10 GO enrichment terms for differentially expressed proteins. (E) The 57 proteins in the top 10 biological processes were analysis using ClueGO of Cytoscape software.
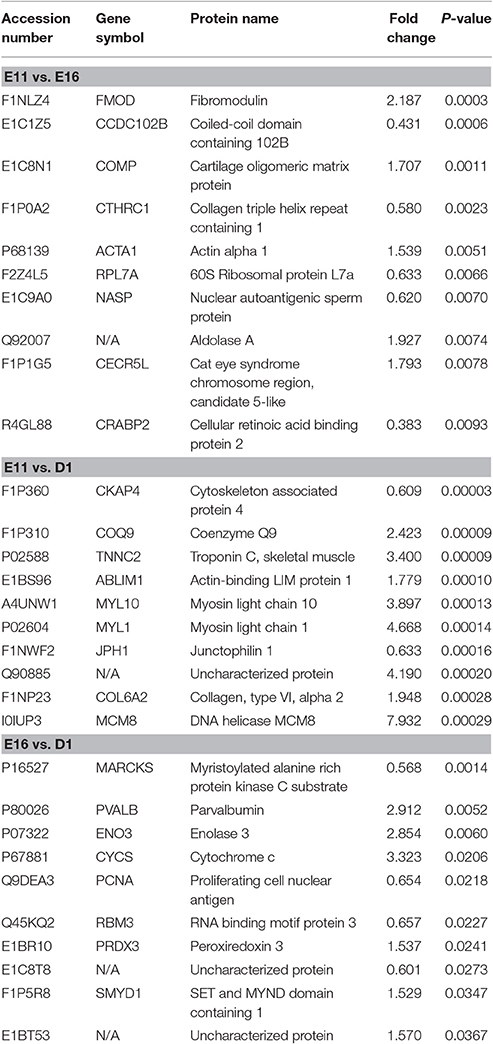
Table 1. The top 10 differentially expressed proteins in E11 vs. E16, E11 vs. D1, and E16 vs. D1 groups.
Function Analysis of Proteins in Chicken Embryonic Muscle
In order to gain insights into the functions of these differentially expressed proteins, GO functional enrichment analysis was performed using DAVID tool. In total, 420 proteins were enriched into130 GO term. These were involved in epithelial cell differentiation, collagen fibril organization, muscle contraction, cytoplasmic translation and protein folding (Figure 2D). We also found significant enrichments for phagosome, ribosome, pyruvate metabolism, and Glycolysis/Gluconeogenesis by KEGG pathway analysis (Figure S1). We further analyzed 57 proteins taken from the top 10 biological processes and formed a functional interaction network. This analysis indicated that these significantly altered proteins were involved in structural constituent of ribosome as well as cardiac and striated muscle contraction (Figure 2E).
To characterize the expression patterns of differentially expressed proteins (fold change ≥ 1.2 or ≤ 0.8 and p < 0.05), cluster analysis was performed using hcluster. The heatmap of these differentially expressed proteins indicated that their expression patterns are similar in E16 and D1 (Figure S2). According to the expression pattern, these differentially expressed genes could be mainly grouped into four distinct clusters (Figure 3). The largest cluster (cluster 1, including 476 proteins) had a consistently overall pattern of down-regulation from E11 to D1 (Figure 3A). However, t cluster 2 (358 proteins) were up-regulated steadily from E11 to D1 and the 52 proteins of cluster 3 were up-regulated sharply from E11 to D1. The nine proteins of cluster 4 were up-regulated sharply from E11 to E16 but showed no significant change at D1 (Figure 3D).
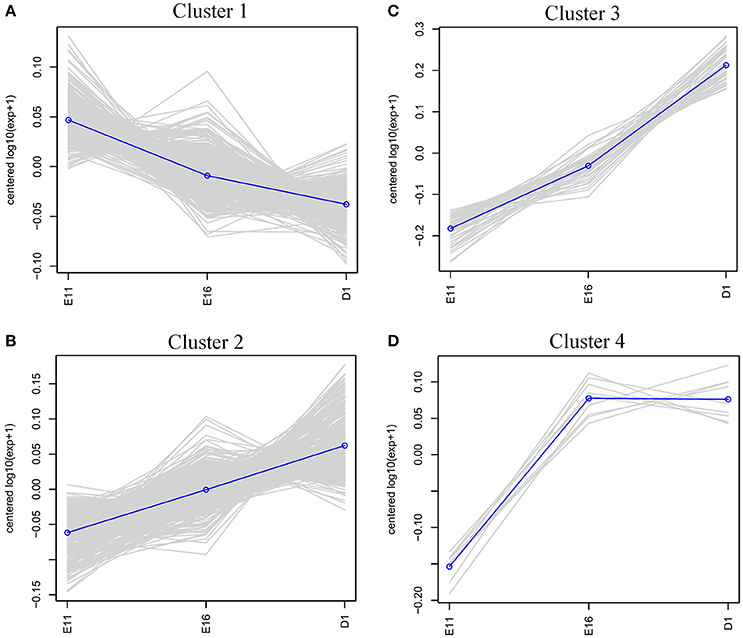
Figure 3. Clustering analysis of the expression patterns of differentially expressed proteins. (A) Cluster 1 (476 proteins); down-regulated consistently from E11 to D1. (B) Cluster 2 (358 proteins); up-regulated steadily from E11 to D1. (C) Cluster 3 (52 proteins); up-regulated sharply from E11 to D1. (D) Cluster 4 (9 proteins); up-regulated sharply from E11 to E16, but then no significant change at D1.
Western Blot Validation of iTRAQ Data
To confirm the iTRAQ results, we performed western blotting analysis for several candidate proteins, including MYL1 (myosin light chain 1), MYL3 (myosin light chain 3), RPS3A (ribosomal protein S3A), STMN1 (stathmin 1) and TNNT3 (troponin T3) (Figure 4A). The no obvious changes protein of RPL4 (ribosomal protein L4) was used as reference gene. The expression levels of MYL1, MYL3, and TNNT3 all increased from E11 to D1, while the RPS3A and STMN1 decreased during this same period (Figure 4B). The expression patterns of these proteins were consistent with our iTRAQ data.
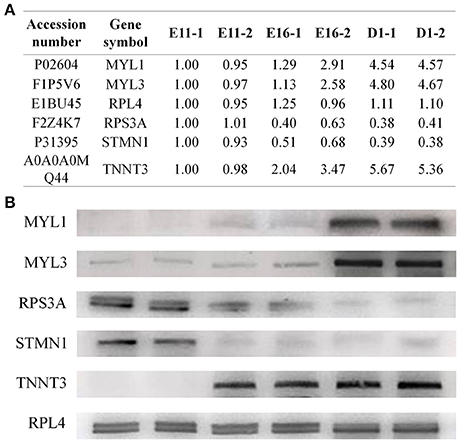
Figure 4. Western blotting validation of the differentially expressed proteins. (A) The proteome data for candidate proteins. (B) Western blotting results showed that the expression levels of MYL1, MYL3, and TNNT3 all increased, while RPS3A and STMN1 decreased from E11 to D1. The protein RPL4 was used as reference gene.
Interaction Network of Differentially Expressed Proteins
Proteins are usually not work alone, but rather interacted with each other to perform various functions. To explore the protein interaction networks altered in development of chicken embryonic skeletal muscle, differentially expressed proteins identified in this study were analyzed using STRING software. In E11 vs. D1 group, 396 of 465 differentially expressed proteins were detected in STRING, and 77 proteins were connected to nodes in the network (Figure 5A). Interestingly, we found interaction networks for ribosomal protein (RPS20, RPS25, RPLP1, and RPL9 etc.), muscle contraction (TNNC1, TNNC2, TNNI1, TNNI2, TPM2, TPM3, MYL1, MYL2, MYL3, and DMD), pyruvate metabolism (PDHA1, PDK3, and ACAC) and oxidative phosphorylation (NADH: ubiquinone oxidoreductase family, including NDUFA5, NDUFS6, and NDUFB9 etc.). In E11 vs. E16 group, 43 differentially expressed proteins were analyzed and 22 of them constituted an interaction network. This network was related to pathway of GTP and myosin binding and included ADSS, ARF4, PSMC1, ACTA1, and ATP2A2 (Figure 5B). In E16 vs. D1 group, 16 of 18 differentially expressed proteins were detected and eight of them constituted a network including NDUFA5, CYCS, PRDX3, SMYD1, and PCNA (Figure 5C).
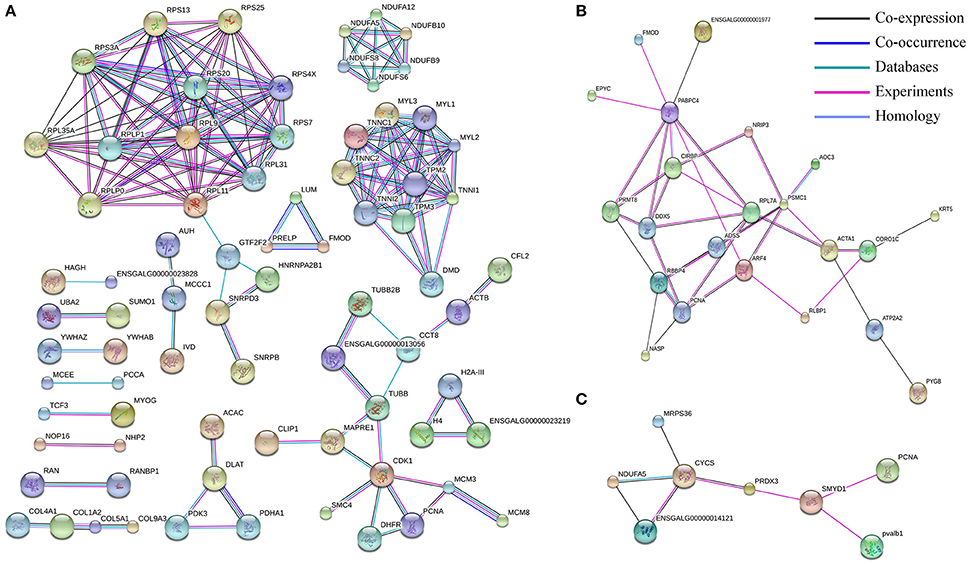
Figure 5. The protein–protein interaction network of differentially expressed proteins in three comparisons: E11 vs. D1 (A), E11 vs. E16 (B) and E16 vs. D1 (C). In this network, nodes represent proteins, and lines with different color represent the predicted different associations.
Interaction Network of Proteome and Transcriptomes Integrative Analysis
Skeletal muscle development in the chicken is a complex physiological process, and gene expression is regulated at multiple levels. Thus, we performed a proteome and transcriptomes integrative analysis to give us clues as to the levels of regulation for the differentially expressed proteins. When we compared our differentially expressed proteins with the differentially expressed mRNAs, 189 differentially expressed proteins were regulated in the same manner as their mRNAs (Table S6). The interaction between these proteins was also involved in the pathway of muscle contraction and oxidative phosphorylation (Figure 6).
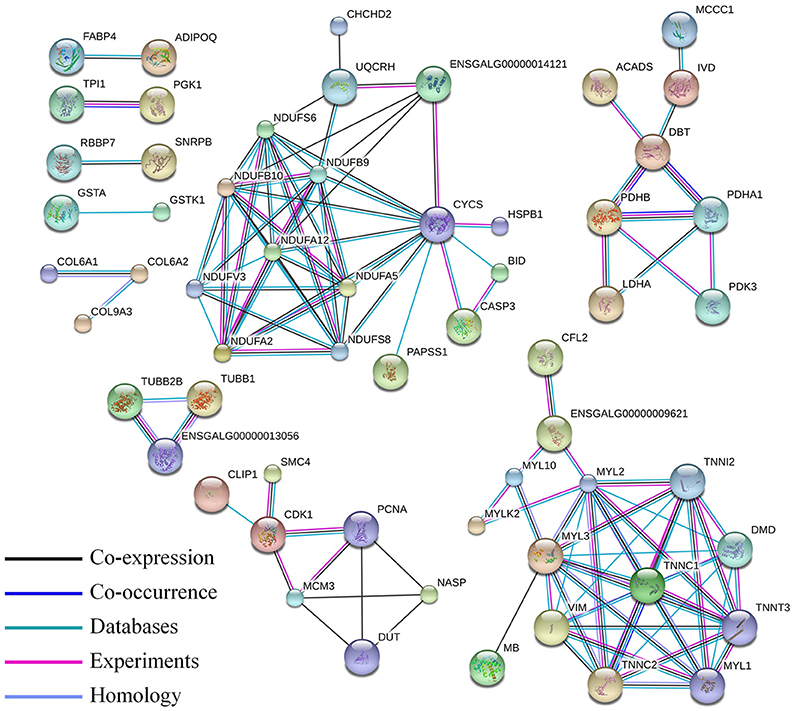
Figure 6. Protein–protein interaction network of the differentially expressed proteins correlated with their mRNA expression level. In this network, nodes represent proteins, and lines with different colors represent the predicted associations.
LncRNAs can regulate gene expression through cis-acting or trans-acting mechanisms (Bu et al., 2012; Han et al., 2012). We next integrated our lncRNA data with the proteomic data to construct an interaction network. We found that only a small fraction of differentially expressed proteins were from the target gene of corresponding differentially expressed lncRNAs. In E11 vs. E16 group and E16 vs. D1 group, only the MARCKS gene was identified as the target gene of lnc00057929, and KLHL15 gene was found as target gene of lnc00037615 and lnc00066198. For the E11 vs. D1 group, there were 21 differentially expressed proteins we found as target genes of 22 lncRNAs (Figure 7 and Table S7). Interestingly, four proteins (DMD, MYL3, TNNI2, and TNNT3) involved in muscle contraction were identified in this network, indicating that they may regulated by their corresponding lncRNAs (Figure 7).
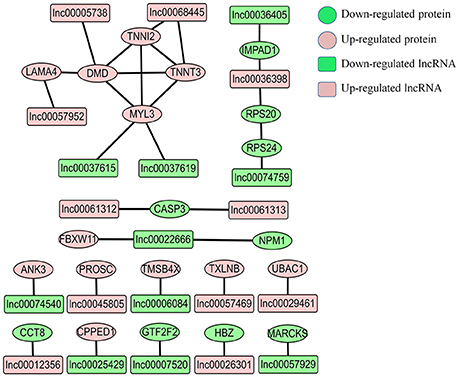
Figure 7. Proteins-lncRNA network for comparison group of E11 vs. D1. The predicted potential target genes of differentially expressed lncRNAs compared with corresponding differentially expressed proteins. The pink circles represent up-regulated proteins, and the green circles represent down-regulated proteins. The pink rectangles represent up-regulated lncRNAs, and the green rectangles represent down-regulated lncRNAs.
Discussion
Proteomic analysis is a powerful technique for investigating protein expression patterns, and has been used for chicken in several studies (Cao et al., 2012; Zhang et al., 2015; Desai et al., 2016; Gao et al., 2016; Li et al., 2016a,b). Skeletal muscle is an essential component of the animal body and its mass directly correlates with meat production (Güeller and Russell, 2010). Numerous studies have been identified proteome changes of skeletal muscle at different growth stages in chickens (Doherty et al., 2004; Teltathum and Mekchay, 2009; Liu et al., 2016b), pigs (Long et al., 2016; Zhang et al., 2016), cattle (Zhang et al., 2010), and rats (Spácilová et al., 2016). Embryonic myogenesis involves in a series of complex biological process, which is a major determinant of muscle mass (Buckingham, 2001). Chicken skeletal muscle also offers an excellent system for developmental proteomics. However, for chicken skeletal muscle, previous proteomic analyses concentrated on days post hatching. For example, Doherty et al. characterized the proteome of layer chicken breast muscle at specified time-points from 1 to 27 days after hatching (Doherty et al., 2004). Protein expression profiles were also performed in the breast muscle of Thai indigenous chickens at 0, 3, 6, and 18 weeks of age and Beijing-You chickens at ages 1, 56, 98, and 140 days (Teltathum and Mekchay, 2009; Liu et al., 2016b). In this study, we performed an iTRAQ-based proteomic analysis of chicken skeletal muscle at E11, E16, and D1, so we could focus on myogenesis during embryonic development. In the chick, fetal myoblasts are most abundant from E8 to E12, and undergo massive differentiation at E16 to E18 (Hartley et al., 1992; Stockdale, 1992).
During chick embryo development, muscles of the limbs are originated from the somite; progenitor cells migrated to their final destination in the limb at E11, and then quickly start to differentiate by the activation of the muscle determination factors MYOD, MYOG, and MRF4 (Bismuth and Relaix, 2010). We identified 3,240 proteins and 491 of them were differentially expressed between the three developmental ages in leg muscle. The greatest numbers of differentially expressed proteins was in the E11 vs. D1 (n = 465) group, and interaction work of these proteins were found clusters for ribosomal structural proteins (protein synthesis), muscle contraction (specific muscle function), pyruvate metabolism and oxidative phosphorylation (energy generation). These results could provide new clues for genetic regulation of embryonic myogenesis.
Ribosomal proteins usually constitute the ribosomal subunits, and involved in the cellular process of translation and protein biosynthesis. Ribosomal proteins have been reported that participated in regulation of mRNA translation during myogenesis (de Klerk et al., 2015). In breast muscle of Beijing-You chickens, ribosome-related functional modules were also found in interaction networks of the differentially expressed proteins at days 1, 56, 98, and 140 days (Liu et al., 2016b). We found that all these differentially expressed ribosomal proteins were down-regulated at D1. The mitochondrial oxidative phosphorylation system is responsible for providing the bulk of cellular ATP. More than 90% of the cells of ATP are synthesized by oxidative phosphorylation in mitochondria (Minai et al., 2008; Pejznochova et al., 2010). In this E11 vs. D1 group, the differentially expressed proteins NDUFA5, NDUFA12, NDUFB9, NDUFB10, NDUFS6, and NDUFS8 are all involved in oxidative phosphorylation and most were up-regulated at D1 (Figure 5A). This family of proteins was also represented in our interaction network of the 189 differentially expressed proteins that directly correlated with their corresponding mRNA levels (Figure 6).
In the muscle contraction pathway, 10 differentially expressed proteins from the E11 vs. D1 group were found involving in this pathway, including troponin subunits TNNC1, TNNC2, TNNI1, TNNI2, and tropomyosin subunits TPM2 and TPM3, as well as MYL1, MYL2, MYL3, and DMD (Figure 5A). Myosin light chains (MYL1, MYL2, and MYL3) are components of the myosin complex, and could act as a molecular motor to provide the energy for muscle contraction (Dominguez et al., 1998). The TNNC1, TNNC2, TNNI1, and TNNI2 are important components of troponin-tropomyosin complex, which has been found play a crucial role in the regulation of muscle contraction (Farah and Reinach, 1995). The DMD gene encodes dystrophin, that is essential for the development and organization of myofibers in skeletal and cardiac muscles (Muntoni et al., 2003; Ghahramani Seno et al., 2010). All these proteins were up-regulated at D1. Interestingly, the proteins interaction network in Figure 6 were also involved in the pathway of muscle contraction, including TNNC1, TNNC2, TNNI2, TNNT3, MYL1, MYL2, MYL3, and DMD etc. The proteins DMD, MYL3, TNNI2, and TNNT3 were also identified in our lncRNA-proteins interaction network (Figure 7). The TNNI2 and TNNT3 is the putative cis-target of lnc00068445; DMD is the putative cis-target of lnc00005738; MYL3 is the putative cis-target of lnc00037615 and lnc00037619. These four proteins may regulated by their corresponding lncRNA and together take part in the regulation of muscle development.
In conclusion, the present study characterized the proteins expression profile of chicken during embryonic skeletal muscle development by iTRAQ. A total of 491 differentially expressed proteins were identified at three different developmental groups. The differentially expressed proteins were mainly involved in the pathway of ribosome, muscle contraction, and oxidative phosphorylation. Several proteins that involved in the pathway of muscle contraction were found may regulated by lncRNA. Overall, the results can provide a more comprehensive insight into the regulation networks and biochemical pathways during embryonic skeletal muscle development in chicken.
Author Contributions
HO: performed the experiments, analyzed the data and wrote the manuscript. ZW and XC: Collected the samples and analyzed the data. JY and ZL: analyzed the data. QN: designed the study and reviewed the manuscript. All authors have read and approved the final manuscript.
Funding
This research was supported by the Program for New Century Excellent Talents in University (NCET-13-0803) and the Foundation for High-level Talents in Higher Education of Guangdong, China.
Conflict of Interest Statement
The authors declare that the research was conducted in the absence of any commercial or financial relationships that could be construed as a potential conflict of interest.
Supplementary Material
The Supplementary Material for this article can be found online at: http://journal.frontiersin.org/article/10.3389/fphys.2017.00281/full#supplementary-material
Figure S1. KEGG analysis of differentially expressed proteins in E11 vs. E16 (A), E11 vs. D1 (B) and E16 vs. D1 (C).
Figure S2. Heatmap of differentially expressed proteins in three different development stages of embryonic muscle.
Table S1. The identified 3,250 protein list in chicken embryonic muscle by iTRAQ.
Table S2. GO analysis of 3,250 proteins in chicken embryonic muscle.
Table S3. Differentially expressed proteins in E11 vs. E16.
Table S4. Differentially expressed proteins in E11 vs. D1.
Table S5. Differentially expressed proteins in E16 vs. D1.
Table S6. Differentially expressed proteins correlated with RNA-seq.
Table S7. The lncRNAs target with differentially expressed proteins in E11 vs. D1.
Abbreviations
D1, 1 days post hatch; DEP, differentially expressed proteins; E11, embryonic age 11; E16, embryonic age 16; GO, gene ontology; iTRAQ, isobaric tags for relative and absolute quantification; KEGG, Kyoto Encyclopedia of Genes and Genomes; LncRNA, long non-coding RNA; XH, Xinghua chicken.
References
Bassel-Duby, R., and Olson, E. N. (2006). Signaling pathways in skeletal muscle remodeling. Annu. Rev. Biochem. 75, 19–37. doi: 10.1146/annurev.biochem.75.103004.142622
Bentzinger, C. F., Wang, Y. X., and Rudnicki, M. A. (2012). Building muscle: molecular regulation of myogenesis. Cold Spring Harb. Perspect. Biol. 4:a008342. doi: 10.1101/cshperspect.a008342
Bismuth, K., and Relaix, F. (2010). Genetic regulation of skeletal muscle development. Exp. Cell Res. 316, 3081–3086. doi: 10.1016/j.yexcr.2010.08.018
Braun, T., and Gautel, M. (2011). Transcriptional mechanisms regulating skeletal muscle differentiation, growth and homeostasis. Nat. Rev. Mol. Cell Bio. 12, 349–361. doi: 10.1038/nrm3118
Bu, Q., Hu, Z., Chen, F., Zhu, R., Deng, Y., Shao, X., et al. (2012). Transcriptome analysis of long non-coding RNAs of the nucleus accumbens in cocaine-conditioned mice. J. Neurochem. 123, 790–799. doi: 10.1111/jnc.12006
Buckingham, M. (2001). Skeletal muscle formation in vertebrates. Curr. Opin. Genet. Dev. 11, 440–448. doi: 10.1016/S0959-437X(00)00215-X
Buckingham, M., Bajard, L., Chang, T., Daubas, P., Hadchouel, J., Meilhac, S., et al. (2003). The formation of skeletal muscle: from somite to limb. J. Anat. 202, 59–68. doi: 10.1046/j.1469-7580.2003.00139.x
Campos, J. M., Neves, L. X., de Paiva, N. C., de Oliveira E Castro, R. A., Casé, A. H., Carneiro, C. M., et al. (2017). Understanding global changes of the liver proteome during murine schistosomiasis using a label-free shotgun approach. J. Proteomics 151, 193–203. doi: 10.1016/j.jprot.2016.07.013
Cao, Z., Han, Z., Shao, Y., Liu, X., Sun, J., Yu, D., et al. (2012). Proteomics analysis of differentially expressed proteins in chicken trachea and kidney after infection with the highly virulent and attenuated coronavirus infectious bronchitis virus in vivo. Proteome Sci. 10:24. doi: 10.1186/1477-5956-10-24
Cesana, M., Cacchiarelli, D., Legnini, I., Santini, T., Sthandier, O., Chinappi, M., et al. (2011). A long noncoding RNA controls muscle differentiation by functioning as a competing endogenous RNA. Cell 147, 947–947. doi: 10.1016/j.cell.2011.10.031
de Klerk, E., Fokkema, I. F., Thiadens, K. A., Goeman, J. J., Palmblad, M., den Dunnen, J. T., et al. (2015). Assessing the translational landscape of myogenic differentiation by ribosome profiling. Nucleic Acids Res. 43, 4408–4428. doi: 10.1093/nar/gkv281
Desai, M. A., Jackson, V., Zhai, W., Suman, S. P., Nair, M. N., Beach, C. M., et al. (2016). Proteome basis of pale, soft, and exudative-like (PSE-like) broiler breast (Pectoralis major) meat. Poultry Sci. 95, 2696–2706. doi: 10.3382/ps/pew213
Doherty, M. K., McLean, L., Hayter, J. R., Pratt, J. M., Robertson, D., El-Shafei, A., et al. (2004). The proteome of chicken skeletal muscle: changes in soluble protein expression during growth in a layer strain. Proteomics 4, 2082–2093. doi: 10.1002/pmic.200300716
Dominguez, R., Freyzon, Y., Trybus, K. M., and Cohen, C. (1998). Crystal structure of a vertebrate smooth muscle myosin motor domain and its complex with the essential light chain: visualization of the pre-power stroke state. Cell 94, 559–571. doi: 10.1016/S0092-8674(00)81598-6
Farah, C. S., and Reinach, F. C. (1995). The troponin complex and regulation of muscle contraction. FASEB J. 9, 755–767.
Fridolfsson, A., and Ellegren, H. (1999). A simple and universal method for molecular sexing of non-ratite birds. J. Avian Biol. 30, 116–121. doi: 10.2307/3677252
Gao, D., Qiu, N., Liu, Y., and Ma, M. (2016). Comparative proteome analysis of egg yolk plasma proteins during storage. J. Sci. Food Agric. doi: 10.1002/jsfa.8052. [Epub ahead of print].
Ghahramani Seno, M. M., Trollet, C., Athanasopoulos, T., Graham, I. R., Hu, P., and Dickson, G. (2010). Transcriptomic analysis of dystrophin RNAi knockdown reveals a central role for dystrophin in muscle differentiation and contractile apparatus organization. BMC Genomics 11:345. doi: 10.1186/1471-2164-11-345
Greenbaum, D., Colangelo, C., Williams, K., and Gerstein, M. (2003). Comparing protein abundance and mRNA expression levels on a genomic scale. Genome Biol. 4:117. doi: 10.1186/gb-2003-4-9-117
Güeller, I., and Russell, A. P. (2010). MicroRNAs in skeletal muscle: their role and regulation in development, disease and function. J. Physiol. 588, 4075–4087. doi: 10.1113/jphysiol.2010.194175
Halevy, O., Piestun, Y., Allouh, M. Z., Rosser, B. W., Rinkevich, Y., Reshef, R., et al. (2004). Pattern of Pax7 expression during myogenesis in the posthatch chicken establishes a model for satellite cell differentiation and renewal. Dev. Dyn. 231, 489–502. doi: 10.1002/dvdy.20151
Halevy, O., Yahav, S., and Rozenboim, I. (2006). Enhancement of meat production by environmental manipulations in embryo and young broilers. World. Poultry Sci. J. 62, 485–497. doi: 10.1017/s0043933906001103
Han, L., Zhang, K., Shi, Z., Zhang, J., Zhu, J., Zhu, S., et al. (2012). LncRNA profile of glioblastoma reveals the potential role of lncRNAs in contributing to glioblastoma pathogenesis. Int. J. Oncol. 40, 2004–2012. doi: 10.3892/ijo.2012.1413
Hartley, R. S., Bandman, E., and Yablonka-Reuveni, Z. (1992). Skeletal muscle satellite cells appear during late chicken embryogenesis. Dev. Biol. 153, 206–216. doi: 10.1016/0012-1606(92)90106-Q
Huang, D. W., Sherman, B. T., and Lempicki, R. A. (2009a). Bioinformatics enrichment tools: paths toward the comprehensive functional analysis of large gene lists. Nucleic Acids Res. 37, 1–13. doi: 10.1093/nar/gkn923
Huang, D. W., Sherman, B. T., Zheng, X., Yang, J., Imamichi, T., Stephens, R., et al. (2009b). Extracting biological meaning from large gene lists with DAVID. Curr. Protoc. Bioinformatics Chapter 13:Unit 13.11. doi: 10.1002/0471250953.bi1311s27
Li, Q., Yuan, X., Wang, Q., Chang, G., Wang, F., Liu, R., et al. (2016). Interactomic landscape of PA-X-chicken protein complexes of H5N1 influenza A virus. J. Proteomics 148, 20–25. doi: 10.1016/j.jprot.2016.07.009
Li, Z., Ouyang, H., Zheng, M., Cai, B., Han, P., Abdalla, B. A., et al. (2017). Integrated analysis of long non-coding RNAs (LncRNAs) and mRNA expression profiles reveals the potential role of LncRNAs in skeletal muscle development of the chicken. Front. Physiol. 7:687. doi: 10.3389/fphys.2016.00687
Liu, J., Fu, R., Liu, R., Zhao, G., Zheng, M., Cui, H., et al. (2016b). Protein profiles for muscle development and intramuscular fat accumulation at different post-hatching ages in chickens. PLoS ONE 11:e0159722. doi: 10.1371/journal.pone.0159722
Liu, J., Liu, Z., Chen, L., and Zhang, H. (2016a). iTRAQ-based proteomic analysis reveals alterations in the liver induced by restricted meal frequency in a pig model. Nutrition 32, 871–876. doi: 10.1016/j.nut.2016.01.020
Long, B., Yin, C., Fan, Q., Yan, G., Wang, Z., Li, X., et al. (2016). Global liver proteome analysis using iTRAQ reveals AMPK-mTOR-autophagy signaling is altered by intrauterine growth restriction in newborn piglets. J. Proteome Res. 15, 1262–1273. doi: 10.1021/acs.jproteome.6b00001
Minai, L., Martinovic, J., Chretien, D., Dumez, F., Razavi, F., Munnich, A., et al. (2008). Mitochondrial respiratory chain complex assembly and function during human fetal development. Mol. Genet. Metab. 94, 120–126. doi: 10.1016/j.ymgme.2007.12.007
Minjarez, B., Grisel Calderón-González, K., Luz Valero Rustarazo, M., Esther Herrera-Aguirre, M., Luisa Labra-Barrios, M., Rincon-Limas, D. E., et al. (2016). Identification of proteins that are differentially expressed in brains with Alzheimer's disease using iTRAQ labeling and tandem mass spectrometry. J. Proteomics 139, 103–121. doi: 10.1016/j.jprot.2016.03.022
Muntoni, F., Torelli, S., and Ferlini, A. (2003). Dystrophin and mutations: one gene, several proteins, multiple phenotypes. Lancet Neurol. 2, 731–740. doi: 10.1016/S1474-4422(03)00585-4
Pejznochova, M., Tesarova, M., Hansikova, H., Magner, M., Honzik, T., Vinsova, K., et al. (2010). Mitochondrial DNA content and expression of genes involved in mtDNA transcription, regulation and maintenance during human fetal development. Mitochondrion 10, 321–329. doi: 10.1016/j.mito.2010.01.006
Spácilová, J., Hulková, M., Hrustincová, A., Capek, V., Tesarová, M., Hansíková, H., et al. (2016). Analysis of expression profiles of genes involved in FoF1-ATP synthase biogenesis during perinatal development in rat liver and skeletal muscle. Physiol. Res. 65, 597–608.
Stockdale, F. E. (1992). Myogenic cell lineages. Dev. Biol. 154, 284–298. doi: 10.1016/0012-1606(92)90068-R
Szklarczyk, D., Franceschini, A., Wyder, S., Forslund, K., Heller, D., Huerta-Cepas, J., et al. (2015). STRING v10: protein-protein interaction networks, integrated over the tree of life. Nucleic Acids Res. 43, D447–D452. doi: 10.1093/nar/gku1003
Teltathum, T., and Mekchay, S. (2009). Proteome changes in Thai indigenous chicken muscle during growth period. Int. J. Biol. Sci. 5, 679–685. doi: 10.7150/ijbs.5.679
Wiese, S. (2007). Protein labeling by iTRAQ: a new tool for quantitative mass spectrometry in proteome research. Proteomics 7, 1004–1004. doi: 10.1002/pmic.200790019
Wigmore, P. M., and Stickland, N. C. (1983). Muscle development in large and small pig fetuses. J. Anat. 137(Pt 2), 235–245.
Xiong, Y., Tang, X., Meng, Q., and Zhang, H. (2016). Differential expression analysis of the broiler tracheal proteins responsible for the immune response and muscle contraction induced by high concentration of ammonia using iTRAQ-coupled 2D LC-MS/MS. Sci. China Life Sci. 59, 1166–1176. doi: 10.1007/s11427-016-0202-8
Ylihärsilä, H., Kajantie, E., Osmond, C., Forsén, T., Barker, D. J. P., and Eriksson, J. G. (2007). Birth size, adult body composition and muscle strength in later life. Int. J. Obes. 31, 1392–1399. doi: 10.1038/sj.ijo.0803612
Zhan, C., Li, X., Zhao, Z., Yang, T., Wang, X., Luo, B., et al. (2016). Comprehensive analysis of the triterpenoid saponins biosynthetic pathway in Anemone flaccida by transcriptome and proteome profiling. Front. Plant Sci. 7:1094. doi: 10.3389/fpls.2016.01094
Zhang, J., Li, C., Tang, X., Lu, Q., Sa, R., and Zhang, H. (2015). Proteome changes in the small intestinal mucosa of broilers (Gallus gallus) induced by high concentrations of atmospheric ammonia. Proteome Sci. 13:9. doi: 10.1186/s12953-015-0067-4
Zhang, Q., Lee, H., Han, J., Kim, E. B., Kang, S. K., Yin, J., et al. (2010). Differentially expressed proteins during fat accumulation in bovine skeletal muscle. Meat Sci. 86, 814–820. doi: 10.1016/j.meatsci.2010.07.002
Keywords: proteome, chicken, skeletal muscle, embryonic development, iTRAQ
Citation: Ouyang H, Wang Z, Chen X, Yu J, Li Z and Nie Q (2017) Proteomic Analysis of Chicken Skeletal Muscle during Embryonic Development. Front. Physiol. 8:281. doi: 10.3389/fphys.2017.00281
Received: 01 March 2017; Accepted: 18 April 2017;
Published: 08 May 2017.
Edited by:
Pierre De Meyts, De Duve Institute, BelgiumReviewed by:
Xuesong Yang, Jinan University, ChinaZhonglin Tang, Institute of Animal Science (CAAS), China
Copyright © 2017 Ouyang, Wang, Chen, Yu, Li and Nie. This is an open-access article distributed under the terms of the Creative Commons Attribution License (CC BY). The use, distribution or reproduction in other forums is permitted, provided the original author(s) or licensor are credited and that the original publication in this journal is cited, in accordance with accepted academic practice. No use, distribution or reproduction is permitted which does not comply with these terms.
*Correspondence: Qinghua Nie, nqinghua@scau.edu.cn