 Shuchi Smita
 Amit Katiyar
 Viswanathan Chinnusamy
 Dev M. Pandey
 Kailash C. Bansal
- 1ICAR-National Bureau of Plant Genetic Resources, Indian Agricultural Research Institute, New Delhi, India
- 2Department of Biotechnology, Birla Institute of Technology, Mesra, Ranchi, India
- 3Division of Plant Physiology, ICAR-Indian Agricultural Research Institute, New Delhi, India
MYB transcription factor (TF) is one of the largest TF families and regulates defense responses to various stresses, hormone signaling as well as many metabolic and developmental processes in plants. Understanding these regulatory hierarchies of gene expression networks in response to developmental and environmental cues is a major challenge due to the complex interactions between the genetic elements. Correlation analyses are useful to unravel co-regulated gene pairs governing biological process as well as identification of new candidate hub genes in response to these complex processes. High throughput expression profiling data are highly useful for construction of co-expression networks. In the present study, we utilized transcriptome data for comprehensive regulatory network studies of MYB TFs by “top-down” and “guide-gene” approaches. More than 50% of OsMYBs were strongly correlated under 50 experimental conditions with 51 hub genes via “top-down” approach. Further, clusters were identified using Markov Clustering (MCL). To maximize the clustering performance, parameter evaluation of the MCL inflation score (I) was performed in terms of enriched GO categories by measuring F-score. Comparison of co-expressed cluster and clads analyzed from phylogenetic analysis signifies their evolutionarily conserved co-regulatory role. We utilized compendium of known interaction and biological role with Gene Ontology enrichment analysis to hypothesize function of coexpressed OsMYBs. In the other part, the transcriptional regulatory network analysis by “guide-gene” approach revealed 40 putative targets of 26 OsMYB TF hubs with high correlation value utilizing 815 microarray data. The putative targets with MYB-binding cis-elements enrichment in their promoter region, functional co-occurrence as well as nuclear localization supports our finding. Specially, enrichment of MYB binding regions involved in drought-inducibility implying their regulatory role in drought response in rice. Thus, the co-regulatory network analysis facilitated the identification of complex OsMYB regulatory networks, and candidate target regulon genes of selected guide MYB genes. The results contribute to the candidate gene screening, and experimentally testable hypotheses for potential regulatory MYB TFs, and their targets under stress conditions.
Introduction
Plants are exposed to several environmental factors and accordingly modulate their growth and development. Excess or deficit of these environmental factors from their optimum levels adversely affect the plant growth and thus crop yield (Gao et al., 2007; Shinozaki and Yamaguchi-Shinozaki, 2007; Bansal et al., 2012). Plants respond and adapt to these cues, through various molecular, biochemical and physiological processes. These processes are regulated by transcriptional regulators which mediate the transcriptional regulation of several effector genes required for stress tolerance. Hence, understanding the regulatory hierarchy of gene expression in response to diverse environmental cues is important to improve the plant processes for enhancing agricultural production.
Systematic analysis of transcriptome data decipher regulatory networks, that helps in identification of candidate genes with certain degree of coordinated expression (Xue et al., 2012; Zhang et al., 2012; Smita et al., 2013). Correlation analyses are useful to identify co-regulated gene pairs in a signal transduction pathway as well as in identifying new candidate genes for specific processes (Gigolashvili et al., 2009; Mounet et al., 2009; Vandepoele et al., 2009). Proteins encoded by highly co-regulated genes are co-localized within the cell and often physically interact with each other. Several gene clustering methods are used to identify functionally coupled genes based on expression similarity (co-expression) levels in a given set of conditions. To study the functional association among genes “guide-gene” and “top-down” approaches are generally used in system biology study. In the guide-gene approach, genes with known functions are utilized to retrieve the correlated genes in the co-expression network, while top-down approach (non-targeted) is used to identify the local module from the large network based on network topology (Patnala et al., 2013). Further, relating these modules to functional enrichment analysis leads to the identification of gene function.
Network approach have been successfully applied in order to analyze correlated genes and hub genes using high throughput expression profiling data (Aoki et al., 2007; Yuan et al., 2008; Cramer et al., 2011; Movahedi et al., 2012). The major progress in molecular genetic analyses led to the identification of several genes and TFs that directly and/or indirectly (i.e., regulated by other pathway product) regulate the plant responses to abiotic stresses (Chinnusamy et al., 2004; Nakashima et al., 2009; Xu et al., 2011). TF genes encompass a considerable portion in plant genome, and can be grouped into different, often large, gene families on the basis of their specific DNA-binding domain. This specific DNA binding domain of TF interacts with target cis-elements in the promoter sequence, thereby controlling the expression of the target gene. The MYB domain containing TFs constitute one of the largest TF families in plant kingdom (Qu and Zhu, 2006). The first MYB (myeloblastosis) family of transcription factor identified was the “Oncogene” v-MYB identified in avian myeloblastosis virus (Klempnauer et al., 1982). Three v-MYB-related genes namely c-MYB, A-MYB, and B-MYB were subsequently identified in many vertebrates (Martin and Paz-Ares, 1997; Weston, 1998). MYB genes code for TFs with a characteristic 52 amino acid MYB motifs. These TFs contain one to four MYB domain direct repeats termed as R1, R2, R3, and R4 (Du et al., 2009). As their name implies, one R-MYB (MYB-related), two R-MYB, three R-MYB, four R-MYB have one, two, three, and four repeats, respectively. Each MYB domain has three regularly spaced tryptophan residues that are separated by 18 or 19 amino acid residues, and each domain form helix-turn-helix fold that is crucial for MYB TF–DNA interaction (Saikumar et al., 1990). Among these, two R-MYB (R2R3) are the richest class of MYB TF super-family genes in plants (Dubos et al., 2010). The MYB TFs play important role in wide range of biological processes such as cell cycle regulation (Cominelli and Tonelli, 2009), cell proliferation (Xie et al., 2010), developmental processes (Komaki and Sugimoto, 2012), hormone signal transduction (Zhao et al., 2014), and abiotic stress responses (Dai et al., 2007; Liu et al., 2011; Seo et al., 2011; Katiyar et al., 2012) in plants. Several researches have demonstrated the regulatory role especially of R2R3-MYB genes in various abiotic stresses responses (Pattanaik et al., 2010; Yun et al., 2010; Du et al., 2012; Zhang et al., 2012).
Advances in high throughput omics technologies complemented with comprehensive system biology approaches offers many ways to identify gene networks that operate in a given time or a biological processes. Several TF families have been explored for regulatory network study (Meier et al., 2008; Berri et al., 2009; Lim et al., 2010; Ouyang et al., 2012), while the MYB family network has not been explored in spite of its important roles in several biological processes. In the present study, we applied co-expression network based analysis, to dissect MYB transcriptional regulatory networks and their correlated links in rice. Taking into account the role of MYBs in diverse biological processes, we selected transcriptome data for five major processes such as developmental stages, abiotic stress response, biotic stress response, hormone signaling, and phosphorus deficiency stress response. Comprehensive correlation approach was employed to answer: (i) how OsMYBs network connectivity relates to the significant level of co-expression between OsMYBs by top-down approach; and (ii) how transcriptional regulatory network based analysis complementing with cis-regulatory elements relates to the putative target genes by guide-gene approach. Thus, the study revealed insight into the discovery of new links and usefulness of characterizing the interacting target genes that lead to the formation of complex transcriptional regulatory network (TRN) in plants.
Methods
OsMYB Identification and Their Genome-Wide Expression Profiling for Top-Down Approach
MYB domain was retrieved by searching for PFAM-ID PF00249 (MYB domain) as a query in rice genome at TIGR (http://rice.plantbiology.msu.edu/). The non-redundant dataset of MYB genes identified in rice genome MSU (release 7) was used as input for further validation by domain search at the Pfam database. Only the longest splice form was selected when more than one alternative splicing sequence was found for the same locus. These analyses led to the identification of 237 non-redundant OsMYBs genes in our study. Further, we discarded the loci lacking MYB-DNA binding domain but annotated as MYB protein family in MSU. Finally, we identified 233 OsMYBs genes in rice genome and named these MYBs following the nomenclature scheme suggested for TF genes in grasses (Gray et al., 2009). Affymetrix rice arrays were downloaded from NCBI Gene Expression Omnibus (GEO) (platform: GPL2025). Total fifty Affymetrix rice arrays representing five different conditions abiotic (drought, cold, salt), biotic (Magnaporthe oryzae strain Guy11), developmental stages (embryo, endosperm, root, leaf, and seedling), phosphorus deficiency, and hormone treatment (auxin; indole-3-acetic acid, and benzyl aminopurine) with minimum of two biological replicates were retrieved. The microarray data have been retrieved from NCBI GEO under the accession number of GSE6901, GSE18361, GSE11966, GSE35984, and GSE5167 (Table S1). Original.CEL files for were normalized using RMA (Bolstad et al., 2003) a package of the statistical software R-version 2.6.1, part of Bioconductor http://www.bioconductor.org/ (R Development Core, Gentleman et al., 2004). Normalization on total signal was performed using the “Robust Multi-array Average-RMA” method. In brief, gene expression raw data analysis was done using the robust multichip analysis algorithm (RMA) and t-test was used to calculate the P-value of the expression change of each probe set in each biological perturbation. Differentially expressed genes (DEGs) were identified based on normalized signal intensities of biological replicates for each samples using the limma package (Diboun et al., 2006). Fold change of gene expression was calculated using average signal intensities of biological replicates for each sample. OsMYBs were considered to be significantly up/down regulated when the log of expression value is ≥1.5 with adjusted P < 0.05.
Mapping of probes to gene models were done by searching in the MSU Rice Genome Annotation Project release—7 (based on a new pseudomolecule assembly, Os-Nipponbare-Reference-IRGSP-1.0). Microarray data used in the study were from Affymetrix platform (GPL2025) chip containing 57,381 probe sets, each consisting of 11 pairs of 25-mers probes. The 123 probes designed for bacterial/phage control were not included in further analysis. Particularly, when we searched probes matching for OsMYBs—264 probe sets matched for 223 OsMYB loci (more than one probes matched with one loci). Out of 223 OsMYBs, 219 were mapped to 262 probe sets, while no probe sets for 14 OsMYBs. Among 219 OsMYBs, 183 MYB genes had single probe, while the remaining 36 OsMYBs were represented by more than one probe. To avoid ambiguity during analysis, the average expression was calculated for the genes having multiple probes.
Expression Correlation Network Construction
The expression correlations assembled in matrix of all-versus-all OsMYB genes were calculated by Pearson correlation coefficient (PCC; r-value) that capture the linear relationships between any two given components. Expression correlation data were used for correlation network, where nodes represent genes and edges are correlation coefficient value among gene pair. The network was further visualized and analyzed using Cytoscape version 2.8.3 (Shannon et al., 2003).
Module Detection, Assessment and GO Enrichment Analysis
Highly interconnected genes were identified by best graph partitioning algorithms called Markov Clustering algorithm (MCL) (Van Dongen, 2008). The MCL algorithm is designed specifically for clustering of simple or weighted graphs. The MCL algorithm finds cluster structure in graphs by a mathematical bootstrapping procedure. Since the results of MCL depend heavily on the choice of an inflation parameter (I), we applied MCL to the networks constructed with varied I between 1.1 and 3.0 to identify the functional clusters. Clusters with less than three probesets are often biologically meaningless and were removed.
Further, the evaluation of functionally enriched were done by assessment of gene ontology (GO) term overrepresentation within a cluster, as discussed by Wong et al. (2014). Gene Ontology enrichment analysis was done by “g:Profiler” Gene Ontology enrichment analysis tool (http://biit.cs.ut.ee/gprofiler/) using the hypergeometric distribution adjusted by set count sizes (SCS) for multiple hypothesis correction (Reimand et al., 2011). SCS threshold remove enriched false positive GO terms and prioritizes truly significant results. Each probe IDs were assigned GO term, if it crossed the threshold adjusted P-values (SCS) < 0.05. The evaluation of cluster performance using MCL at various I-values was determined by calculating the fraction of modules enriched with one annotation at FDR < 0.05 (expressed as specificity) and the fraction of annotations enriched in at least one module at FDR < 0.05 (expressed as sensitivity), having at least two genes associated with the enriched annotation (Wong et al., 2013). The specificity and sensitivity values were then summarized as a functional enrichment score, the F-measure, calculated as the harmonic mean between specificity and sensitivity [(2 × Specificity × Sensitivity)/(Specificity + Sensitivity)].
Phylogenetic Analysis
Multiple sequence alignment of full OsMYB amino acid sequences was performed by Clustal X 2.0.11 using default parameters. Rooted phylogenetic tree topologies were constructed by the Neighbor-Joining (NJ) method and the distances were obtained using a PAM-like distance matrix. The pairwise deletion and p-distance model parameters were used. Bootstrap test (1000 replicates) was performed to validate the phylogenetic tree. The phylogenetic tree image was displayed with the iTOL programme (http://itol.embl.de/; Letunic and Bork, 2011). In tree view, the branches with >1000 bootstrap were shown as green nodes, while red nodes had >80 but < 1000 bootstrap value. Most of the genes with high Bootstrap values shown the evolutionary relatedness of genes with high confidence.
Transcriptional Co-regulatory Network Construction and Inference Using guide-Gene Approach
The transcriptional co-regulatory network was built by RiceFREND database (http://ricefrend.dna.affrc.go.jp/) with hierarchy equal to two and mutual rank was set as five (Sato et al., 2013). The database contains 815 microarray data from various tissues at different developmental stages and plant hormone treatment conditions with the access of single and multiple guide-gene searches. In order to exclude the expression correlation due to the constitutive expression pattern, the correlated genes with weighted PCCs higher than the optimal (0.6) thresholds were only extracted from the database and considered as the putative co-expressed genes.
Cis-Element Enrichment Analysis
PlantCARE database (http://bioinformatics.psb.ugent.be/webtools/plantcare/html/) was used to predict cis-regulatory elements in the promoter region (1 kb upstream from the translational start codon (Lescot et al., 2002). Over representation of cis-regulatory elements in promoter region (−1000 bp) were performed by de novo motif finder Multiple EM for motif elicitation tool (MEME; Bailey et al., 2006) with maximum number of motif set to five, E = 0.01, minimum motif width 6 and maximum motif width 10.
Subcellular Localization Prediction
Subcellular localization was predicted using consensus results of four localization predictor; Plant-PLoc (version 2) http://www.csbio.sjtu.edu.cn/bioinf/plant/ (Chou and Shen, 2008), (ii) WoLF PSORT http://wolfpsort.org/ (Horton et al., 2007), (iii) CELLO (version 2.5) http://cello.life.nctu.edu.tw/ (Yu et al., 2006), and (iv) GO slim from TIGR-MSU database.
Results
OsMYB Co-regulatory Network Using Top-Down Approach
Retrieval of OsMYBs and Transcriptome Data Pre-Processing
By a reiterative database exploration with Pfam-ID PF00249 as a query at TIGR, a total of 237 nucleotide sequences were retrieved from rice genome as putative OsMYB genes with at least one MYB domain. These candidate genes were further examined by searching for MYB domain at Pfam database. Based on this, we identified 233 MYB genes and named them following the nomenclature scheme suggested earlier (Gray et al., 2009; Table S2). Computational domain analysis of final non-redundant set of 233 MYB genes showed the presence of several other functional domains including WD domain, G-beta repeat, response regulator receiver domain, BTB/POZ domain, SWIRM/Zinc finger domain, and MYB-CC type transfactor (LHEQLE motif). In total, 113 MYB, 70 MYB related, 44 G2-like MYB, and 6 ARR-B MYB genes were identified and mapped on rice chromosomes. We observed the variant density distribution of MYB genes on rice chromosomes. It reflects the genome/ tandem duplication and gene amplification of MYB over evolutionary time.
Gene regulation in response to a physiological perturbation and those triggered by developmental stages can be inferred by appending one dataset with the other. As MYB has diverse role in stresses as well as developmental stages, we have mined and append genome wide expression data of OsMYBs from a total of 50 Affymetrix rice arrays for different conditions viz. abiotic (GSE6901), biotic (GSE18361), developmental stages (GSE11966), phosphorus deficiency (GSE35984), and hormone treatment (GSE5167; Table S1). Differentially expressed OsMYBs were identified based on normalized signal intensities of biological replicates for each sample. About 20% OsMYBs showed significant expression change (log fold ≥ 1.5; adjusted P = 0.05) in at least one of the experiment (Table S3). Gene Ontology enrichment analysis showed that OsMYBs differentially expressed were associated with genes involved in the regulation of biological process such as response to freezing, abiotic stress, endogenous stimulus, environmental stimulus, regulation of two-component signal transduction system (phosphorelay), etc., (Table S4). The transcriptional responses of MYB TFs to several cues clearly indicated the existence of a complex regulatory circuit comprising transcriptional activator as well as repressors. Hence, we utilized and correlated these data for understanding of regulatory network in further analysis.
OsMYB Co-expression Network Construction with Cross-Validated Expression Correlations
The complete expression data of 219 OsMYBs (mapped to the probsets; see Section OsMYB Identification and Their Genome-wide Expression Profiling for top-down Approach) was further recruited for co-regulatory network analysis. The correlations were measured using log transformed (logarithmic) expression values and co-expression network was built as well as analyzed with Cytoscape (Table S5A). The topology for networks was examined at different threshold of PCC. This showed that increasing PCC cutoff value leads to decrease in number of both nodes and edges (Figure 1A). It was observed that with increasing the PCC value from 0.85 to 0.90, the number of nodes was reduced by 37.67%, while the number of edges was dropped drastically by 69.46%. This drastic reduction in the number of edges may drop important biological interaction. Hence, to possess relatively large number of nodes and their correlation in the network, we opted 0.85 as stringent PCC cutoff value. For the topology, selecting PCC cutoff 0.85 was confirmed by plotting the number of edges, nodes, and network density as a function of the threshold values. The network density at the governed cutoff was ~0.027 in co-expression network, and increased thereafter (Figure 1B). The network created in this study satisfied the scale free topology (Figure 1C; Albert and Barabasi, 2000).
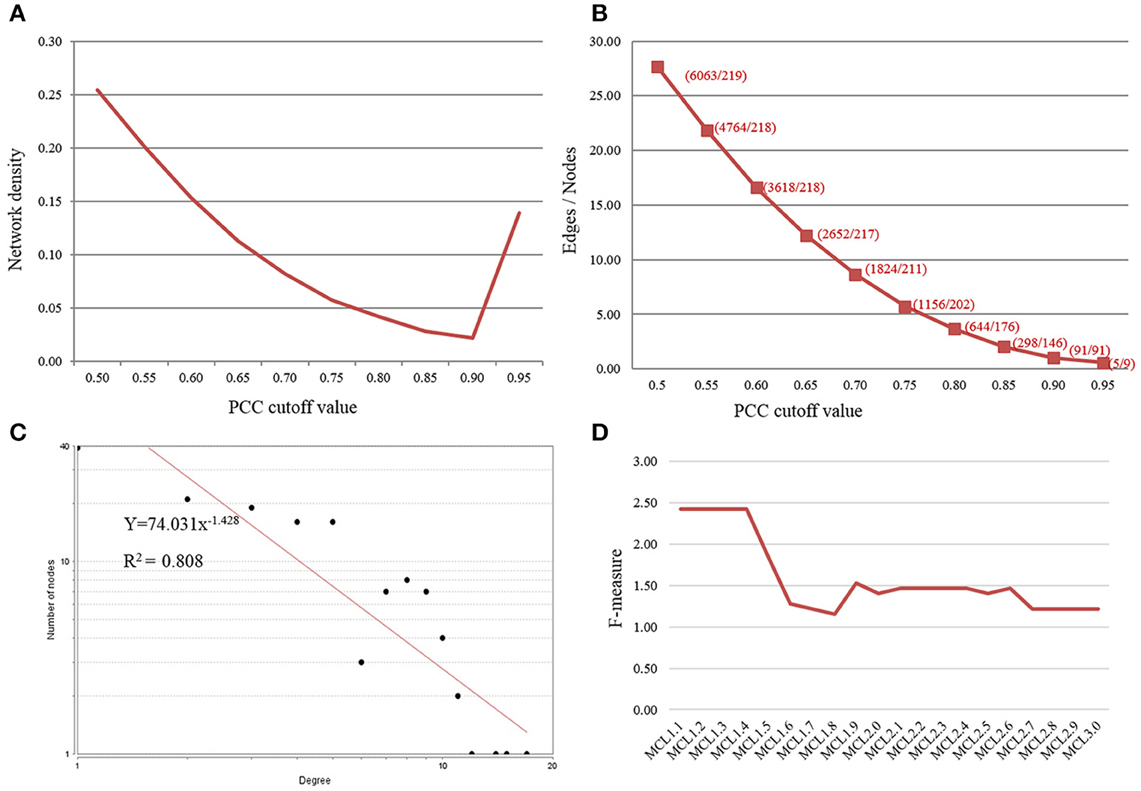
Figure 1. Selection of Pearson correlation coefficient (PCC) threshold value. (A) Plot of number of edges and nodes vs. PCC threshold value. (B) Plot of Network density as a function of PCC threshold value. (C) Network satisfying scale-free topology showed the node degree distribution following power law (R2 > 0.8). (D) Parameter evaluation and optimization of the MCL inflation score (I) for cluster performance by F-measure.
The preliminary co-expression network was constructed by connecting genes with PCC magnitude >0.85 and said to be strongly coexpressed genes (PCC > 0.85; positively co-expressed and < −0.85; negatively coexpressed) (Figure S1). Total of 146 (66.67%) OsMYBs and 298 correlations in network at 0.85 PCC cutoffs were obtained. Among all correlation, a total of 95.30% paired genes had positive correlation; while 4.69% paired genes had negative correlation (Table S5B). Genes with positive correlation depict the role of interacting partner in a coordinated manner in similar biological pathway, while genes showing negative correlation might be effective in opposite regulation of genes for a physiological response. This analysis revealed the existence of three major co-regulatory sub-networks with nodes having greater than 3°, in networks (Figure S1). Network analyses revealed that 151 out of 219 (68.95%) of the rice MYB genes analyzed in this study are coexpressed with diverse degree of connectivity with other OsMYBs.
Specificity of Module With GO Enrichment
Grouping of the cluster of coexpressed genes into “modules” also reflects regulatory relationships found in biological systems. One can conclude the function of unknown genes through “guilt by association” with well-characterized genes. We grouped the biologically related coexpressed genes by modular analysis to unravel the underlying functional processes. Several graph clustering methods based on sharing of common functional and expression relatedness are being used in biological science. We subjected the whole OsMYB network for module analysis by MCL (Markov Cluster) algorithm (Van Dongen, 2008). This algorithm has an important Inflation parameter (I). Higher value for I tends to produce a large number of modules but smaller in size. Parameter evaluation and optimization of the MCL inflation score (I) is often necessary to maximize clustering performance (the quality of derived GO predictions based on specificity, sensitivity and F-measure; Wong et al., 2013). We examined different inflation values between 1.1 and 3.0. At inflation value 1.1–1.3, no modules were obtained. At I value of 1.4 onwards diverse number of modules were obtained in network. Further, relating the largest module to diverse functional categories gives clue to opt the inflation cutoff value. We observed that an MCL I parameter of 1.4 produced the best clustering solution in terms of enrichment significance for GO biological process (BP) of most of the cluster and highest F-score (see the details in Methods Section; Table S6, Figure 1D). Therefore, with the inflation value set at 1.4, MCL detected 11 modules in the network with modularity (0.256; Figure 2). As node degree distribution, the module size distribution was also observed highly skewed. The largest module had 103 nodes; whereas smallest module had two nodes with one correlated edge in the network. Distribution of hub nodes was observed to be restricted to module 1 only.
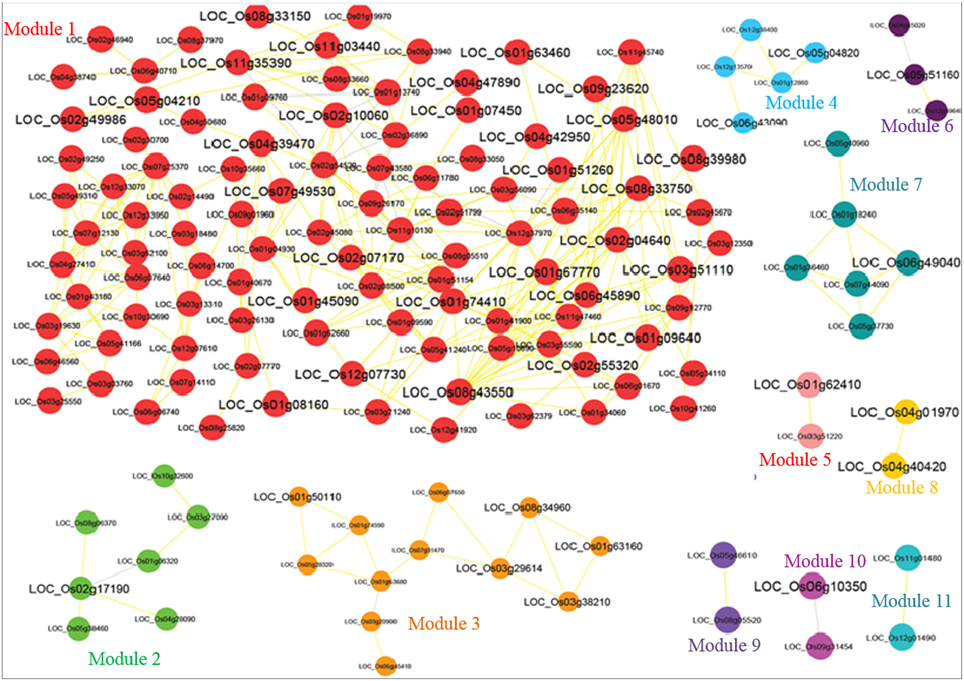
Figure 2. Co-regulatory rice OsMYB network identified by top-down approach. The 11 modules are shown in different color. Fonts in larger size indicate differentially expressed OsMYBs. The positive and negative correlation value is shown by yellow and gray color edges, respectively.
We took the modules having more than three correlated edges (i.e., six modules) for modular GO enrichment analysis. The network possesses more number of edges and confers co-regulation of genes even with large differences in expression level. We examined the significant modular GO functional enrichment analysis for six modules using g:profiler tool with cut-off using the hypergeometric distribution adjusted by set count sizes (SCS) p ≤ 0.05 (Figure 2). The module genes were significantly enriched in response to gibberellin stimulus (GO:0009739; g:scs < 6.94E-06), jasmonic acid stimulus (GO:0009753; g:scs < 5.54E-06), hormone stimulus (GO:0009725; g:scs < 1.17E-02), auxin stimulus (GO:0009733; g:scs < 6.27E-03), temperature homeostasis (GO:0001659; g:scs < 2.66E-04), abiotic stimulus (GO:0009628; g:scs < 5.10E-04), cold (GO:0009409; g:scs < 2.20E-03), response to freezing (GO:0050826; g:scs < 2.96E-04) etc. with highest significance. OsMYBs of module 3 were found to be significantly enriched with GO term positive regulation of response to stimulus (GO:0048584; g:scs < 1.04E-02). Besides, the molecular functions related to DNA binding and nucleic acid binding were significantly enriched. More detailed knowledge about the significant and unique biological processes, molecular functions, and cellular component where the OsMYBs act are given in Table S4.
Evaluating the Relationship Between Differential Expression and Functional Coherence of a Modular OsMYBs
The correlation analysis gave a hint to correlate the significant relationship between regulatory modular OsMYB genes and the differentially expressed OsMYBs. To investigate this relationship between differentially expressed genes in the network, we assessed topological properties of network and function of OsMYB nodes and hubs (labeled in red color in Figure S1, Figure 2). We observed this kind of relationship especially in 1st, 2nd, and 7th modules. Analysis showed that more than 50% of the genes of module 1 were found to be upregulated under drought conditions. Among them, one pair of OsMYB; LOC_Os09g23620 and LOC_Os02g04640 was positively correlated (0.80) with each other. We observed that LOC_Os02g55320 and LOC_Os01g67770 were positively correlated (0.90) with each other and were found to be up regulated in leaf by more than two-fold with significant enrichment of two-component signal transduction system.
First module gene LOC_Os03g51110 was found to be upregulated in leaf and down regulated in phosphorous deficiency and significantly enriched with response to organic substance. This gene positively correlated with other upregulated genes in the leaf viz. LOC_Os08g43550, LOC_Os06g45890, and LOC_Os08g33750. Most of the genes in second modules are induced in leaves, which imply that this module may serve as a tissue specific regulator in rice leaves, whereas some of them were found to be down regulated in root. LOC_Os11g03440 showed positive correlation with LOC_Os11g35390. Interestingly, module 3 contained 12 OsMYBs that were found to be negative regulator of leaf and all these genes were found to be correlated with each other. We observed correlation of LOC_Os01g63160 with two other OsMYBs viz. LOC_Os08g34960 and LOC_Os03g38210 genes, while LOC_Os03g38210 correlates with LOC_Os03g29614 and LOC_Os08g34960.
Assessment of Phylogenetic Conserved Modules
Considering the fact that the knowledge of sequence conservation is additive in identification of coexpressed gene clusters (Elnitski et al., 2006), phylogenetic analysis was performed with the Maximum Likelihood method using all OsMYB protein sequences to infer diverse conserved cluster. The tree revealed six main phylogenetic groups, which were further sub-grouped in to smaller clades based upon the bootstrap values. We then mapped the selected six functionally enriched modules (see Section Specificity of Module with GO Enrichment) on the phylogenetic tree (Figure 3). Particularly, genes lie in module 1, 2, and 3 were found to be in different clade with high bootstrap values. This illustration was signifying the sequence conservation of these modules as well as their co-regulatory roles. Majority of the network modules clearly grouped in to different phylogenetic groups suggesting that evolutionarily diverse OsMYBs contributing to orchestrate a specific common signal transduction pathway in a network.
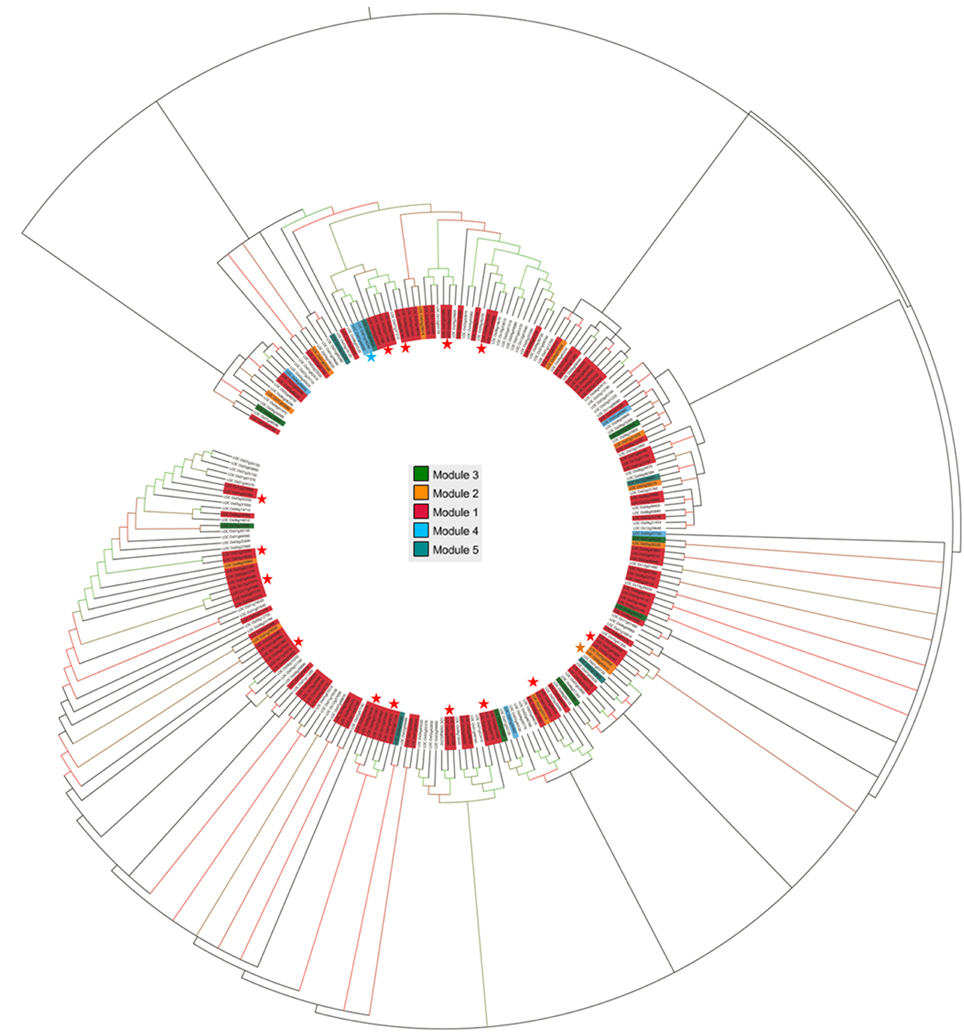
Figure 3. Phylogenetic tree of OsMYB proteins. OsMYBs lie in module 1 (highlighted in red), module 2 (in orange), module 3 (in green), and module 4 (in blue), were found to be evolutionary related with high bootstrap values. Gene pair marked with star (*) showed their sequence conservation with high boot strap value as well as coexpression which lies in same module. Bootstrap values higher than 80 are indicated by colored nodes (green nodes with >1000 bootstrap value; red nodes with >80 but < 1000 bootstrap value).
All clades identified based on evolutionary relatedness showed the existence of co-expressed MYB genes in clusters. Moreover, some of the OsMYBs of module 1, 2, 3, and 4 showed strong positive correlation within the whole network module as well as sequence conservation. For example, module 1 gene LOC_Os12g37970 had significant positive correlation (0.90) with LOC_Os11g47460 and observed to be evolutionarily conserved in largest phylogenetic group. LOC_Os07g44090 of module 4 had strong positive correlation (0.90) with LOC_Os01g18240 and occupied in thirrd phylogenetic cluster. We observed that OsMYB2P-1 (LOC_Os05g04820) protein was close to LOC_Os01g65370, LOC_Os05g3550, and OsMYB4 (LOC_Os04g43680) in 3rd phylogenetic cluster. Specificity of the genes lies in one module as well as together in one phylogenetic clad suggested its evolutionary role in co-regulatory manner.
Hub OsMYBs in Regulatory Network Exhibit Biological Significance
Genes with high degree of connectivity either positive/negative correlation was defined as hub genes. In this study, we defined “hubs” as nodes having five and more than five connectivity in the whole network (Patil and Nakamura, 2006; Lu et al., 2007). We found 51 OsMYBs as hub genes which were present in network (Table S5C). Additionally, candidate hub nodes that were significantly enriched in higher level of biological processes such as signaling were adopted as a factor for potential hub genes in the network. We observed high correlation (positive/negative) among hub nodes themselves. Among 51 hubs, 48 hub OsMYBs were significantly enriched with GO term, while three hub genes were not found to be enriched with any GO term. Among 48 hub OsMYBs, 17 were significantly enriched with response to salicylic acid stimulus, stimulus, hormone stimulus, jasmonic acid stimulus, gibberellin stimulus, and abscisic acid stimulus related GO biological processes (Table 1). Results revealed that nodes pertaining to molecular functions such as DNA binding (GO:0003677; g:scs < 4.29e-32), nucleic acid binding (GO:0003676; g:scs < 1.13e-21), two-component response regulator activity (GO:0000156; g:scs < 2.91E-02), organic cyclic compound binding (GO:0097159; g:scs < 7.12e-14), etc. The details of all 48 hub nodes and significantly enriched GO biological processes were summarized in the Table S4.
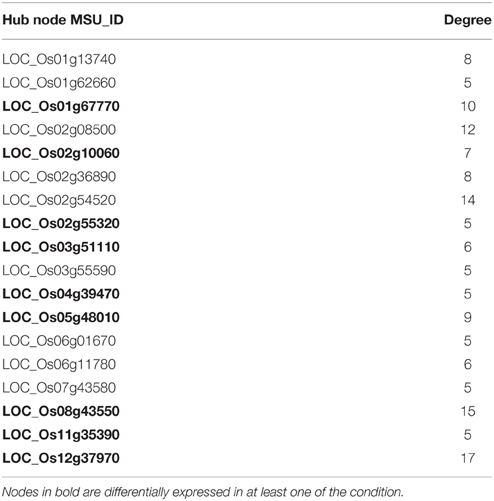
Table 1. Hub OsMYB genes that were significantly enriched with abiotic stress and hormone related Gene Ontology (biological process).
The hub node LOC_Os12g37970 with highest degree had 17 coexpressed neighbors; 15 positive and 2 negative, with an average correlation 0.88 and 0.86, respectively (Figure 4). GO analysis of sub-network of this highest degree node revealed that five nodes are significantly enriched with GO biological processes in response to stimulus and response to hormone stimulus. Among 17 coexpressed OsMYBs, six were found to be differentially expressed in at least one of the conditions taken in the present study. Where, three (LOC_Os01g74410, LOC_Os11g47460, and LOC_Os07g43580) were differentially expressed in our previous study under drought condition with more than 1.5-fold change (Katiyar et al., 2012). The function of individual genes was explored on the basis of GO annotation and found to be involved in endogenous stimulus, stress, abiotic, signal transduction pathways for all positively correlated genes. While two pair of genes with negative correlation; first the LOC_Os07g43580 has role in cell death, lipid metabolic process, biotic stimulus and other one LOC_Os01g51260 has role in flower development. These data clearly showed that the hub genes and their interacting genes as putative nodes to function in several stresses and hormones signaling pathway.
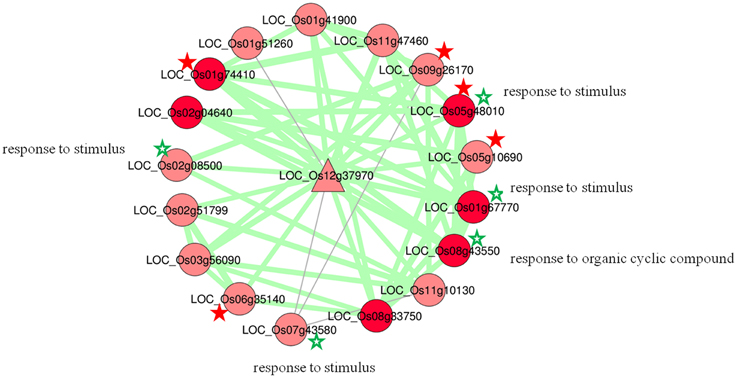
Figure 4. Hub OsMYBLOC_Os12g37970 with the highest connection in co-regulatory network. Differentially expressed nodes are in dark red color. Genes with abiotic stress related GO term are marked with green star (*). Characterized genes having role in abiotic stress response are highlighted with red star (*).
Abiotic Stress Responsive OsMYB Transcriptional Regulatory Network (TRN) by Guide-Gene Approach
Identifying directly co-regulated genes (i.e., genes that are both co-expressed and share conserved upstream regulatory sequences) is important for exploring the underlying transcriptional regulatory network and putative target genes (Imam et al., 2015). For this purpose, based on the available biological knowledge, certain OsMYBs were selected as guide genes that are known to play key role in a specific biological process. Total of 35 OsMYBs were chosen as guide genes to build global co-expression network that included 17 OsMYBs with previously known functions and 18 OsMYBs with more than two fold up-regulation under drought conditions in our previous study (Katiyar et al., 2012; Table S7A). The transcriptional regulatory networks have two types of nodes namely “TFs hub” and putative target genes. We employed recently published RiceFREND co-expression tool that contains microarray data for abscisic acid, gibberellins, jasmonic acid, developmental stages, etc., for co-expressed gene identification based on mutual ranking. Since hormones play significant role in adaptive response of plants to abiotic and biotic stresses, we opted RiceFREND database with multiple guide genes search option to understand the underlying transcriptional regulatory network. The resulting regulatory networks derived from this analysis contained a total of 163 correlated nodes (TFs and putative target genes) with 158 correlations that include 24 guide genes with cutoff of weighted PCC > 0.6 and mutual rank < 5 (Figure 5; Table S7B).
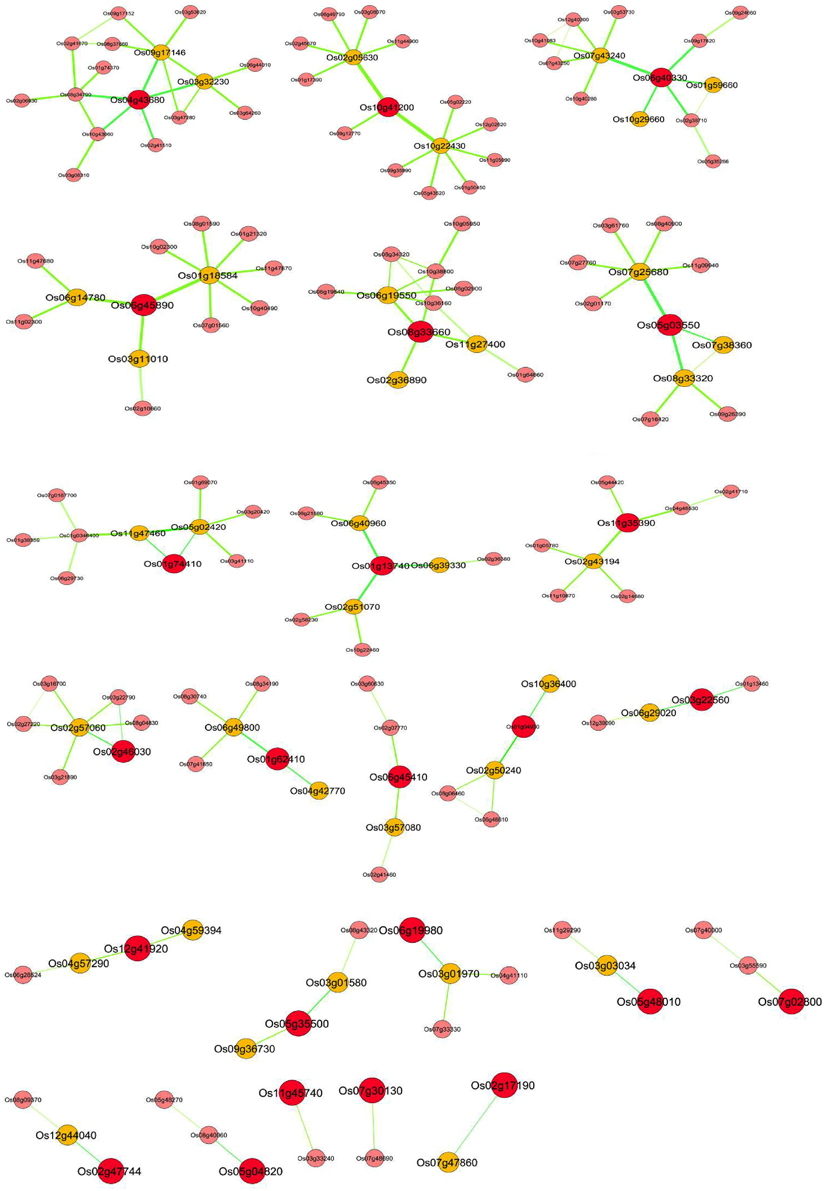
Figure 5. OsMYB transcriptional co-regulatory network constructed using guide-gene approach. The co-expression network of 24 reported drought responsive genes as guide OsMYBs (RAP_ID, enlarged red circle); their putative first neighbor target gene (RAP_ID, orange circle) based on integrative analysis of coexpressed gene and over representation of target promoter motif enrichment with that class of transcription factor. A link between two nodes indicates direct interaction with PCC > 0.64 and MR < 10. The thickness and brightness of the edges represents the confidence of the interaction.
The GO enrichment analysis of target genes showed that significant enrichment of biological processes such as response to abiotic stimulus (GO:0009628; g:scs < 1.25E-02), response to salicylic acid stimulus (GO:000975; g:scs < 5.36E-04), response to ethylene stimulus (GO:0009723; g:scs < 2.24E-02) response to gibberellin stimulus (GO:0009739; g:scs < 1.12E-03), etc. Interestingly as expected, the molecular function enrichment showed the term DNA binding (GO:0003677; g:scs < 1.04E-03) with highest enrichment. The cellular component showed the nucleus (GO:0005634; g:scs < 6.04E-08), intracellular organelle (GO:0043229; g:scs < 2.10E-03) with highest enrichment (Table S7C).
Co-regulated Drought Responsive Putative Target Genes of OsMYBs
Most of the guide OsMYB genes in the network were found to be involved in drought response and hence, the coexpressed genes were analyzed for the presence of drought response (or abiotic stress related) regulatory elements in their promoters. As shown in Figure 5, transcriptional regulators based on coordinated expression and over representation of the cis-elements associated with the OsMYB in putative target genes may support our finding. For this purpose, OsMYB co-regulatory network was further analyzed for similar promoter cis-elements. A total of 53 genes as a direct neighbor of 26 guide OsMYBs were found. Localization prediction showed that the majority of the co-regulated MYB TF-target pairs have nuclear localization. The presence of nuclear localization signal and GO cellular location in MYB TFs and their target genes suggest that these pairs are not only co-expressed but also localized in the same cellular (nucleus) location. Further, this suggests their putative physical interactions and function in the same signaling/gene expression pathway.
The results encouraged us to identify putative targets of guide OsMYB genes having MYB binding cis-elements in their promoter region. Interestingly, we observed around 40 (75%) putative target genes with at least one MYB binding region in their promoter region (Table 2). Remarkably, among all 40 putative targets, 27 (~67%) were found to be enriched with 44 MYB binding regions involved in drought-inducibility (MBS; CAACTG, and TAACTG), implying their regulatory role in drought response. Among 27, nine were annotated as unknown proteins having MYB binding cis-element in their promoter. Furthermore, MYB binding site involved in light responsiveness (MRE; AACCTAA) and flavonoid biosynthetic gene regulation (MBSII; AAAAGTTAGTTA) were also found to be enriched in the putative target genes. The results suggested the multiple functionality of MYB targeting genes which have association with abiotic stress, function in light signaling, flavonoid biosynthesis and circadian control (Kuno et al., 2003; Dubos et al., 2010).
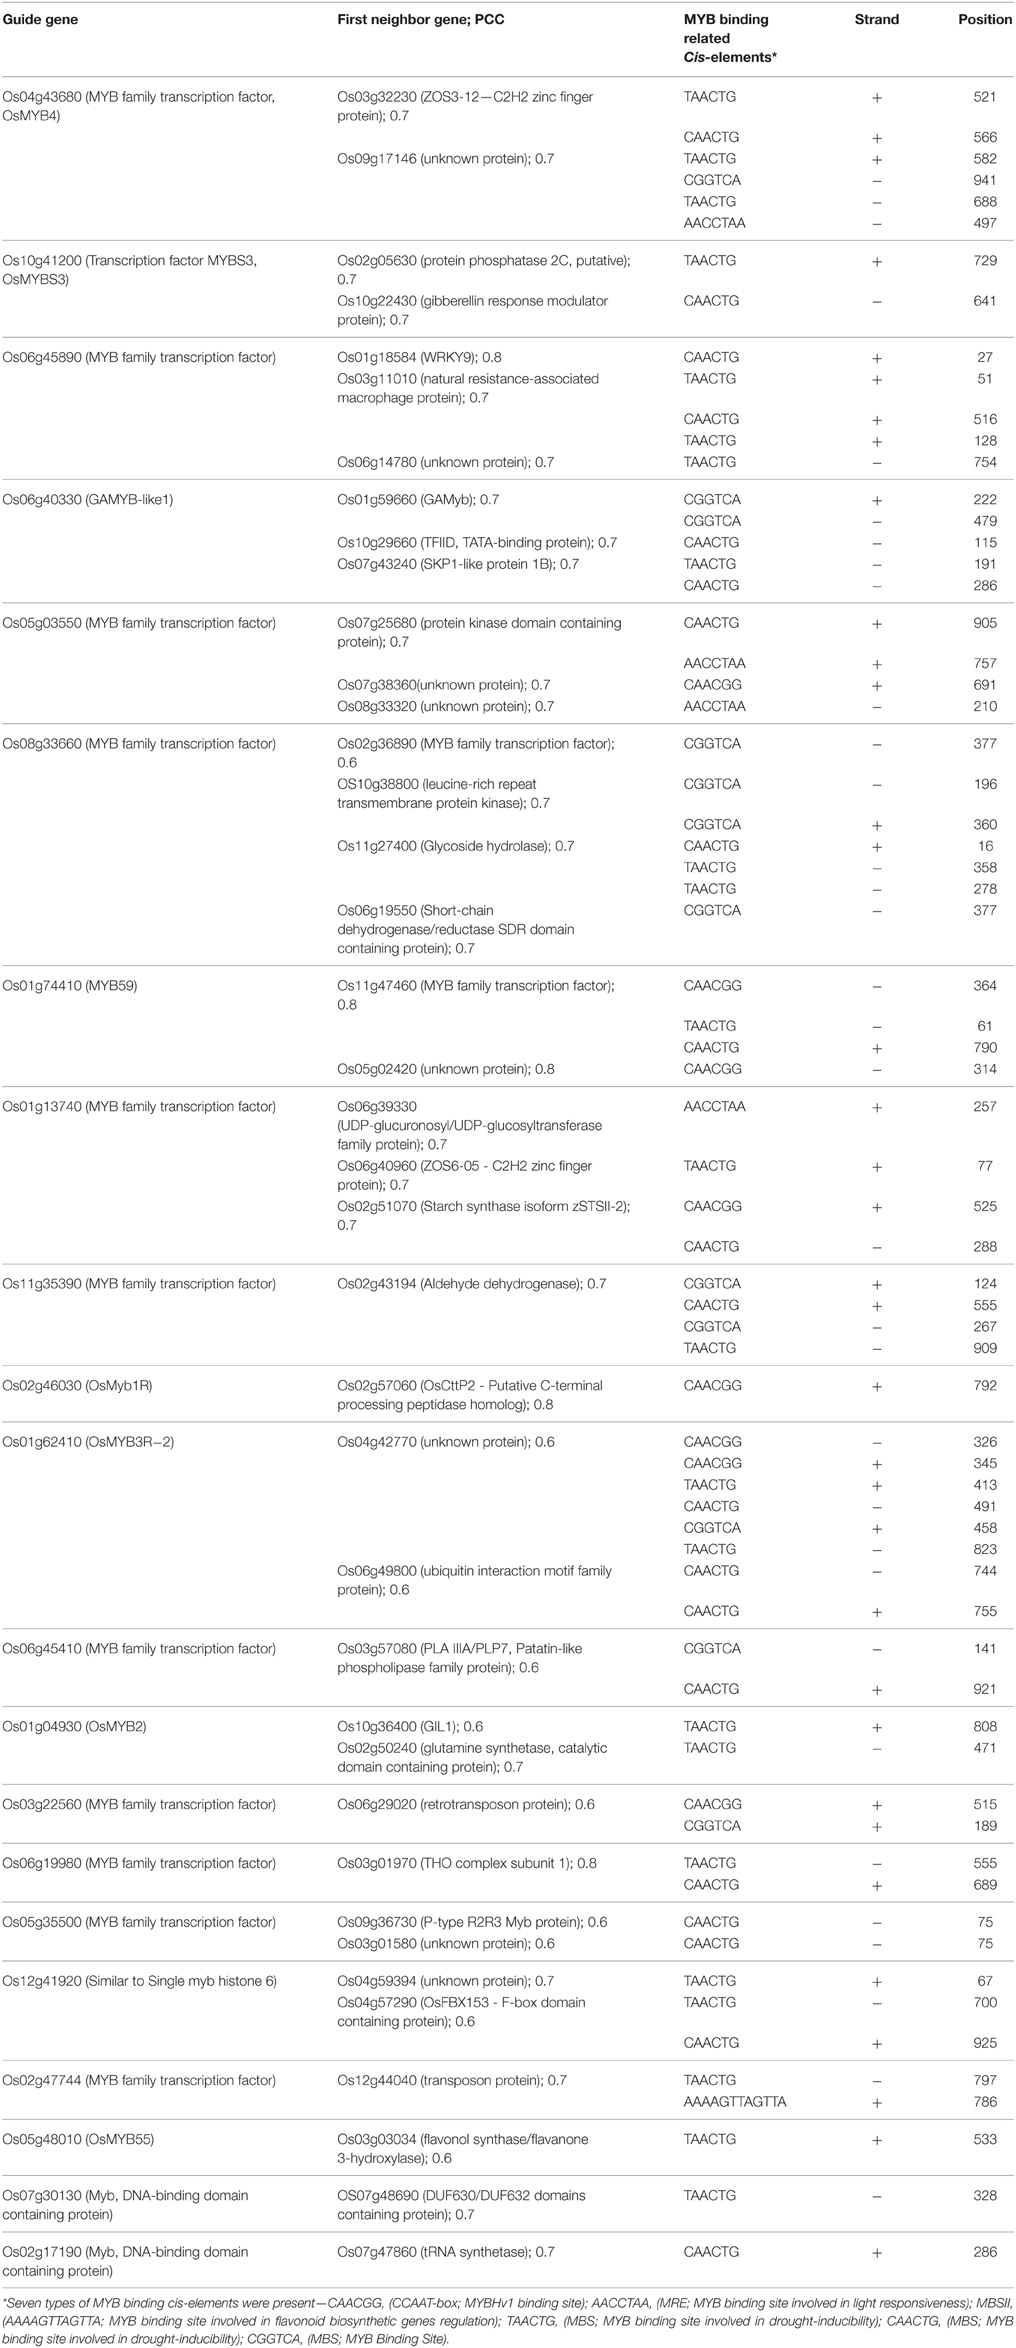
Table 2. The guide OsMYB genes and their first neighbor as putative target with MYB binding cis-elements within 1 kb upstream promoter region.
Along the MYB binding site involved in these processes, several other cis-elements were also found in good frequency. We categorized all the cis-elements in the seven broad categories on the basis of responsiveness for any perturbation (Figure 6). We observed the enrichment of light, abiotic stress and tissue specific cis-elements in the promoter region of first neighbor target of guide OsMYBs. Detailed promoter content has been summarized in Table S8A. Furthermore, the position of 44 MYB binding region involved in drought-inducibility revealed distinct patterns of sites related to proximal/distal location with respect to transcription start site (TSS). Majority of them (up to 75%) are far from TSS (~200 bp) indicating their distal type of gene expression regulation. Furthermore, the enrichment analysis of motif in 1000 bp promoter region performed by using MEME with minimum motif width 8 and maximum motif width 10 with E-value set to 0.01 (Table S8B). Results showed that four motifs were highly conserved in 186 sites in maximum of the target promoter sequences (Figure 7). Interestingly, we found CIRCADIAN CLOCK ASSOCIATED 1 (CCA1) motif which has been reported to be binding region of CCA1 MYB-related transcription factor (Wang et al., 1997). It supports our findings that these target genes identified in global co-regulatory network are putative and a researchable area in future.
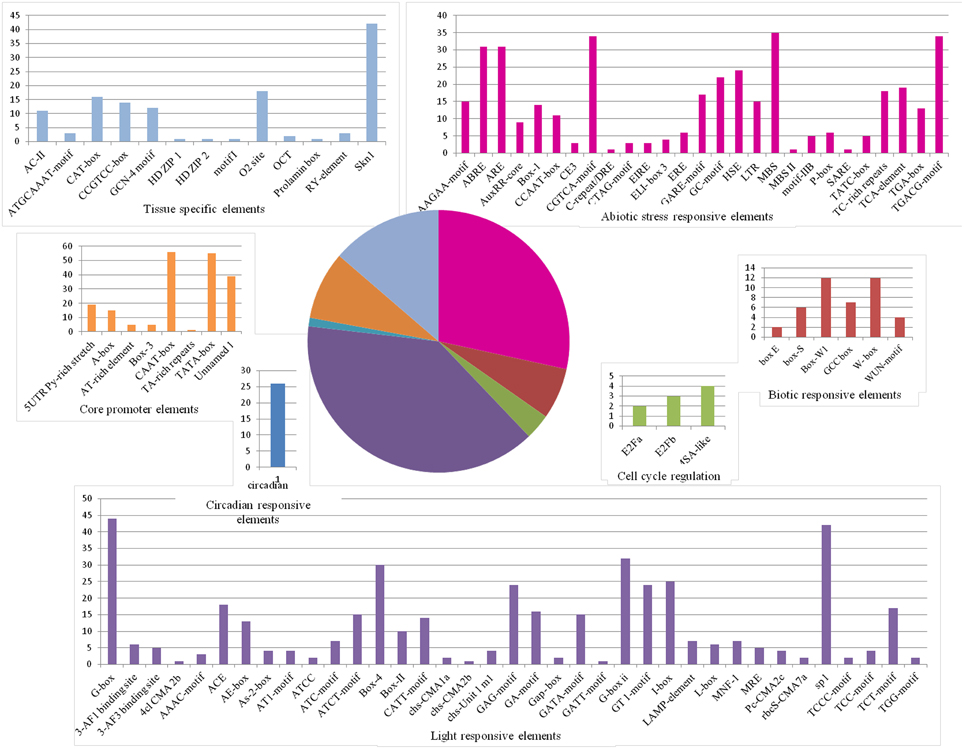
Figure 6. Frequency of cis-regulatory elements in the 1 kb promoter of first neighboring target genes of guide OsMYBs in the co-regulatory network. Pie chart depicts the categorized seven types of cis-regulatory elements and the corresponding colored bar chart depicts the occurrence of different cis-elements.
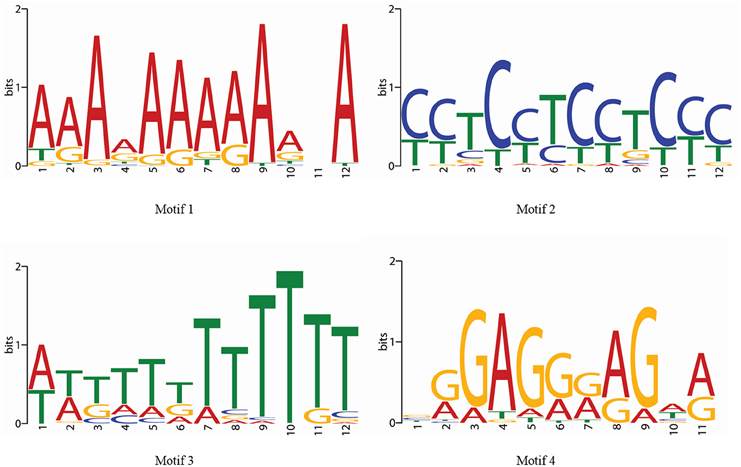
Figure 7. Four enriched motifs logo in the 1 kb promoter region of first neighboring target genes of guide OsMYBs in the co-regulatory network.
Consideration of the phylogenetic conservation of binding sites of the promoter elements can enhance the accuracy and have a higher likelihood of being functional in vivo (Elnitski et al., 2006). This approach relies on the principle that biologically important TF-binding sites are more likely to be conserved during evolution (Harbison et al., 2004; Dieterich et al., 2005). Therefore, relationship between phylogenetically conserved 1 kb promoter region of all correlated gene pair in the global network and modules were investigated (Figure S2). Results showed the evolutionary conservation of several pair of correlated genes. Co-regulated genes with MYB binding regions were examined for evolutionary conservation. Results showed the presence of putative target genes having MYB binding cis-element from module 2; 6–10 were evolutionarily conserved. Thus, the analysis performed via top down and guide gene approaches in this study identified the highly correlated hub OsMYBs and drought responsive putative target genes of OsMYBs. Several uncharacterized hub genes as well as co-expressed genes with guide genes annotated as unknown proteins in co-expression network represent high confidence candidate regulator awaiting further examination and validation in vitro.
Discussion
Inferring Function of Candidate OsMYBs in Co-expressed Modules
In this study, we carried out transcriptome analysis of OsMYB gene family in different abiotic, biotic, hormone stress and developmental stages to identify underlying regulatory network. The OsMYBs were first analyzed for their differential expression and putative functions. We found, OsMYBs differentially expressed were associated with genes involved in the regulation of biological process such as response to freezing, abiotic stress, endogenous stimulus, environmental stimulus, regulation of two-component signal transduction system (phosphorelay), The two-component system has been shown to play an important role in response to environmental stimuli and growth regulation (Hwang and Sheen, 2001; Du et al., 2007).
The subset of genes that are differentially expressed in particular sample are also observed to be correlated with each other in a co-expression network (Cho et al., 2012). In the OsMYBs network of co-expressed genes identified, from the function of known gene in the network, the potential function the co-expressed genes may be inferred and could be selected as candidates for functional verification by in vivo approaches. The preliminary gene network of OsMYBs was constructed with the relative stringent thresholds to reduce false connections. Module identification and comparison with DEGs showed, correlated OsMYB pair in 1st, 2nd, and 7th modules was also differentially regulated under any stress conditions taken in consideration (Figure 2). GO enrichment assessment of the modules revealed the significant enrichment of term related to abiotic stress related responses. Some of the candidate genes correlating with already characterized genes for a particular condition showed their role in similar biological pathways as extracted by GO analysis also. Taken together, the coexpression results largely confirm results from previous studies and provided additional clues into the complex molecular mechanism of OsMYBs. OsMYB3R-2 (LOC_Os01g62410) was found to be differentially expressed in drought and had positive correlation with LOC_Os03g51220 which was found to be involved in biosynthetic process. OsMYB3R-2 is known to confer tolerance to freezing, drought, and salt stresses in transgenic Arabidopsis (Ma et al., 2009). Several predicted OsMYBs were activated at early response mechanism in chilling stress (Yun et al., 2010).
LOC_Os06g45410 positively correlated with LOC_Os03g20900 and has role in biosynthetic processes (Table S5B). In a previous study, it was shown that LOC_Os03g20900 has a positive correlation (0.80) with OsATG6a which is involved in abiotic stress (heat, cold, and drought) and abscisic acid responses (Rana et al., 2012). The MYB genes have been studied for their cross talk in abiotic stress and hormone regulated gene expression (Peleg and Blumwald, 2011). ABA and auxin responses were regulated by ABI5-like1 (ABL1), a bZIP transcription factor, and the expression of LOC_Os05g04820 was changed in abl1 mutant (Yang et al., 2011). In our study, we observed its positive correlation with LOC_Os01g12860. A large number of TFs interact with calmodulin (CaMs) to mediate both biotic and abiotic stress responses (Laluk et al., 2012). Recently, several putative OsMYBs have been reported to interact with calmodulin (Chantarachot et al., 2012). In our study, we found correlation of CaM binding MYBs i.e., LOC_Os05g04210, LOC_Os11g45740 and LOC_Os01g45090 with other OsMYBs. GO slim analysis revealed that the participation of first two genes (LOC_Os05g04210 and LOC_Os11g45740) in response to abiotic stimulus and all trios in response to endogenous stimulus. In consistent with previous study, several OsMYBs of module were previously shown to play significant role in activation of immune response, regulation of response to stress as well as in defense response signaling pathway (Glazebrook, 2001). Module 1 genes pair were upregulated in leaf and significant enrichment of two-component signal transduction system. The two-component signal transduction system plays central role in cytokinin signaling and growth (Skerker et al., 2008; Schaller et al., 2011). Recently, it has been reported that the substantial difference in hormone signaling in several response regulators due to variation within their MYB-like DNA binding motif (Tsai et al., 2012). Hence, the correlated OsMYB genes may be good candidates for functional characterization of their role in abiotic stress and hormone responses.
Further identifying the hub nodes showed 51 hubs OsMYB in our study. These hub genes might have important roles in organizing the functional modules (Barabási and Oltvai, 2004). Some of the high degree functionally characterized hub genes such as OsMYBS1 (LOC_Os01g34060), OsMYBS2 (LOC_Os10g41260), and OsMYBS3 (LOC_Os10g41200) have been studied previously and found to mediate sugar and hormone regulation of α-amylase gene expression (Lu et al., 2002). Moreover, OsMYB3 is known to be essential for conferring cold tolerance to rice plants (Su et al., 2010). Another OsMYB55 (LOC_Os05g48010) with 9° has been shown to confer high temperature stress tolerance and modulation of amino acid metabolism (Wahid et al., 2007). A highest hub node LOC_Os12g37970 with 15 positively coexpressed MYB genes with their enriched GO terms “response to stimulus” and “hormone stimulus” as well as differential expression pattern suggest their function in stress and hormone signaling pathway (Figure 4). Where two negatively coexpressed OsMYBs with the hub genes showed their function in flower development, cell death and lipid metabolic process. That shows, environmental stress lead to the modulation in flower development and cell death might be due to (reactive oxygen species) ROS formation (Petrov et al., 2015).
Interestingly, we look at numerous scientific reports demonstrated the characterized genes in stress signal pathways from this highest hub cluster (Figure 4). Some of the correlated OsMYBs with this highest hub genes such as LOC_Os01g74410 has been characterized for significant improvement in tolerance to drought and salinity stresses in rice (Xiong et al., 2014). The ortholog of LOC_Os01g74410 i.e., TaMYB13-1 was also evidenced as transcriptional activator for fructan synthesis that known as protecting agent for drought and cold stress (Xue et al., 2011). The other coexpresssed LOC_Os01g51260 corresponds to the Arabidopsis MYB TF AT3G13890 that known to be activator of secondary wall thickening (Yang et al., 2007) and LOC_Os08g33750 ortholog in maize for ethylene-induced lysigenous aerenchyma formation under aerobic conditions (Takahashi et al., 2015). Another positive correlated OsMYB LOC_Os09g26170 was recently study for their significant role in MG-response and stress-responsive signal transduction pathways. (Kaur et al., 2015). Remarkably, two of the correlated 561 genes LOC_Os05g10690 and LOC_Os05g48010 were patented for enhancing yield-related traits in plants by modulating expression in a plant (Molinero, 2013). Hence, we hypothesize this high hub gene cluster have specific role in regulation of stress tolerance, in particular in defense mechanism as well as in crop yield improvement. And thus characterization of some uncharacterized MYB TF from this cluster can be a promising future direction.
Phylogenetically Preserved OsMYBs Reveals Strong Associations Between Genes Co-expression, Function and Evolution
The phylogenetic footprinting might be additive to coexpressed cluster and successfully being applied to determine expression association of genes (Elnitski et al., 2006). Exploring the co-expression and phylogenetic analysis suggested that the highly co-expressed genes with known role in specific regulatory processes were preserved in the network. We found such type of relation in module 1, 2, 3, and 4 (Figure 3). Two of the OsMYB2 (LOC_Os01g18240, LOC_Os05g04820) genes were found to be upregulated in phase-I of chilling stress, where OsMYB2 (LOC_Os01g18240) positively correlated with LOC_Os07g44090 (phylogenetically also closely related), LOC_Os05g40960, LOC_Os01g36460 and LOC_Os06g49040. The phylogenetically close pair was found to be involved in highly similar type of processes such as response to biosynthetic process, endogenous stimulus, reproduction, post-embryonic development. Two of the genes with high degree viz. LOC_Os01g74410 (MYB59) and LOC_Os01g51154 (R1-MYB) were found to be highly correlated with several other MYB genes in the network (Table S5B). It is in agreement with the study that the expression of these genes are modulated both by cold independent conditions (Park et al., 2010). We observed that OsMYB2P-1 (LOC_Os05g04820) protein was close to LOC_Os01g65370, LOC_Os05g3550, and OsMYB4 (LOC_Os04g43680) in 3rd phylogenetic cluster. OsMYB2P-1 is known to regulate phosphate starvation, cold, salt and osmotic stress responses, and also found to be up-regulated in phosphorus starvation in this study. This is in agreement with the results by Dai et al. (2012). A system biology approach has identified R2R3 motif MYB28 and two homologs, MYB29 and MYB76 genes that form a single clade with distinct and overlapping functions in regulation of aliphatic glucosinolates (Sønderby et al., 2007). These evidences showed the important regulatory roles of MYBs in several biological processes. Moreover, OsMYB4 is known to express in cold-mediated and cold-independent transcriptional network (Park et al., 2010). Evaluation of data revealed that the cluster of genes that are co-expressed lie in distinct phylogenetic clade, suggesting functional redundancy and their evolution by recent duplication.
Deciphering Transcriptional Regulatory Network for Putative Target Gene Identification
The first step in gene regulation is transcriptional regulation which is governed by the recognition of cis-element by the DNA binding domain of TFs. The assembly of TFs on the promoter cis-element region and their interaction in regulatory network profoundly influence the target gene expression. It is known that genes with similar expression pattern in the same biological function are likely to be regulated by same TF(s) (i.e., co-regulated) having similar cis-regulatory elements for the TFs were liable for putative target gene identification (Wang and Stormo, 2003; Walhout, 2006; Wang et al., 2009; Imam et al., 2015). Hence, we created another OsMYB network by guide gene approach to identify the putative target OsMYB genes on the basis of functional co-occurrence as well as MYB recognition cis-elements in their promoter region.
Among TFs, we observed ten guide OsMYBs were in correlation with other OsMYB genes forming a more complex feedback network. We also observe the presence of feedback motif in the target OsMYBs Comparing the results from both top-down and guide-gene approach showed the conservation of one correlated pair of OsMYB (LOC_Os11g47460, LOC_Os01g74410; PCC 0.98). Among correlated TFs such as WRKY, ZOS6-05—C2H2 zinc finger protein and helix–loop–helix (bHLH) protein were found. This suggests that the function of OsMYB proteins might require participation of various members of these transcription factors (Table S7B). It is in partial agreement with the recent study that showed transcriptional regulation by MYB–bHLH–WD40 (MBW) complex in the late step of flavonoid biosynthetic pathway (Hichri et al., 2011), GL2 expression and the non-hair or trichome fate (Schiefelbein, 2003).
Conclusively, in the present study we identified co-regulatory network and functional co-occurrence of modules of OsMYB genes in rice. This will contribute to illustrate the functions of gene cooperation pathways that have not yet been identified by classical genetic analyses. In the first part of the study, we adopted the top-down approach to decipher the OsMYBs with correlated expression pattern in different development and stress conditions. We defined the existence of OsMYBs gene clusters comprising both phylogenetically related and unrelated genes that were strongly coexpressed, signifying their evolutionary role in co-regulatory manner. A sum of 51 most highly connected hub OsMYBs were identified, some of them were expected to play the significant regulatory roles in abiotic stress tolerance. As the hubs have high correlation value, they may play crucial role in stress tolerance as well as development.
More importantly, our analyses revealed the existence of OsMYBs transcriptionally co-regulatory networks by taking guide OsMYB genes with known function under abiotic stress condition. This provided insight into the functional association of several uncharacterized genes and coexpressed putative target genes possessing MYB binding cis-elements in their promoter region. The presence of drought responsive MYB binding cis-elements in the putative target genes and guide genes with known drought stress response identified the co-regulatory network in response to drought stress. In several instances, these rationales for candidate gene screening and functional validation allowed us to generate hypotheses, which are experimentally testable and their relevance in a specific process involved in plant response to stress or hormone signals. Functional testing of in vivo interaction or action of the candidate co-expressed gene network modules and hubs will significantly enhance our knowledge on the function of MYB family and help develop improved rice genotypes. Therefore, the network modules predicted in the present study were of high biological relevance and revealed putative role for uncharacterized genes. Further, the outcome of the study offers new biological insights into the transcriptional regulatory networks that await experimental validation.
Author Contributions
SS, VC, KB conceived and designed the experiments. SS performed the experiments. SS analyzed the data. AK performed computational analysis. SS, VC, DP, KB wrote the paper. All authors read and approved the final manuscript.
Conflict of Interest Statement
The authors declare that the research was conducted in the absence of any commercial or financial relationships that could be construed as a potential conflict of interest.
Acknowledgments
The authors would like to thank the Indian Council of Agricultural Research (ICAR) for supporting this work through the ICAR-sponsored project on the National Initiative on Climate Resilient Agriculture (NICRA) project. VC was supported by NASF (ICAR) project (grant No. NFBSFARA/Phen 2015).
Supplementary Material
The Supplementary Material for this article can be found online at: http://journal.frontiersin.org/article/10.3389/fpls.2015.01157
Figure S1. OsMYB correlation network viewed in Cytoscape. Nodes in red color are differentially expressed at least in one condition.
Figure S2. Phylogenetic tree of 1 kb promoter sequences of guide OsMYB genes and their putative target genes. Putative target genes having MYB binding cis- elements in their promoter region are shown by italic fonts.
Table S1. Detailed list of affymetrix rice genome microarray datasets used for OsMYB genes correlation network analysis via top-down approach.
Table S2. List of retrieved OsMYB genes with their putative function.
Table S3. Differentially expressed OsMYB genes under diverse microarray experiments.
Table S4. Modular gene ontology enrichment analysis.
Table S5. Average logarithmic (A) signal values of 219 OsMYB protein encoding genes expressed under different microarray experiments. (B) Pearson correlation coefficient (PCC) among OsMYB genes in top down approach. (C) Simple and complex topological properties of correlation network of OsMYB genes. Red highlighted is hub nodes.
Table S6. Parameter evaluation and optimization of the MCL inflation score (I).
Table S7. (A) List of guide genes used to create global co-regulatory network via guide-gene approach. (B) Global co-regulatory network of guide OsMYB genes and their correlated allies with their description. (C) Gene ontology enrichment analysis of target genes.
Table S8. (A)List of cis-elements in 1 kb upstream promoter region of direct first neighbor of guide OsMYB genes in global co-regulatory network. (B) Motif enrichment analyses by MEME of direct first neighbor of guide OsMYB genes in global co-regulatory network.
References
Albert, R., and Barabasi, A.-L. (2000). Topology of evolving networks: local events and universality. Phys. Rev. Lett. 85, 5234–5237. doi: 10.1103/PhysRevLett.85.5234
Aoki, K., Ogata, Y., and Shibata, D. (2007). Approaches for extracting practical information from gene co-expression networks in plant biology. Plant Cell Physiol. 48, 381–390. doi: 10.1093/pcp/pcm013
Bailey, T. L., Williams, N., Misleh, C., and Li, W. W. (2006). MEME: discovering and analyzing DNA and protein sequence motifs. Nucleic Acids Res. 34, W369–W373. doi: 10.1093/nar/gkl198
Bansal, K. C., Katiyar, A., Smita, S., and Chinnusamy, V. (2012). Functional genomics and computational biology tools for gene discovery for abiotic stress tolerance. Improv. Crop Resist. Abiotic Stress Vols 1, 2, 321–335. doi: 10.1002/9783527632930.ch14
Barabási, A.-L., and Oltvai, Z. N. (2004). Network biology: understanding the cell's functional organization. Nat. Rev. Genet. 5, 101–113. doi: 10.1038/nrg1272
Berri, S., Abbruscato, P., Faivre-Rampant, O., Brasileiro, A. C., Fumasoni, I., Satoh, K., et al. (2009). Characterization of WRKY co-regulatory networks in rice and Arabidopsis. BMC Plant Biol. 9:120. doi: 10.1186/1471-2229-9-120
Bolstad, B. M., Irizarry, R. A., Astrand, M., and Speed, T. P. (2003). A comparison of normalization methods for high density oligonucleotide array data based on variance and bias. Bioinforma. Oxf. Engl. 19, 185–193. doi: 10.1093/bioinformatics/19.2.185
Chantarachot, T., Buaboocha, T., Gu, H., and Chadchawan, S. (2012). Putative calmodulin-binding R2R3-MYB transcription factors in rice (Oryza sativa L.). Thai. J. Bot. 4, 101–112.
Chinnusamy, V., Schumaker, K., and Zhu, J.-K. (2004). Molecular genetic perspectives on cross-talk and specificity in abiotic stress signalling in plants. J. Exp. Bot. 55, 225–236. doi: 10.1093/jxb/erh005
Cho, D.-Y., Kim, Y.-A., and Przytycka, T. M. (2012). Network biology approach to complex diseases. PLoS Comput. Biol. 8:e1002820. doi: 10.1371/journal.pcbi.1002820
Chou, K.-C., and Shen, H.-B. (2008). Cell-PLoc: a package of Web servers for predicting subcellular localization of proteins in various organisms. Nat. Protoc. 3, 153–162. doi: 10.1038/nprot.2007.494
Cominelli, E., and Tonelli, C. (2009). A new role for plant R2R3-MYB transcription factors in cell cycle regulation. Cell Res. 19, 1231–1232. doi: 10.1038/cr.2009.123
Cramer, G. R., Urano, K., Delrot, S., Pezzotti, M., and Shinozaki, K. (2011). Effects of abiotic stress on plants: a systems biology perspective. BMC Plant Biol. 11:163. doi: 10.1186/1471-2229-11-163
Dai, X., Wang, Y., Yang, A., and Zhang, W.-H. (2012). OsMYB2P-1, an R2R3 MYB transcription factor, is involved in the regulation of phosphate-starvation responses and root architecture in rice. Plant Physiol. 159, 169–183. doi: 10.1104/pp.112.194217
Dai, X., Xu, Y., Ma, Q., Xu, W., Wang, T., Xue, Y., et al. (2007). Overexpression of an R1R2R3 MYB gene, OsMYB3R-2, increases tolerance to freezing, drought, and salt stress in transgenic Arabidopsis. Plant Physiol. 143, 1739–1751. doi: 10.1104/pp.106.094532
Diboun, I., Wernisch, L., Orengo, C. A., and Koltzenburg, M. (2006). Microarray analysis after RNA amplification can detect pronounced differences in gene expression using limma. BMC Genomics 7:252. doi: 10.1186/1471-2164-7-252
Dieterich, C., Grossmann, S., Tanzer, A., Röpcke, S., Arndt, P. F., Stadler, P. F., et al. (2005). Comparative promoter region analysis powered by CORG. BMC Genomics 6:24. doi: 10.1186/1471-2164-6-24
Du, H., Feng, B.-R., Yang, S.-S., Huang, Y.-B., and Tang, Y.-X. (2012). The R2R3-MYB transcription factor gene family in maize. PLoS ONE 7:e37463. doi: 10.1371/journal.pone.0037463
Du, H., Zhang, L., Liu, L., Tang, X.-F., Yang, W.-J., Wu, Y.-M., et al. (2009). Biochemical and molecular characterization of plant MYB transcription factor family. Biochem. Biokhimiia 74, 1–11. doi: 10.1134/s0006297909010015
Du, L., Jiao, F., Chu, J., Jin, G., Chen, M., and Wu, P. (2007). The two-component signal system in rice (Oryza sativa L.): a genome-wide study of cytokinin signal perception and transduction. Genomics 89, 697–707. doi: 10.1016/j.ygeno.2007.02.001
Dubos, C., Stracke, R., Grotewold, E., Weisshaar, B., Martin, C., and Lepiniec, L. (2010). MYB transcription factors in Arabidopsis. Trends Plant Sci. 15, 573–581. doi: 10.1016/j.tplants.2010.06.005
Elnitski, L., Jin, V. X., Farnham, P. J., and Jones, S. J. (2006). Locating mammalian transcription factor binding sites: a survey of computational and experimental techniques. Genome Res. 16, 1455–1464. doi: 10.1101/gr.4140006
Gao, J.-P., Chao, D.-Y., and Lin, H.-X. (2007). Understanding abiotic stress tolerance mechanisms: recent studies on stress response in rice. J. Integr. Plant Biol. 49, 742–750. doi: 10.1111/j.1744-7909.2007.00495.x
Gentleman, R. C., Carey, V. J., Bates, D. M., Bolstad, B., Dettling, M., Dudoit, S., et al. (2004). Bioconductor: open software development for computational biology and bioinformatics. Genome Biol. 5:R80. doi: 10.1186/gb-2004-5-10-r80
Gigolashvili, T., Yatusevich, R., Rollwitz, I., Humphry, M., Gershenzon, J., and Flügge, U.-I. (2009). The plastidic bile acid transporter 5 is required for the biosynthesis of methionine-derived glucosinolates in Arabidopsis thaliana. Plant Cell Online 21, 1813–1829. doi: 10.1105/tpc.109.066399
Glazebrook, J. (2001). Genes controlling expression of defense responses in Arabidopsis–2001 status. Curr. Opin. Plant Biol. 4, 301–308. doi: 10.1016/S1369-5266(00)00177-1
Gray, J., Bevan, M., Brutnell, T., Buell, C. R., Cone, K., Hake, S., et al. (2009). A recommendation for naming transcription factor proteins in the grasses. Plant Physiol. 149, 4–6. doi: 10.1104/pp.108.128504
Harbison, C. T., Gordon, D. B., Lee, T. I., Rinaldi, N. J., Macisaac, K. D., Danford, T. W., et al. (2004). Transcriptional regulatory code of a eukaryotic genome. Nature 431, 99–104. doi: 10.1038/nature02800
Hichri, I., Barrieu, F., Bogs, J., Kappel, C., Delrot, S., and Lauvergeat, V. (2011). Recent advances in the transcriptional regulation of the flavonoid biosynthetic pathway. J. Exp. Bot. 62, 2465–2483. doi: 10.1093/jxb/erq442
Horton, P., Park, K.-J., Obayashi, T., Fujita, N., Harada, H., Adams-Collier, C. J., et al. (2007). WoLF PSORT: protein localization predictor. Nucleic Acids Res. 35, W585–W587. doi: 10.1093/nar/gkm259
Hwang, I., and Sheen, J. (2001). Two-component circuitry in Arabidopsis cytokinin signal transduction. Nature 413, 383–389. doi: 10.1038/35096500
Imam, S., Noguera, D. R., and Donohue, T. J. (2015). An integrated approach to reconstructing genome-scale transcriptional regulatory networks. PLoS Comput. Biol. 11:e1004103. doi: 10.1371/journal.pcbi.1004103
Katiyar, A., Smita, S., Lenka, S. K., Rajwanshi, R., Chinnusamy, V., and Bansal, K. C. (2012). Genome-wide classification and expression analysis of MYB transcription factor families in rice and Arabidopsis. BMC Genomics 13:544. doi: 10.1186/1471-2164-13-544
Kaur, C., Kushwaha, H. R., Mustafiz, A., Pareek, A., Sopory, S. K., and Singla-Pareek, S. L. (2015). Analysis of global gene expression profile of rice in response to methylglyoxal indicates its possible role as a stress signal molecule. Front. Plant Sci. 6:682. doi: 10.3389/fpls.2015.00682
Klempnauer, K. H., Gonda, T. J., and Bishop, J. M. (1982). Nucleotide sequence of the retroviral leukemia gene v-myb and its cellular progenitor c-myb: the architecture of a transduced oncogene. Cell 31, 453–463. doi: 10.1016/0092-8674(82)90138-6
Komaki, S., and Sugimoto, K. (2012). Control of the plant cell cycle by developmental and environmental cues. Plant Cell Physiol. 53, 953–964. doi: 10.1093/pcp/pcs070
Kuno, N., Møller, S. G., Shinomura, T., Xu, X., Chua, N.-H., and Furuya, M. (2003). The novel MYB protein EARLY-PHYTOCHROME-RESPONSIVE1 is a component of a slave circadian oscillator in Arabidopsis. Plant Cell 15, 2476–2488. doi: 10.1105/tpc.014217
Laluk, K., Prasad, K. V. S. K., Savchenko, T., Celesnik, H., Dehesh, K., Levy, M., et al. (2012). The calmodulin-binding transcription factor SIGNAL RESPONSIVE1 is a novel regulator of glucosinolate metabolism and herbivory tolerance in Arabidopsis. Plant Cell Physiol. 53, 2008–2015. doi: 10.1093/pcp/pcs143
Lescot, M., Dehais, P., Thijs, G., Marchal, K., Moreau, Y., van de Peer, Y., et al. (2002). PlantCARE, a database of plant cis-acting regulatory elements and a portal to tools for in silico analysis of promoter sequences. Nucleic Acids Res. 30, 325–327. doi: 10.1093/nar/30.1.325
Letunic, I., and Bork, P. (2011). Interactive Tree Of Life v2: online annotation and display of phylogenetic trees made easy. Nucleic Acids Res. 39, W475–W478. doi: 10.1093/nar/gkr201
Lim, S. D., Yim, W. C., Moon, J.-C., Kim, D. S., Lee, B.-M., and Jang, C. S. (2010). A gene family encoding RING finger proteins in rice: their expansion, expression diversity, and co-expressed genes. Plant Mol. Biol. 72, 369–380. doi: 10.1007/s11103-009-9576-9
Liu, H., Zhou, X., Dong, N., Liu, X., Zhang, H., and Zhang, Z. (2011). Expression of a wheat MYB gene in transgenic tobacco enhances resistance to Ralstonia solanacearum, and to drought and salt stresses. Funct. Integr. Genomics 11, 431–443. doi: 10.1007/s10142-011-0228-1
Lu, C.-A., Ho, T. D., Ho, S.-L., and Yu, S.-M. (2002). Three novel MYB proteins with one DNA binding repeat mediate sugar and hormone regulation of alpha-amylase gene expression. Plant Cell 14, 1963–1980. doi: 10.1105/tpc.001735
Lu, X., Jain, V. V., Finn, P. W., and Perkins, D. L. (2007). Hubs in biological interaction networks exhibit low changes in expression in experimental asthma. Mol. Syst. Biol. 3:98. doi: 10.1038/msb4100138
Ma, Q., Dai, X., Xu, Y., Guo, J., Liu, Y., Chen, N., et al. (2009). Enhanced tolerance to chilling stress in OsMYB3R-2 transgenic rice is mediated by alteration in cell cycle and ectopic expression of stress genes. Plant Physiol. 150, 244–256. doi: 10.1104/pp.108.133454
Martin, C., and Paz-Ares, J. (1997). MYB transcription factors in plants. Trends Genet. TIG 13, 67–73. doi: 10.1016/S0168-9525(96)10049-4
Meier, S., Gehring, C., MacPherson, C. R., Kaur, M., Maqungo, M., Reuben, S., et al. (2008). The Promoter signatures in rice LEA genes can be used to build a co-expressing LEA gene network. Rice 1, 177–187. doi: 10.1007/s12284-008-9017-4
Molinero, A. I. S. (2013). Plants having Enhanced Yield-Related Traits and a Method for Making the Same. Available online at: http://www.google.com/patents/US8569575 [Accessed November 16, 2015].
Mounet, F., Moing, A., Garcia, V., Petit, J., Maucourt, M., Deborde, C., et al. (2009). Gene and metabolite regulatory network analysis of early developing fruit tissues highlights new candidate genes for the control of tomato fruit composition and development. Plant Physiol. 149, 1505–1528. doi: 10.1104/pp.108.133967
Movahedi, S., van Bel, M., Heyndrickx, K. S., and Vandepoele, K. (2012). Comparative co-expression analysis in plant biology. Plant Cell Environ. 35, 1787–1798. doi: 10.1111/j.1365-3040.2012.02517.x
Nakashima, K., Ito, Y., and Yamaguchi-Shinozaki, K. (2009). Transcriptional regulatory networks in response to abiotic stresses in Arabidopsis and grasses. Plant Physiol. 149, 88–95. doi: 10.1104/pp.108.129791
Ouyang, Y., Huang, X., Lu, Z., and Yao, J. (2012). Genomic survey, expression profile and co-expression network analysis of OsWD40 family in rice. BMC Genomics 13:100. doi: 10.1186/1471-2164-13-100
Park, M.-R., Yun, K.-Y., Mohanty, B., Herath, V., Xu, F., Wijaya, E., et al. (2010). Supra-optimal expression of the cold-regulated OsMyb4 transcription factor in transgenic rice changes the complexity of transcriptional network with major effects on stress tolerance and panicle development. Plant Cell Environ. 33, 2209–2230. doi: 10.1111/j.1365-3040.2010.02221.x
Patil, A., and Nakamura, H. (2006). Disordered domains and high surface charge confer hubs with the ability to interact with multiple proteins in interaction networks. FEBS Lett. 580, 2041–2045. doi: 10.1016/j.febslet.2006.03.003
Patnala, R., Clements, J., and Batra, J. (2013). Candidate gene association studies: a comprehensive guide to useful in silico tools. BMC Genet. 14:39. doi: 10.1186/1471-2156-14-39
Pattanaik, S., Kong, Q., Zaitlin, D., Werkman, J. R., Xie, C. H., Patra, B., et al. (2010). Isolation and functional characterization of a floral tissue-specific R2R3 MYB regulator from tobacco. Planta 231, 1061–1076. doi: 10.1007/s00425-010-1108-y
Peleg, Z., and Blumwald, E. (2011). Hormone balance and abiotic stress tolerance in crop plants. Curr. Opin. Plant Biol. 14, 290–295. doi: 10.1016/j.pbi.2011.02.001
Petrov, V., Hille, J., Mueller-Roeber, B., and Gechev, T. S. (2015). ROS-mediated abiotic stress-induced programmed cell death in plants. Front. Plant Sci. 6:69. doi: 10.3389/fpls.2015.00069
Qu, L.-J., and Zhu, Y.-X. (2006). Transcription factor families in Arabidopsis: major progress and outstanding issues for future research. Curr. Opin. Plant Biol. 9, 544–549. doi: 10.1016/j.pbi.2006.07.005
Rana, R. M., Dong, S., Ali, Z., Huang, J., and Zhang, H. S. (2012). Regulation of ATG6/Beclin-1 homologs by abiotic stresses and hormones in rice (Oryza sativa L.). Genet. Mol. Res. GMR 11, 3676–3687. doi: 10.4238/2012.August.17.3
Reimand, J., Arak, T., and Vilo, J. (2011). g:Profiler–a web server for functional interpretation of gene lists (2011 update). Nucleic Acids Res. 39, W307–W315. doi: 10.1093/nar/gkr378
Saikumar, P., Murali, R., and Reddy, E. P. (1990). Role of tryptophan repeats and flanking amino acids in Myb-DNA interactions. Proc. Natl. Acad. Sci. U.S.A. 87, 8452–8456. doi: 10.1073/pnas.87.21.8452
Sato, Y., Namiki, N., Takehisa, H., Kamatsuki, K., Minami, H., Ikawa, H., et al. (2013). RiceFREND: a platform for retrieving coexpressed gene networks in rice. Nucleic Acids Res. 41, D1214–D1221. doi: 10.1093/nar/gks1122
Schaller, G. E., Shiu, S.-H., and Armitage, J. P. (2011). Two-component systems and their co-option for eukaryotic signal transduction. Curr. Biol. 21, R320–R330. doi: 10.1016/j.cub.2011.02.045
Schiefelbein, J. (2003). Cell-fate specification in the epidermis: a common patterning mechanism in the root and shoot. Curr. Opin. Plant Biol. 6, 74–78. doi: 10.1016/S136952660200002X
Seo, P. J., Lee, S. B., Suh, M. C., Park, M.-J., Go, Y. S., and Park, C.-M. (2011). The MYB96 transcription factor regulates cuticular wax biosynthesis under drought conditions in Arabidopsis. Plant Cell 23, 1138–1152. doi: 10.1105/tpc.111.083485
Shannon, P., Markiel, A., Ozier, O., Baliga, N. S., Wang, J. T., Ramage, D., et al. (2003). Cytoscape: a software environment for integrated models of biomolecular interaction networks. Genome Res. 13, 2498–2504. doi: 10.1101/gr.1239303
Shinozaki, K., and Yamaguchi-Shinozaki, K. (2007). Gene networks involved in drought stress response and tolerance. J. Exp. Bot. 58, 221–227. doi: 10.1093/jxb/erl164
Skerker, J. M., Perchuk, B. S., Siryaporn, A., Lubin, E. A., Ashenberg, O., Goulian, M., et al. (2008). Rewiring the specificity of two-component signal transduction systems. Cell 133, 1043–1054. doi: 10.1016/j.cell.2008.04.040
Smita, S., Katiyar, A., Pandey, D. M., Chinnusamy, V., Archak, S., and Bansal, K. C. (2013). Identification of conserved drought stress responsive gene-network across tissues and developmental stages in rice. Bioinformation 9:72. doi: 10.6026/97320630009072
Sønderby, I. E., Hansen, B. G., Bjarnholt, N., Ticconi, C., Halkier, B. A., and Kliebenstein, D. J. (2007). A systems biology approach identifies a R2R3 MYB gene subfamily with distinct and overlapping functions in regulation of aliphatic glucosinolates. PLoS ONE 2:e1322. doi: 10.1371/journal.pone.0001322
Su, C.-F., Wang, Y.-C., Hsieh, T.-H., Lu, C.-A., Tseng, T.-H., and Yu, S.-M. (2010). A novel MYBS3-dependent pathway confers cold tolerance in rice. Plant Physiol. 153, 145–158. doi: 10.1104/pp.110.153015
Takahashi, H., Yamauchi, T., Rajhi, I., Nishizawa, N. K., and Nakazono, M. (2015). Transcript profiles in cortical cells of maize primary root during ethylene-induced lysigenous aerenchyma formation under aerobic conditions. Ann. Bot. 115, 879–894. doi: 10.1093/aob/mcv018
Tsai, Y.-C., Weir, N. R., Hill, K., Zhang, W., Kim, H. J., Shiu, S.-H., et al. (2012). Characterization of genes involved in cytokinin signaling and metabolism from rice. Plant Physiol. 158, 1666–1684. doi: 10.1104/pp.111.192765
Vandepoele, K., Quimbaya, M., Casneuf, T., De Veylder, L., and Van de Peer, Y. (2009). Unraveling transcriptional control in Arabidopsis using cis-regulatory elements and coexpression networks. Plant Physiol. 150, 535–546. doi: 10.1104/pp.109.136028
Van Dongen, S. (2008). Graph clustering via a discrete uncoupling process. SIAM J. Matrix Anal. Appl. 30, 121–141. doi: 10.1137/040608635
Wahid, A., Gelani, S., Ashraf, M., and Foolad, M. R. (2007). Heat tolerance in plants: an overview. Environ. Exp. Bot. 61, 199–223. doi: 10.1016/j.envexpbot.2007.05.011
Walhout, A. J. M. (2006). Unraveling transcription regulatory networks by protein-DNA and protein-protein interaction mapping. Genome Res. 16, 1445–1454. doi: 10.1101/gr.5321506
Wang, T., and Stormo, G. D. (2003). Combining phylogenetic data with co-regulated genes to identify regulatory motifs. Bioinformatics 19, 2369–2380. doi: 10.1093/bioinformatics/btg329
Wang, X., Haberer, G., and Mayer, K. F. X. (2009). Discovery of cis-elements between sorghum and rice using co-expression and evolutionary conservation. BMC Genomics 10:284. doi: 10.1186/1471-2164-10-284
Wang, Z. Y., Kenigsbuch, D., Sun, L., Harel, E., Ong, M. S., and Tobin, E. M. (1997). A Myb-related transcription factor is involved in the phytochrome regulation of an Arabidopsis Lhcb gene. Plant Cell 9, 491–507. doi: 10.1105/tpc.9.4.491
Weston, K. (1998). Myb proteins in life, death and differentiation. Curr. Opin. Genet. Dev. 8, 76–81. doi: 10.1016/S0959-437X(98)80065-8
Wong, D. C., Sweetman, C., Drew, D. P., and Ford, C. M. (2013). VTCdb: a gene co-expression database for the crop species Vitis vinifera (grapevine). BMC Genomics 14:882. doi: 10.1186/1471-2164-14-882
Wong, D. C., Sweetman, C., and Ford, C. M. (2014). Annotation of gene function in citrus using gene expression information and co-expression networks. BMC Plant Biol. 14:186. doi: 10.1186/1471-2229-14-186
Xie, Z., Lee, E., Lucas, J. R., Morohashi, K., Li, D., Murray, J. A. H., et al. (2010). Regulation of cell proliferation in the stomatal lineage by the Arabidopsis MYB FOUR LIPS via direct targeting of core cell cycle genes. Plant Cell 22, 2306–2321. doi: 10.1105/tpc.110.074609
Xiong, H., Li, J., Liu, P., Duan, J., Zhao, Y., Guo, X., et al. (2014). Overexpression of OsMYB48-1, a Novel MYB-related transcription factor, enhances drought and salinity tolerance in rice. PLoS ONE 9:e92913. doi: 10.1371/journal.pone.0092913
Xu, Z.-S., Chen, M., Li, L.-C., and Ma, Y.-Z. (2011). Functions and application of the AP2/ERF transcription factor family in crop improvementf. J. Integr. Plant Biol. 53, 570–585. doi: 10.1111/j.1744-7909.2011.01062.x
Xue, G.-P., Kooiker, M., Drenth, J., and McIntyre, C. L. (2011). TaMYB13 is a transcriptional activator of fructosyltransferase genes involved in β-2,6-linked fructan synthesis in wheat. Plant J. 68, 857–870. doi: 10.1111/j.1365-313X.2011.04737.x
Xue, L.-J., Zhang, J.-J., and Xue, H.-W. (2012). Genome-wide analysis of the complex transcriptional networks of rice developing seeds. PLoS ONE 7:e31081. doi: 10.1371/journal.pone.0031081
Yang, C., Xu, Z., Song, J., Conner, K., Vizcay Barrena, G., and Wilson, Z. A. (2007). Arabidopsis MYB26/MALE STERILE35 regulates secondary thickening in the endothecium and is essential for anther dehiscence. Plant Cell 19, 534–548. doi: 10.1105/tpc.106.046391
Yang, X., Yang, Y.-N., Xue, L.-J., Zou, M.-J., Liu, J.-Y., Chen, F., et al. (2011). Rice ABI5-Like1 regulates abscisic acid and auxin responses by affecting the expression of ABRE-containing genes. Plant Physiol. 156, 1397–1409. doi: 10.1104/pp.111.173427
Yu, C.-S., Chen, Y.-C., Lu, C.-H., and Hwang, J.-K. (2006). Prediction of protein subcellular localization. Proteins 64, 643–651. doi: 10.1002/prot.21018
Yuan, J. S., Galbraith, D. W., Dai, S. Y., Griffin, P., and Stewart, C. N. Jr. (2008). Plant systems biology comes of age. Trends Plant Sci. 13, 165–171. doi: 10.1016/j.tplants.2008.02.003
Yun, K.-Y., Park, M. R., Mohanty, B., Herath, V., Xu, F., Mauleon, R., et al. (2010). Transcriptional regulatory network triggered by oxidative signals configures the early response mechanisms of japonica rice to chilling stress. BMC Plant Biol. 10:16. doi: 10.1186/1471-2229-10-16
Zhang, L., Yu, S., Zuo, K., Luo, L., and Tang, K. (2012). Identification of gene modules associated with drought response in rice by network-based Analysis. PLoS ONE 7:e33748. doi: 10.1371/journal.pone.0033748
Keywords: MYB TF, co-expression, co-regulatory, abiotic stress, rice, network analysis
Citation: Smita S, Katiyar A, Chinnusamy V, Pandey DM and Bansal KC (2015) Transcriptional Regulatory Network Analysis of MYB Transcription Factor Family Genes in Rice. Front. Plant Sci. 6:1157. doi: 10.3389/fpls.2015.01157
Received: 30 September 2015; Accepted: 07 December 2015;
Published: 24 December 2015.
Edited by:
Jörg Linde, Leibniz-Institute for Natural Product Research and Infection Biology-Hans-Knoell-Institute, GermanyReviewed by:
Hemant Ritturaj Kushwaha, International Centre for Genetic Engineering and Biotechnology, New Delhi, IndiaMika Gustafsson, Linköping University, Sweden
Copyright © 2015 Smita, Katiyar, Chinnusamy, Pandey and Bansal. This is an open-access article distributed under the terms of the Creative Commons Attribution License (CC BY). The use, distribution or reproduction in other forums is permitted, provided the original author(s) or licensor are credited and that the original publication in this journal is cited, in accordance with accepted academic practice. No use, distribution or reproduction is permitted which does not comply with these terms.
*Correspondence: Kailash C. Bansal, kailashbansal@hotmail.com
†Present Address: Shuchi Smita, The McFadden Northern Plains Biostress Laboratory, Plant Science Department, College of Agriculture and Biological Sciences, South Dakota State University, Brookings, SD, USA
Amit Katiyar, Department of Biophysics, All India Institute of Medical Science, Ansari Nagar, New Delhi, India