 Wei Zhang
 Soon-Tae Kwon1,3
 Daniel J. Kliebenstein
- 1Department of Plant Sciences, University of California, Davis, Davis, CA, USA
- 2National and Local Joint Engineering Laboratory for Energy Plant Bio-oil Production and Application, Key Laboratory of Bio-resource and Eco-environment, Ministry of Education, College of Life Sciences, Sichuan University, Chengdu, China
- 3Department of Horticulture and Breeding, Andong National University, Andong, South Korea
- 4DynaMo Center of Excellence, University of Copenhagen, Copenhagen, Denmark
Generalist necrotrophic pathogens including Botrytis cinerea cause significant yield and financial losses on Brassica crops. However, there is little knowledge about the mechanisms underlying the complex interactions encoded by both host and pathogen genomes in this interaction. This potentially includes multiple layers of plant defense and pathogen virulence mechanisms that could complicate in breeding broad spectrum resistance within Brassica species. Glucosinolates (GSLs) are a diverse group of defense metabolites that play a key role in interaction between Brassica and biotic attackers. In this study, we utilized a collection of diverse B. cinerea isolates to investigate resistance within the Brassica rapa R500 × IMB211 recombinant inbred line population. We tested variation on lesion development and glucosinolate accumulation in parental lines and all population lines. We then mapped quantitative trait loci (QTL) for both resistances to B. cinerea and defense metabolites in this population. Phenotypic analysis and QTL mapping demonstrate that the genetic basis of resistance to B. cinerea in B. rapa is isolate specific and polygenic with transgressive segregation that both parents contribute resistance alleles. QTLs controlling defensive GSLs are highly dependent on pathogen infection. An overlap of two QTLs identified between resistance to B. cinerea and defense metabolites also showed isolate specific effects. This work suggests that directly searching for resistance loci may not be the best approach at improving resistance in B. rapa to necrotrophic pathogen.
Introduction
Generalist necrotrophic pathogens including Botrytis cinerea are significant economic challenges on Brassica crops because of its ability to cause lesions on nearly all harvestable components of the plant including leaves, stems, florets, and pods (Bolton et al., 2006; Williamson et al., 2007). Thus, there is interest in breeding for resistance to B. cinerea within Brassica crop species. This is, however, complicated because resistance to B. cinerea is a highly quantitative trait with little evidence of major effect resistance loci (Denby et al., 2004; Finkers et al., 2007a,b, 2008; Rowe and Kliebenstein, 2008; Staal et al., 2008; Davis et al., 2009; Anuradha et al., 2011). The effort if further complicated by the desire to breed for broad spectrum resistance which runs into the complication that B. cinerea is a highly polymorphic pathogen with this genetic variation altering the virulence mechanisms by which the pathogen interacts with the plant (ten Have et al., 1998; Denby et al., 2004; Rowe and Kliebenstein, 2007, 2008; Amselem et al., 2011; Staats and van Kan, 2012). However, most genetic or molecular studies looking at how plants resist B. cinerea typically utilize individual isolates hindering the effort to find loci that provide potential resistance to a broad spectrum of B. cinerea isolates.
Defense metabolites including glucosinolates (GSLs), have frequently been linked to resistance to B. cinerea and other generalist necrotrophic pathogens within the Brassicas (Stotz et al., 2011; Buxdorf et al., 2013; Cargnel et al., 2014; Calmes et al., 2015). GSLs are sulfur containing secondary metabolites unique to the order Capparales whose genetics and chemistry have been extensively studied (Chan et al., 2010; Sønderby et al., 2010; Kliebenstein, 2014). In addition to necrotrophic resistance, these compounds also alter resistance to biotrophic pathogens, insects and aphids indicating that they are likely key players in numerous biotic interactions of Brassica plants (Kroymann and Mitchell-Olds, 2005; Pfalz et al., 2007, 2009; Fan et al., 2011; Weis et al., 2014; Kerwin et al., 2015). As a result of this role in numerous different biotic interactions, GSLs show extensive genetic variation in all tested Brassica’s but the link between this natural genetic variation and quantitative resistance to pathogens including B. cinerea has not been queried (Kliebenstein et al., 2002a,b; Wentzell et al., 2007; Chan et al., 2010; Velasco et al., 2011; Feng et al., 2012; Zou et al., 2013; Rahman et al., 2014; Brown et al., 2015; Gupta et al., 2015; Rout et al., 2015).
To test the influence of genetic variation in B. cinerea upon quantitative resistance in Brassica rapa, we utilized a collection of 14 genetically variable B. cinerea isolates to test for variation in lesion development on the IMB211 and R500 parents of a B. rapa RIL population (Iniguez-Luy et al., 2009). This identified a significant interaction of the host and pathogen genotypes on the quantitative resistance outcome of the interaction. We then proceeded to map resistance to five B. cinerea isolates in the IMB211 × R500 RIL population. Simultaneously, we measured glucosinolate accumulation in all the RILs in the presence and absence of the pathogen to map defense metabolite quantitative trait loci (QTLs). This showed that the detached leaf assay approach identified isolate specific resistance QTLs in B. rapa and that the defense metabolite QTLs were highly dependent upon the interaction with the pathogen. There was also an overlap of two QTLs between defense metabolites and resistance to B. cinerea but both loci showed isolate specific effects. This work suggests that a potential avenue going forward to breed for quantitative resistance to B. cinerea in B. rapa would be to focus on breeding for the proper defense metabolite blend. Or alternatively to stack isolate specific resistance loci to create the appearance of broad spectrum resistance. Further work is required to assess if these detached leaf identified loci will work in whole plant field based assays.
Materials and Methods
Bulking of Brassica rapa Germplasm
Seeds of the two parental lines of the B. rapa BraIRRi population, the annual yellow sarson R500 (male) and the rapid cycling IMB211 (female) (Williams and Hill, 1986) as well as the resulting recombinant inbred lines (RILs) population, were obtained (Iniguez-Luy et al., 2009). Both parental lines and 133 lines of RILs in this study were bulked during 2013 in the University of California, Davis greenhouses under a controlled environment. The plants were grown under a 12-h photoperiod under metal-halide lamps using a day/night temperature set at 25/18°C and relative humidity of 70. Plants were grown in 15-cm-diameter plastic round pot, filled with standard potting soil (Sunshine Mix #1; Sun Gro Horticulture) and ∼4.5 g of a slow-release fertilizer (14-14-14 Osmocote, Scotts). For bulking, all plants were bagged with mesh pollination bag during flowering to prevent cross-pollination. The plants were staked upright to produce larger fruits and reduce pathogen and herbivore attack. We watered the plants once a day and then reduced the watering times for about 2 weeks when the fruits began to mature. The seeds were harvested once the majority of the seedpods were dry and then stored separately in paper bags in a cool, dry, dark place until further use.
Growth of the R500 × IMB211 RIL Mapping Populations for QTL Analysis
For measuring the resistance to B. cinerea and GSL metabolite accumulation, the B. rapa parental lines and 120 RILs that had sufficient seed were raised in a controlled environment chamber at University of California, Davis. Three seeds of each genotype were sown in the center of a separate well of a 6 × 12 well tray filled with standard potting soil matrix and the tray was placed in a large planting flat (280 mm × 540 mm × 58 mm). All genotypes were randomized in a randomized complete block design. Two liters of nutrient-enriched water (0.5% N-P-K fertilizer in a 2-1-2 ratio; Grow More 4-18-38) were added into the flat to ensure the compost around seeds was moist. The flat was covered with a transparent plastic hood to maintain humidity during germination and placed into a chamber at 5°C to complete vernalization. After 3 days of chilling, the transparent hood was removed and the flat was transferred into a climate-controlled chamber with the temperature at 22°C and a photoperiod 10 h light: 14 h dark photoperiod. All plants were watered twice a week using nutrient-enriched water. At 21 days after sowing, 4–5 true leaves were harvested from each plant for analysis of lesion size and GSL content. The entire experiment was repeated a second independent time.
B. cinerea Isolates, Preparation of Conidia and Inoculation
Information for all B. cinerea isolates used in this study is described in previous reports (Denby et al., 2004; Kliebenstein et al., 2005). To collect spores for plant innoculation, all isolates were maintained as conidial suspensions in 30% glycerol at -80°C at our lab for long time storage. Conidia suspensions were swabbed on freshly prepared potato dextrose agar (PDA, Gibco/Invitrogen, Carlsbad, CA, USA) medium in Petri dishes and cultured at room temperature. Spores used for infection on B. rapa leaves were obtained as described (Rowe and Kliebenstein, 2008). The detached leaf assay has been utilized in numerous settings to identify causal loci controlling resistance to necrotrophic fungi. While this assay will miss loci controlling resistance in a whole plant context like pedicel transmission barriers, it is a useful approximation (Sharma et al., 2005; Mulema and Denby, 2012; Cowley et al., 2014; Boydom, 2015). For lesion assays and trypan blue staining, the fully developed detached leaves placed on 1% phytoagar in large plastic trays. Detached leaves were inoculated with 4 μL droplets of B. cinerea spore suspensions (10 spores/uL) in 50% filtered grape juice (Santa Cruz Organics, CA) at room temperature with light illumination. Control leaves (mock) were inoculated with of the 4 μL droplet of 50% filtered grape juice without spores. An abiotic GSL elicitor, AgNO3 (5 mM), was inoculated in the same way. Six independent infections were conducted per isolate/genotype pair across the two independent experiments. Digital photographs were taken every 8–12 h to examine the lesion development on leaves.
To test for differences in the B. rapa parental lines, we screened fourteen B. cinerea isolates for differential virulence against the two parental lines using six independent biological replicates per genotype/isolate combination. Susceptibility of B. rapa parental lines, R500 and IMB211, to diverse B. cinerea isolates was digitally measured by measuring the size of the developing fungal lesion after 72 h post inoculation. The lesion size for each isolate was compared between the two genotypes using ANOVA to test the statistical significance of influence of each experimental factor, or a specific interaction between experimental factors on the lesion size. The ANOVA model was lesion = plant genotype + fungal isolate + experiment replicate + plant genotype × fungal isolate + plant genotype × experiment replicate + fungal isolate × experiment replicate + error.
For QTL mapping, three isolates that showed significantly differential virulence between the two B. rapa parents, Ausubel, Davis navel, and Pepper, as well as the most virulent isolate, Katie tomato, and least virulent isolate UK Razz were used to measure lesion size on each RIL in threefold replication per experiment in two independent experiments for a total of six biological replicates. Seeds were sown in replicate and plants were measured for resistance to the different isolates as described above. After planting, there were 114 RILs left for the final lesion size analysis due to the failure of 6 RILs to grow. Least square means for all lesion data was then obtained using the ANOVA as described above for the parents.
Trypan Blue Staining
Trypan blue staining was used to visualize the growth and structure of mycelium and accompanying plant cell death caused by different B. cinerea isolates on leaves of both B. rapa parental lines. Staining of B. rapa leaves was performed at 12 h post-inoculation as previously described (van Wees, 2008). Briefly, the infected leaf tissues were transferred into a 50 mL plastic tube with lid and covered with 2.5 mg/mL trypan blue-lactophenol solution diluted in ethanol (96%; 1 :2 v/v). The plastic tube (lid slightly unscrewed) was heated in a boiling water bath for 1 min and the leaf tissues were left in staining solution at RT for about 12 h. Leaf tissues were destained by removing the staining solution and covering the tissues in chloral hydrate solution for 6 h and the distaining solution changed several times until the leaf tissues were clear. The cleared leaf tissues were placed into 50 mL plastic tubes with 70% glycerol. For analysis, stained leaf tissue was spread on a transparent plastic Petri dish and examined by taking high-resolution digital photos of the entire leaf tissue and each lesion
GSL Analysis
To measure the plants response to infection, GSLs were extracted, identified and quantified using a high-throughput analytical system from all of the above leaf tissue treated with B. cinerea isolates, Silver nitrate or grape juice after 72 h post inoculation (Kliebenstein et al., 2001a,b,c). Briefly, GSLs were identified by comparing the retention time of HPLC peak and UV absorption spectrum with standards (Reichelt et al., 2002). For the RILs, we were only able to obtain GSL values for the control and B. cinerea isolate Pepper infected samples due to a technical failure during sample storage. Each GSL was analyzed using the same statistical models as for the respective lesion size analysis described above.
QTL Analysis
To detect QTL for the lesion size and GSL content in the R500 × IMB211 RIL population, we used the least-square means for each trait for each RIL across all experiments. A high-resolution genetic map was obtained for the R500 × IMB211 RIL population from previously published resources (Devisetty et al., 2014). This was used in conjunction with the Composite interval mapping (CIM) algorithm as implemented by the cim function in the R/qtl analysis package to map QTL (Broman et al., 2003). The imputation method was selected and forward regression was used to identify three markers as covariates, with window size of 10 cM, an error of 0.0001, and 0 cM steps: cim(cross, method = “imp,” n.marcovar = 3, window = 10).
The LOD thresholds to call significant QTLs were estimated using 1000 permutation for each phenotype with a genome-wide significance level of p = 0.05 (Churchill and Doerge, 1994; Doerge and Churchill, 1996). Results obtained by CIM were analyzed and the define.peak function in R/eqtl analysis package was used to define the QTL with support LOD interval for each phenotypic trait (Broman et al., 2003). QTL were named with respect to their phenotypic traits and the cM position on the chromosome number. The additive effects of the loci along all chromosomes were estimated using the effectscan function in R/qtl package (Broman et al., 2003).
Testing of QTL Interactions
To identify QTL × Isolate or QTL x QTL interactions using the detected QTL, we conducted an ANOVA using all of the RILs. In the ANOVA model, the markers that most closely associated with each QTL were used as factors. Furthermore, the different isolates as well as the untreated data were all used within the model to allow B. cinerea isolates and the treatments to be used as factors in the model. We tested all the QTL main effects as well as all possible pairwise interactions, including the QTL × isolate, QTL x infection or QTL × QTL interactions where appropriate.
Results
Variable Resistance of B. rapa Genotypes to Diverse B. cinerea Isolates
To investigate resistance to B. cinerea, we tested two B. rapa genotypes, R500 and IMB211, for resistance to 14 isolates of this necrotrophic pathogen using a previously published foliar resistance assay (Table 1). This detached lesion assay has been widely used to identify necrotrophic resistance genes in a number of different systems (Sharma et al., 2005; Mulema and Denby, 2012; Cowley et al., 2014; Boydom, 2015). These isolates show extensive genomic variation (Atwell et al., 2015). Leaves of B. rapa R500 and IMB211 were inoculated with B. cinerea spore suspension from each of the 14 isolates and visible expansion of necrotic lesions appeared between 12 and 24 h post inoculation (HPI), indicating outgrowth of hyphae and the initial establishment of primary lesion. Most of the lesions induced by isolates were observed to spread beyond the inoculation droplets at 24 HPI, with lesions expanding in general more rapidly on IMB211 leaves. Chlorotic zones adjacent to the developing lesion were observed for all isolates on both plant genotypes with a tendency to extend to the distal regions of leaves, plants. Quantifying lesion diameter for all infections showed that there was a statistically significant effect of the B. rapa and B. cinerea genotypes and an interaction between the plant and pathogen genotype in controlling resistance (Table 1 and Figure 1). Comparison of the mean lesion diameters showed that in all instances where there was a significant effect, B. rapa R500 plants had smaller lesion sizes than IMB211 (Figure 1). In addition to the plant genotype, there were significant differences across the B. cinerea isolates for lesion size on the B. rapa genotypes ranging from the low virulence Fresa SD to higher virulence Apple 517 (Table 1 and Figure 1). While most isolates showed equal virulence on the two B. rapa genotypes, four B. cinerea isolates (Ausubel, Davis Navel, Pepper and Supersteak) showed significant differences in virulence across the B. rapa genotypes suggesting that there are Host × pathogen genetic interactions underlying the quantitative resistance of B. rapa to B. cinerea.
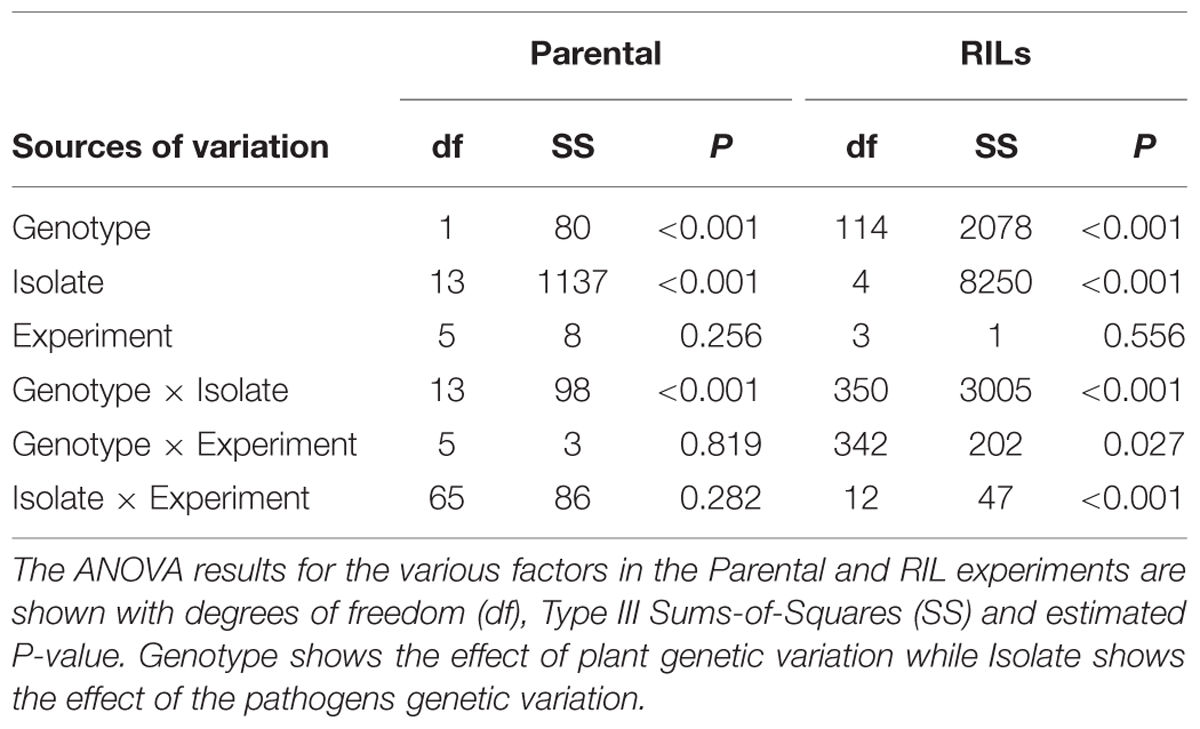
TABLE 1. ANOVAs for lesion size in the Brassica rapa parental genotypes and recombinant inbred lines (RILs).
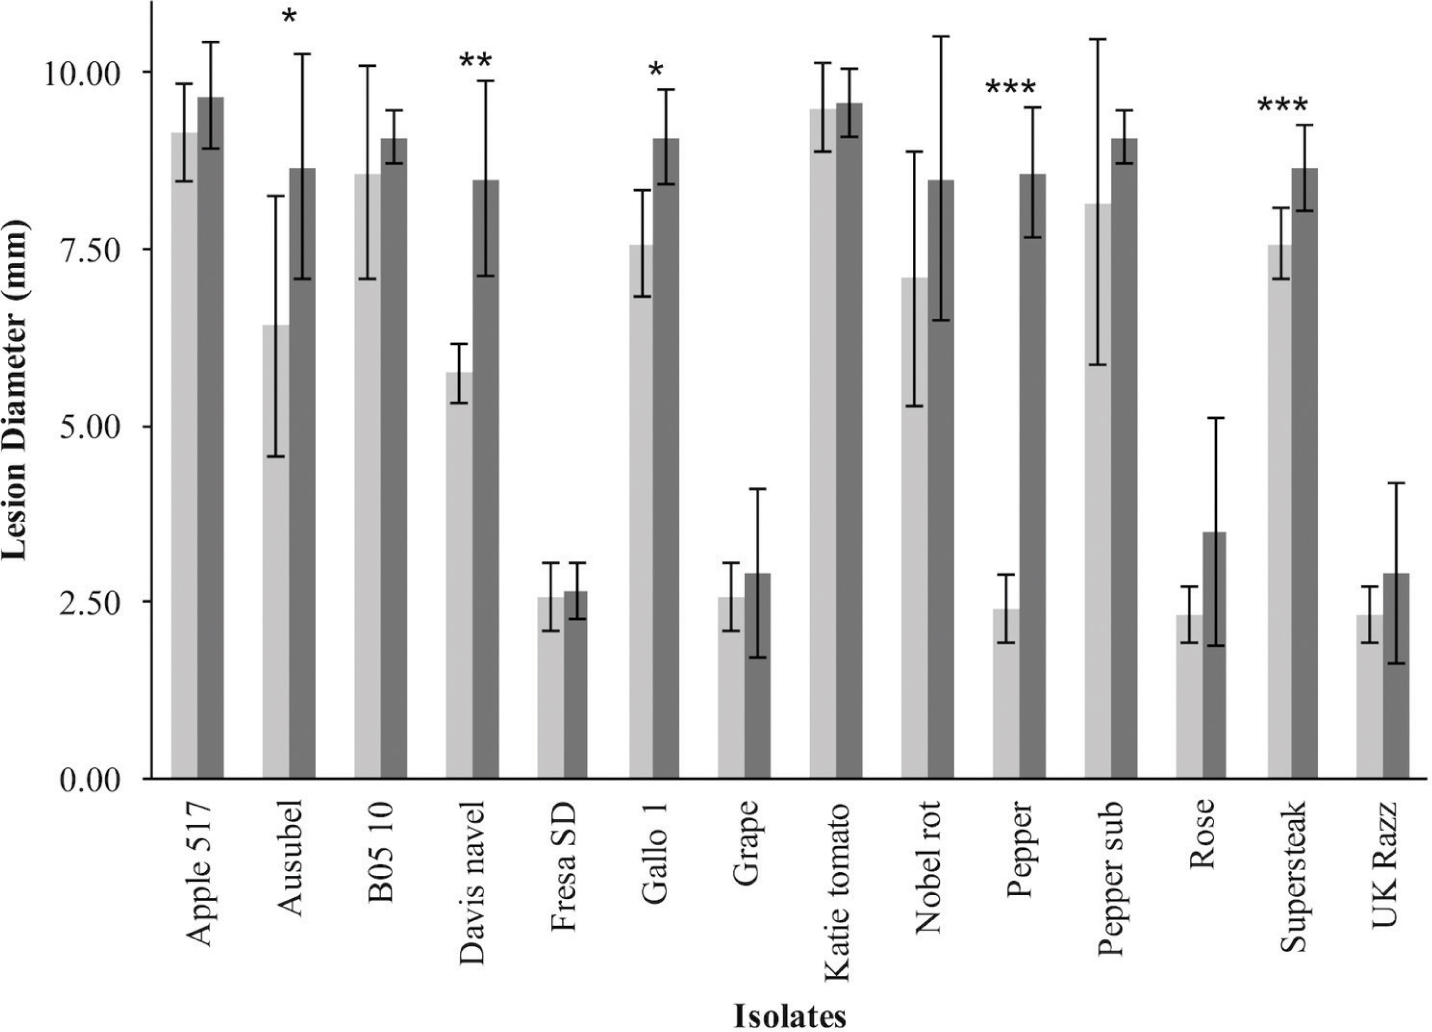
FIGURE 1. Differential Botrytis cinerea virulence on the R500 and IMB211 Brassica rapa RIL parents. B. rapa, R500 (light, left) and IMB211 (dark, right) were treated with various B. cinerea isolates at 72 h after inoculation and lesions quantified as described. Means of lesion size (n = 6) and standard error are presented. Asterisks identify isolates that have significant difference in virulence on the two B. rapa parents as determined using ANVOA and post hoc Tukey’s t-test to compare virulence within each isolate: ∗P < 0.05, ∗∗P < 0.01, ∗∗∗P < 0.001.
Morphological Analysis of the Interaction of B. rapa Genotypes with Diverse B. cinerea Isolates
To investigate if the quantitative variation in resistance between these B. cinerea isolates and B. rapa genotypes is apparent at the microscopic level, we stained the infected B. rapa leaves at 24 HPI (Figure 2). This allowed us to visualized plant vasculature, dead plant cells and fungal hyphae. In all cases, the fungal hyphae developed in the primary lesion, including those isolates that had extremely low virulence UK Razz, Rose or Fresa SD suggesting that the plant was preventing hyphal growth. There no consistent relationship between lesion outgrowth and hyphal production at 24 h with the strongly virulent Apple 517 and Katie Tomato showing similar hyphal distribution as the low virulent UK Razz, Rose or Fresa SD (Figure 2). Thus, the quantitative resistance that we are measuring in the B. rapa/B. cinerea system is not preventing hyphal germination or establishment (Figure 2). Instead, the quantitative resistance is altering the relative rate of outgrowth of the hyphae in each interaction. This is similar to what had previously been found in Arabidopsis thaliana (Rowe et al., 2010).
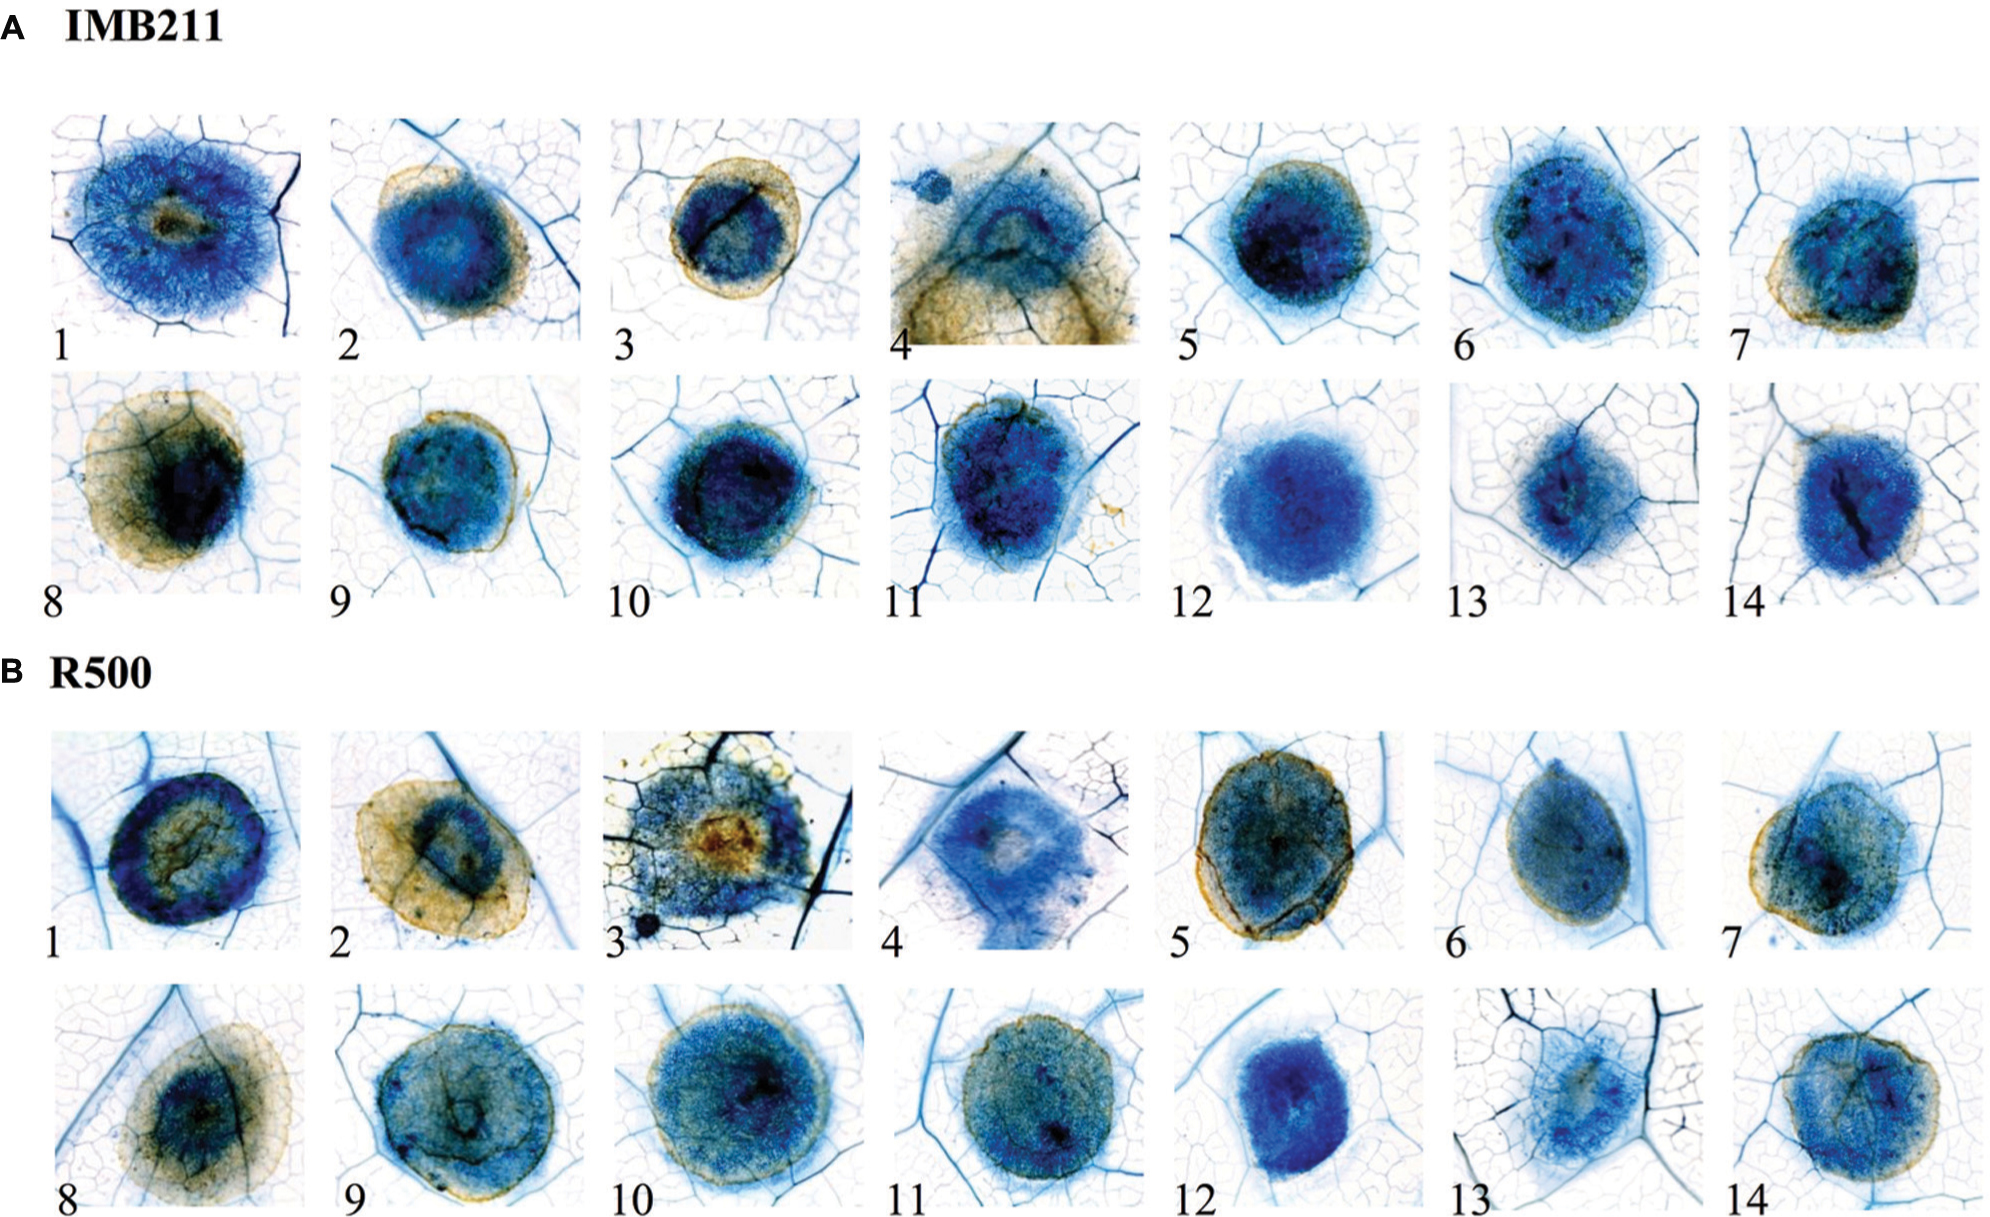
FIGURE 2. Microscopic analysis of B. cinerea virulence on the R500 and IMB211 B. rapa RIL parents. Lesion development on leaves of B. rapa parental lines (A) IMB211 and (B) R500 was assessed by Trypan blue staining at 24 h after inoculation with 14 Botrytis isolates. Numbers at the bottom indicate the 14 Botrytis isolates: 1 Apple 517, 2 Ausubel, 3 B05 10, 4 Davis navel, 5 Fresa SD, 6 Gallo 1, 7 Grape, 8 Katie tomato, 9 Nobel rot, 10 Pepper, 11 Pepper sub, 12 Rose, 13 Supersteak, 14 UK Razz.
QTLs for Quantitative Resistance to B. cinerea
To begin identifying the loci that may control the quantitative interaction of B. rapa with B. cinerea, we measured lesion diameter on leaves of the B. rapa R500 × IMB211 RIL population using five B. cinerea isolates (Iniguez-Luy et al., 2009). We utilized three B. cinerea isolates that showed different virulence on R500 and IMB211 (Ausubel, Davis Navel and Pepper) as well as one strongly virulent (Katie Tomato) and one avirulent (UK Razz) isolate that had no difference between the two parents (Figures 1 and 3). Lesion development induced by the five fungal isolates was significantly influenced by B. rapa genotypic variation (p < 0.001), B. cinerea isolate variation (p < 0.001) and the interaction of the two as determined using analysis of variance (ANOVA; Table 1). This further supports that there are genotypic dependent interactions between B. cinerea and B. rapa. The B. rapa RIL population displayed a range of variation for lesion size trait that was different for all five B. cinerea isolates (Figure 3). Using the Ausubel and Pepper isolates showed a distribution that skewed toward the sensitive IMB211 parent. In contrast, the Davis Navel isolate highlighted a distribution that was more evenly spread between the parental values. Interestingly, for both isolates that had no difference between the IMB211 and R500 parents, we were able to identify underlying variation in the resistance traits. For example, the Katie Tomato isolate that was equally virulent on the IMB211 and R500 parents identified a large number of RILs that transgressively segregated for increased resistance (Figure 3). Thus, the equal resistances of IMB211 and R500 to these two isolates are caused by opposing resistance alleles in the two B. rapa RIL parents.
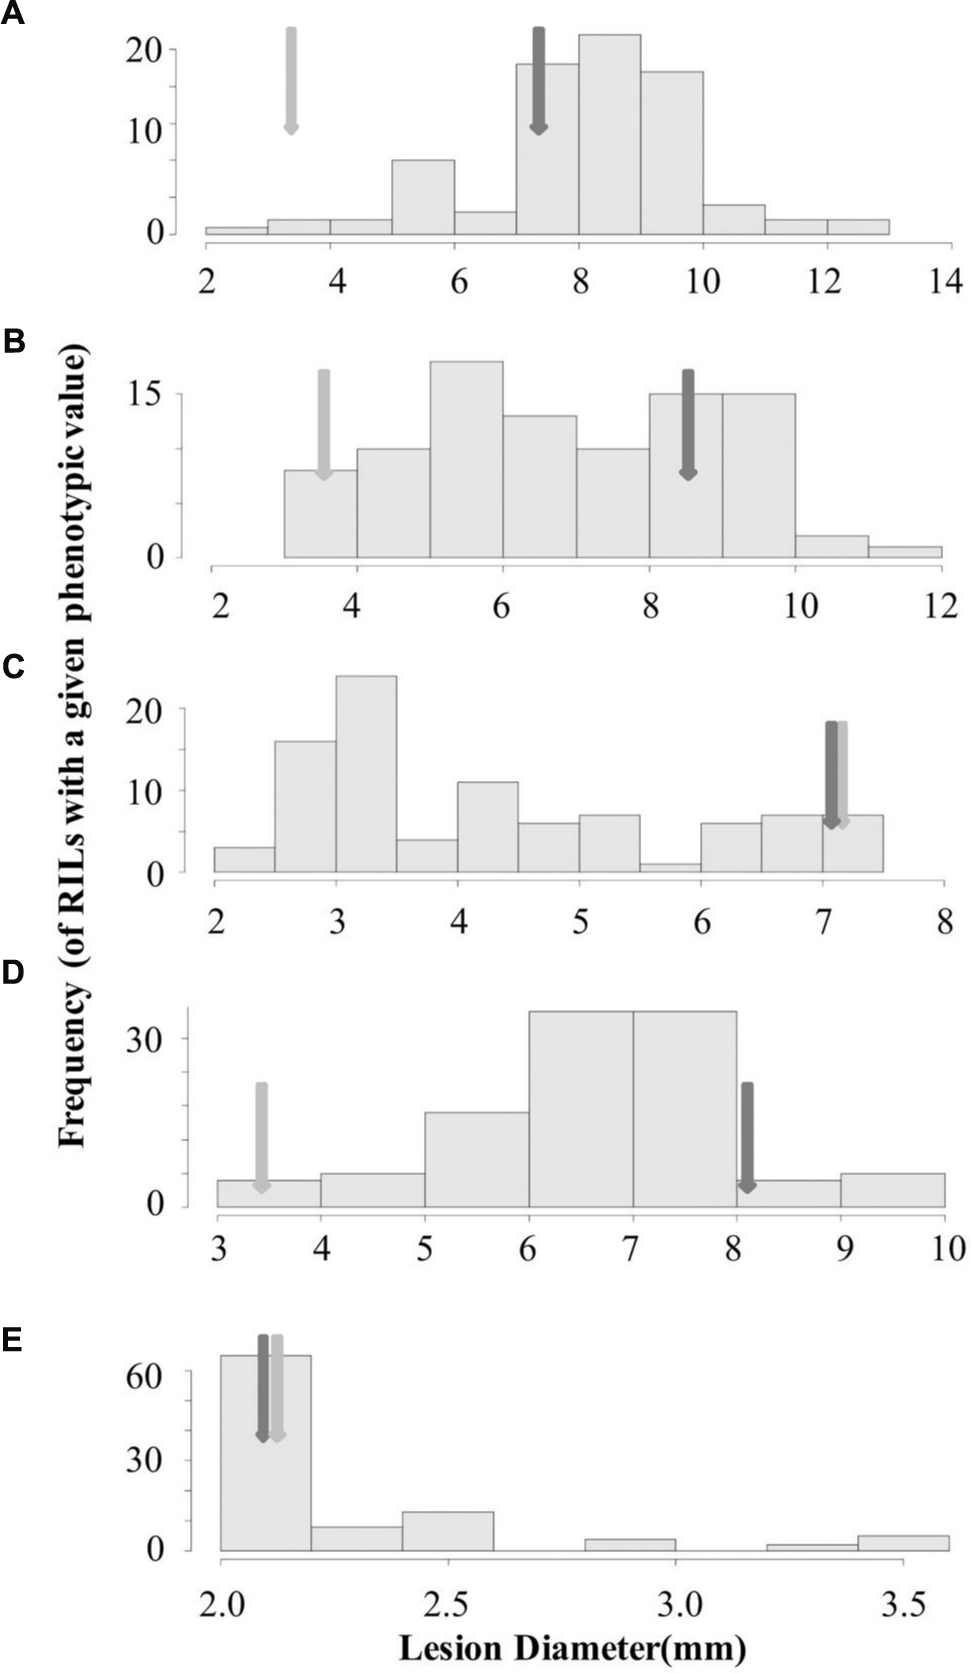
FIGURE 3. Distribution of lesion size for five B. cinerea isolates on the B. rapa IMB211 × R500 RILs. Distribution of mean lesion sizes (mm) on the leaves of the B. rapa IMB211 × R500 RILs measured at 72 h after inoculation with five Botrytis isolates: (A) Ausubel, (B) Davis navel, (C) Katie tomato, (D) Pepper, and (E) UK Razz. The dark arrow indicates the mean lesion size on IMB211 and the light arrow indicates the mean lesion size on R500.
Using the lesion measurements, we mapped QTL controlling phenotypic variation in lesion size within the RILs populations derived from R500 × IMB211. This identified five QTL governing lesion size induced by B. cinerea isolates (Table 3 and Figure 4). Two of these QTL, L7.26.6 and L9.0.1, were detected using B. cinerea isolate Ausubel (Table 3 and Figure 4). The QTL L1.51.7 detected by B. cinerea isolate Katie tomato was located on chromosome I. The L3.2.5 and L9.72.3 QTL on chromosomes III and IX were detected with the B. cinerea isolate UK Razz isolate. Surprisingly, no QTL were detected using the B. cinerea isolates Davis navel and Pepper and no QTL were found consistently for all isolates. This is in contrast to the effect size plots that are similar for most isolates. This is probably due to the limited number of RILs available for this population that may generate a potentially elevated false negative rate with QTL mapping (Joseph et al., 2013, 2014). Thus, we proceeded to use a linear modeling approach to directly test if the detected QTLs were actually isolate specific. This analysis showed the QTLs were all isolate specific (Figure 5 and Supplementary Table 1). Interestingly, The QTL L1.51.7 found only for the Katie Tomato isolate also significantly altered resistance to Davis Navel. Thus, we were able to identify QTL that appear to control isolate specific aspects of quantitative resistance in the interaction of B. rapa with B. cinerea.
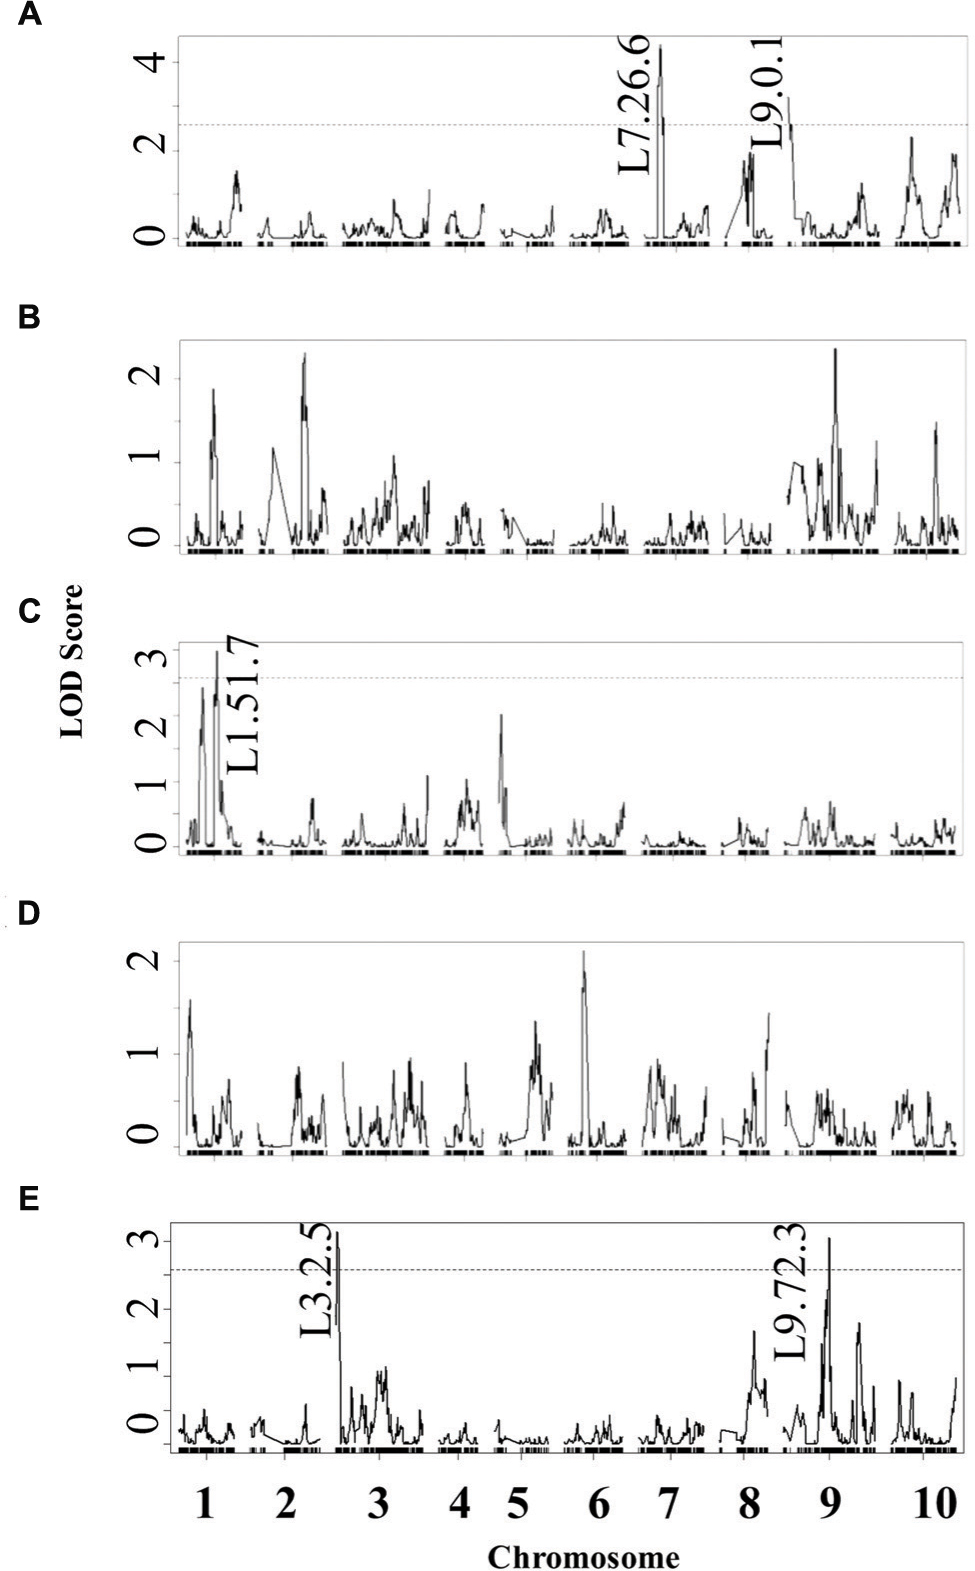
FIGURE 4. Quantitative trait loci mapping of resistance to B. cinerea in B. rapa. Shown are results from composite interval mapping (CIM) of the mean lesion development for all five isolates across the 115 IMB211 × R500 RILs. The QTL are labeled with their chromosome number and approximate LOD peak in cM. The LOD score is shown with the horizontal line representing the permutation obtained significance threshold. The isolates are as follows: (A) Ausubel, (B) Davis navel, (C) Katie tomato, (D) Pepper, (E) UK Razz.
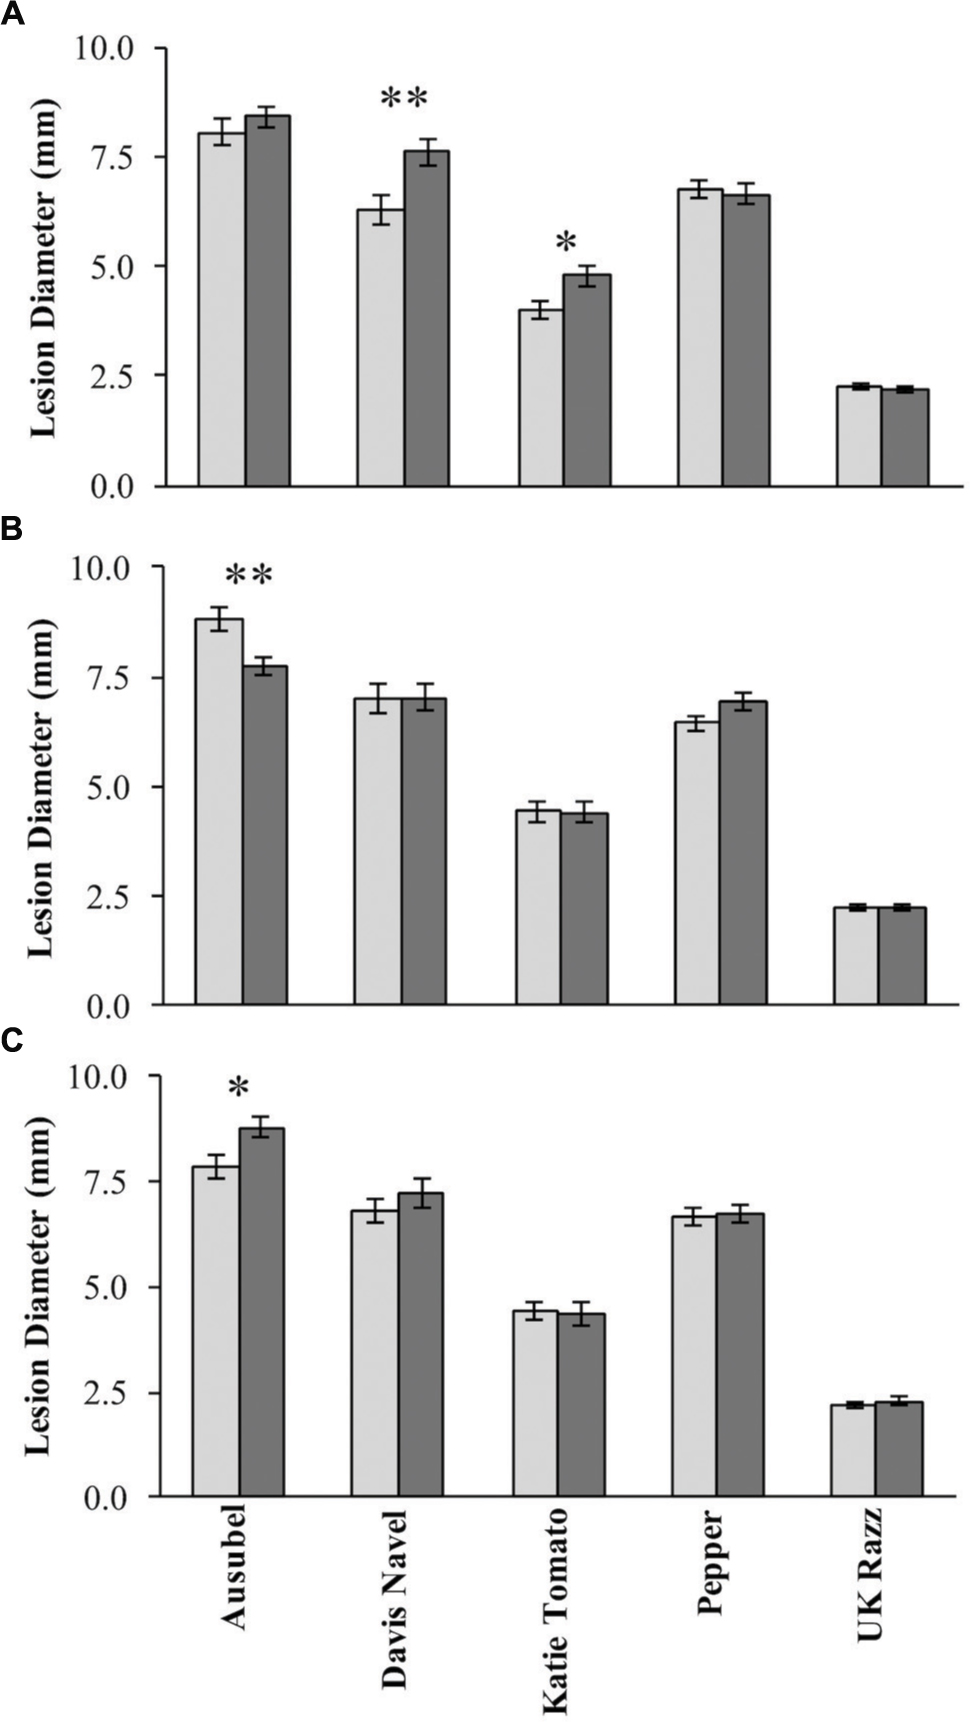
FIGURE 5. Botrytis cinerea isolate dependent effects of resistance QTLs. The estimated phenotypic effect of the alleles from R500 and IMB211 at markers associated with isolate dependent QTL are shown. Error bars indicate standard error. Isolates that were significant affected by the QTL were tested by ANOVA with post hoc Tukey’s HSD and is indicated by asterisks above bars:∗P < 0.05, ∗∗P < 0.01. Light shows the value for the R500 allele and dark shows the value for the IMB211 allele at the given QTL. QTLs are as labeled in Figure 4: (A) QTL L1.51.7, (B) QTL L7.26.6, (C) QTL L9.0.1.
Identification of QTL Controlling Defense Responses
Previous work has linked genetic variation in defense compounds to variation in biotic interactions including for B. cinerea (Denby et al., 2004; Rowe and Kliebenstein, 2008). Thus, we measured GSL content in all of the RILs in both control leaves and B. cinerea isolate Pepper infected leaves. This showed that all detected GSLs had genetic variation and were affected by the infection with the B. cinerea Pepper isolate (Table 2). There were no presence or absence polymorphisms affecting GSL abundance in this population allowing us to focus on quantitative variation controlling their relative abundance (Table 2; Kliebenstein et al., 2001b; Wentzell et al., 2007; Chan et al., 2010). All five GSLs identified significant QTLs with the majority of them appearing to be dependent on the presence or absence of B. cinerea (Figure 6 and Table 3). The aliphatic and benzylic GSLs identified more QTLs under the control treatment whereas the indolic GSLs identified more QTLs under the B. cinerea infected tissue. This agreed with the observation that the treatments in general lead to higher indolic GSLs and lower 4MSB and Benzylic GSLs. This allowed QTL effects to be seen for indolic GSL following treatment and Benzylic and 4MSB prior to treatment (Figure 7). Most of the indolic QTLs were such that the IMB211 allele leads to lower pathogen induced indolic GSLs in contrast to the R500 allele (Figure 7). One QTL, G9.5.0, on chromosome IX shared by both aliphatic and benzylic GSLs, was also detected as affecting lesion development when the RILs were infected with the B. cinerea isolate Ausubel isolate. This suggested that there might be a link between these GSL and resistance to at least this B. cinerea isolate (Figures 4 and 6).
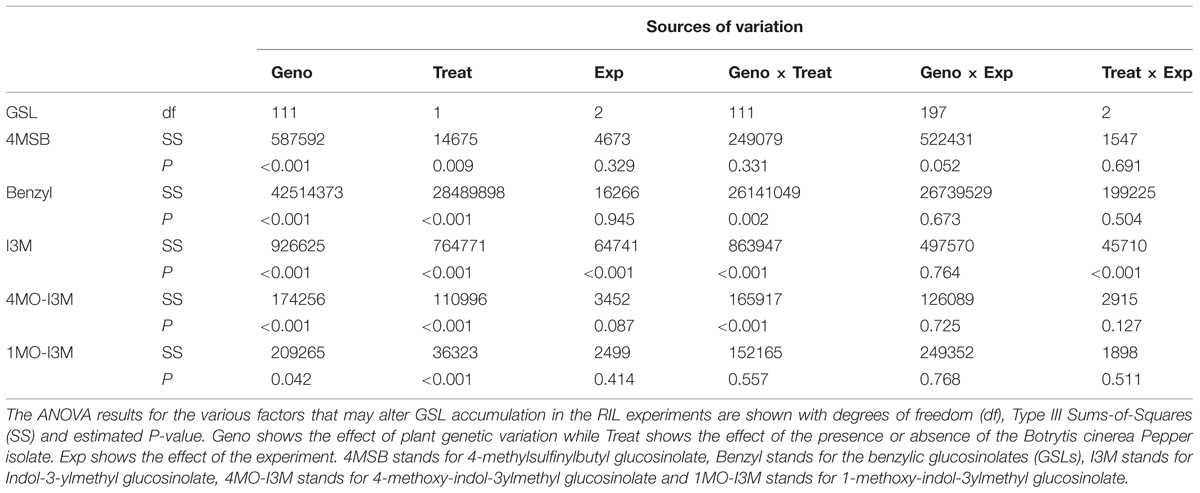
TABLE 2. ANOVAs for the accumulation of the GSLs in the B. rapa RILs.
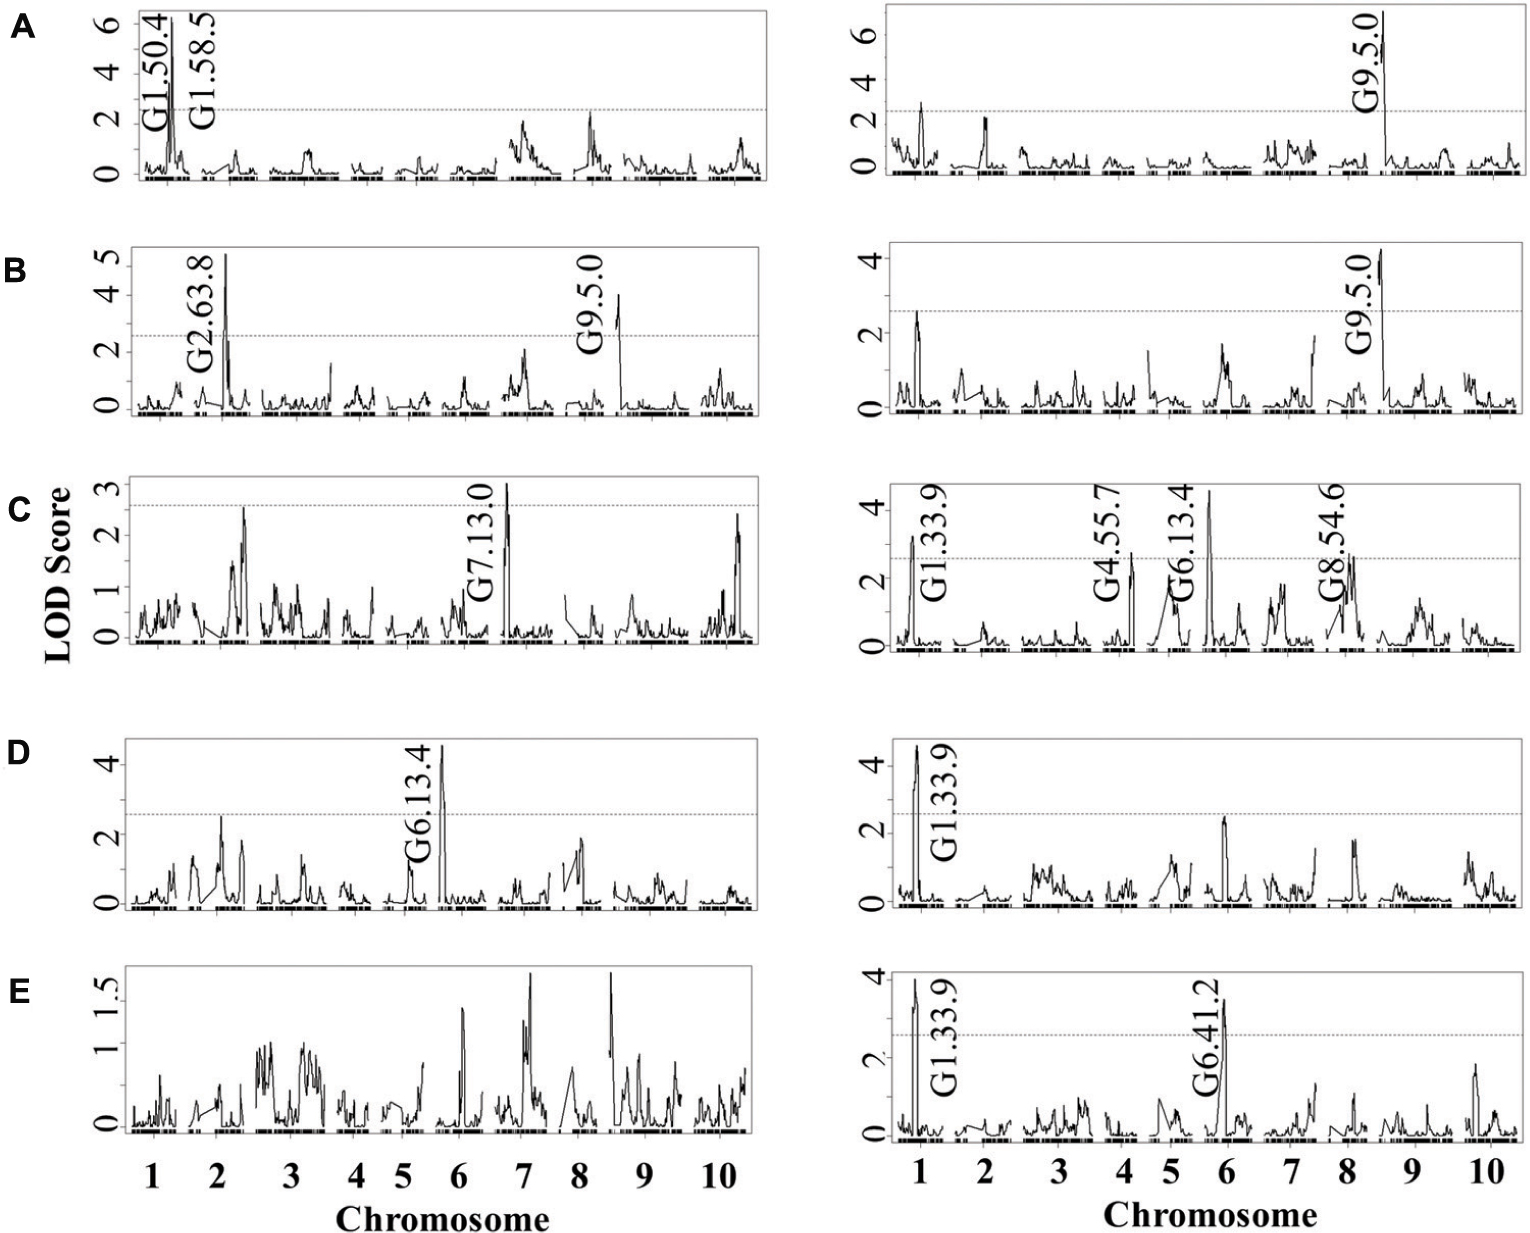
FIGURE 6. QTL mapping of glucosinolates accumulation in B. rapa RILs in response to B. cinerea. Shown are results from CIM of the mean glucosinolate accumulation in leaves of B. rapa with the absence (control, left) or presence (infection, right) of B. cinerea isolate Pepper across the 112 IMB211 × R500 RILs. The LOD score is shown with the horizontal line representing the permutation obtained significance threshold. Each QTL is labeled with the trait and chromosome position showing the maximum LOD score. The QTL plots for the different glucosinolates are as follows with abbreviations as given in Table 2: (A) 4MSB, (B) benzyl glucosinolates, (C) I3M, (D) 4MO-I3M, and (E) 1MO-I3M.
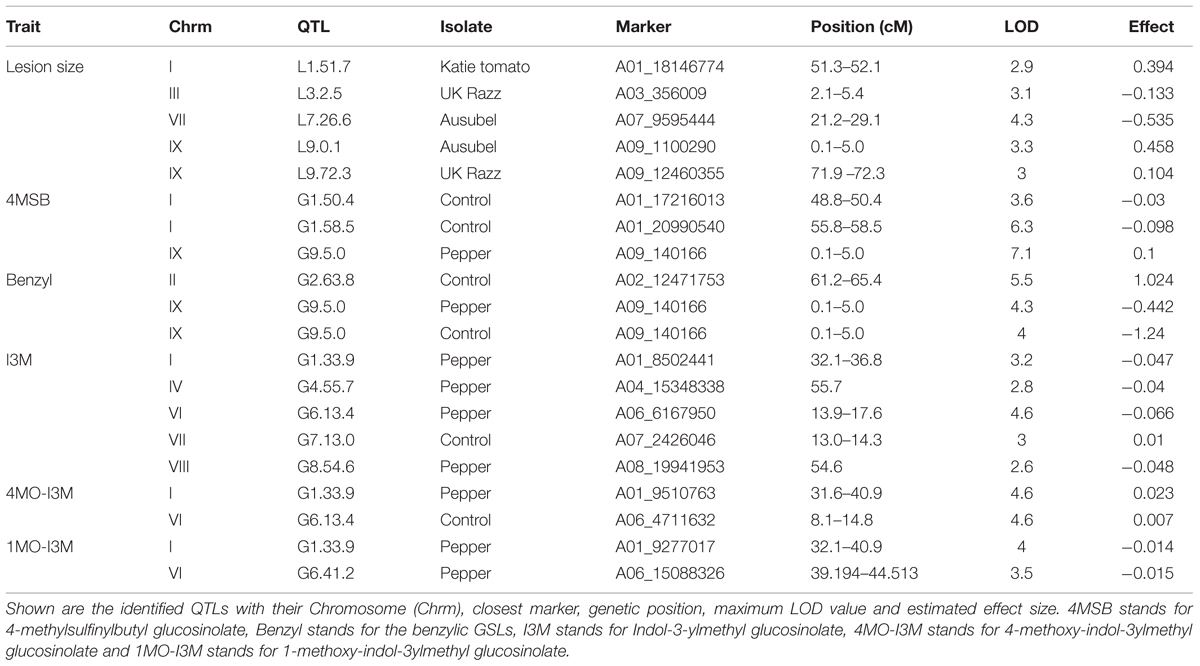
TABLE 3. Brassica rapa QTL governing lesion size traits and GSLs to B. cinerea isolates.
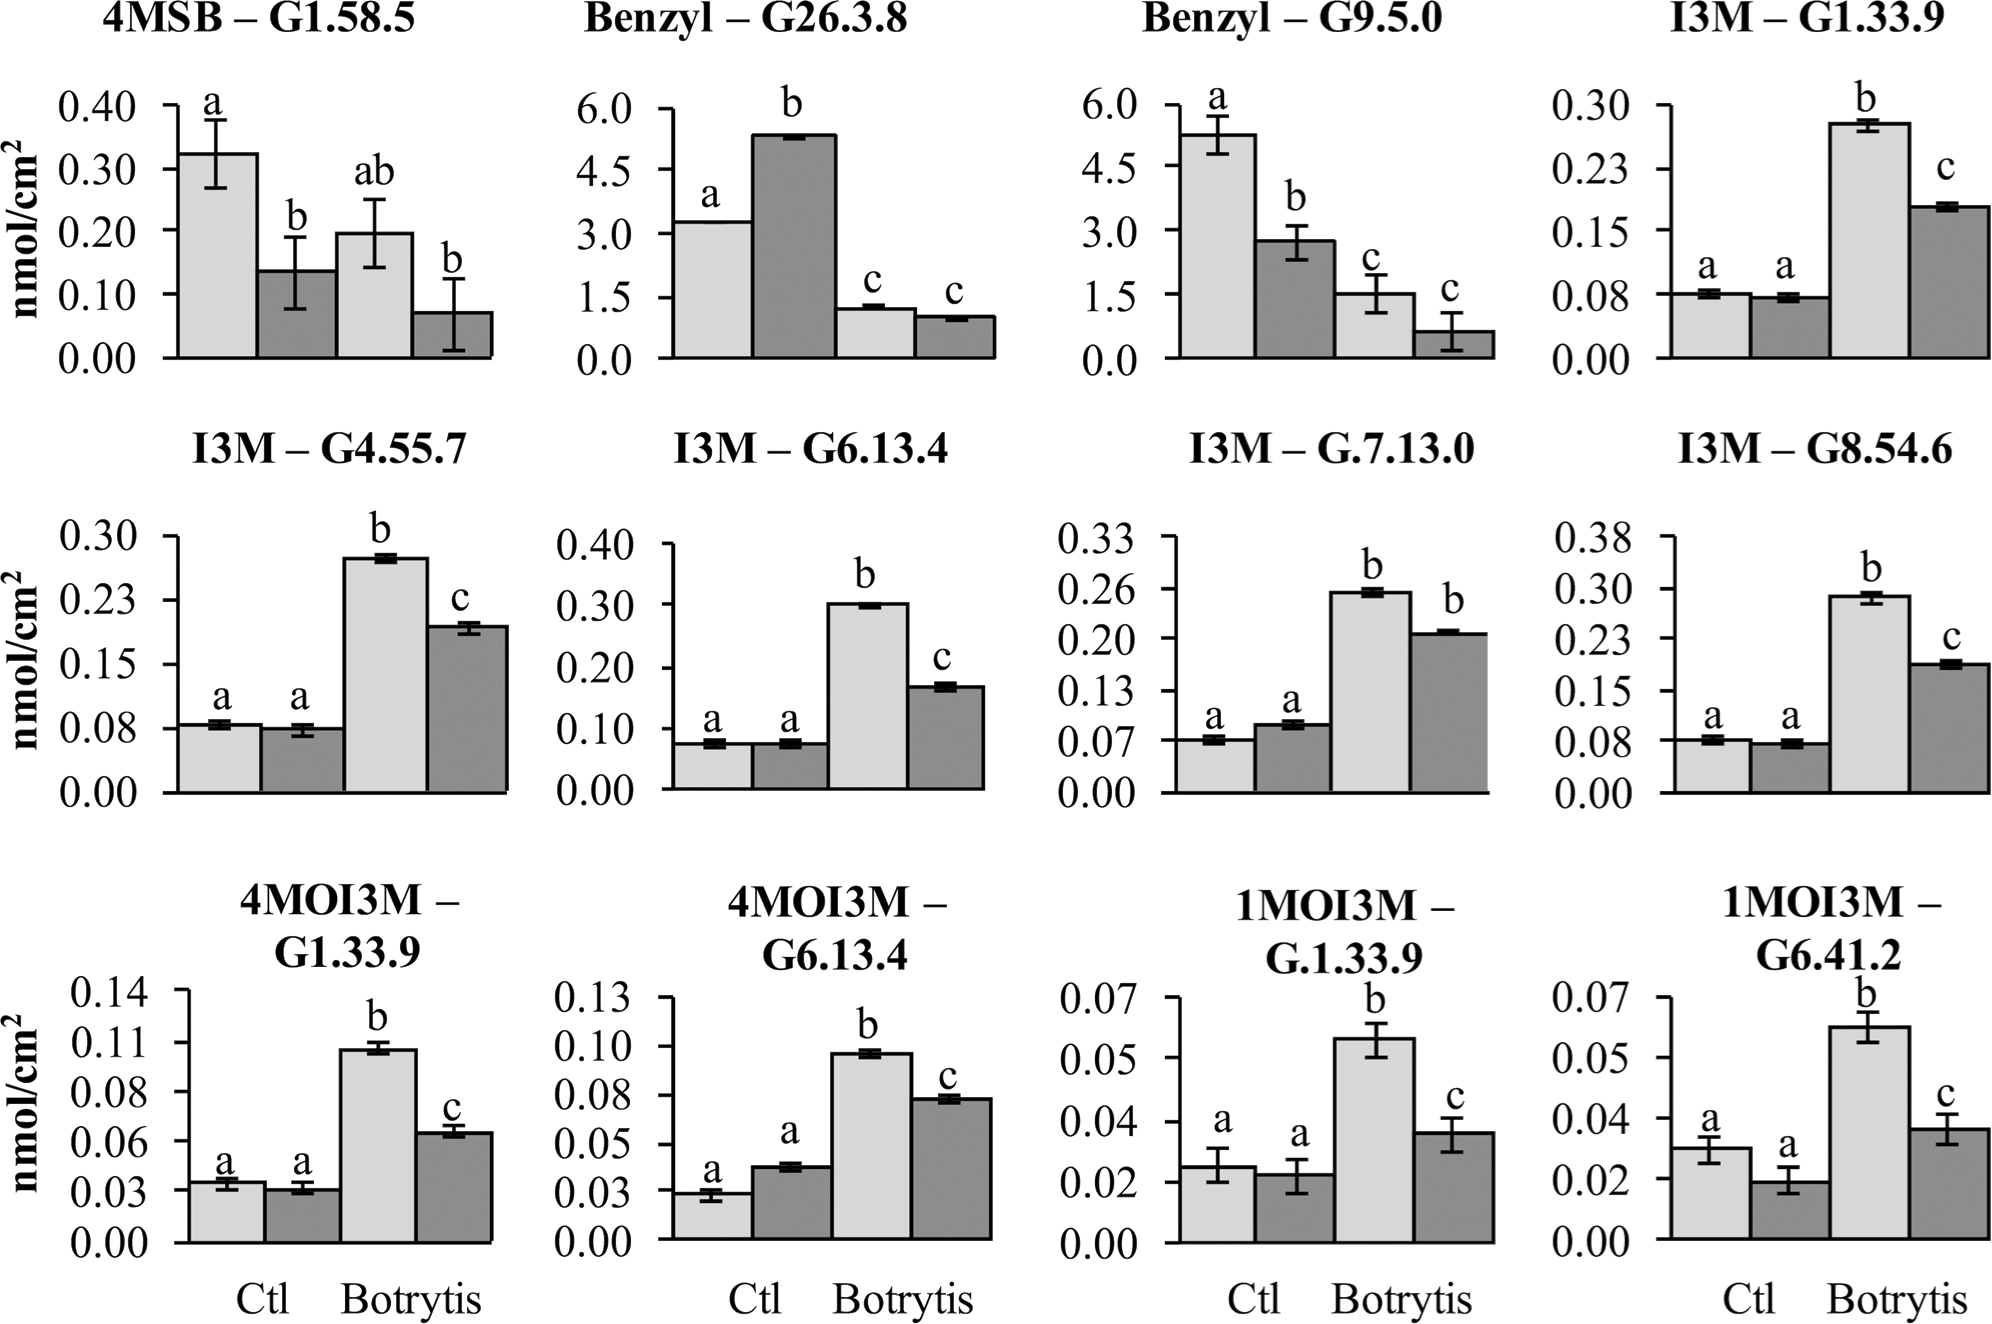
FIGURE 7. Glucosinolates QTL that are show pathogen responsiveness. Shown is the estimated phenotypic effect of the alleles from R500 and IMB211 at GSL accumulation QTL that are treatment dependent. Error bars indicate standard error. Significance differences between the treatment × genotype groupings were determined by ANOVA with a post hoc Tukey’s HSD test and are indicated with different letters. The top of each graph indicates the GSL and QTL being shown with abbreviations as listed in Table 2. Light shows the accumulation for RILs with the R500 allele and dark shows the value for the IMB211 allele at the given QTL.
Epistasis Analysis
Previous work on quantitative resistance to B. cinerea has shown that the identified QTLs are typically epistatic to each other (Finkers et al., 2007a,b, 2008; Rowe and Kliebenstein, 2008). To investigate the epistatic architecture underlying isolate-specific resistance to B. cinerea and chemical defense within the R500 × IMB211 population, we conducted ANOVA models for QTL controlling lesion development and individual GSL using the genetic markers closest to the QTL peak as terms in the linear model. In contrast to previous studies, we only found a single epistatic interaction with any evidence of significance in altering Botrytis resistance. This interaction was between the L3.2.5 and L9.72.3 QTLs that were unique to the UK Razz isolate (Figure 8). In comparison to B. cinerea resistance, more epistatic interactions were detected for GSL accumulation, one for the accumulation of aliphatic GSLs and three for the accumulation of the I3M GSL (Figure 8, Supplementary Tables 2–6). Interestingly, all of the epistatic interactions between GSL loci were also found to interact with the presence or absence of the pathogen suggesting that they may be linked to the regulation of the defense compounds.
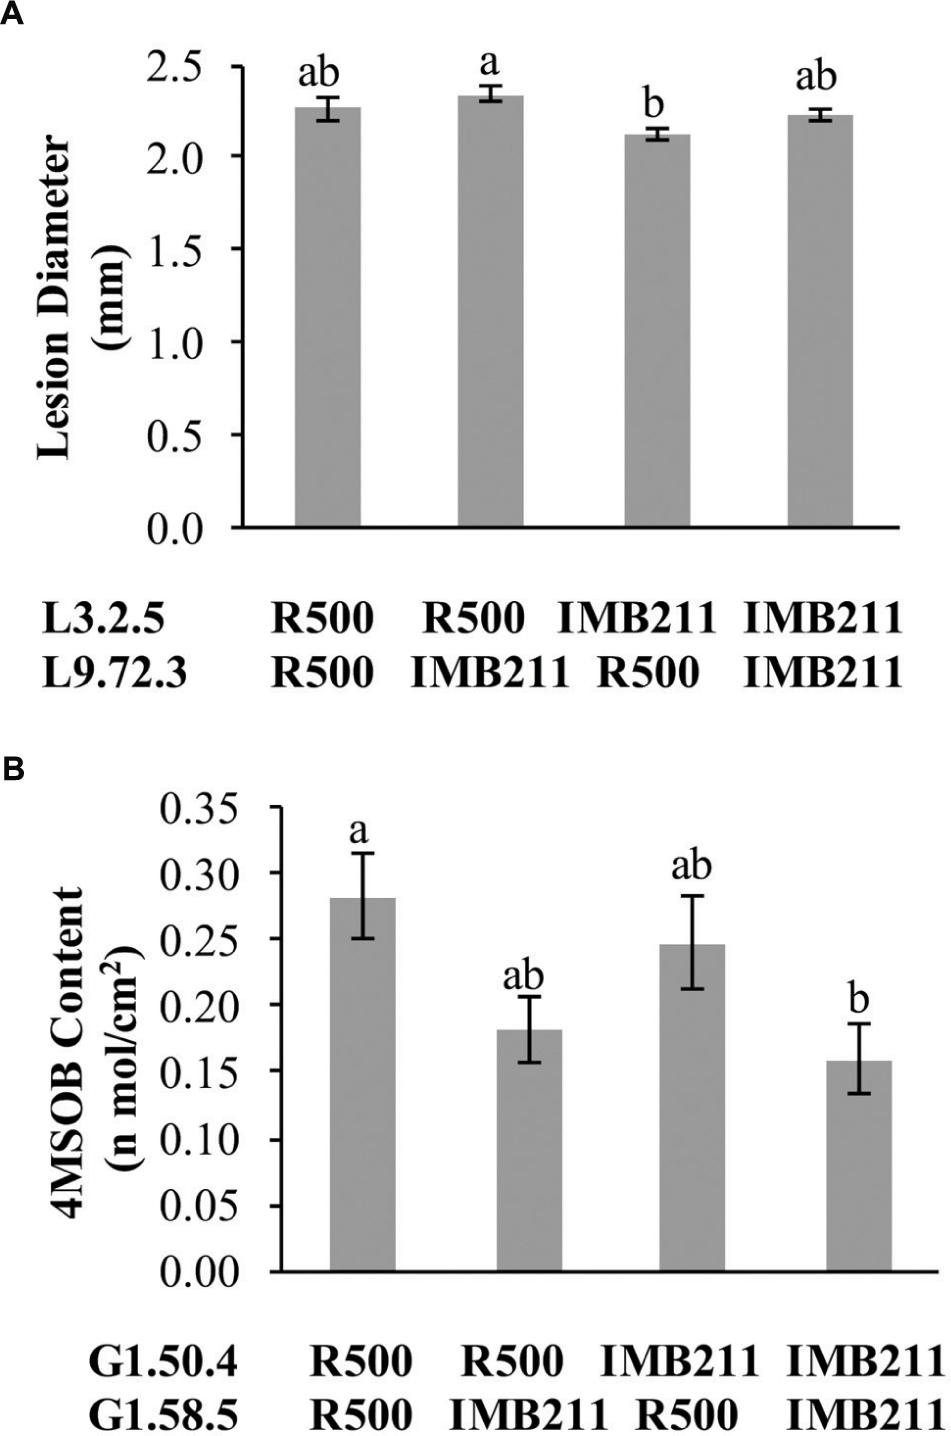
FIGURE 8. Epistatic interactions. The estimated phenotypic effect for loci showing epistatic interactions governing lesion size and GSL accumulation are shown. Letters in each individual graph indicate significantly different genotypes as determined by ANOVA and post hoc Tukey’s HSD. The x axis shows the allelic status of the two QTL listed to the left. (A) Epistatic interaction of L3.2.5 × L9.72.3 on resistance to B. cinerea isolate UK Razz. (B) Epistatic interaction of G1.50.4 × G1.58.5 on 4MSB accumulation.
Discussion
Using 14 diverse B. cinerea isolates to measure quantitative resistance in two B. rapa lines that are the parent of a common RIL population showed that the two parents differed in their resistance to some but not all of the isolates (Figure 1). Further QTL mapping with a subset of these isolates showed that the genetic basis of this is likely polygenic with transgressive segregation showing that both parents can contribute resistance alleles. This was even the case when both B. rapa parents had identical resistance to an isolate (Figures 3 and 4). These loci need to be assessed in whole plant assays under field growth conditions to assess their agronomic utility. This quantitative, isolate specific and transgressive basis of quantitative resistance to B. cinerea is similar to what has been seen in A. thaliana (Denby et al., 2004; Rowe and Kliebenstein, 2008). This suggests that directly searching for QTL that provide broad spectrum resistance to B. cinerea within Brassica’s may not be the best approach to identifying successful avenues to achieve this goal. An alternative approach to utilizing these genetic loci may be to stack isolate specific loci with overlapping specificity to create a quilt of loci that can provide a protective blanket against an array of diverse isolates.
We were also able to identify QTLs that control the accumulation of the defensive glucosinolate metabolites in response to infection (Figure 6). The lower number of overlapped QTLs between GSLs and resistance may be due to the significant level of false negative error even in a large size of RIL population during QTL mapping (Chan et al., 2011; Joseph et al., 2013). While a few of these QTLs overlapped with one B. cinerea resistance QTL, GLS have frequently been linked to altered biotic interactions within the Brassica’s (Mithen et al., 1986, 1987; Mithen, 1992; Mithen and Magrath, 1992; Kroymann and Mitchell-Olds, 2005; Pfalz et al., 2007, 2009; Fan et al., 2011; Stotz et al., 2011; Buxdorf et al., 2013; Cargnel et al., 2014; Weis et al., 2014; Calmes et al., 2015; Kerwin et al., 2015). However, the specific mechanism by which the GSL can alter biotic interactions is not yet well understood. Some studies have provided evidence of direct toxicity to the biotic attacker that can be compensated by resistance mechanisms in the pathogen (Bednarek et al., 2009; Fan et al., 2011; Stotz et al., 2011). In contrast other studies have begun to illuminate a different possibility, specifically that the GLS alter the defense signaling pathways by which the plant responds to pathogens or jasmonic acid (Clay et al., 2009; Kerwin et al., 2011; Burow et al., 2015). Using the QTL results, it is not possible to discriminate between these two possibilities and further work will be required to test if the link between GSL accumulation and B. cinerea resistance in B. rapa is due to direct toxicity, altered defense responses or a blend of both. Partitioning between these two possibilities will be key to develop a maximally efficient effort at improving resistance to a broad array of B. cinerea isolates in B. rapa.
Conclusion
This work begins to highlight the underlying genetic complexity of breeding for improved resistance to B. cinerea within B. rapa. The directly identified resistance loci are highly isolate specific but it may be possible to improve the breeding efficiency by breeding for an optimal defense compound blend. This, however, needs to be balanced by the fact that these same defense compounds also influence the flavor and nutritive value of the resulting Brassica crop. As such any effort at resistance breeding will by fact of this link also alter the quality of the resulting crop. By combining quantitative resistance loci that target overlapping ranges of Botrytis isolates together may be a more feasible breeding strategy to confer a broad-spectrum and durable resistance to crops against this pathogen. It is also important to note that this level of isolate specific resistance loci has significant impact on the mechanistic analysis of quantitative resistance (Broekgaarden et al., 2015). This indicates that the use of individual isolates will only provide mechanistic insight into how that individual isolate is resisted and that a broad range of pathogen genetics needs to be incorporated to assess the broader mechanistic influences on quantitative resistance. The low number of identified QTLs given the high heritability of the resistance trait suggests that there is a need to increase the available RIL population sizes to decrease the false negative error rate and to obtain a more precise picture of the genetic architecture underlying the resistance to B. cinerea in B. rapa.
Author Contributions
S-TK, DK conceived and designed the experiments. WZ, S-TK performed the experiments. WZ, S-TK, DK analysis the data. WZ, DK wrote the paper.
Funding
Funding for this work was provided by the China Scholarship Council grant 20130624 to WZ, the NSF award IOS 1339125 to DK, the USDA National Institute of Food and Agriculture, Hatch project number CA-D-PLS-7033-H to DK and by the Danish National Research Foundation (DNRF99) grant to DK.
Conflict of Interest Statement
The authors declare that the research was conducted in the absence of any commercial or financial relationships that could be construed as a potential conflict of interest.
Supplementary Material
The Supplementary Material for this article can be found online at: http://journal.frontiersin.org/article/10.3389/fpls.2016.00161
References
Amselem, J., Cuomo, C. A., Van Kan, J. A. L., Viaud, M., Benito, E. P., Couloux, A., et al. (2011). Genomic analysis of the necrotrophic fungal pathogens Sclerotinia sclerotiorum and Botrytis cinerea. PLoS Genet. 7:e1002230. doi: 10.1371/journal.pgen.1002230
Anuradha, C., Gaur, P. M., Pande, S., Gali, K. K., Ganesh, M., Kumar, J., et al. (2011). Mapping QTL for resistance to botrytis grey mould in chickpea. Euphytica 182, 1–9. doi: 10.1007/s10681-011-0394-1
Atwell, S., Corwin, J. A., Soltis, N. E., Subedy, A., Denby, K. J., and Kliebenstein, D. J. (2015). Whole genome resequencing of Botrytis cinerea isolates identifies high levels of standing diversity. Front. Microbiol. 6:996. doi: 10.3389/fmicb.2015.00996
Bednarek, P., Pislewska-Bednarek, M., Svatos, A., Schneider, B., Doubsky, J., Mansurova, M., et al. (2009). A glucosinolate metabolism pathway in living plant cells mediates broad-spectrum antifungal defense. Science 323, 101–106. doi: 10.1126/science.1163732
Bolton, M. D., Thomma, B. P., and Nelson, B. D. (2006). Sclerotinia sclerotiorum (Lib.) de bary: biology and molecular traits of a cosmopolitan pathogen. Mol. Plant Pathol. 7, 1–16. doi: 10.1111/j.1364-3703.2005.00316.x
Boydom, A. (2015). Evaluation of detached leaf assay for assessing leaf rust (Puccinia triticina Eriks.) resistance in wheat. J. Plant Pathol. Microbiol. 4:176. doi: 10.4172/2157-7471.1000176
Broekgaarden, C., Bucher, J., Bac-Molenaar, J., Keurentjes, J. J., Kruijer, W., Voorrips, R. E., et al. (2015). Novel genes affecting the interaction between the cabbage whitefly and Arabidopsis uncovered by genome-wide association mapping. PLoS ONE 10:e0145124. doi: 10.1371/journal.pone.0145124
Broman, K. W., Wu, H., Sen,Ś., and Churchill, G. A. (2003). R/qtl: QTL mapping in experimental crosses. Bioinformatics 19, 889–890. doi: 10.1093/bioinformatics/btg112
Brown, A. F., Yousef, G. G., Reid, R. W., Chebrolu, K. K., Thomas, A., Krueger, C., et al. (2015). Genetic analysis of glucosinolate variability in broccoli florets using genome-anchored single nucleotide polymorphisms. Theor. Appl. Genet. 128, 1431–1447. doi: 10.1007/s00122-015-2517-x
Burow, M., Atwell, S., Fancisco-Candeiro, M., Kerwin, R. E., Halkier, B. A., and Kliebenstein, D. J. (2015). The glucosinolate biosynthetic gene AOP2 mediates feedback regulation of jasmonic acid signaling independent of its known enzymatic function. Mol. Plant 8, 1201–1212. doi: 10.1016/j.molp.2015.03.001
Buxdorf, K., Yaffe, H., Barda, O., and Levy, M. (2013). The effects of glucosinolates and their breakdown products on necrotrophic fungi. PLoS ONE 8:e70771. doi: 10.1371/journal.pone.0070771
Calmes, B., N’guyen, G., Dumur, J., Brisach, C. A., Campion, C., Iacomi, B., et al. (2015). Glucosinolate-derived isothiocyanates impact mitochondrial function in fungal cells and elicit an oxidative stress response necessary for growth recovery. Front. Plant Sci. 6:414. doi: 10.3389/fpls.2015.00414
Cargnel, M. D., Demkura, P. V., and Ballare, C. L. (2014). Linking phytochrome to plant immunity: low red : far-red ratios increase Arabidopsis susceptibility to Botrytis cinerea by reducing the biosynthesis of indolic glucosinolates and camalexin. New Phytol. 204, 342–354. doi: 10.1111/nph.13032
Chan, E. K., Rowe, H. C., Corwin, J. A., Joseph, B., and Kliebenstein, D. J. (2011). Combining genome-wide association mapping and transcriptional networks to identify novel genes controlling glucosinolates in Arabidopsis thaliana. PLoS Biol. 9:e1001125. doi: 10.1371/journal.pbio.1001125
Chan, E. K. F., Rowe, H. C., and Kliebenstein, D. J. (2010). Understanding the evolution of defense metabolites in Arabidopsis thaliana using genome-wide association mapping. Genetics 185, 991–1007. doi: 10.1534/genetics.109.108522
Churchill, G. A., and Doerge, R. W. (1994). Empirical threshold values for quantitative trait mapping. Genetics 138, 963–971.
Clay, N. K., Adio, A. M., Denoux, C., Jander, G., and Ausubel, F. M. (2009). Glucosinolate metabolites required for an Arabidopsis innate immune response. Science 323, 95–101. doi: 10.1126/science.1164627
Cowley, R., Luckett, D. J., Ash, G. J., Harper, J. D., Vipin, C. A., Raman, H., et al. (2014). Identification of QTLs associated with resistance to Phomopsis pod blight (Diaporthe toxica) in Lupinus albus. Breed. Sci. 64, 83–89. doi: 10.1270/jsbbs.64.83
Davis, J., Yu, D. Z., Evans, W., Gokirmak, T., Chetelat, R. T., and Stotz, H. U. (2009). Mapping of loci from Solanum lycopersicoides conferring resistance or susceptibility to Botrytis cinerea in tomato. Theor. Appl. Genet. 119, 305–314. doi: 10.1007/s00122-009-1039-9
Denby, K. J., Kumar, P., and Kliebenstein, D. J. (2004). Identification of Botrytis cinerea susceptibility loci in Arabidopsis thaliana. Plant J. 38, 473–486. doi: 10.1111/j.0960-7412.2004.02059.x
Devisetty, U. K., Covington, M. F., Tat, A. V., Lekkala, S., and Maloof, J. N. (2014). Polymorphism identification and improved genome annotation of Brassica rapa through deep RNA Sequencing. G3 (Bethesda) 4, 2065–2078. doi: 10.1534/g3.114.012526
Doerge, R. W., and Churchill, G. A. (1996). Permutation tests for multiple loci affecting a quantitative character. Genetics 142, 285–294.
Fan, J., Crooks, C., Creissen, G., Hill, L., Fairhurst, S., Doerner, P., et al. (2011). Pseudomonas sax genes overcome aliphatic isothiocyanate–mediated non-host resistance in Arabidopsis. Science 331, 1185–1188. doi: 10.1126/science.1199707
Feng, J., Long, Y., Shi, L., Shi, J. Q., Barker, G., and Meng, J. L. (2012). Characterization of metabolite quantitative trait loci and metabolic networks that control glucosinolate concentration in the seeds and leaves of Brassica napus. New Phytol. 193, 96–108. doi: 10.1111/j.1469-8137.2011.03890.x
Finkers, R., Bai, Y. L., Van Den Berg, P., Van Berloo, R., Meijer-Dekens, F., Ten Have, A., et al. (2008). Quantitative resistance to Botrytis cinerea from Solanum neorickii. Euphytica 159, 83–92. doi: 10.1007/s10681-007-9460-0
Finkers, R., Finkers, R., Van Heusden, A. W., Meijer-Dekens, F., Van Kan, J. A. L., Maris, P., et al. (2007a). The construction of a Solanum habrochaites LYC4 introgression line population and the identification of QTLs for resistance to Botrytis cinerea. Theor. Appl. Genet. 114, 1071–1080. doi: 10.1007/s00122-006-0500-2
Finkers, R., Van Den Berg, P., Van Berloo, R., Ten Have, A., Van Heusden, A. W., Van Kan, J. A. L., et al. (2007b). Three QTLs for Botrytis cinerea resistance in tomato. Theor. Appl. Genet. 114, 585–593. doi: 10.1007/s00122-006-0458-0
Gupta, S., Sangha, M. K., Kaur, G., Banga, S., Gupta, M., Kumar, H., et al. (2015). QTL analysis for phytonutrient compounds and the antioxidant molecule in mustard (Brassica juncea L.). Euphytica 201, 345–356. doi: 10.1007/s10681-014-1204-3
Iniguez-Luy, F. L., Lukens, L., Farnham, M. W., Amasino, R. M., and Osborn, T. C. (2009). Development of public immortal mapping populations, molecular markers and linkage maps for rapid cycling Brassica rapa and B. oleracea. Theor. Appl. Genet. 120, 31–43. doi: 10.1007/s00122-009-1157-4
Joseph, B., Atwell, S., Corwin, J. A., Li, B. H., and Kliebenstein, D. J. (2014). Meta-analysis of metabolome QTLs in Arabidopsis: trying to estimate the network size controlling genetic variation of the metabolome. Front. Plant Sci. 5:461. doi: 10.3389/fpls.2014.00461
Joseph, B., Corwin, J. A., Zuest, T., Li, B., Iravani, M., Schaepman-Strub, G., et al. (2013). Hierarchical nuclear and cytoplasmic genetic architectures for plant growth and defense within Arabidopsis. Plant Cell 25, 1929–1945. doi: 10.1105/tpc.113.112615
Kerwin, R., Feusier, J., Corwin, J., Rubin, M., Lin, C., Muok, A., et al. (2015). Natural genetic variation in Arabidopsis thaliana defense metabolism genes modulates field fitness. eLife 4:e05604.
Kerwin, R. E., Jiménez-Gómez, J. M., Fulop, D., Harmer, S. L., Maloof, J. N., and Kliebenstein, D. J. (2011). Network quantitative trait loci mapping of circadian clock outputs identifies metabolic pathway-to-clock linkages in Arabidopsis. Plant Cell 23, 471–485. doi: 10.1105/tpc.110.082065
Kliebenstein, D., Lambrix, V., Reichelt, M., Gershenzon, J., and Mitchell-Olds, T. (2001a). Gene duplication and the diversification of secondary metabolism: side chain modification of glucosinolates in Arabidopsis thaliana. Plant Cell 13, 681–693. doi: 10.1105/tpc.13.3.681
Kliebenstein, D. J., Gershenzon, J., and Mitchell-Olds, T. (2001b). Comparative quantitative trait loci mapping of aliphatic, indolic and benzylic glucosinolate production in Arabidopsis thaliana leaves and seeds. Genetics 159, 359–370.
Kliebenstein, D. J., Kroymann, J., Brown, P., Figuth, A., Pedersen, D., Gershenzon, J., et al. (2001c). Genetic control of natural variation in Arabidopsis thaliana glucosinolate accumulation. Plant Physiol. 126, 811–825. doi: 10.1104/pp.126.2.811
Kliebenstein, D., Pedersen, D., Barker, B., and Mitchell-Olds, T. (2002a). Comparative analysis of quantitative trait loci controlling glucosinolates, myrosinase and insect resistance in Arabidopsis thaliana. Genetics 161, 325–332.
Kliebenstein, D. J., Figuth, A., and Mitchell-Olds, T. (2002b). Genetic architecture of plastic methyl jasmonate responses in Arabidopsis thaliana. Genetics 161, 1685–1696.
Kliebenstein, D. J. (2014). Synthetic biology of metabolism: using natural variation to reverse engineer systems. Curr. Opin. Plant Biol. 19, 20–26. doi: 10.1016/j.pbi.2014.03.008
Kliebenstein, D. J., Rowe, H. C., and Denby, K. J. (2005). Secondary metabolites influence Arabidopsis/Botrytis interactions: variation in host production and pathogen sensitivity. Plant J. 44, 25–36. doi: 10.1111/j.1365-313X.2005.02508.x
Kroymann, J., and Mitchell-Olds, T. (2005). Epistasis and balanced polymorphism influencing complex trait variation. Nature 435, 95–98. doi: 10.1038/nature03480
Mithen, R. (1992). Leaf glucosinolate profiles and their relationships to pest and disease resistance in oilseed rape. Euphytica 63, 71–83. doi: 10.1007/BF00023913
Mithen, R. F., Lewis, B. G., and Fenwick, G. R. (1986). In vitro activity of glucosinolates and their products against Leptosphaeria maculans. Trans. Br. Mycol. Soc. 87, 433–440. doi: 10.1016/S0007-1536(86)80219-4
Mithen, R. F., Lewis, B. G., Heaney, R. K., and Fenwick, G. R. (1987). Resistance of leaves of Brassica species to Leptosphaeria maculans. Trans. Br. Mycol. Soc. 88, 525–531. doi: 10.1007/s13353-014-0235-8
Mithen, R. F., and Magrath, R. (1992). Glucosinolates and resistance to Leptosphaeria maculans in wild and cultivated Brassica species. Plant Breed. 108, 60–68. doi: 10.1111/j.1439-0523.1992.tb00100.x
Mulema, J. M., and Denby, K. J. (2012). Spatial and temporal transcriptomic analysis of the Arabidopsis thaliana-Botrytis cinerea interaction. Mol. Biol. Rep. 39, 4039–4049. doi: 10.1007/s11033-011-1185-4
Pfalz, M., Vogel, H., and Kroymann, J. (2009). The gene controlling the Indole Glucosinolate Modifier1 quantitative trait locus alters indole glucosinolate structures and aphid resistance in Arabidopsis. Plant Cell 21, 985–999. doi: 10.1105/tpc.108.063115
Pfalz, M., Vogel, H., Mitchell-Olds, T., and Kroymann, J. (2007). Mapping of QTL for resistance against the crucifer specialist herbivore Pieris brassicae in a new Arabidopsis inbred line population, Da(1)-12 × Ei-2. PLoS ONE 2:e578. doi: 10.1371/journal.pone.0000578
Rahman, H., Kebede, B., Zimmerli, C., and Yang, R. C. (2014). Genetic study and QTL mapping of seed glucosinolate content in Brassica rapa L. Crop Sci. 54, 537–543. doi: 10.2135/cropsci2013.06.0391
Reichelt, M., Brown, P. D., Schneider, B., Oldham, N. J., Stauber, E., Tokuhisa, J., et al. (2002). Benzoic acid glucosinolate esters and other glucosinolates from Arabidopsis thaliana. Phytochemistry 59, 663–671. doi: 10.1016/S0031-9422(02)00014-6
Rout, K., Sharma, M., Gupta, V., Mukhopadhyay, A., Sodhi, Y. S., Pental, D., et al. (2015). Deciphering allelic variations for seed glucosinolate traits in oilseed mustard (Brassica juncea) using two bi-parental mapping populations. Theor. Appl. Genet. 128, 657–666. doi: 10.1007/s00122-015-2461-9
Rowe, H. C., and Kliebenstein, D. J. (2007). Elevated genetic variation within virulence-associated Botrytis cinerea polygalacturonase loci. Mol. Plant Microbe Interact. 20, 1126–1137. doi: 10.1094/MPMI-20-9-1126
Rowe, H. C., and Kliebenstein, D. J. (2008). Complex genetics control natural variation in Arabidopsis thaliana resistance to Botrytis cinerea. Genetics 180, 2237–2250. doi: 10.1534/genetics.108.091439
Rowe, H. C., Walley, J. W., Corwin, J., Chan, E. K.-F., Dehesh, K., and Kliebenstein, D. J. (2010). Deficiencies in jasmonate-mediated plant defense reveal quantitative variation in Botrytis cinerea pathogenesis. PLoS Pathog. 6:e1000861. doi: 10.1371/journal.ppat.1000861
Sharma, H. C., Pampapathy, G., Dhillon, M. K., and Ridsdill-Smith, J. T. (2005). Detached leaf assay to screen for host plant resistance to Helicoverpa armigera. J. Econ. Entomol. 98, 568–576. doi: 10.1093/jee/98.2.568
Sønderby, I. E., Geu-Flores, F., and Halkier, B. A. (2010). Biosynthesis of glucosinolates - gene discovery and beyond. Trends Plant Sci. 15, 283–290. doi: 10.1016/j.tplants.2010.02.005
Staal, J., Kaliff, M., Dewaele, E., Persson, M., and Dixelius, C. (2008). RLM3, a TIR domain encoding gene involved in broad-range immunity of Arabidopsis to necrotrophic fungal pathogens. Plant J. 55, 188–200. doi: 10.1111/j.1365-313X.2008.03503.x
Staats, M., and van Kan, J. A. L. (2012). Genome update of Botrytis cinerea strains B05.10 and T4. Eukaryot. Cell 11, 1413–1414. doi: 10.1128/EC.00164-12
Stotz, H. U., Sawada, Y., Shimada, Y., Hirai, M. Y., Sasaki, E., Krischke, M., et al. (2011). Role of camalexin, indole glucosinolates, and side chain modification of glucosinolate-derived isothiocyanates in defense of Arabidopsis against Sclerotinia sclerotiorum. Plant J. 67, 81–93. doi: 10.1111/j.1365-313X.2011.04578.x
ten Have, A., Mulder, W., Visser, J., and Van Kan, J. A. (1998). The endopolygalacturonase gene Bcpg1 is required for full virulence of Botrytis cinerea. Mol. Plant Microbe Interact. 11, 1009–1016. doi: 10.1094/MPMI.1998.11.10.1009
van Wees, S. (2008). Phenotypic analysis of Arabidopsis mutants: trypan blue stain for fungi, oomycetes, and dead plant cells. CSH Protoc. 2008, pdb.rot4982. doi: 10.1101/pdb.prot4982
Velasco, P., Slabaugh, M. B., Reed, R., Kling, J., Kishore, V. K., Stevens, J. F., et al. (2011). Glucosinolates in the new oilseed crop meadowfoam: natural variation in Section Inflexae of Limnanthes, a new glucosinolate in L. floccosa, and QTL analysis in L. alba. Plant Breed. 130, 352–359. doi: 10.1111/j.1439-0523.2010.01830.x
Weis, C., Hildebrandt, U., Hoffmann, T., Hemetsberger, C., Pfeilmeier, S., Konig, C., et al. (2014). CYP83A1 is required for metabolic compatibility of Arabidopsis with the adapted powdery mildew fungus Erysiphe cruciferarum. New Phytol. 202, 1310–1319. doi: 10.1111/nph.12759
Wentzell, A. M., Rowe, H. C., Hansen, B. G., Ticconi, C., Halkier, B. A., and Kliebenstein, D. J. (2007). Linking metabolic QTLs with network and cis-eQTLs controlling biosynthetic pathways. PLoS Genet. 3:e162. doi: 10.1371/journal.pgen.0030162
Williams, P. H., and Hill, C. B. (1986). Rapid-cycling populations of brassica. Science 232, 1385–1389. doi: 10.1126/science.232.4756.1385
Williamson, B., Tudzynski, B., Tudzynski, P., and Van Kan, J. A. (2007). Botrytis cinerea: the cause of grey mould disease. Mol. Plant Pathol. 8, 561–580. doi: 10.1111/j.1364-3703.2007.00417.x
Zou, Z. W., Ishida, M., Li, F., Kakizaki, T., Suzuki, S., Kitashiba, H., et al. (2013). QTL analysis using SNP markers developed by next-generation sequencing for identification of candidate genes controlling 4-methylthio-3-butenyl glucosinolate contents in roots of radish, Raphanus sativus L. PLoS ONE 8:e53541. doi: 10.1371/journal.pone.0053541
Keywords: plant–pathogen interaction, Brassica rapa, B. cinerea, quantitative disease resistance, QTL mapping, GSL
Citation: Zhang W, Kwon S-T, Chen F and Kliebenstein DJ (2016) Isolate Dependency of Brassica rapa Resistance QTLs to Botrytis cinerea. Front. Plant Sci. 7:161. doi: 10.3389/fpls.2016.00161
Received: 01 December 2015; Accepted: 30 January 2016;
Published: 17 February 2016.
Edited by:
Vincenzo Lionetti, Sapienza – Università di Roma, ItalyReviewed by:
Jens Staal, Ghent University, BelgiumCarmen González Bosch, Universidad de Valencia, Spain
Copyright © 2016 Zhang, Kwon, Chen and Kliebenstein. This is an open-access article distributed under the terms of the Creative Commons Attribution License (CC BY). The use, distribution or reproduction in other forums is permitted, provided the original author(s) or licensor are credited and that the original publication in this journal is cited, in accordance with accepted academic practice. No use, distribution or reproduction is permitted which does not comply with these terms.
*Correspondence: Daniel J. Kliebenstein, kliebenstein@ucdavis.edu