 Yun Fan1
 Gaofeng Zhou
 Sergey Shabala
 Zhong-Hua Chen
 Chengdao Li
 Meixue Zhou
- 1School of Land and Food and Tasmanian Institute for Agriculture, University of Tasmania, Kings Meadows, TAS, Australia
- 2Western Australian State Agricultural Biotechnology Centre, Murdoch University, Murdoch, WA, Australia
- 3School of Science and Health, Western Sydney University, Penrith, NSW, Australia
Salinity stress is one of the most severe abiotic stresses that affect agricultural production. Genome wide association study (GWAS) has been widely used to detect genetic variations in extensive natural accessions with more recombination and higher resolution. In this study, 206 barley accessions collected worldwide were genotyped with 408 Diversity Arrays Technology (DArT) markers and evaluated for salinity stress tolerance using salinity tolerance score – a reliable trait developed in our previous work. GWAS for salinity tolerance had been conducted through a general linkage model and a mixed linkage model based on population structure and kinship. A total of 24 significant marker-trait associations were identified. A QTL on 4H with the nearest marker of bPb-9668 was consistently detected in all different methods. This QTL has not been reported before and is worth to be further confirmed with bi-parental populations.
Introduction
Salinity stress disrupts plant metabolisms, affecting crop yield and restricting the utilization of agricultural land. It has been estimated that 20% of arable land worldwide is salinized which mainly results from natural causes, such as climate change and human influence factors like poor irrigation management (Flowers and Yeo, 1995; FAO, 2008). At the whole-plant level, salinity stress is considered to be composed of two phases: a rapid osmotic stress which reduces shoot growth, and slower ionic stress which accelerates senescence of older leaves due to elevated leaf Na+ content (Munns and Tester, 2008). Osmotic stress affects plant growth by reducing cell expansion and elongation rates, which leads to smaller and thicker leaves, and down-regulated photosynthesis by reducing stomatal aperture (Bradford, 1976). Plants employ numerous mechanisms to adapt to saline conditions. The major ones include Na+ exclusion from uptake; control of xylem Na+ loading and/or its retrieval from the shoot; efficient vacuolar Na+ sequestration; cytosolic K+ homeostasis and retention in root and mesophyll cells; efficient osmotic adjustment; and ROS detoxification (Zhu, 2003; Munns and Tester, 2008). Some naturally salt tolerant species such as halophytes also possess a set of unique anatomical features such as salt grands of bladders (Flowers and Colmer, 2008; Shabala and Mackay, 2011; Shabala et al., 2014). Ion homeostasis is controlled by numerous ion channels, ion sensing and signaling, pathways of transportation and compartmentalization mechanisms (Zhu, 2003; Munns and Tester, 2008). Since many traits underlying adaption to stress are quantitative and controlled by multiple genetic pathways, a wide variety of genes are implicated in salinity tolerance (DeRose-Wilson and Gaut, 2011).
Barley is one of the most important cereal crops worldwide, and also the most salt tolerant cereal (Munns and Tester, 2008). Cultivated barley originated from wild barley and domesticated within the Fertile Crescent and Tibet (Badr et al., 2000; Kilian et al., 2006; Dai et al., 2012). Barley is indispensable to malting and brewing industries and also serves as a staple food in some areas of the world due to its broad adaption to salinity, drought, and high altitude (Baik and Ullrich, 2008). Both genetic diversity and adaption to broad conditions resulted in a rich gene pool of barley (Nevo and Chen, 2010). However, modern cultivated barley varieties only include 15 to 40% of all alleles within the barley gene pool, indicating that only a small part of barley genetic potential has been used for improvement for salinity tolerance (Ellis et al., 2000; Kilian et al., 2006; Long et al., 2013). Progress in improving crop salinity tolerance or developing salt tolerant cultivars has been lagging behind many improvements in crop biotic stress tolerance due to the fact that salinity tolerance is a physiologically and genetically (quantitative inheritance) complex trait controlled by numerous QTL (Flowers, 2004). Traditional bi-parental QTL mapping has been widely used for the dissection of salinity tolerance and the identification of tolerance genes. Bi-parental QTL mapping detects chromosomal regions varying from a few to several tens of centi-Morgans (cM), harboring a large number of genes (Long et al., 2013). Many QTL for salinity tolerance were detected using a wide variety of agronomic and physiological traits as selection criteria for barley salinity tolerance. These include plant survival (Xu et al., 2012; Zhou et al., 2012; Fan et al., 2015), yield and agronomic traits (Ellis et al., 2002; Xue et al., 2009), seed germination (Witzel et al., 2010), Na+ exclusion (Shavrukov et al., 2010), tissue ion content (Xue et al., 2009), water soluble carbohydrate and chlorophyll content (Siahsar and Narouei, 2010).
Bi-parental QTL mapping has shown the power to identify candidate QTL/genes for salinity tolerance. However, allelic diversity between parents and recombination occurring during the production of populations are limited, which leads to limitations in QTL mapping, although there are some multi-parent populations such as Multi-parent Advanced Generation Inter-Cross (MAGIC) (Kover et al., 2009; Korte and Farlow, 2013). Recent rapid development in genotyping and sequencing technologies has enabled novel association mapping to identify alleles in a much broader range of natural accessions. A genome wide association study (GWAS) explores the recombination that has occurred during a long evolutionary history of diverse sets of accessions (Nordborg and Tavare, 2002). QTL mapping is suitable for detecting rare alleles of large effect, while GWAS could be a complementary approach for the identification of major allelic variants underlying quantitative and complex traits (DeRose-Wilson and Gaut, 2011; Long et al., 2013). Barley has a high level population structure such as two-rowed and six-rowed cultivars, spring and winter barley (Pasam et al., 2012). Due to the confounding effect of population structure, GWAS have a higher chances of producing false positive (type I) and negative (type II) errors than QTL mapping (Zhu et al., 2008). A mixed-linear model (MLM) approach has been developed which leads to a better performance (Yu et al., 2006). In barley, GWAS has been used for detecting genetic variations underlying diverse complex traits such as agronomic and morphologic traits (Cockram et al., 2010; Pasam et al., 2012; Wang et al., 2012; Munoz-Amatriain et al., 2014), malting quality related traits (Huang et al., 2014; Matthies et al., 2014; Cai et al., 2015), cadmium accumulation (Wu et al., 2015), frost tolerance (Visioni et al., 2013), aluminum tolerance (Cai et al., 2013; Zhou et al., 2016) and salinity tolerance (Long et al., 2013).
The objectives of this study were to (1) detect candidate QTL for salinity tolerance in barley through a GWAS; (2) and discuss how statistical models affect the power of GWAS. Also, for the first time, we utilized QTL mapping through MapQTL 6.0 software to confirm those QTL detected in GWAS.
Materials and Methods
Barley Germplasm and Genotyping
A total of 206 barley accessions collected from Europe, Asia, Australia, and Canada were used in this study. All the accessions were genotyped with Diversity Arrays Technology (DArT) markers (Wenzl et al., 2004) and distributed over the whole genome. A consensus genetic map was sourced from http://www.diversityarrays.com. More than 1100 polymorphic DArT markers were scored for this population. Among them, 482 markers were found to have a specific chromosome position. A total of 408 markers, with Q value (marker quality) and call rate above 80% as well as minor allele frequency (MAF) higher than 0.05, were used for population structure and association mapping analysis.
Evaluation of Salinity Tolerance
Salinity tolerance of these barley varieties were evaluated in the 2013 and 2014 barley growing seasons. Experiments were conducted in a glasshouse in Launceston, Tasmania, Australia. Seeds of all the accessions were sown in large plastic containers (1.6 m × 2.5 m × 0.6 m) using a potting mixture described in Fan et al. (2015). Each genotype consisted of three replicates, each of five seedlings. Salt treatment was performed with 300 mM NaCl. A control experiment was not conducted since it had been proved that different varieties, in the same potting mixture without salt added, exhibited no obvious symptoms of leaf chlorosis or wilting (Zhou et al., 2012). The salt treatment started at the two-leaf stage and was repeated every 3 days according to our previous method (Xu et al., 2012; Zhou et al., 2012). When the most susceptible lines showed severe symptoms, salinity tolerance was assessed by combining scores for plant survival and leaf chlorosis (0 = no damage and 10 = all dead) (Xu et al., 2012).
Population Structure and Kinship Analysis
A total of 408 DArT markers distributed over the whole genome were used for population structure analysis using STRUCTURE software (v2.3.3) (Pritchard et al., 2000). The number of clusters (K) was set from 2 to 12 and 20 iterations were conducted in an admixture model with a 10,000 burning period and 10,000 MCMC (Markov Chain Monte Carlo). K value was the number of clusters when ΔK achieved maximum value (Evanno et al., 2005). Principle component analysis (PCA) was performed using GAPIT R package to visualize the dispersion of the association panel in a graph (Lipka et al., 2012). A kinship analysis was conducted using SPAGeDi software (Hardy and Vekemans, 2002). The kinship matrix measured the genetic similarity between individuals.
Genome Wide Association Study
A GWAS among phenotypic trait (mean value of 2013 and 2014), DArT markers (genotype), population structure and kinship were conducted using TASSEL software (v3.0) (Bradbury et al., 2007). The Q, K and Q + K methods were used for GWAS. For Q model: y = Xβ + Qν + e; for K model: y = Xβ + Zμ + e; for Q + K model: y = Xβ + Qν + Zμ + e. X is DArT marker matrix, Q and Z represent sub-population membership matrix and kinship matrix, respectively, β and ν are coefficient vectors for DArT marker and sub-population membership, respectively, μ is a vector of random genetic effects μ ~ N (0, 2 K) and e is the random error vector. P < 0.01 (-log10 (P) > 2) was set as the significant threshold in the association study. Manhattan plots were displayed using R software (v2.14.2). For evaluating the fitness and efficiency of different models, quantile–quantile (Q–Q) plots were shown using TASSEL (v3.0).
Confirmation of the Number of QTL
A genetic linkage map for this natural population has been constructed using Diversity Array Technology (DArT) markers. The DArT markers consensus genetic map was provided at http://www.diversityarrays.com. The software package MapQTL 6.0 (Van Ooijen, 2009) was also used to detect QTL and confirm the relationship between different markers around each QTL, since the GWAS resulted in several marker-trait associations with many markers locating at close positions to each other. QTL were first analyzed by interval mapping (IM). The marker with highest LOD values at each putative QTL identified using IM was selected as a cofactor and the selected markers were used as genetic background controls in the approximate multiple QTL model (MQM). The population structure (Q-matrix) was used as covariates. A logarithm of the odds (LOD) threshold value of 3.0 was applied to declare the presence of a QTL at 95% significance level.
Genomic Analysis of Potential Genes for Salinity Tolerance
The nearest marker of the QTL for salinity tolerance, bPb-9668 on 4H (see results), was consistently detected in all methods. bPb-9668 was located at the end of chromosome 4H. Barley genomic data and gene annotations were downloaded from ftp://ftpmips.helmholtz-muenchen.de/plants/barley/public_data/ (Mayer et al., 2012) and ftp://ftpmips.helmholtz-muenchen.de/plants/barley/public_data/ (Mascher et al., 2013). Annotated genes within 15cM around bPb-9668 on 4H were examined for potential genes for salinity tolerance.
Results
Salinity Tolerance of Barley Accessions
Barley accessions exhibited significant difference in their salinity tolerance. Since the scoring was conducted at a relatively early stage of salt treatment when clear phenotypic segregation was shown, most of the sensitive varieties (e.g., Franklin, Gairdner) were scored for five while the tolerant varieties (CPI-11284-48, TX9425) had a score of 1. The scores from 2 years correlated significantly with each other (r = 0.65). Therefore, the average data were used for further analysis. Figure 1 shows the frequency distribution (the number of accessions) of salinity tolerance based on the average leaf wilting and plant survival scores of all genotypes, ranging from 1 to 8.
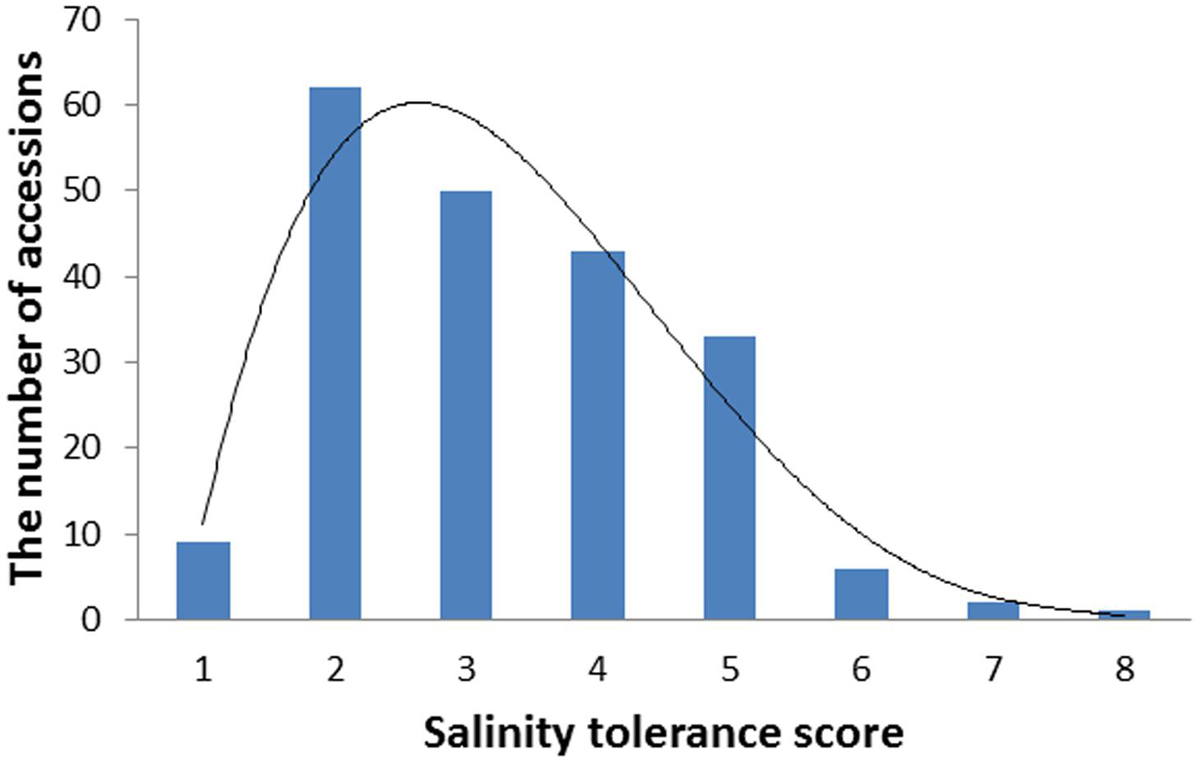
FIGURE 1. The distribution frequency of salinity tolerance scores in 206 barley varieties. Seedlings were treated with 300 mM NaCl at the two leaf stage. Salinity tolerance was scored from 0 to 10 by leaf chlorosis (0 = tolerant, 10 = sensitive). Data were averaged over two growth seasons, 2013 and 2014.
Population Structure
Cluster parameter K was set from 2 to 12. According to the explanation of Evanno et al. (2005), the largest value of statistic index ΔK was used as an indicator for evaluating the most probable number of subpopulations among all accessions. In this study, ΔK reached the highest value when K = 6 (Figure 2). Therefore, the most appropriate number of clusters are represented by six different colors (Figure 3). STRUCTURE results were also confirmed by PCA (Supplementary Figure S1). Details of population structures of 206 barley accessions are listed in Additional File Supplementary Table S1.
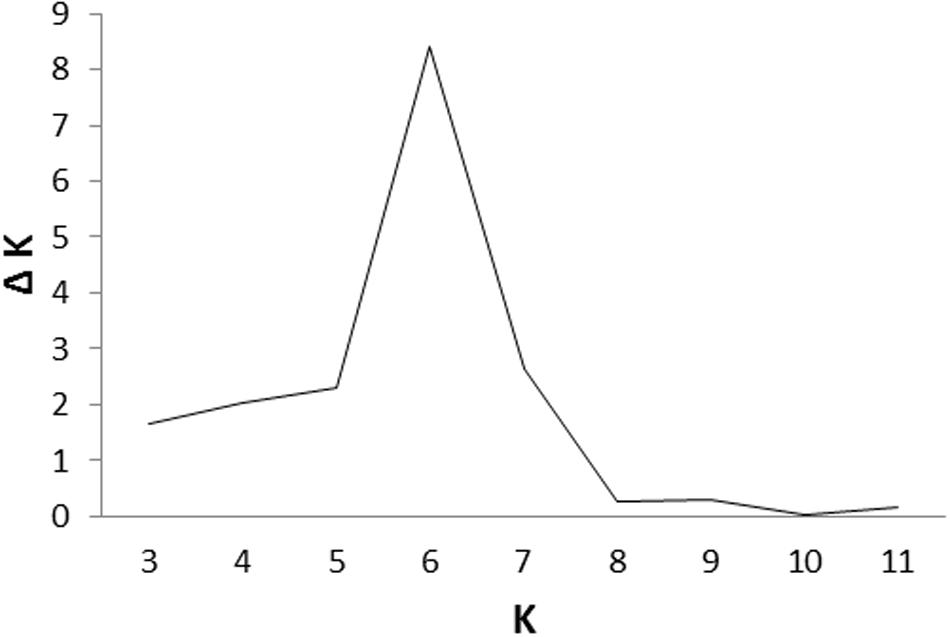
FIGURE 2. An estimation of the most probable number of clusters (K), based on 20 independent runs and K ranging from 2 to 12.
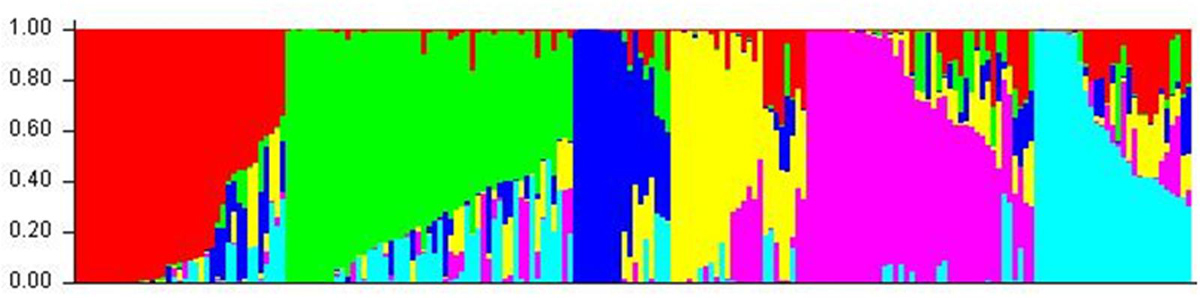
FIGURE 3. The population structure of 206 barley accessions. Six subpopulations (K = 6) were produced based on genetic diversity detected by 408 DArT markers, each are represented by a different color.
Association Mapping for Salinity Tolerance
Salinity tolerance of 206 barley accessions and 408 DArT markers were used for association mapping. A total of 24 significant marker-trait associations were detected with Q method. These markers are located on 2H, 3H, 4H, 5H, 6H, and 7H (Figure 4; Table 1), representing 12 potential QTL. Only two significant marker-trait associations (one QTL) were detected on 4H with the K method, while two significant marker-trait associations representing two QTL were identified with the Q + K method, located on 2H and 4H, respectively (Figure 4; Table 1).
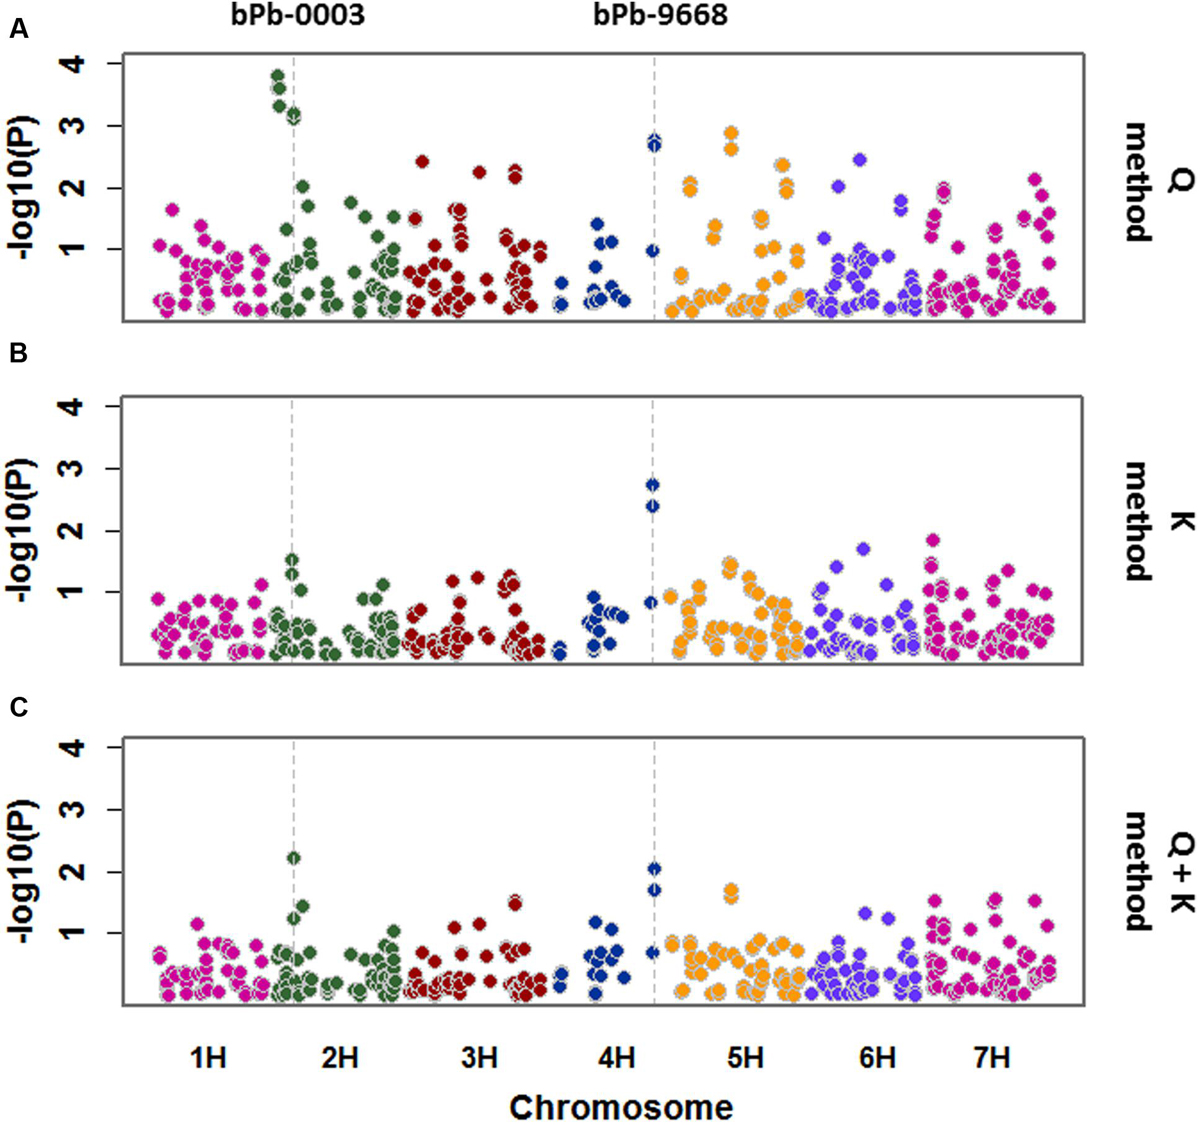
FIGURE 4. A Manhattan plot for genome wide association study (GWAS) of salinity tolerance in 206 barley accessions. GWAS was analyzed by three methods: (A) Q method; (B) K method; (C) Q + K method. Significant associations were identified using criterion of -log10 (P) > 2 (P < 0.01).
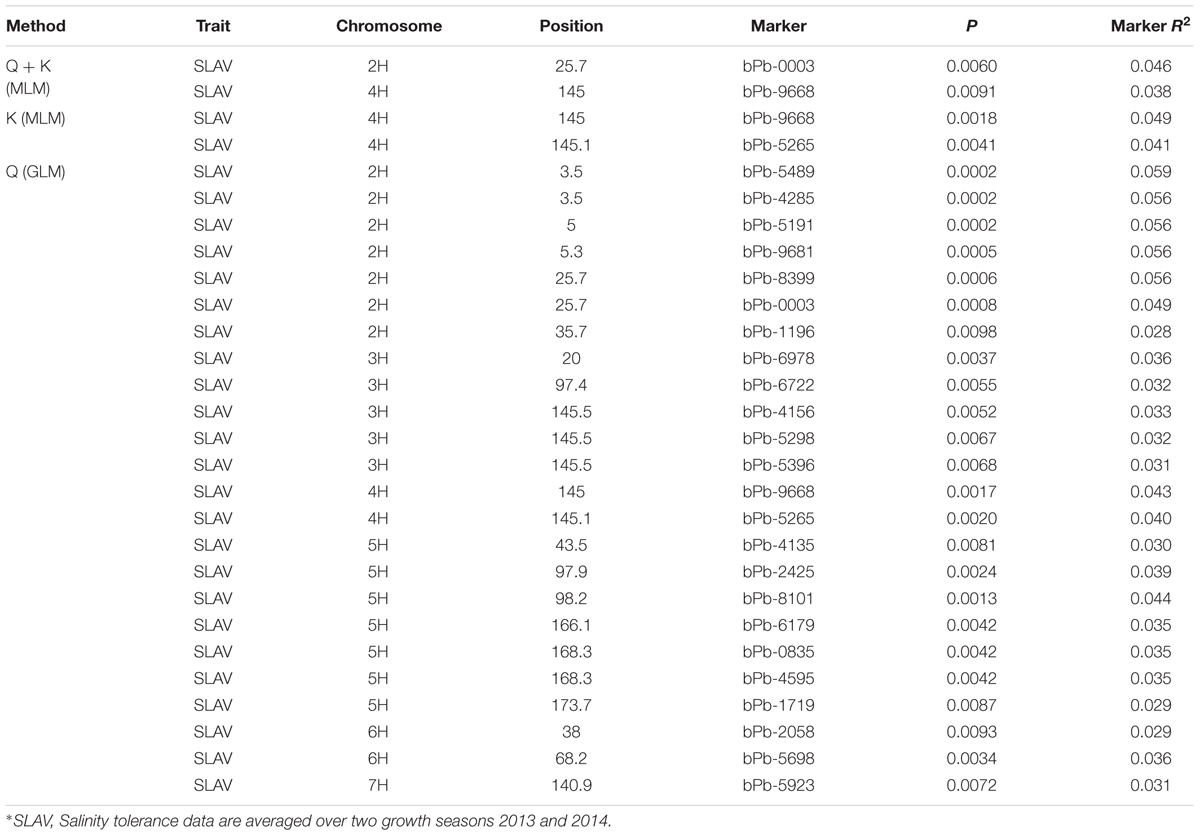
TABLE 1. Association mapping results for salinity tolerance with the Q method, K method, and Q + K method, respectively (P < 0.01).
Quantile–quantile (Q–Q) plot was employed to evaluate the fitness and efficiency of different models. The observed –log10 (P) values for salinity tolerance were closer to expected –log10 (P) values from the K and Q + K methods than those from the Q method (Supplementary Figure S2). However, only one or two QTL were detected in the K or the Q + K methods, whereas about 12 QTL were detected with the Q method.
P value < 0.01 have been used as a cut-off for barley GWAS in many studies (Pasam et al., 2012; Shu et al., 2012; Huang et al., 2014). The marker bPb-9668 on 4H (145.0 cM) showed consistent significance (P < 0.01) of marker-trait associations using the Q, K, and Q + K methods (Figure 4; Table 1). Another marker, bPb-5265 (145.1 cM) on 4H which is close to bPb-9668, showed significance under the Q and K methods, not Q + K method (Table 1). The marker bPb-0003 on 2H showed significant marker-trait associations with both the Q and the Q + K methods but not the K method (Figure 4; Table 1).
Based on marker polymorphisms, the salinity tolerance of 206 barley accessions were grouped into two genotypes according to their base calls of the marker bPb-9668 and bPb-0003 (Figure 5A; Supplementary Table S2). Accessions with different polymorphisms at bPb-9668 and bPb-0003 showed highly significant differences in salinity tolerance (P < 0.0001, Figure 5A; Supplementary Table S2).
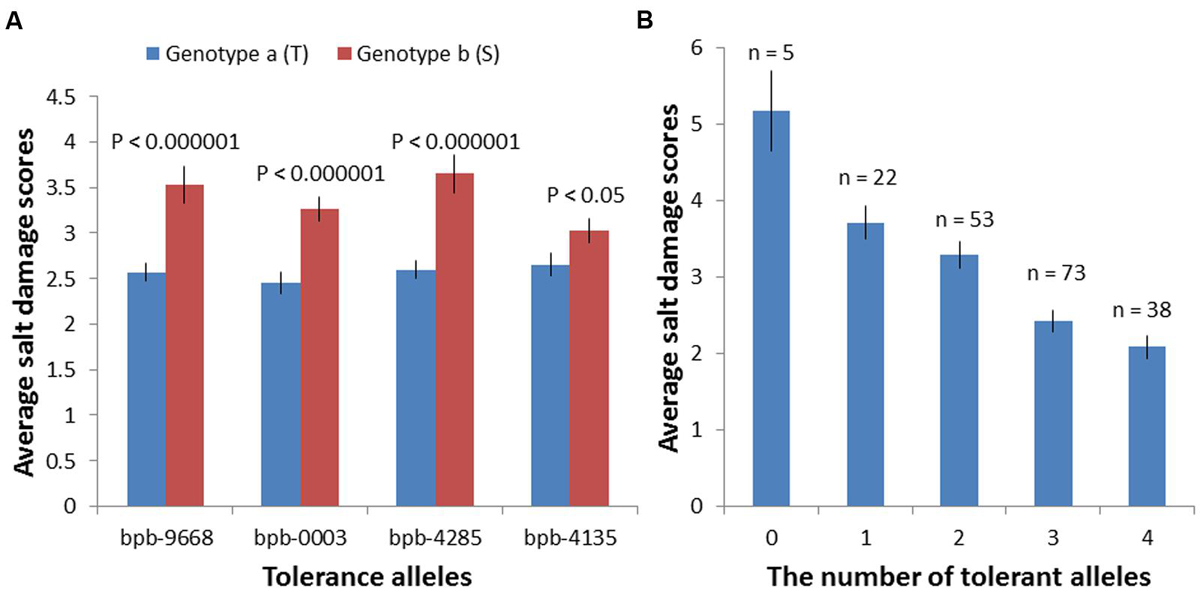
FIGURE 5. Salinity tolerance of 206 barley accessions of two genotype groups based on their Base calls of the markers: bPb-9668, bPb-0003, bPb-4285, and bPb-4135. (A) Accessions with different polymorphisms at these four markers showed very significant differences in salinity tolerance; ∗T: tolerant, S: sensitive. (B) These four QTL showed an additive effect with the average tolerance score (2.08) of varieties combining all four tolerance alleles than that of varieties with all susceptible alleles (5.167); ∗0: without any tolerance alleles, 1–3: with 1–3 tolerance alleles, 4: with all four tolerance alleles.
QTL Mapping for Salinity Tolerance Using MapQTL6.0 Software
Many marker-trait associations were detected using the Q-method with some of them being located at similar positions. In order to identify the similarity of those markers located at similar positions, MapQTL6.0 was used to detect significant QTL. When analyzed for QTL using MapQTL6.0 software using population structure (Q-matrix) as covariates, the results were very close to association mapping with the Q method (Supplementary Figure S3). The analysis produced 3 significant QTL (LOD > 3.0) and 4 tentative QTL (3 > LOD > 2) (Table 2), with all of them being in line with those from association mapping with the Q method. The most significant QTL on 4H was the same as that identified with both the K and the Q + K methods (Tables 1 and 2). MQM mapping resulted with, apart from two QTL based on bPb-9668 and bPb-0003 from the K or the Q + K method (Figure 4; Table 1), two more QTL with nearest marker bPb-4285 and bPb-4135 being significant with LOD > 3.0 (Table 2). bPb-4285 also showed a highest –log10 (P) in the Q method (Figure 4; Table 1). The salinity tolerance of the 206 barley accessions was also grouped into two genotypes according to the base calls of the marker. As shown in Figure 5A and Supplementary Table S2, all four markers showed significant association with salinity tolerance. The four QTL showed additive effects with the average salinity tolerance being increased with the increased number of tolerance alleles. The average damage score of varieties combining all four tolerance alleles was 2.1, while that of no tolerance alleles was 5.2 (Figure 5B; Supplementary Table S2).
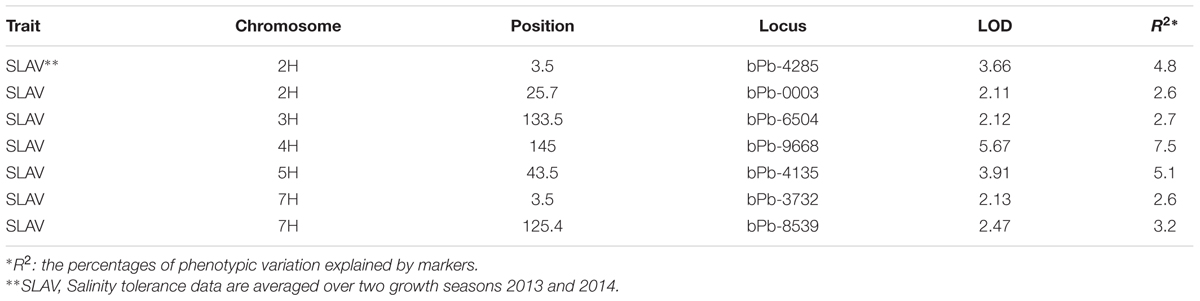
TABLE 2. QTL mapping results for salinity tolerance in 206 barley varieties when structure was used as covariate (LOD > 2.0).
Potential Genes for Salinity Tolerance on 4H
In this study, QTL on 4H with the nearest marker of bPb-9668 was the most significant, consistently detected in all methods. Annotated genes around this marker on 4H are listed in Supplementary Table S3. Among all annotated genes, there are two possible genes likely to be associated with salinity tolerance, MLOC_70918.1 and MLOC_5021.1. Both locate at the end of chromosome 4H and close to the marker bPb-9668 according to the POPSeq map (Mascher et al., 2013). MLOC_70918.1 belongs to glutathione-regulated potassium-efflux system protein while MLOC_5021.1 is a respiratory burst oxidase-like protein. Ion homeostasis, especially Na+ and K+, are related to salinity tolerance (Munns and Tester, 2008). RESPIRATORY BURST OXIDASE HOMOLOG F (RBOHF) encodes a specific isoform of NADPH oxidase, which plays a vital role in soil salinity tolerance (Jiang et al., 2012).
Discussion
A New QTL for Salinity Tolerance was Identified by Association Mapping
Salinity tolerance is a genetically and physiologically complex trait controlled by numerous QTL (Flowers, 2004). Leaf wilting and plant survival are two of the major symptoms caused by salt stress and had been used for evaluating salinity tolerance of barley through traditional bi-parental QTL mapping in many studies (Xu et al., 2012; Zhou et al., 2012; Fan et al., 2015). In the present experiments, 206 barley accessions were assessed for salinity tolerance and various mapping methods were used to identify QTL controlling salinity tolerance. Different numbers of QTL were identified using different mapping methods. Association mapping using Q methods identified 12 QTL which are located on 2H (3.5, 25.7 cM), 3H (20, 97.4, 145.5 cM), 4H (145 cM), 5H (43.5, 97.9, 166.1 cM), 6H (38, 68.2 cM), and 7H (140.9 cM), respectively (Figure 4; Table 1). Most of these QTL were further confirmed by analyzing QTL using MapQTL 6.0 software. Some of them were located at similar positions to those reported before by GWAS or bi-parental QTL mapping. The QTL on 2H located at a similar position to that reported in the DH population of TX9425/Naso Nijo (Xu et al., 2012). QTL on 6H with the nearest marker bPb-2058 was close to QSl.Yy.Fr.6H (26 cM) from the DH population of YYXT and Franklin (Zhou et al., 2012). No QTL was reported for salinity tolerance on 4H at the same position (145 cM) of the QTL identified by all four methods in the current study. The nearest QTL for a salinity tolerance-related trait on 4H was located at 119.1 cM in their consensus map (Close et al., 2009), controlling shoot Na+/K+ under saline conditions (Long et al., 2013), which is also close to the telomere of 4HL. However, shoot Na+/K+ under saline conditions was not related to salinity tolerance in their study with the QTL for salinity tolerance being located on 6H (Long et al., 2013).
GWAS Results Are Affected by Models and Evaluation Methods
In this study, GWAS was conducted with three different models, Q (population structure), K (kinship) and Q+K. According to the Q–Q plots (Supplementary Figure S2), K and Q + K were similar, and both stricter than the Q model. The observed –log10 (P) values for salinity tolerance deviated from the expected –log10 (P) values in the Q method (general linear model), indicating that they may contain false positive associations (Supplementary Figure S2A). The addition of genetic relatedness (i.e., relationship or kinship) makes the MLM more powerful, thus reducing the number of false positive associations (Yu et al., 2006). K and Q + K were similar in this study on the basis of the Q–Q plots and results in Table 1, which was in accordance with Cai et al. (2013). However, only two and one QTL were identified with the K method and the Q + K method, respectively, while a lot more QTL were identified with the Q method. Therefore, QTL mapping was also conducted with the MapQTL 6.0 software (Van Ooijen, 2009) using population structure as covariate to adjust the natural variations of this population. Nearly all the QTL identified with MapQTL6.0 were in line with those from association mapping with the Q method and the most significant one was the same as that identified using the K and Q + K methods. The percentages of phenotypic variation explained by various markers analyzed with MapQTL 6.0 are very close to those analyzed with Q method (R2 = 0.89, Supplementary Figure S3).
To compare the robustness of combining different mapping approaches, all the accessions were grouped based on their base calls of the markers bPb-9668, bPb-0003, bPb-4285, and bPb-4135 (Figure 5; Supplementary Table S2), the four significant QTL detected with both GWAS (Q method) and MapQTL 6.0 (Tables 1 and 2). Accessions with different polymorphisms at bPb-9668, bPb-0003, bPb-4285, and bPb-4135 had differences in tolerance scores of 0.960 (P < 0.000001), 0.814 (P < 0.000001), 1.053 (P < 0.000001), and 0.371 (P < 0.05), respectively (Supplementary Table S2). These four QTL also showed additive effects with the average tolerance score (2.1) of varieties combining all four tolerance alleles being significantly better than that of varieties with all susceptible alleles (5.2) (Figure 5; Supplementary Table S2). There could be higher chances of false positive or negative errors in GWAS than in bi-parental QTL mapping, resulting from the complex population structure (Myles et al., 2009; Pasam et al., 2012), thus the MLM approach using the K matrix or a combination (Q+K) could perform better than general linkage model (GLM). However, in this study, the K or the Q + K methods were shown to be too strict, resulting in the missing of some possibly useful QTL. QTL mapping using MapQTL6.0 with the Q matrix as covariates in natural populations showed similar power as GLM. The advantage of using the MQM of MapQTL 6.0 is the confirmation of the number of QTL through cofactor selection (Van Ooijen, 2009).
Confirmation of QTL Identified by GWAS
Salinity tolerance is a quantitative trait controlled by many QTL. Many methods have been used to identify the QTL. Care should be taken to balance the rate of false positives and negatives during the process of analysis using different models/methods (Pasam et al., 2012). Traditional QTL mapping through bi- or multi-parental populations is a powerful method but suffers from a limited amount of recombination. GWAS can partly overcome the limitation by using a diverse germplasm but may lead to a number of false positive or negative associations. Different methods can be complementary to each other and benefit can be achieved by mitigating the other’s limitations (Korte and Farlow, 2013). In this study, the combination of GWAS and QTL mapping has led to successful identification of QTL with potential application in breeding programs. However, the QTL identified by GWAS requires further confirmation in bi- or multi- parental populations.
Conclusion
In this study, 24 markers showed significant association with salinity tolerance. Different methods were used for QTL detection concluding with four significant QTL. These QTL showed additive effects with salinity tolerance being greatly increased by combining all four tolerance alleles. A new QTL on 4H (telomere of the long arm) was detected with different methods and will be further investigated. Overall, the K or the Q + K method was stricter than the Q method but may result in some missed useful QTL. The Q method, with similar power as MapQTL 6.0 using population structure as covariate, discovered more QTL but could have produced false positives. Population size, accuracy of phenotyping, and quantity of markers can be increased to enhance the power of association mapping, and further confirmation of QTL will be needed. The confirmed QTL can then be used in breeding programs.
Author Contributions
MZ and CL designed the work; CL and GZ prepared the barley germplasm and did genotyping; MZ and YF did the phenotyping and analyzed the data; SS, Z-HC, and SC contributed to data analysis and interpretation; YF drafted the paper; all authors revised the paper and approved the final version to be published.
Conflict of Interest Statement
The authors declare that the research was conducted in the absence of any commercial or financial relationships that could be construed as a potential conflict of interest.
Acknowledgments
This work was supported by Grains Research and Development Corporation of Australia.
Supplementary Material
The Supplementary Material for this article can be found online at: http://journal.frontiersin.org/article/10.3389/fpls.2016.00946
FIGURE S1 | Principal component analysis (PCA) of 206 barley accessions. Population structure and dispersion of the association panel were shown through three dimensional (A) and two dimensional (B) diagrams. (C) Number detection of subpopulations or principal components.
FIGURE S2 | Quantile–quantile (Q–Q) plots of estimated -log10 (P). Q–Q plots were displayed in marker-trait association analysis using three models: (A) Q method; (B) K method; (C) Q + K method. The black line represents the expected line under the null distribution. The red symbol is the observed -log10 (P) for salinity tolerance.
FIGURE S3 | Correlations between marker R2 from the Q method general linkage model (GLM) in GWAS and the R2 from QTL mapping using MapQTL6.0 software with population structure (Q-matrix) as covariates. R2: the percentages of phenotypic variation explained by markers.
References
Badr, A., Muller, K., Schafer-Pregl, R., El Rabey, H., Effgen, S., Ibrahim H. H., et al. (2000). On the origin and domestication history of barley (Hordeum vulgare). Mol. Biol. Evol. 17, 499–510. doi: 10.1093/oxfordjournals.molbev.a026330
Baik, B. K., and Ullrich, S. E. (2008). Barley for food: characteristics, improvement, and renewed interest. J. Cereal Sci. 48, 233–242. doi: 10.1016/j.jcs.2008.02.002
Bradbury, P. J., Zhang, Z., Kroon, D. E., Casstevens, T. M., Ramdoss, Y., and Buckler, E. S. (2007). TASSEL: software for association mapping of complex traits in diverse samples. Bioinformatics 23, 2633–2635. doi: 10.1093/bioinformatics/btm308
Bradford, M. M. (1976). A rapid and sensitive method for the quantitation of microgram quantities of protein utilizing the principle of protein-dye binding. Anal. Biochem. 72, 248–254. doi: 10.1016/0003-2697(76)90527-3
Cai, S. G., Han, Z. G., Huang, Y. Q., Chen, Z. H., Zhang, G. P., and Dai, F. (2015). Genetic diversity of individual phenolic acids in barley and their correlation with barley malt quality. J. Agric. Food Chem. 63, 7051–7057. doi: 10.1021/acs.jafc.5b02960
Cai, S. G., Wu, D. H., Jabeen, Z., Huang, Y. Q., Huang, Y. C., and Zhang, G. P. (2013). Genome-wide association analysis of aluminum tolerance in cultivated and tibetan wild barley. PLoS ONE 8:e69776. doi: 10.1371/journal.pone.0069776
Close, T. J., Bhat, P. R., Lonardi, S., Wu, Y., Rostoks, N., Ramsay, L., et al. (2009). Development and implementation of high-throughput SNP genotyping in barley. BMC Genomics 10:582. doi: 10.1186/1471-2164-10-582
Cockram, J., White, J., Zuluaga, D. L., Smith, D., Comadran, J., Macaulay, M., et al. (2010). Genome-wide association mapping to candidate polymorphism resolution in the unsequenced barley genome. Proc. Natl. Acad. Sci. U.S.A. 107, 21611–21616. doi: 10.1073/pnas.1010179107
Dai, F., Nevo, E., Wu, D. Z., Comadran, J., Zhou, M. X., Qiu, L., et al. (2012). Tibet is one of the centers of domestication of cultivated barley. Proc. Natl. Acad. Sci. U.S.A. 109, 16969–16973. doi: 10.1073/pnas.1215265109
DeRose-Wilson, L., and Gaut, B. S. (2011). Mapping salinity tolerance during Arabidopsis thaliana germination and seedling growth. PLoS ONE 6:e22832. doi: 10.1371/journal.pone.0022832
Ellis, R. P., Forster, B. P., Gordon, D. C., Handley, L. L., Keith, R. P., Lawrence, P., et al. (2002). Phenotype/genotype associations for yield and salt tolerance in a barley mapping population segregating for two dwarfing genes. J. Exp. Bot. 53, 1163–1176. doi: 10.1093/jexbot/53.371.1163
Ellis, R. P., Forster, B. P., Robinson, D., Handley, L. L., Gordon, D. C., Russell, J. R., et al. (2000). Wild barley: a source of genes for crop improvement in the 21st century? J. Exp. Bot. 51, 9–17. doi: 10.1093/jexbot/51.342.9
Evanno, G., Regnaut, S., and Goudet, J. (2005). Detecting the number of clusters of individuals using the software STRUCTURE: a simulation study. Mol. Ecol. 14, 2611–2620. doi: 10.1111/j.1365-294X.2005.02553.x
Fan, Y., Shabala, S., Ma, Y. L., Xu, R. G., and Zhou, M. X. (2015). Using QTL mapping to investigate the relationships between abiotic stress tolerance (drought and salinity) and agronomic and physiological traits. BMC Genomics 16:43. doi: 10.1186/s12864-015-1243-8
FAO (2008). FAO Land and Plant Nutrition Management Service. Available at: http://www.fao.org/ag/agl/agll/spush
Flowers, T. J. (2004). Improving crop salt tolerance. J. Exp. Bot. 55, 307–319. doi: 10.1093/jxb/erh003
Flowers, T. J., and Colmer, T. D. (2008). Salinity tolerance in halophytes. New Phytol. 179, 945–963. doi: 10.1111/j.1469-8137.2008.02531.x
Flowers, T. J., and Yeo, A. R. (1995). Breeding for salinity resistance in crop plants: where next? Aust. J. Plant Physiol. 22, 875–884. doi: 10.1071/pp9950875
Hardy, O. J., and Vekemans, X. (2002). SPAGEDi: a versatile computer program to analyse spatial genetic structure at the individual or population levels. Mol. Ecol. Notes 2, 618–620. doi: 10.1046/j.1471-8286.2002.00305.x
Huang, Y. Q., Cai, S. G., Ye, L. Z., Han, Y., Wu, D. Z., Dai, F., et al. (2014). Genetic architecture of limit dextrinase inhibitor (LDI) activity in Tibetan wild barley. BMC Plant Biol. 14:117. doi: 10.1186/1471-2229-14-117
Jiang, C., Belfield, E. J., Mithani, A., Visscher, A., Ragoussis, J., Mott, R., et al. (2012). ROS-mediated vascular homeostatic control of root-to-shoot soil Na delivery in Arabidopsis. EMBO J. 31, 4359–4370. doi: 10.1038/emboj.2012.273
Kilian, B., Ozkan, H., Kohl, J., von Haeseler, A., Barale, F., Deusch, O., et al. (2006). Haplotype structure at seven barley genes: relevance to gene pool bottlenecks, phylogeny of ear type and site of barley domestication. Mol. Genet. Genom. 276, 230–241. doi: 10.1007/s00438-006-0136-6
Korte, A., and Farlow, A. (2013). The advantages and limitations of trait analysis with GWAS: a review. Plant Methods 9:29. doi: 10.1186/1746-4811-9-29
Kover, P. X., Valdar, W., Trakalo, J., Scarcelli, N., Ehrenreich, I. M., Purugganan, M. D., et al. (2009). A multiparent advanced generation inter-cross to fine-map quantitative traits in Arabidopsis thaliana. PLoS Genet. 5:e1000551. doi: 10.1371/journal.pgen.1000551
Lipka, A. E., Tian, F., Wang, Q., Peiffer, J., Li, M., Bradbury, P. J., et al. (2012). GAPIT: genome association and prediction integrated tool. Bioinformatics 28, 2397–2399. doi: 10.1093/bioinformatics/bts444
Long, N. V., Dolstra, O., Malosetti, M., Kilian, B., Graner, A., Visser, R. G. F., et al. (2013). Association mapping of salt tolerance in barley (Hordeum vulgare L.). Theor. Appl. Genet. 126, 2335–2351. doi: 10.1007/s00122-013-2139-0
Mascher, M., Muehlbauer, G. J., Rokhsar, D. S., Chapman, J., Schmutz, J., Barry, K., et al. (2013). Anchoring and ordering NGS contig assemblies by population sequencing (POPSEQ). Plant J. 76, 718–727. doi: 10.1111/tpj.12319
Matthies, I. E., Malosetti, M., Roder, M. S., and van Eeuwijk, F. (2014). Genome-wide association mapping for kernel and malting quality traits using historical european barley records. PLoS ONE 9:e110046. doi: 10.1371/journal.pone.0110046
Mayer, K. F. X., Waugh, R., Langridge, P., Close, T. J., Wise, R. P., Graner, A., et al. (2012). A physical, genetic and functional sequence assembly of the barley genome. Nature 491, 711–716. doi: 10.1038/nature11543
Munns, R., and Tester, M. (2008). Mechanisms of salinity tolerance. Annu. Rev. Plant Biol. 59, 651–681. doi: 10.1146/annurev.arplant.59.032607.092911
Munoz-Amatriain, M., Cuesta-Marcos, A., Endelman, J. B., Comadran, J., Bonman, J. M., Bockelman, H. E., et al. (2014). The USDA barley core collection: genetic diversity, population structure, and potential for genome-wide association studies. PLoS ONE 9:e94688. doi: 10.1371/journal.pone.0094688
Myles, S., Peiffer, J., Brown, P. J., Ersoz, E. S., Zhang, Z. W., Costich, D. E., et al. (2009). Association mapping: critical considerations shift from genotyping to experimental design. Plant Cell 21, 2194–2202. doi: 10.1105/tpc.109.068437
Nevo, E., and Chen, G. X. (2010). Drought and salt tolerances in wild relatives for wheat and barley improvement. Plant Cell Environ. 33, 670–685. doi: 10.1111/j.1365-3040.2009.02107.x
Nordborg, M., and Tavare, S. (2002). Linkage disequilibrium: what history has to tell us. Trends Genet. 18, 83–90. doi: 10.1016/s0168-9525(02)02557-x
Pasam, R. K., Sharma, R., Malosetti, M., van Eeuwijk, F. A., Haseneyer, G., Kilian, B., et al. (2012). Genome-wide association studies for agronomical traits in a world wide spring barley collection. BMC Plant Biol. 12:16. doi: 10.1186/1471-2229-12-16
Pritchard, J. K., Stephens, M., and Donnelly, P. (2000). Inference of population structure using multilocus genotype data. Genetics 155, 945–959.
Shabala, S., Bose, J., and Hedrich, R. (2014). Salt bladders: do they matter? Trends Plant Sci. 19, 687–691. doi: 10.1016/j.tplants.2014.09.001
Shabala, S., and Mackay, A. (2011) “Ion transport in halophytes,” in Plant Responses to Drought and Salinity Stress: Developments in a Post-genomic Era (Advances in Botanical Research), Vol. 57, ed. I. Turkan (Cambridge, MA: Elsevier Academic Press), 151–199. doi: 10.1016/B978-0-12-387692-8.00005-9
Shavrukov, Y., Gupta, N. K., Miyazaki, J., Baho, M. N., Chalmers, K. J., Tester, M., et al. (2010). HvNax3-a locus controlling shoot sodium exclusion derived from wild barley (Hordeum vulgare ssp. spontaneum). Funct. Integr. Genom. 10, 277–291. doi: 10.1007/s10142-009-0153-8
Shu, X., Backes, G., and Rasmussen, S. K. (2012). Genome-wide association study of resistant starch (RS) phenotypes in a barley variety collection. J. Agric. Food Chem. 60, 10302–10311. doi: 10.1021/jf3031875
Siahsar, B. A., and Narouei, M. (2010). Mapping QTLs of physiological traits associated with salt tolerance in ‘Steptoe ‘x’ Morex’ doubled haploid lines of barley at seedling stage. J. Food Agric. Environ. 8, 751–759.
Van Ooijen, J. W. (2009). MapQTL 6.0, Software for the Mapping of Quantitative Trait Loci in Experimental Populations of Dihaploid Species. Wageningen: Kyazma B.V.
Visioni, A., Tondelli, A., Francia, E., Pswarayi, A., Malosetti, M., Russell, J., et al. (2013). Genome-wide association mapping of frost tolerance in barley (Hordeum vulgare L.). BMC Genomics 14:424. doi: 10.1186/1471-2164-14-424
Wang, M. H., Jiang, N., Jia, T. Y., Leach, L., Cockram, J., Waugh, R., et al. (2012). Genome-wide association mapping of agronomic and morphologic traits in highly structured populations of barley cultivars. Theor. Appl. Genet. 124, 233–246. doi: 10.1007/s00122-011-1697-2
Wenzl, P., Carling, J., Kudrna, D., Jaccoud, D., Huttner, E., Kleinhofs, A., et al. (2004). Diversity Arrays Technology (DArT) for whole-genome profiling of barley. Proc. Natl. Acad. Sci. U.S.A. 101, 9915–9920. doi: 10.1073/pnas.0401076101
Witzel, K., Weidner, A., Surabhi, G. K., Varshney, R. K., Kunze, G., Buck-Sorlin, G. H., et al. (2010). Comparative analysis of the grain proteome fraction in barley genotypes with contrasting salinity tolerance during germination. Plant Cell Environ. 33, 211–222. doi: 10.1111/j.1365-3040.2009.02071.x
Wu, D. Z., Sato,K., and Ma, J. F. (2015). Genome-wide association mapping of cadmium accumulation in different organs of barley. New Phytol. 208, 817–829. doi: 10.1111/nph.13512
Xu, R. G., Wang, J. M., Li, C. D., Johnson, P., Lu, C., and Zhou, M. X. (2012). A single locus is responsible for salinity tolerance in a chinese landrace barley (Hordeum vulgare L.). PLoS ONE 7:e43079. doi: 10.1371/journal.pone.0043079
Xue, D. W., Huang, Y. Z., Zhang, X. Q., Wei, K., Westcott, S., Li, C. D., et al. (2009). Identification of QTLs associated with salinity tolerance at late growth stage in barley. Euphytica 169, 187–196. doi: 10.1007/s10681-009-9919-2
Yu, J. M., Pressoir, G., Briggs, W. H., Bi, I. V., Yamasaki, M., Doebley, J. F., et al. (2006). A unified mixed-model method for association mapping that accounts for multiple levels of relatedness. Nat. Genet. 38, 203–208. doi: 10.1038/ng1702
Zhou, G. F., Broughton, S., Zhang, X. Q., Zhou, M. X., and Li, C. D. (2016). Genome-wide association mapping of acid soil resistance in barley (Hordeum vulgare L.). Front. Plant Sci. 7:406. doi: 10.3389/fpls.2016.00406
Zhou, G. F., Johnson, P., Ryan, P. R., Delhaize, E., and Zhou, M. X. (2012). Quantitative trait loci for salinity tolerance in barley (Hordeum vulgare L.). Mol. Breed. 29, 427–436. doi: 10.1007/s11032-011-9559-9
Zhu, C. S., Gore, M., Buckler, E. S., and Yu, J. M. (2008). Status and prospects of association mapping in plants. Plant Genome 1, 5–20. doi: 10.3835/plantgenome2008.02.0089
Keywords: genome wide association study, QTL mapping, evaluation methods, salinity tolerance, barley
Citation: Fan Y, Zhou G, Shabala S, Chen Z-H, Cai S, Li C and Zhou M (2016) Genome-Wide Association Study Reveals a New QTL for Salinity Tolerance in Barley (Hordeum vulgare L.). Front. Plant Sci. 7:946. doi: 10.3389/fpls.2016.00946
Received: 09 April 2016; Accepted: 14 June 2016;
Published: 28 June 2016.
Edited by:
Guo-Liang Jiang, Virginia State University, USAReviewed by:
Xiaoquan Qi, Chinese Academy of Sciences, ChinaZhilong Bao, University of Florida, USA
Copyright © 2016 Fan, Zhou, Shabala, Chen, Cai, Li and Zhou. This is an open-access article distributed under the terms of the Creative Commons Attribution License (CC BY). The use, distribution or reproduction in other forums is permitted, provided the original author(s) or licensor are credited and that the original publication in this journal is cited, in accordance with accepted academic practice. No use, distribution or reproduction is permitted which does not comply with these terms.
*Correspondence: Meixue Zhou, meixue.zhou@utas.edu.au; Chengdao Li, c.li@murdoch.edu.au