 Shangguo Feng1
 Mengying Jiang1Yujun Shi2Kaili Jiao1
 Chenjia Shen1Jiangjie Lu1Qicai Ying1
 Huizhong Wang1*
- 1Zhejiang Provincial Key Laboratory for Genetic Improvement and Quality Control of Medicinal Plants, College of Life and Environmental Sciences, Hangzhou Normal University, Hangzhou, China
- 2School of Foreign Languages, Zhejiang Gongshang University, Hangzhou, China
Recently, commercial interest in Physalis species has grown worldwide due to their high nutritional value, edible fruit, and potential medicinal properties. However, many Physalis species have similar shapes and are easily confused, and consequently the phylogenetic relationships between Physalis species are poorly understood. This hinders their safe utilization and genetic resource conservation. In this study, the nuclear ribosomal ITS2 region was used to identify species and phylogenetically examine Physalis. Eighty-six ITS2 regions from 45 Physalis species were analyzed. The ITS2 sequences were aligned using Clustal W and genetic distances were calculated using MEGA V6.0. The results showed that ITS2 regions have significant intra- and inter-specific divergences, obvious barcoding gaps, and higher species discrimination rates (82.2% for both the BLASTA1 and nearest distance methods). In addition, the secondary structure of ITS2 provided another way to differentiate species. Cluster analysis based on ITS2 regions largely concurred with the relationships among Physalis species established by many previous molecular analyses, and showed that most sections of Physalis appear to be polyphyletic. Our results demonstrated that ITS2 can be used as an efficient and powerful marker in the identification and phylogenetic study of Physalis species. The technique provides a scientific basis for the conservation of Physalis plants and for utilization of resources.
Introduction
Physalis L., one of the most important genera in the family Solanaceae, contains 75–120 species, which are mainly distributed in tropical, and temperate regions of America, although there are a few species in Eurasia and Southeast Asia (Chinese academy of sciences, 1978; Martinez, 1998; Maggie, 2005; Wei et al., 2012; Zamora-Tavares et al., 2015). There are five Physalis species and two varieties in China and they are mostly found in the east, central, south, and southwest regions of China (Chinese academy of sciences, 1978). They are rich in vitamins, minerals, and antioxidants, and have potential medicinal properties, including anti-bacteria, anti-inflammatory, and anti-cancer actions (Ji et al., 2012; Wei et al., 2012; Hong et al., 2015). Many Physalis species are horticulturally and economically important, and commercial interest has increased in many regions of the world over recent decades (Wu et al., 2006; Wei et al., 2012; Ding et al., 2014). Some Physalis species, including Physalis alkekengi, Physalis pubescens, Physalis peruviana, and Physalis philadelphica have been extensively cultivated for their edible fruit, medicinal properties, or as ornamental plants in many regions of the world, such as China and Mexico (Wei et al., 2012; Zamora-Tavares et al., 2015). Currently, however, most natural Physalis species are rare due to habitat destruction and increased urbanization.
The accurate identification of Physalis species is extremely important in Physalis plant breeding programs and for the conservation of genetic resources. Traditionally, identification of Physalis species has been dependent on morphological characteristics (Menzel, 1951; Axelius, 1996; Martinez, 1998; Vargas et al., 2001). Phenotypic characteristics, however, are often affected by plant variability and growth habitats (Maggie, 2005; Vargas-Ponce et al., 2011; Wei et al., 2012). In addition, plants of the genus Physalis have a similar shape and their morphological characteristics are easily confused (Figure 1). Molecular markers are independent of environmental conditions and have now emerged as important tools for modern taxonomists (Feng et al., 2014). Some DNA marker systems, including simple sequence repeat (SSR), and inter-simple sequence repeats (ISSR), have been used to genetically study Physalis plants (Vargas-Ponce et al., 2011; Wei et al., 2012; Zamora-Tavares et al., 2015). In addition, the DNA sequences of a few genes, including the internal transcribed spacer (ITS) of the nrDNA, the Waxy gene, and chloroplast regions (ndhF and trnLF), have also been used to assess the phylogeny of Physalis and their relationship to other genera in the Solanaceae family (Maggie, 2005; Olmstead et al., 2008).
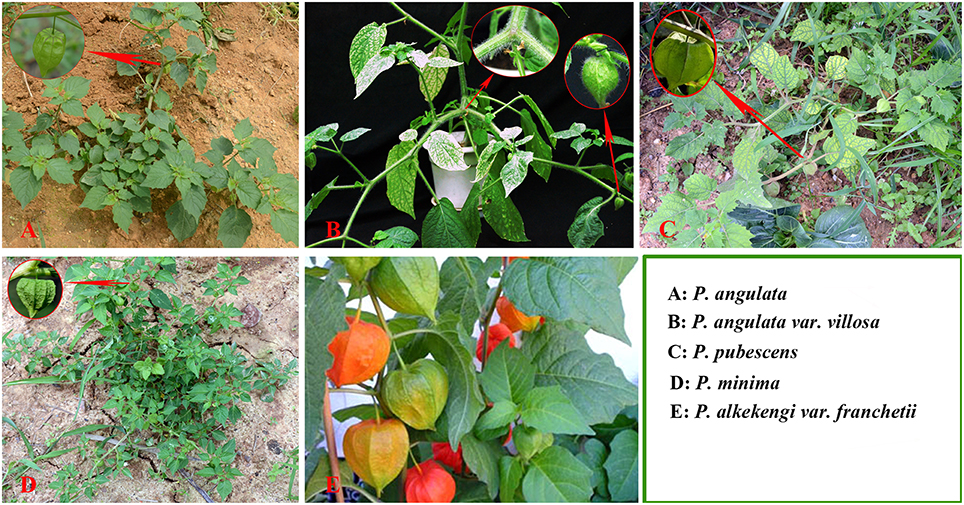
Figure 1. Plant morphology of Physalis species (A, P. angulate; B, P. angulata var. villosa; C, P. pubescens; D, P. minima; E, P. alkekengi var. franchetii) in their natural habitats.
DNA barcoding is a relatively new taxonomic method that uses short DNA sequences of standard genome regions to make fast, efficient, and reliable species identifications (Hebert et al., 2004; Chen et al., 2010; Gao et al., 2010a; Hajiahmadi et al., 2013; Feng et al., 2015). As an efficient tool for species identification, DNA barcoding has become important in biological systematics, and identification (Chen et al., 2010; Gao et al., 2010a; Liu et al., 2012; Dong et al., 2015; Feng et al., 2015; Wang et al., 2015). Recently, several regions, including matK, rbcL, psbA–trnH, atpF–atpH, ycf 1, and ITS, have been advocated as potential standard DNA barcodes for different taxonomic groups in plants (Chase et al., 2005; Kress et al., 2005; Kress and Erickson, 2007; Lahaye et al., 2008a; Cbol Plant Working Group, 2009; Yao et al., 2009; Parveen et al., 2012; Dong et al., 2015; Larranaga and Hormaza, 2015). ITS2, a sub-region of the nuclear ribosomal ITS, has also been proposed as a novel universal DNA barcode to identify herbs based on 6600 samples of 4800 species (Chen et al., 2010). Compared with whole ITS region, ITS2 was more suitable for species identification because of its short length, and high efficiency for PCR amplification (Chen et al., 2010; Gao et al., 2010a; Han et al., 2013). In addition, the secondary structures of ITS2 sequences could be used as molecular morphological characteristics for species identification (Grajales et al., 2007; Yao et al., 2010). It has been proposed that the ITS2 sub-region should be the standard molecular marker for species authentication and for plant phylogenetic analysis (Schultz and Wolf, 2009; Chen et al., 2010; Gao et al., 2010a,b; Yao et al., 2010; Pang et al., 2011; Liu et al., 2012; Gu et al., 2013; Marghali et al., 2015; Zhao et al., 2015).
In this study, we used ITS2 region to barcode Physalis and then applied it as a phylogenetic marker to infer the genetic relationships among Physalis species.
Materials and Methods
Plant Materials
In total, 86 samples of 45 species from the genus Physalis were collected in this study (Table 1). Thirty-one specimens of five species sampled from the main distribution areas in China were used for sequencing (Table 1). Other published Physalis ITS2 sequences were downloaded from GenBank (Clark et al., 2016). The species were verified and confirmed using the specimens stored in the herbarium at the Institute of Botany, Chinese Academy of Sciences, Beijing, China (http://www.nhpe.org). All corresponding voucher samples were deposited in the Zhejiang Provincial Key Laboratory for Genetic Improvement and Quality Control of Medicinal Plants, Hangzhou Normal University.
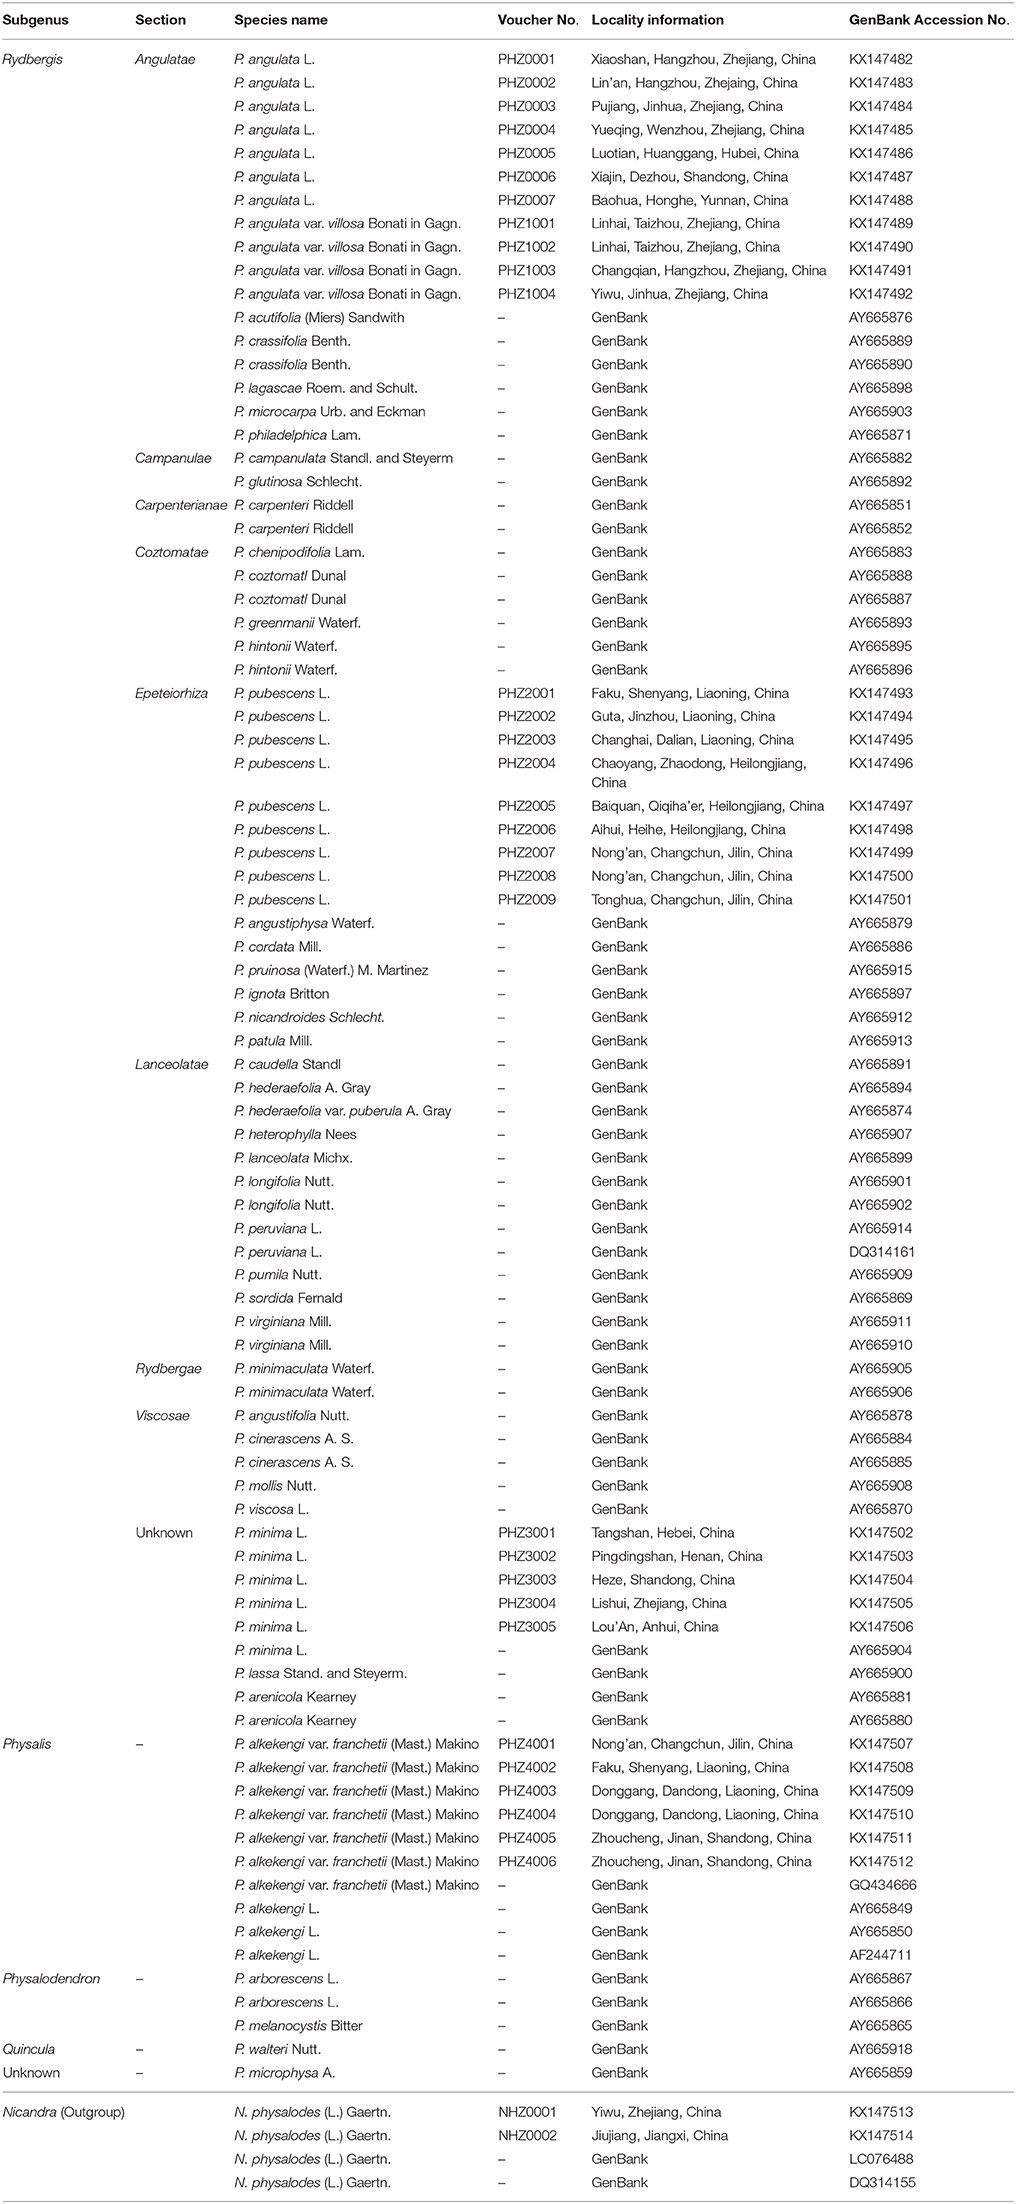
Table 1. Voucher information and GenBank accession numbers for Physalis plant samples and Nicandra physaloides (Outgroup) in this study.
DNA Extraction, Amplification, and Sequencing
Fresh, young leaf samples from Physalis were randomly collected for genomic DNA isolation, as described previously (Feng et al., 2013). The ITS2 sequences were amplified using the following pair of universal primers used in previous studies (Yao et al., 2010; Feng et al., 2015): ITS-2F, 5′- ATGCGATACTTGGTGTGAAT-3′ and ITS-3R, 5′-GACGCTTCTCCAGACTACAAT-3′. The primer pair was synthesized by Shanghai Sangon Biological Engineering Technology and Service Co. Ltd. (Shanghai, China). The PCR was conducted in 25 μL volumes containing 1 × PCR Buffer [100 mM Tris–HCl, 100 mM (NH4)2SO4, 100 mM KCl, 1% TritonX-100, pH 8.8], 2.5 mM Mg2+, 0.5 μM of each primer, 0.4 mM dNTPs, 1 U Taq DNA polymerase (TaKaRa Bio., Kyoto, Japan), and 50 ng genomic DNA template. The amplification was performed in a Mastercycler nexus gradient (Eppendorf AG, Hamburg, Germany) with the following PCR program: 94°C for 5 min, followed by 35 cycles of 94°C for 45 s, 56°C for 45 s, 72°C for 1.5 min, and a final extension at 72°C for 10 min. The PCR products were sequenced by Shanghai Sunny Biotechnology Co. Ltd. (Shanghai, China).
Data Analysis
The original sequences were edited and assembled manually using CodonCode Aligner V3.0 (CodonCode Co., USA). All the raw sequences were annotated and trimmed using ITS2 annotation tools based on the Hidden Markov Model (HMM) (Keller et al., 2009) to remove the conserved 5.8S and 28S DNA sequences (Koetschan et al., 2012). The trimmed sequences were edited manually. Sequences that were less than 100 bp length, or sequences that had possibly been contaminated by fungi or other unnamed species (such as those with aff. in the species name) were discarded (Nilsson et al., 2012). The selected ITS2 sequences were aligned using Clustal W (Thompson et al., 2002), and then the genetic distances were calculated using MEGA 6.0 based on the Kimura 2-Parameter (K2P) model (Tamura et al., 2013). The average inter-specific distance, the minimum inter-specific distance, and average theta prime (theta prime is the mean genetic variation between different species, thus eliminating biases associated with different numbers of samples among species) were calculated to evaluate the inter-specific divergences using the K2P model (Meyer and Paulay, 2005; Meier et al., 2008; Chen et al., 2010; Gao et al., 2010a). The average intra-specific distance, coalescent depth, and theta were used to represent the intra-specific variation based on the K2P model (Meyer and Paulay, 2005; Chen et al., 2010; Gao et al., 2010a). DNA barcoding gaps were used to compare the distributions of intra- vs. inter-specific variability (Meyer and Paulay, 2005; Chen et al., 2010; Gao et al., 2010a) and Wilcoxon two-sample tests were performed as indicated previously (Kress and Erickson, 2007; Lahaye et al., 2008b; Chen et al., 2010). BLASTA1 and the nearest distance method were used to evaluate the species authentication efficacy (Gao et al., 2010a; Feng et al., 2015). In BLASTA1 method, all ITS2 regions of Physalis species were used as query sequences, and BLAST program (http://blast.ncbi.nlm.nih.gov/Blast.cgi) was used for searching the reference database for each query sequence. Correct identification means that the best BLAST hit of the query sequence is from the expected species; ambiguous identification means that the best BLAST hits for a query sequence are those of several species including the expected species; and incorrect identification means that the best BLAST hit is not from the expected species (Gao et al., 2010a). In the nearest distance method, correct identification means that the hit based on the smallest genetic distances is from the same species as that of the query; ambiguous identification means that several hits have the same smallest genetic distance to the query sequence; and incorrect identification means that the hit is not from the expected species (Gao et al., 2010a). The secondary structure of Physalis ITS2 sequences was predicted using tools from the ITS2 database website (http://its2.bioapps.biozentrum.uni-wuerzburg.de/) (Koetschan et al., 2012). TaxonGAP 2.4.1 software was used to calculate the discriminatory power of ITS2 sequences for sister species (Slabbinck et al., 2008).
A phylogenetic analysis of the collected Physalis species was performed using the maximum likelihood (ML) method in MEGA 6.0 (Tamura et al., 2013). Bootstrap support (BS) values for individual clades were computed by running 1000 bootstrap replicates of the data. Four samples of Nicandra physaloides (Table 1), a species closely related to Physalis species in Solanaceae, were used as outgroup.
Results
Amplification, Sequencing, and Characteristics of ITS2 Regions
The amplification and sequence success rate of the ITS2 sequences for the collected Physalis samples was 100%. The lengths of the ITS2 sequences used in the analyses ranged from 210 to 218 bp, with an average of 214 bp (Supplementary Figure 1). The GenBank accession numbers are listed in Table 1. The mean GC content was 72.4% and varied from 68.3 to 75.0% (Supplementary Figure 1). Thus, the length and GC content of the ITS2 sequences for the collected Physalis species were relatively variable.
Genetic Divergence within and between Species
The genetic divergences of all the Physalis species samples were estimated using MEGA 6.0. Table 2 shows the calculated results for six metrics (average inter-specific distance, the minimum inter-specific distance, theta prime, average intra-specific distance, coalescent depth, and theta). A relatively lower divergence was observed for three metrics at the intra-specific level (Table 2).
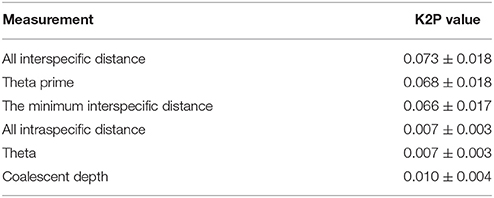
Table 2. Analyses of inter-specific divergence and intra-specific variation of the ITS2 sequences in 86 samples of 45 Physalis species.
Assessment of the Barcoding Gap
Based on the K2P model of intra- vs. inter-specific divergence, the distributions of genetic distance in the Physalis species samples were investigated at a scale of 0.005 distance units (Figure 2). The inter-specific distance ranged between 0.000 and 0.161, and equaled zero for only 1.44% of the samples. The proportion where the inter-specific genetic distance >0.035 was 85%, which will provide a useful way to authenticate different Physalis species. The Wilcoxon two-sample tests also indicated that there were significant differences between the inter- and intra-specific divergences (Supplementary Table 1, P < 0.001).
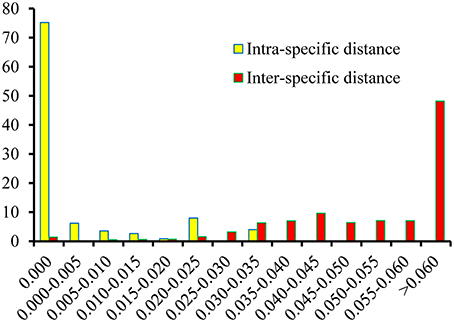
Figure 2. Relative distribution of inter-specific divergence between congeneric Physalis species and intra-specific variation in the ITS2 region using K2P genetic distance.
The Efficacy of ITS2 for Authentication
The results showed that ITS2 possessed 82.2% identification success rates at the species level for both BLASTA1 and the nearest distance methods (Table 3). Overall, the results showed that the ITS2 region has higher identification efficiency.
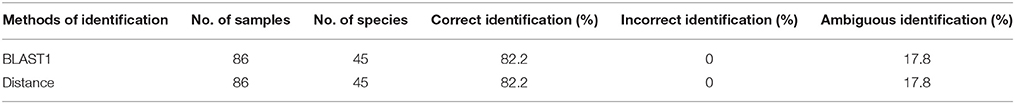
Table 3. Comparison of authentication efficiency for ITS2 using different methods.
The Discriminatory Power of ITS2 Sequences for Sister Species
TaxonGap 2.4.1 software was used to evaluate the discriminatory power of ITS2 sequences between the collected samples (Figure 3). Over 76% of the sequences collected in this study had an inter-specific diversity that was larger than the intra-specific diversity, which indicated that the ITS2 sequences had relatively clear species boundaries. However, there were exceptions: 17.8% of the species had identical sequences with their sister-species for P. angulate vs. P. angulata var. villosa, P. greenmanii vs. P. hintonii, P. pubescens vs. P. pruinosa, and P. alkekengi vs. P. alkekengi var. franchetii (dark gray bar, Figure 3).
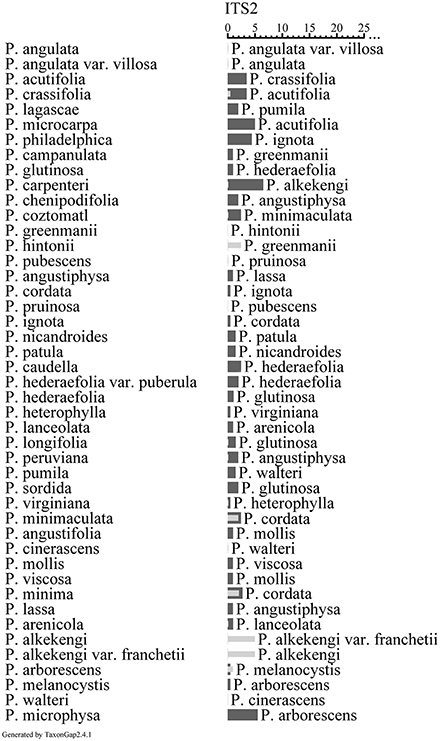
Figure 3. The heterogeneity and separability for individual taxa of ITS2 based on 45 Physalis species by TaxonGap. The left side shows the complete list of Physalis species used in this study. The right side depicts the within species heterogeneity (presented as light gray horizontal bar) and between-species separability (presented as dark gray horizontal bar) values with different OTUs as matrix rows for ITS2. The names of the closest relatives (the taxon with the smallest separability) are listed at the right side of the dark gray bar.
Secondary Structures of ITS2 Regions
Besides the divergence of primary sequences of ITS2, we also focused on the use of the secondary structures of ITS2 for species identification. The secondary structures of ITS2 for collected Physalis species were predicted and shown in Supplementary Figure 2. All of the secondary structures of ITS2 in these species have four similar helices: Helix I, II, III, and IV (Supplementary Figure 2). However, the secondary structures of ITS2 among most Physalis species were variable on four helices in term loop number, size, position, and degree of angles from the center of the spiral arm. For example, the secondary structure of P. greenmanii was different from that of its sister-specie P. hintonii (Supplementary Figure 2). Similar satisfactory result was also obtained for P. alkekengi and P. alkekengi var. franchetii. Thus, the secondary structure of ITS2 provided another method for Physalis species identification. However, identical secondary structures were found in P. angulate vs. P. angulata var. villosa, and P. pubescens vs. P. pruinosa (Supplementary Figure 2).
Phylogenetic Analysis
According to the Physalis species morphological classification reported in previous studies (Axelius, 1996; Maggie, 2005), all the Physalis species collected in this study belonged to four subgenera (Rydbergis, Physalis, Physalodendron, and Quincula), in addition to one species without grouping (we grouped it in subgenus Unknown in this study). In subgenus Rydbergis, most species were grouped into eight sections (sect.): Angulatae, Campanulae, Carpenterianae, Coztomatae, Epeteiorhiza, Lanceolatae, Rydbergae, and Viscosae. In addition, three species: P. minima, P. lassa, and P. arenicola, did not have a grouping based on morphology in subgenus Rydbergis (we grouped these species in section Unknown in this study). In this study, a dendrogram constructed by the ML method based on ITS2 sequences grouped all the Physalis species into four main clusters (Figure 4).
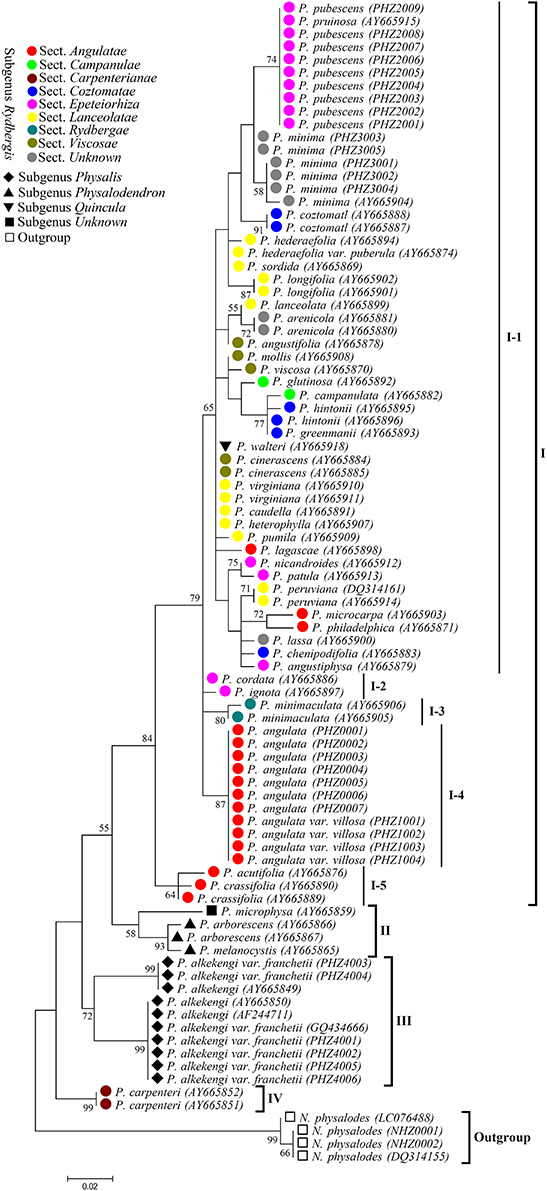
Figure 4. Maximum likelihood (ML) tree based on ITS2 sequences for Physalis species. Numbers above branches indicate bootstrap support (BS ≥ 50) values.
Group I was the most complex, with 38 species, and was further divided into five subgroups. In addition to the species from sect. Carpenterianae, all species from the other eight sections of subgenus Rydbergis were included in Group I. P. walteri, a species from subgenus Quincula was also grouped into Group I. Subgroup I-1 contained 31 species: five from sect. Epeteiorhiza, four from sect. Coztomatae, ten from sect. Lanceolatae, four from sect. Viscosae, three form sect. Angulatae, two from sect. Campanulae, three from sect. unknown of subgenus Rydbergis, and the species from subgenus Quincula. Subgroup I-2 included two species (P. cordata and P. ignota) from sect. Epeteiorhiza. Subgroup I-3 contained the species (P. minimaculata) from subgenus Rydbergae. Subgroup I-4 contained two species (P. angulate and P. angulate var. villosa) form sect. Angulatae. P. acutifolia and P. crassifolia from sect. Angulatae were grouped into Subgroup I-5.
Group II contained three species, including all species (P. arborescens and P. melanocystis) from subgenus Physalodendron and the species P. microphysa from subgenus Unknown. P. alkekengi and P. alkekengi var. franchetii from subgenus. Physalis constituted a separate group III. P. carpenteri from sect. Carpenterianae of subgenus. Rydbergis was distant from any other Physalis species, and was assigned into group IV.
Discussion
Physalis species are important medicinal and edible plants that have a significant, economic value. DNA barcoding, using the ribosomal DNA ITS2 region as a tag to identify species, has recently attracted much attention (Chen et al., 2010). Compared with other candidate DNA barcodes, such as psbA-trnH, matK, rbcL, and ITS, ITS2 possesses many advantages, including good universality, small intraspecific variation, but high interspecific divergence, and a small fragment length (~200 bp; Chen et al., 2010; Yao et al., 2010). To our knowledge, this is the first time that the ITS2 regions have been used to identify Physalis species in such a large sample size, an endeavor which has expanded the application of the ITS2 region to the medicinal plant field.
As in some previous studies (Gao et al., 2010a; Liu et al., 2012; Feng et al., 2015), sufficient variation was found in the ITS2 region among Physalis species to allow determination of genetic divergence, and the ITS2 region also demonstrated a higher successful discrimination capability (compared to 82.2% identification success rates for both BLASTA1 and the nearest genetic distance methods). For example, P. angulata and P. minima have extremely similar morphological traits, rendering their differentiation very difficult and sometimes impossible (Figure 1), but they could be accurately discriminated based on their ITS2 regions. In addition, because of sufficient variation in the ITS2 secondary structures, some studies suggested that the secondary structure of ITS2 might be considered as a molecular morphological characteristic (Yao et al., 2010). In this study, we found that the secondary structures of ITS2 perform well in identifying Physalis species (Supplementary Figure 2). For example, some species (P. greenmanii vs. P. hintonii, and P. alkekengi vs. P. alkekengi var. franchetii) from the ambiguous identification cases by the BLAST 1 or nearest distance method could be identified by their ITS2 secondary structures (Supplementary Figure 2).
The ITS2 region cannot solve all the species identification problems in Physalis. For example, P. pubescens vs. P. pruinosa, P. angulate vs. P. angulata var. villosa were found to have identical ITS2 sequences and the same secondary structures,. Therefore, it might be worthwhile using other DNA barcodes as complementary factors for discriminating these species. Certainly, it should be noted that the taxonomic assignment of sequences from GenBank might not be accurate due to the similar morphological characteristics of some Physalis species (for example: P. pubescens and P. pruinosa). Hence, if these factors were taken into account, estimations of in-species discrimination might be lower for Physalis.
Some studies have suggested that although DNA barcoding aims to provide an efficient method for species-level identification, it may also contribute to taxonomic and biodiversity research (Hajibabaei et al., 2007; Wang et al., 2010; Wong et al., 2011; Feng et al., 2015). The ITS2 region could provide taxonomic signatures in systematic evolution (Coleman, 2003; Schultz et al., 2005; Liu et al., 2012; Feng et al., 2015). In our study, ITS2 could be used to barcode Physalis and to serve as a phylogenetic marker for Physalis taxonomy. As in previous studies (Mione et al., 1994; Olmstead et al., 1999; Maggie, 2005), the dendrogram constructed with ITS2 data using the ML method indicated that the genus Physalis was paraphyletic. Maggie (2005) showed that subgenus Rydbergis was morphologically homogeneous and we obtained similar results that showed that most collected species of subgenus Rydbergis (except P. carpenteri from sect. Carpenterianae) were grouped into group I. The species in subgenera Physalodendron, and Physalis were all morphologically atypical, either having multiple flowers per node, corollas which are lobed or odd colors, or unusual fruiting calyx morphology (Martinez, 1999; Maggie, 2005). In our study, these species were distant from the species in subgenus Rydbergis, and were grouped into groups II and III, respectively (Figure 4). P. walteri from subgenus Quincula was included within group I (I-1) together with species from sect. Viscosae (subgenus Rydbergis). In fact, P. walteri was strongly supported as sister species to P. viscosa and P. angustifolia (Waterfall, 1967; Maggie, 2005). In addition, we found that P. microphysa from subgenus Unknown, was an unplaced species in a previous study (Maggie, 2005). However, we were able to group it into group II together with species in subgenus Physalodendron with weak support (BS = 58). Thus, it appears that more sampling and more up-to-date phylogenetic methods are required to understand the taxonomy of P. microphysa.
Although most of the species in subgenus Rydbergis were grouped together within group I, some sections of subgenus Rydbergis were probably polyphyletic, such as Epeteiorhiza (I–1, I–2), and Angulatae (I–1, I–4, I–5) (Figure 4). In addition, the species form sect. Lanceolatae were Clustered together with the species from other sections (such as Viscosae, Angulatae, and Epeteiorhiza). Similar results have been reported by Maggie (2005). As for sect. Carpenterianae, P. carpenteri along with other species from other sections of subgenus Rydbergis, formed group IV with strong support (BS = 99) as previously reported (Maggie, 2005). Our results largely concurred with the view of the previous study that P. carpenteri, P. alkekengi, P. microphysa, and subgenus Physalodendron should be recognized as four small genera (Maggie, 2005).
Some studies have concluded that DNA barcoding sequences do not usually have sufficient phylogenetic signals to resolve evolutionary relationships (Hajibabaei et al., 2006). In addition, multiple copies of ITS2 may suggest that the sequences obtained through PCR are not stable and representative and this might result in misleading phylogenetic inferences (Queiroz Cde et al., 2011). However, after comparison with previous studies, our results have demonstrated that ITS2 is a useful DNA barcode that could be used to identify Physalis species, and build relatively reliable molecular phylogenies for the genus Physalis.
Author Contributions
Conceived and designed the study: SF, HW. Collected plant samples: SF, HW, YS, JL, and QY. Performed the experiments: SF, MJ, KJ, and CS. Analyzed the data: SF, MJ, KJ. Wrote the manuscript: SF, HW.
Funding
This study was supported in part by the National Natural Science Foundation of China (31470407), the Zhejiang Provincial Public Welfare Technology Applied Research Foundation of China (2014C32090), the Hangzhou Scientific and Technological Program (20150932H04), and the Hangzhou Scientific and Technological Program (20150932H03).
Conflict of Interest Statement
The authors declare that the research was conducted in the absence of any commercial or financial relationships that could be construed as a potential conflict of interest.
Supplementary Material
The Supplementary Material for this article can be found online at: http://journal.frontiersin.org/article/10.3389/fpls.2016.01047
Supplementary Figure 1. Distribution of sequence lengths and GC content of the ITS2 sequences from all Physalis species.
Supplementary Figure 2. The secondary structure of ITS2 in different Physalis species. (1) P. angulata (PHZ0001), (2) P. angulata var. villosa (PHZ1001), (3) P. acutifolia (AY665876), (4) P. crassifolia (AY665890), (5) P. lagascae (AY665898), (6) P. microcarpa (AY665903), (7) P. philadelphica (AY665871), (8) P. campanulata (AY665882), (9) P. glutinosa (AY665892), (10) P. carpenteri (AY665852), (11) P. chenipodifolia (AY665883), (12) P. coztomatl (AY665888), (13) P. greenmanii (AY665893), (14) P. hintonii (AY665895), (15) P. pubescens (PHZ2001), (16) P. angustiphysa (AY665879), (17) P. cordata (AY665886), (18) P. pruinosa (AY665915), (19) P. ignota (AY665897), (20) P. nicandroides (AY665912), (21) P. patula (AY665913), (22) P. caudella (AY665891), (23) P. hederaefolia (AY665894), (24) P. hederaefolia var. puberula (AY665874), (25) P. heterophylla (AY665907), (26) P. lanceolata (AY665899), (27) P. longifolia (AY665901), (28) P. peruviana (AY665914), (29) P. pumila (AY665909), (30) P. sordida (AY665869), (31) P. virginiana (AY665910), (32) P. minimaculata (AY665905), (33) P. angustifolia (AY665878), (34) P. cinerascens (AY665884), (35) P. mollis (AY665908), (36) P. viscosa (AY665870), (37) P. minima (AY665904), (38) P. lassa (AY665900), (39) P. arenicola (AY665880), (40) P. alkekengi (AY665849), (41) P. alkekengi var. franchetii (PHZ4001), (42) P. arborescens (AY665866), (43) P. melanocystis (AY665865), (44) P. walteri (AY665918), (45) P. microphysa (AY665859).
Supplementary Table 1. Wilcoxon two-sample tests for distribution of intra- vs. inter-specific divergences.
References
Axelius, B. (1996). The phylogenetic relationships of the physaloid genera (Solanaceae) based on morphological data. Am. J. Bot. 83, 118–124. doi: 10.2307/2445964
Cbol Plant Working Group (2009). A DNA barcode for land plants. Proc. Natl. Acad. Sci. U.S.A. 106, 12794–12797. doi: 10.1073/pnas.0905845106
Chase, M. W., Salamin, N., Wilkinson, M., Dunwell, J. M., Kesanakurthi, R. P., Haidar, N., et al. (2005). Land plants and DNA barcodes: short-term and long-term goals. Philos. Trans. R. Soc. Lond. B Biol. Sci. 360, 1889–1895. doi: 10.1098/rstb.2005.1720
Chen, S., Yao, H., Han, J., Liu, C., Song, J., Shi, L., et al. (2010). Validation of the ITS2 region as a novel DNA barcode for identifying medicinal plant species. PLoS ONE 5:e8613. doi: 10.1371/journal.pone.0008613
Clark, K., Karsch-Mizrachi, I., Lipman, D. J., Ostell, J., and Sayers, E. W. (2016). GenBank. Nucleic Acids Res. 44, D67–D72. doi: 10.1093/nar/gkv1276
Coleman, A. W. (2003). ITS2 is a double-edged tool for eukaryote evolutionary comparisons. Trends Genet. 19, 370–375. doi: 10.1016/S0168-9525(03)00118-5
Ding, H., Hu, Z., Yu, L., Ma, Z., Ma, X., Chen, Z., et al. (2014). Induction of quinone reductase (QR) by withanolides isolated from Physalis angulata L. var. villosa Bonati (Solanaceae). Steroids 86, 32–38. doi: 10.1016/j.steroids.2014.04.015
Dong, W., Xu, C., Li, C., Sun, J., Zuo, Y., Shi, S., et al. (2015). ycf1, the most promising plastid DNA barcode of land plants. Sci. Rep. 5:8348. doi: 10.1038/srep08348
Feng, S.-G., Lu, J.-J., Gao, L., Liu, J.-J., and Wang, H.-Z. (2014). Molecular phylogeny analysis and species identification of dendrobium (Orchidaceae) in china. Biochem. Genet. 52, 127–136. doi: 10.1007/s10528-013-9633-6
Feng, S., Jiang, Y., Wang, S., Jiang, M., Chen, Z., Ying, Q., et al. (2015). Molecular identification of dendrobium species (Orchidaceae) based on the dna barcode its2 region and its application for phylogenetic study. Int. J. Mol. Sci. 16, 21975–21988. doi: 10.3390/ijms160921975
Feng, S., Zhao, H., Lu, J., Liu, J., Shen, B., and Wang, H. (2013). Preliminary genetic linkage maps of Chinese herb Dendrobium nobile and D. moniliforme. J. Genet. 92, 205–212. doi: 10.1007/s12041-013-0246-y
Gao, T., Yao, H., Song, J., Liu, C., Zhu, Y., Ma, X., et al. (2010a). Identification of medicinal plants in the family Fabaceae using a potential DNA barcode ITS2. J. Ethnopharmacol. 130, 116–121. doi: 10.1016/j.jep.2010.04.026
Gao, T., Yao, H., Song, J., Zhu, Y., Liu, C., and Chen, S. (2010b). Evaluating the feasibility of using candidate DNA barcodes in discriminating species of the large Asteraceae family. BMC Evol. Biol. 10:324. doi: 10.1186/1471-2148-10-324
Grajales, A., Aguilar, C., and Sanchez, J. A. (2007). Phylogenetic reconstruction using secondary structures of Internal Transcribed Spacer 2 (ITS2, rDNA): finding the molecular and morphological gap in Caribbean gorgonian corals. BMC Evol. Biol. 7:90. doi: 10.1186/1471-2148-7-90
Gu, W., Song, J., Cao, Y., Sun, Q., Yao, H., Wu, Q., et al. (2013). Application of the ITS2 Region for barcoding medicinal plants of Selaginellaceae in pteridophyta. PLoS ONE 8:e67818. doi: 10.1371/journal.pone.0067818
Hajiahmadi, Z., Talebi, M., and Sayed-Tabatabaei, B. E. (2013). Studying genetic variability of pomegranate (Punica granatum L.) based on Chloroplast DNA and barcode genes. Mol. Biotechnol. 55, 249–259. doi: 10.1007/s12033-013-9676-2
Hajibabaei, M., Singer, G. A., Hebert, P. D., and Hickey, D. A. (2007). DNA barcoding: how it complements taxonomy, molecular phylogenetics and population genetics. Trends. Genet. 23, 167–172. doi: 10.1016/j.tig.2007.02.001
Hajibabaei, M., Singer, G. A., and Hickey, D. A. (2006). Benchmarking DNA barcodes: an assessment using available primate sequences. Genome 49, 851–854. doi: 10.1139/G06-025
Han, J., Zhu, Y., Chen, X., Liao, B., Yao, H., Song, J., et al. (2013). The short ITS2 sequence serves as an efficient taxonomic sequence tag in comparison with the full-length, ITS. Biomed. Res. Int. 2013:741476. doi: 10.1155/2013/741476
Hebert, P. D. N., Penton, E. H., Burns, J. M., Janzen, D. H., and Hallwachs, W. (2004). Ten species in one: DNA barcoding reveals cryptic species in the neotropical skipper butterfly Astraptes fulgerator. Proc. Natl. Acad. Sci. U.S.A. 101, 14812–14817. doi: 10.1073/pnas.0406166101
Hong, J. M., Kwon, O. K., Shin, I. S., Song, H. H., Shin, N. R., Jeon, C. M., et al. (2015). Anti-inflammatory activities of Physalis alkekengi var. franchetii extract through the inhibition of MMP-9 and AP-1 activation. Immunobiology 220, 1–9. doi: 10.1016/j.imbio.2014.10.004
Ji, L., Yuan, Y. L., Luo, L. P., Chen, Z., Ma, X. Q., Ma, Z. J., et al. (2012). Physalins with anti-inflammatory activity are present in Physalis alkekengi var. franchetii and can function as Michael reaction acceptors. Steroids 77, 441–447. doi: 10.1016/j.steroids.2011.11.016
Keller, A., Schleicher, T., Schultz, J., Muller, T., Dandekar, T., and Wolf, M. (2009). 5.8S-28S rRNA interaction and HMM-based ITS2 annotation. Gene 430, 50–57. doi: 10.1016/j.gene.2008.10.012
Koetschan, C., Hackl, T., Muller, T., Wolf, M., Forster, F., and Schultz, J. (2012). ITS2 Database IV: interactive taxon sampling for internal transcribed spacer 2 based phylogenies. Mol. Phylogenet. Evol. 63, 585–588. doi: 10.1016/j.ympev.2012.01.026
Kress, W. J., and Erickson, D. L. (2007). A two-locus global DNA barcode for land plants: the coding rbcL gene complements the non-coding trnH-psbA spacer region. PLoS ONE 2:e508. doi: 10.1371/journal.pone.0000508
Kress, W. J., Wurdack, K. J., Zimmer, E. A., Weigt, L. A., and Janzen, D. H. (2005). Use of DNA barcodes to identify flowering plants. Proc. Natl. Acad. Sci. U.S.A. 102, 8369–8374. doi: 10.1073/pnas.0503123102
Lahaye, R., Savolainen, V., Duthoit, S., Maurin, O., and Van der Bank, M. (2008a). A test of psbK-psbI and atpF-atpH as potential plant DNA barcodes using the flora of the Kruger National Park as a model system (South Africa). Nat. Precedings 1, 1–21.
Lahaye, R., Van der Bank, M., Bogarin, D., Warner, J., Pupulin, F., Gigot, G., et al. (2008b). DNA barcoding the floras of biodiversity hotspots. Proc. Nat. Acad. Sci. U.S.A. 105, 2923–2928. doi: 10.1073/pnas.0709936105
Larranaga, N., and Hormaza, J. I. (2015). DNA barcoding of perennial fruit tree species of agronomic interest in the genus Annona (Annonaceae). Front. Plant Sci. 6:589. doi: 10.3389/fpls.2015.00589
Liu, Z., Zeng, X., Yang, D., Ren, G., Chu, G., Yuan, Z., et al. (2012). Identification of medicinal vines by ITS2 using complementary discrimination methods. J. Ethnopharmacol. 141, 242–249. doi: 10.1016/j.jep.2012.01.057
Maggie, W. P. S. M. (2005). Untangling physalis (Solanaceae) from the physaloids: a two-gene phylogeny of the physalinae. Syst. Bot. 30, 216–230. doi: 10.1600/0363644053661841
Marghali, S., Fadhlaoui, I., Gharbi, M., Zitouna, N., and Trifi-Farah, N. (2015). Utility of ITS2 sequence data of nuclear ribosomal DNA: molecular evolution and phylogenetic reconstruction of Lathyrus spp. Sci. Hortic. 194, 313–319. doi: 10.1016/j.scienta.2015.08.030
Martinez, M. (1998). Revision of Physalis section Epeteiorhiza (Solanaceae). Ann. Ins. Biol. Bot. 69, 71–117.
Martinez, M. (1999). “Infrageneric taxonomy of Physalis,” in Solanaceae IV: Advances in Biology and Utilization, eds M. Nee, D. E. Symon, R. N. Lester, and J. P. Jessop (Kew, VIC: Royal Botanic Gardens), 275–283.
Meier, R., Zhang, G., and Ali, F. (2008). The use of mean instead of smallest interspecific distances exaggerates the size of the “barcoding gap” and leads to misidentification. Syst. Biol. 57, 809–813. doi: 10.1080/10635150802406343
Menzel, M. Y. (1951). The cytotaxonomy and genetics of Physalis. Proc. Am. Philos. Soc. 95, 132–183.
Meyer, C. P., and Paulay, G. (2005). DNA barcoding: error rates based on comprehensive sampling. PLoS Biol. 3:e422. doi: 10.1371/journal.pbio.0030422
Mione, T., Olmstead, R. C., Jansen, R. K., and Anderson, G. J. (1994). Systematic implications of chloroplast DNA variation in Jaltomata and selected physaloid genera (Solanaceae). Am. J. Bot. 81, 912–918. doi: 10.2307/2445772
Nilsson, R. H., Tedersoo, L., Abarenkov, K., Ryberg, M., Kristiansson, E., Hartmann, M., et al. (2012). Five simple guidelines for establishing basic authenticity and reliability of newly generated fungal ITS sequences. MycoKeys 4, 37–63. doi: 10.3897/mycokeys.4.3606
Olmstead, R. G., Bohs, L., Migid, H. A., Santiago-Valentin, E., Garcia, V. F., and Collier, S. M. (2008). A molecular phylogeny of the Solanaceae. Taxon 57, 1159–1181. Available online at: http://www.jstor.org/stable/27756771
Olmstead, R. G., Sweere, J. A., Spangler, R. E., Bohs, L., and Palmer, J. D. (1999). Phylogeny and provisional classification of the Solanaceae based on chloroplast DNA. Solanaceae 1, 1–137.
Pang, X., Song, J., Zhu, Y., Xu, H., Huang, L., and Chen, S. (2011). Applying plant DNA barcodes for Rosaceae species identification. Cladistics 27, 165–170. doi: 10.1111/j.1096-0031.2010.00328.x
Parveen, I., Singh, H. K., Raghuvanshi, S., Pradhan, U. C., and Babbar, S. B. (2012). DNA barcoding of endangered Indian Paphiopedilum species. Mol. Ecol. Resour. 12, 82–90. doi: 10.1111/j.1755-0998.2011.03071.x
Queiroz Cde, S., Batista, F. R., and de Oliveira, L. O. (2011). Evolution of the 5.8S nrDNA gene and internal transcribed spacers in Carapichea ipecacuanha (Rubiaceae) within a phylogeographic context. Mol. Phylogenet. Evol. 59, 293–302. doi: 10.1016/j.ympev.2011.01.013
Schultz, J., Maisel, S., Gerlach, D., Muller, T., and Wolf, M. (2005). A common core of secondary structure of the internal transcribed spacer 2 (ITS2) throughout the Eukaryota. RNA 11, 361–364. doi: 10.1261/rna.7204505
Schultz, J., and Wolf, M. (2009). ITS2 sequence-structure analysis in phylogenetics: a how-to manual for molecular systematics. Mol. Phylogenet. Evol. 52, 520–523. doi: 10.1016/j.ympev.2009.01.008
Slabbinck, B., Dawyndt, P., Martens, M., De Vos, P., and De Baets, B. (2008). TaxonGap: a visualization tool for intra-and inter-species variation among individual biomarkers. Bioinformatics 24, 866–867. doi: 10.1093/bioinformatics/btn031
Tamura, K., Stecher, G., Peterson, D., Filipski, A., and Kumar, S. (2013). MEGA6: Molecular Evolutionary Genetics Analysis version 6.0. Mol. Biol. Evol. 30, 2725–2729. doi: 10.1093/molbev/mst197
Thompson, J. D., Gibson, T., and Higgins, D. G. (2002). Multiple sequence alignment using ClustalW and ClustalX. Curr. Protoc. Bioinformatics Chapter 2:Unit 2.3. doi: 10.1002/0471250953.bi0203s00
Vargas, O., Martínez, M., and Dávila, A., P. (2001). Two new species of Physalis (Solanaceae) endemic to Jalisco, Mexico. Brittonia 53, 505–510. doi: 10.1007/BF02809650
Vargas-Ponce, O., Perez-Alvarez, L. F., Zamora-Tavares, P., and Rodriguez, A. (2011). Assessing genetic diversity in mexican husk tomato species. Plant Mol. Biol. Rep. 29, 733–738. doi: 10.1007/s11105-010-0258-1
Wang, X. C., Liu, C., Huang, L., Bengtsson-Palme, J., Chen, H., Zhang, J. H., et al. (2015). ITS1: a DNA barcode better than ITS2 in eukaryotes? Mol. Ecol. Resour. 15, 573–586. doi: 10.1111/1755-0998.12325
Wang, Z., Guo, Y., Tan, W., Li, L., Tang, E., Liu, C., et al. (2010). DNA barcoding, phylogenetic relationships and speciation of snappers (genus Lutjanus). Sci. China Life Sci. 53, 1025–1030. doi: 10.1007/s11427-010-4034-0
Waterfall, U. T. (1967). A taxonomic study of the genus Physalis in NorthAmerica north of Mexico. Rhodora 60, 107–173.
Wei, J. L., Hu, X. R., Yang, J. J., and Yang, W. C. (2012). Identification of single-copy orthologous genes between physalis and Solanum lycopersicum and analysis of genetic diversity in physalis using molecular markers. PLoS ONE 7:e50164. doi: 10.1371/journal.pone.0050164
Wong, L. L., Peatman, E., Lu, J., Kucuktas, H., He, S., Zhou, C., et al. (2011). DNA barcoding of catfish: species authentication and phylogenetic assessment. PLoS ONE 6:e17812. doi: 10.1371/journal.pone.0017812
Wu, S. J., Tsai, J. Y., Chang, S. P., Lin, D. L., Wang, S. S., Huang, S. N., et al. (2006). Supercritical carbon dioxide extract exhibits enhanced antioxidant and anti-inflammatory activities of Physalis peruviana. J. Ethnopharmacol. 108, 407–413. doi: 10.1016/j.jep.2006.05.027
Yao, H., Song, J., Liu, C., Luo, K., Han, J., Li, Y., et al. (2010). Use of ITS2 region as the universal DNA barcode for plants and animals. PLoS ONE 5:e13102. doi: 10.1371/journal.pone.0013102
Yao, H., Song, J.-Y., Ma, X.-Y., Liu, C., Li, Y., Xu, H.-X., et al. (2009). Identification of Dendrobium species by a candidate DNA barcode sequence: the chloroplast psbA-trnH intergenic region. Planta Med. 75, 667–669. doi: 10.1055/s-0029-1185385
Zamora-Tavares, P., Vargas-Ponce, O., Sanchez-Martinez, J., and Cabrera-Toledo, D. (2015). Diversity and genetic structure of the husk tomato (Physalis philadelphica Lam.) in Western Mexico. Genet. Resour. Crop Evol. 62, 141–153. doi: 10.1007/s10722-014-0163-9
Keywords: Physalis, molecular identification, DNA barcoding, phylogenetic relationship, ITS2
Citation: Feng S, Jiang M, Shi Y, Jiao K, Shen C, Lu J, Ying Q and Wang H (2016) Application of the Ribosomal DNA ITS2 Region of Physalis (Solanaceae): DNA Barcoding and Phylogenetic Study. Front. Plant Sci. 7:1047. doi: 10.3389/fpls.2016.01047
Received: 13 May 2016; Accepted: 04 July 2016;
Published: 19 July 2016.
Edited by:
Alessio Mengoni, Università di Firenze, ItalyReviewed by:
Henrik R. Nilsson, University of Gothenburg, SwedenMarcial Escudero, University of Seville, Spain
Copyright © 2016 Feng, Jiang, Shi, Jiao, Shen, Lu, Ying and Wang. This is an open-access article distributed under the terms of the Creative Commons Attribution License (CC BY). The use, distribution or reproduction in other forums is permitted, provided the original author(s) or licensor are credited and that the original publication in this journal is cited, in accordance with accepted academic practice. No use, distribution or reproduction is permitted which does not comply with these terms.
*Correspondence: Huizhong Wang, whz62@163.com