 Yu-Bin Yan
 Norm C. Duke2
 Mei Sun
- 1School of Biological Sciences, The University of Hong Kong, Hong Kong, China
- 2The Centre for Tropical Water and Aquatic Ecosystem Research, James Cook University, Townsville, QLD, Australia
Rhizophora species are the most widely distributed mangrove trees in the Indo-West Pacific (IWP) region. Comparative studies of these species with shared life history traits can help identify evolutionary factors that have played most important roles in determining genetic diversity within and between populations in ocean-current dispersed mangrove tree species. We sampled 935 individuals from 54 natural populations for genotyping with 13 microsatellite markers to investigate the level of genetic variation, population structure, and gene flow on a broad geographic scale in Rhizophora apiculata, Rhizophora mucronata, and Rhizophora stylosa across the IWP region. In contrast to the pattern expected of long-lived woody plants with predominant wind-pollination, water-dispersed seeds and wide geographic range, genetic variation within populations was generally low in all the three species, especially in those peripheral populations from geographic range limits. Although the large water-buoyant propagules of Rhizophora have capacity for long distance dispersal, such events might be rare in reality, as reflected by the low level of gene flow and high genetic differentiation between most of population pairs within each species. Phylogeographic separation of Australian and Pacific island populations from SE Asian lineages previously revealed with DNA sequence data was still detectable in R. apiculata based on genetic distances, but this pattern of disjunction was not always evident in R. mucronata and R. stylosa, suggesting that fast-evolving molecular markers could be more suitable for detecting contemporary genetic structure but not deep evolutionary divergence caused by historical vicariance. Given that mangrove species generally have small effective population sizes, we conclude that genetic drift coupled with limited gene flow have played a dominant role in producing the current pattern of population genetic diversity in the IWP Rhizophora species, overshadowing the effects of their life history traits. Recent population fragmentation and disturbances arising from human activities could further endanger genetic diversity in mangrove trees.
Introduction
Mangroves consist of a diverse group of species of trees, shrubs, palms, vines, and ferns from 20 families (Tomlinson, 1986; Duke et al., 1998). These species can be found in 128 countries or territories, but occur most commonly in tropical and subtropical coastlines, covering an estimated total area of 152,000 square kilometers globally (Spalding et al., 2010; Duke, 2013, 2014). Mangrove forests are among the most productive ecosystems in the world with important ecological and economic values. A large number of marine and terrestrial animal species use mangroves as habitats. Various mangrove species have been used as charcoal, firewood, timber, tannins, food, or medicines by local people (FAO, 2007; UNEP, 2014). The market value of capture fisheries supported by mangroves was estimated to be 953 to 21,272 US dollars per hectare per year (Ronnback, 1999). Much of the vast biodiversity of the mangrove ecosystem depends on a few key tree species that shape the system, such as species of Rhizophora, the most representative genus in the mangrove family Rhizophoraceae with broad distribution in both Indo-West Pacific (IWP) and Atlantic-East Pacific (AEP) regions.
In the IWP region, only three species of Rhizophora—R. apiculata Blume, R. mucronata Lam., and R. stylosa Griff. occur naturally with wide and overlapping distributions (Duke et al., 2002). These species are primarily wind-pollinated as suggested by a large pollen/ovule ratio, short pollen presentation time and a brief functional life span of the flowers (Tomlinson et al., 1979; Nadia and Machado, 2014). Their large propagules can float in seawater for many months (Rabinowitz, 1978); hence they are perceived to have capacity for long distance dispersal by ocean currents. However, distributional and genetic discontinuities have been found at different geographic scales, both within and between IWP and AEP regions (Duke et al., 2002; Lo et al., 2014), suggesting that populations of Rhizophora could be highly structured due to various barriers to gene flow, such as land masses, directions of ocean currents, as well as historical vicariant events.
Although the ecological and economic values of mangroves have been increasingly appreciated, they are being destroyed at an alarming rate, 3–5 times greater than the average rates of deforestation (Duke et al., 2007; UNEP, 2014). Conservation and sustainable management of existing mangrove populations of core species are urgently needed now than ever. Genetic information is required to inform conservation practices (Frankham et al., 2002). For example, levels of genetic variation and patterns of population genetic structure are important factors influencing mangroves' long-term potential for survival, especially in the face of extensive human mediated disturbance. Analysis of inter-population gene flow and genetic distance within and between closely related taxa can be used to define species or evolutionarily significant units within species (Woodruff, 2001).
Spatial and temporal organizations of genetic variation among individuals both within and between populations are influenced by historical, demographical, ecological, and evolutionary factors as well as specific life history traits (Barrett and Shore, 1989; Hamrick and Godt, 1989, 1996; Nybom and Bartish, 2000; Rogstad and Pelikan, 2011). When the distribution of a species is not homogenous over a large geographic area, evolutionary forces, e.g., mutation, selection, and genetic drift, may act independently in each population, and genetic differentiation is subsequently developed among populations (Wakeley, 2000). Gene flow, on the other hand, is an opposing evolutionary force to genetic differentiation as it tends to homogenize genetic composition of populations and thus also plays an important role in shaping a species' genetic structure, as the extent of gene flow has a major influence on the pattern of genetic diversity both within and between populations (Slatkin, 1987; Excoffier et al., 2009; Ellstrand, 2014). Compared to terrestrial plant species, there are additional historical and environmental factors that contribute to distributional heterogeneity and genetic structuring of mangrove populations, where gene flow is primarily in the form of sea water-dispersed propagules. Physical barriers to gene flow among mangrove populations include land masses, distance and direction of water and wind currents (Dodd et al., 2002; Nettel and Dodd, 2007; Triest, 2008; Van der Stocken et al., 2015). Mangrove distribution and population dynamics might be heavily influenced by historical sea-level fluctuations brought about by past climate changes (Woodroffe and Grindrod, 1991; Ellison, 2008), which would further reduce the long-term effective population size, in addition to genetic consequences of local extinction and recolonization associated with founder effects and genetic drift (McCauley, 1991). Postglacial range expansions can also induce the structuring of newly colonized areas into distinct sectors of low genetic diversity (Excoffier et al., 2009).
Life history traits have been shown to be closely associated with the amount of total genetic diversity at the species level and its partitioning within and among populations both in allozyme- and RAPD-based studies (Hamrick and Godt, 1989, 1996; Nybom and Bartish, 2000). Comparative studies of species with shared life history traits can help identify the major evolutionary forces shaping the patterns of genetic diversity. Although genetic diversity in some of the IWP Rhizophora species have been studied previously (e.g., Inomata et al., 2009; Wilson, 2009; Islam et al., 2013; Yahya et al., 2013; Wee et al., 2014, 2015), all these studies were limited to either one or two of the species (but see Ng et al., 2015), mostly covering only a small area of the species' distributional range. Furthermore, different number or type of molecular markers was used in different studies, rendering it difficult for comparative analysis of population genetic parameters across species between studies. To determine the level and pattern of genetic diversity in IWP species of Rhizophora and to provide information about their evolutionary history, we need to include all the Rhizophora species in the same study using the same set of markers from their entire distributional range. Furthermore, previous field work showed that there were two distinct leaf morphs within R. apiculata, separated by Wallace's line of discontinuity (Duke et al., 2002). Whether or not such discontinuity can be detected at the molecular level in R. apiculata as well as in R. mucronata and R. stylosa requires further studies. Phylogeographic investigation based on ITS and chloroplast DNA sequences showed that there were indeed two evolutionary lineages within each IWP Rhizophora species, largely corresponding to geographic separations of populations of SE Asia from those of Australia and Pacific islands (Lo et al., 2014). It remains to be investigated, however, whether population genetic distances based on allele frequencies at microsatellite loci can reflect this geographic pattern of discontinuity.
In this study, we used the same set of 13 microsatellite markers to investigate population genetic parameters for all three Rhizophora species occurring in the IWP region. Our samples covered these species' broad distributional ranges, including both central and peripheral populations. Specifically, we address the following questions: What is the level of genetic diversity in IWP Rhizophora species? Is the pattern of population structure the same among these species? Do populations from the species' distributional margins possess less genetic diversity than those central populations? Is the morphological and phylogeographic discontinuity still detectable with microsatellites in R. apiculata as well as in R. mucronata and R. stylosa? We then discuss the effects of life history traits and major evolutionary processes that might have played dominant roles in shaping the pattern of genetic diversity, as well as the significance of historical sea level fluctuations and physical barriers to dispersal on the genetic structuring of mangrove populations. We further discuss the effect of natural hybridization and genetic relationships among the three overlapping species. Our study is highly relevant to conservation and sustainable management of Rhizophora mangroves, such as to help identify management units, set priority for conservation, and provide guidance for translocations in mangrove reforestation practice.
Materials and Methods
Plant Samples
To cover geographic distributions of the three Rhizophora species as wide as possible, we collected and genotyped a total 935 individuals from 54 populations across the whole IWP region (Table 1 and Figure 1). The present samples represent an expansion of those included in Lo et al. (2014), with much larger sample sizes at the population level for all three Rhizophora species. Fresh leaves were sampled from individual trees located at >10 m intervals to avoid non-random inclusion of closely related individuals within each wild population, dried with silica gel in sealed plastic bags, and preserved in an electronic auto-dry cabinet (Weifo, Taiwan).
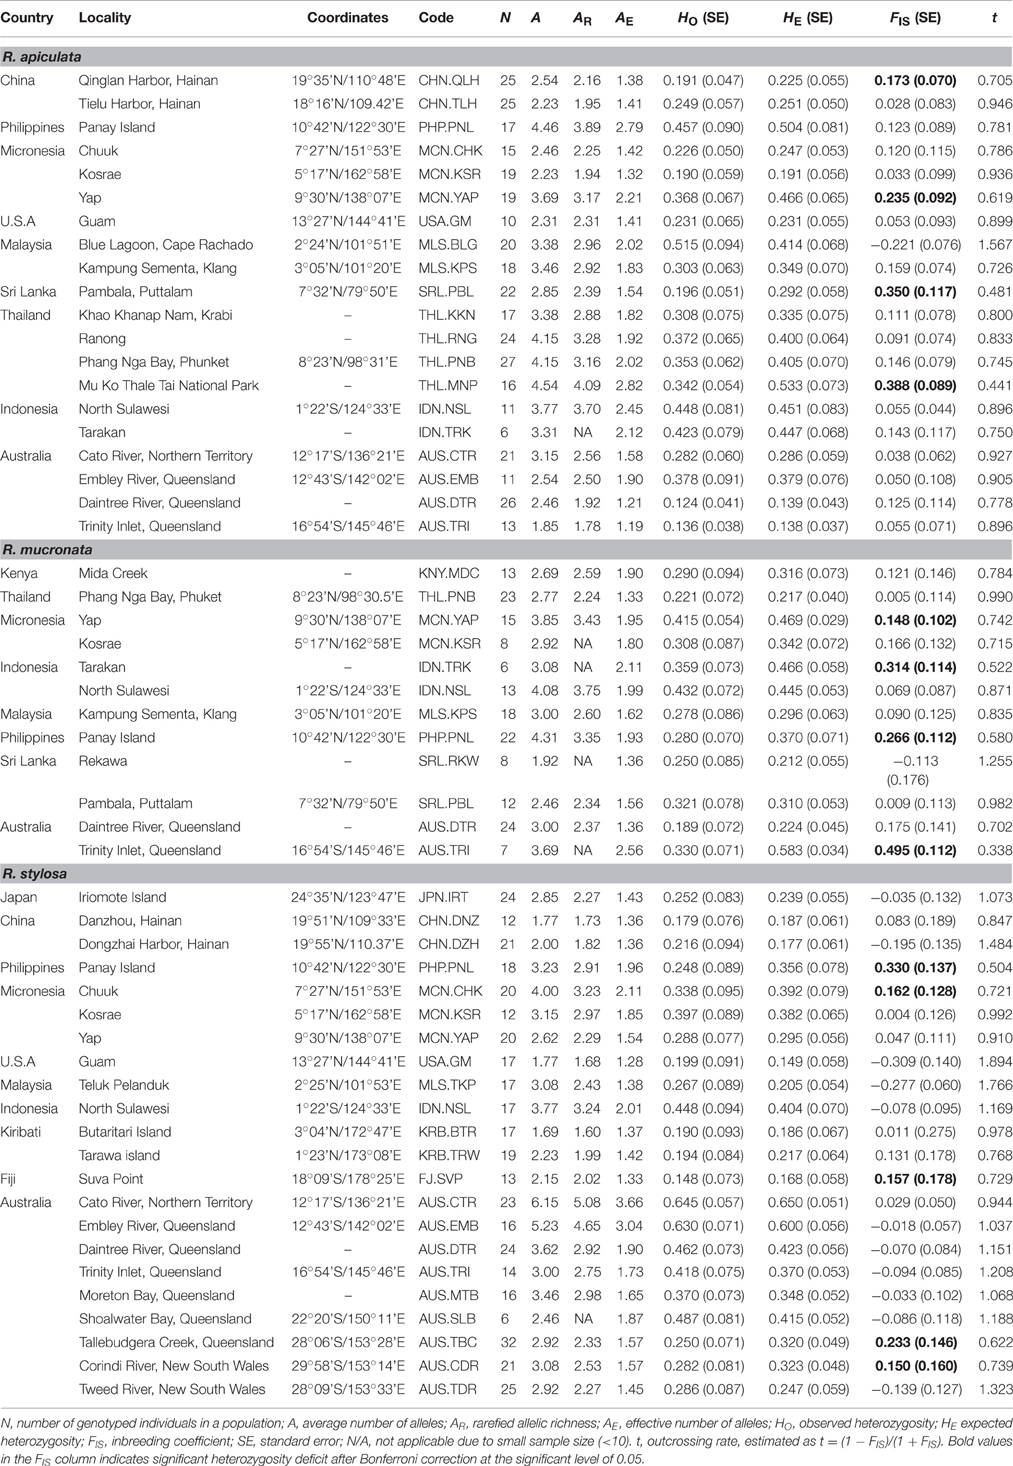
Table 1. Sampling locality information and estimates of genetic variation within populations of three Rhizophora species.
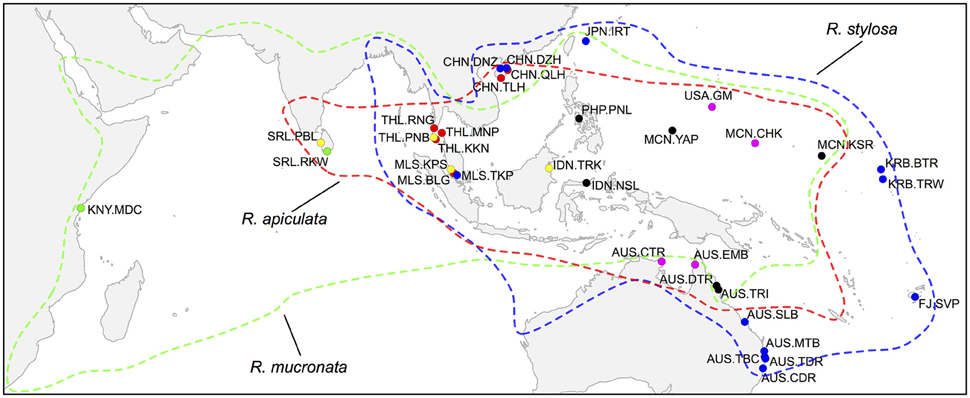
Figure 1. Geographic locations of sampled populations of Rhizophora species in the Indo-West Pacific region. Red, R. apiculata; green, R. mucronata; blue, R. stylosa. Yellow dots indicate sympatric sites where both R. apiculata and R. mucronata were sampled; magenta dots indicate sympatric sites where both R. apiculata and R. stylosa were sampled; black dots indicate sites where all three species were sampled. Colored lines represent the distributions of corresponding species.
Microsatellite Genotyping
The dried leaf pieces of each individual sample were disrupted in a 2 ml microcentrifuge tube using QIAGEN TissueLyser II (QIAGEN, Hilden, Germany), and total genomic DNA was extracted using the standard CTAB method (Doyle and Doyle, 1987). Thirteen microsatellite loci, including RM11, RM38, RM41, and RM46 (Rosero-Galindo et al., 2002), Rhst01, Rhst02, Rhst11, Rhst13, Rhst15, and Rhst19 (Islam et al., 2004, 2013), RS19, RS59, and RS67 (Takayama et al., 2009), were genotyped for each sampled individual of all populations and species. Multiplex PCRs were carried out in a final volume of 5 μL with florescent-labeled primers using QIAGEN Multiplex PCR Kit (Qiagen, Hilden, Germany) following manufacturer's recommendation for microsatellite amplification. Specifically, the reaction mix contained 1 × QIAGEN Multiplex PCR Master Mix, 0.2 μM of each primer, and less than 0.1 μg template DNA. The PCR cycling protocol was as follows: an initial activation step for 15 min at 95°C, followed by 30 cycles of 30 s denaturation at 94°C, 90 s annealing at 57°C, and 60 s extension at 72°C, and a final extension step of 30 min at 60°C. Three multiplex mixes were applied in genotyping according to the compatibility of primers and the length of PCR product facilitated by Multiplex Manager 1.2 (Holleley and Geerts, 2009). RM11 (NED), RM38 (VIC), RM41 (6-FAM), and Rhst15 (PET) formed the first combination, RM46 (VIC), Rhst01 (6-FAM), Rhst02 (NED), and Rhst11 (PET) formed the second combination, and Rhst13 (VIC), Rhst19 (6-FAM), RS19 (6-FAM), RS59 (PET), and RS67 (NED) formed the last combination. The forward or reverse primer of each primer pair was labeled with a different dye (6FAM, Integrated DNA Technologies; NED, PET, and VIC, Applied Biosystems) as indicated in the parentheses following the locus name. PCR products were analyzed with an ABI 3130xl capillary sequencer following the manufacturer's instructions, with the GeneScan 500 LIZ size standard (Applied Biosystems) as internal marker. Alleles were scored using GENEMAPPER software version 4.0 (Applied Biosystems) and were manually checked for accuracy.
Data Analyses
Null alleles and potential stuttering were checked with MICRO-CHECKER version 2.2.3 (Van Oosterhout et al., 2004). The frequencies of null alleles were estimated with FREENA (Chapuis and Estoup, 2007) with 10,000 replications, using the implemented expectation maximization algorithm of Dempster et al. (1977). Linkage disequilibrium between each pair of loci across populations within each species was tested with FSTAT v2.9.3 (Goudet, 2001). No significant linkage disequilibrium was detected between loci in these populations.
Deviation from Hardy-Weinberg equilibrium (HWE) was tested for each of the locus—population combinations using GENEPOP (http://wbiomed.curtin.edu.au/genepop). The exact p-values of HWE tests were estimated with a Markov chain algorithm described by Guo and Thompson (1992), and the parameters of Markov chain were set as 10,000 dememorization steps and 1000 batches, with 10,000 iterations per batch. A global test of heterozygote deficiency was also carried out for each population using the same set of Markov chain parameters. The p-values of significance tests were subsequently adjusted for multiple tests with sequential Bonferroni correction (Holm, 1979; Rice, 1989).
The observed number of alleles per locus (A), rarefied number of alleles per locus (AR), and inbreeding coefficient (FIS) within populations were estimated using FSTAT 2.9.3 (Goudet, 2001). To reduce the bias arising from unequal population sample sizes, we used a standardized sample size of 10 to calculate AR following the rarefication process of Petit et al. (1998). We further calculated the effective number of alleles per locus (AE) with GenAlEx version 6.5 (Peakall and Smouse, 2012), which corrects for uneven allele frequencies at each locus. The observed heterozygosity (HO) and expected heterozygosity (HE) within populations, and the total gene diversity (HT) at the species level, inbreeding coefficient within individuals (FIS) and genetic differentiation among populations (FST) were also computed using GenAlEx version 6.5 (Peakall and Smouse, 2012). The multilocus outcrossing rate (t) was estimated based on the mean FIS over loci within each population using the equation t = (1 − FIS)/(1 + FIS) (Wright, 1969). The estimate of t can exceed 1 or 100% if FIS is negative, indicating heterozygote excess compared to random mating.
To analyze population genetic structure, we first carried out an allele-size permutation test to see whether mutation was non-negligible compared with genetic drift and migration (Hardy et al., 2003) before applying any FST estimation. We compared observed RSTvalues (before randomization) with pRST values obtained from 10,000 allele size permutations using SPAGeDi 1.4 (Hardy and Vekemans, 2002), and found no significant difference between them, confirming that mutation could not be the main cause of genetic differentiation among these populations. We then estimated FST (Weir, 1996) between all population pairs within each species and determined the significance of the estimate using FSTAT 2.9.3 (Goudet, 2001).
To further elucidate genetic relationships among populations at both intra- and interspecific levels, we performed the following three analyses. First, we conducted a discriminant analysis of principal components (DAPC, Jombart et al., 2010) for each species and for all three species combined using the R package adegenet (Jombart, 2008). We then examined genetic structure of each species and the relationships between species using the Bayesian model-based clustering method implemented in STRUCTURE v2.3.4 (Pritchard et al., 2000). Five independent assessments were carried out for each of the three species separately, for populations in all three species combined, and for populations of R. mucronata and R. stylosa combined. To determine the optimal K-value that best fits the data for each analysis, 20 iterations were performed for each K-value, from K = 1 to K = 10. Each run consisted of 2 × 10⁶ Markov chain Monte Carlo (MCMC) iterations with a burn-in period of 5 × 10⁵, employing the admixture model with correlated allele frequencies between clusters (Falush et al., 2003). Selection of the best K-value was done based on the ΔK parameter proposed by Evanno et al. (2005) and implemented in the Structure Harvester program version 0.6.94 (Earl and Vonholdt, 2012). For comparing the implied best Ks and selected Ks, 20 iterations were carried out with 2 × 10⁶ replicates of the MCMC after a burn-in period of 2 × 10⁶. We used the program CLUMPAK (Kopelman et al., 2015) to produce graphical displays. The third analysis was to characterize genetic relationships among populations using the neighbor-joining (NJ) method based on Nei's genetic distance (Nei et al., 1983) between populations with POPTREE2 (Takezaki et al., 2010), using a bootstrapping value of 10,000.
To estimate recent gene flow (m, proportion of individuals with migrant origin) between populations and between species, we used BayesAss v3.0.3 (Wilson and Rannala, 2003). The populations of this study were sampled to cover a vast geographic area of the three species' distributional ranges, but also included those from the same coastline and located adjacent to each other. In some locations, the same neighboring populations were sampled for more than one species. These population pairs provided rare opportunities for testing whether the direction of local oceanic current affected the direction of gene flow. Thus, we considered BayesAss analysis was well suited for detecting gene flow between closely located pairs of populations for comparison with the level of gene flow between those populations situated across vast stretches of oceans or on opposite sides of large land masses, in order to provide the FST estimates that reflect species-wide genetic differentiation among populations. We estimated recent gene flow between populations within each species with 3 × 10⁸ iterations, a burn-in value of 3 × 10⁷, and a sampling interval of 15,000. The mixing parameters for MCMC chains were adjusted in order to reach a swap acceptance rate between 20 and 60% as suggested by Wilson and Rannala (2003). The mixing parameters for estimating migration rate, inbreeding coefficient, and allele frequencies were set to 0.4, 1.0, and 0.8 respectively. Ten replicate runs of the MCMC with different seeds were carried out to check for convergence for each analysis. Visualization of chain mixing and convergence were accomplished with TRACER v1.6 (Rambaut et al., 2014). The results presented here were from the runs with the largest effective sample sizes.
Results
Genetic Diversity
All the estimates of genetic diversity were relatively low at the population level in all three IWP Rhizophora species (Table 1), compared to the population mean values measured with microsatellite markers for other plant species (see Section Discussion below). The mean values of allelic richness were similar among the three species, such as the number of alleles per locus (A), averaged 0.315, 0.315, and 0.305 in R. apiculata, R. mucronata, and R. stylosa respectively, although the range of the estimates among populations was much broader, from 1.85 (AUS.TRI) to 4.54 (THL.MNP) in R. apiculata, from 1.92 (SRL.RKW) to 4.31 (PHP.PNL) in R. mucronata, and from 1.77 (CHN.DNZ) to 6.15 (AUS.CTR) in R. stylosa. At the species level, similar amount of total gene diversity (HT) was found in R. apiculata (0.621), R. mucronata (0.648), and R. stylosa (0.620) (Table 2), and nearly half of this diversity resided between populations, as indicated by the highly significant FSTestimates in all the three species.
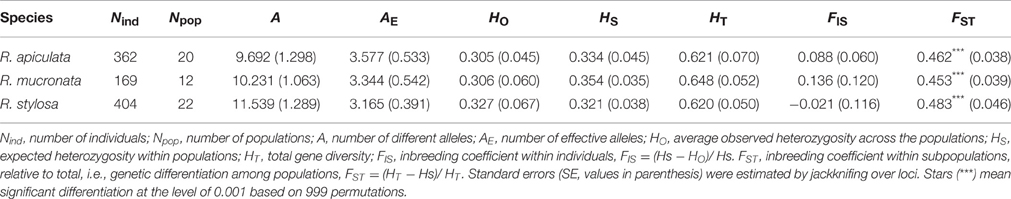
Table 2. Summary of genetic diversity at the species level.
Compared to populations located in or near the centers of these species' geographic ranges, the levels of genetic diversity were often lower in peripheral populations. For example, in R. apiculata, lower genetic diversity was found in populations located in its geographically margins, such as those in East Australia (AUS.DTR and AUS.TRI), China (CHN.QLH and CHN.TLH), and Pacific islands (USA.GM, MCN.CHK, and MCN.KSR; with a rare exception of MCN.YAP, HE = 0.466), whereas relatively high estimates of allelic richness and heterozygosity were found in South East Asia, such as populations from Indonesia (IDN.NSL and IDN.TRK), Malaysia (MLS.BLG), Philippines (PHP.PNL), and Thailand (THL.RNG and THL.PNB). In R. stylosa, high levels of heterozygosity were found in two populations from North Australia (AUS.CTR, HE = 0.650; and AUS.EMB, HE = 0.600), whereas much lower levels were found in populations from China, Fiji, Guam, and Kiribati. However, there were exceptions to the general pattern, such as in R. mucronata the highest level of heterozygositywas found in East Australia (AUS.TRI, HE = 0.583), while the lowest estimate was found in a population from Thailand (THL.PNB, HE = 0.217).
Among a total of 702 locus-population combinations (calculated based on the 13 microsatellite loci × 54 populations studied), 164 of the combinations were monomorphic as some of the loci were not variable in all 54 populations. Significant deviations from HWE were detected in 30 of the remaining 538 locus-population combinations, and the global test of heterozygosity deficiency revealed that 13 out of 54 populations significantly deviated from HWE, corresponding to the significantly positive FIS found in four populations (CHN.QLH, MCN.YAP, SRL.PBL, and THL.MNP) of R. apiculata, four populations (AUS.TRI, IDN.TRK, MCN.YAP, and PHP.PNL) of R. mucronata, and five populations (AUS.CDR, AUS.TBC, FJ.SVP, MCN.CHK, and PHP.PNL) of R. stylosa (Table 1). However, a correlation analysis of the estimated null allele frequencies (Supplementary Table 1) and FIS values at each of the 13 microsatellite loci in these populations indicated that the presence of null alleles at some of the loci could result in an underestimate of HO and thus an overestimate of FIS. We found that when null allele was not present at a locus, the estimate of FIS was near zero or even negative, which indicates outcrossing. Because a species' mating system affects all loci equally, whereas null alleles affect only those loci where they are present, zero or negative FIS at the loci without null alleles provide strong evidence for an outcrossing mating system in the same population. Thus, the multilocus outcrossing rate t, computed based on the mean FIS over all loci (including those with null alleles), must represent an underestimate of outcrossing or an overestimate of inbreeding within each population. The estimates of t ranged from 0.441 to 1.567 among populations of R. apiculata, from 0.338 to 1.225 among populations of R. mucronata, and from 0.504 to 1.894 among populations of R. stylosa. The average outcrossing rate over populations was 0.821, 0.776, and 1.051 in R. apiculata, R. mucronata, and R. stylosa, respectively, indicating that they are predominantly outcrossing species, consistent with a primarily wind-pollinated mating system.
Population Genetic Structure
Most of the intraspecific population pairs were significantly differentiated from each other (P < 0.05 after Bonferroni correction; Supplementary Table 2). However, the pairwise FST values were highly heterogeneous, ranging from 0.01 (between AUS.DTR and AUS.TRI) to 0.75 (between AUS.DTR and CHN.QLH) in R. apiculata; from 0.07 (MLS.KPS and THL.PNB) to 0.72 (AUS.DTR and SRL.RKW) in R. mucronata; and from 0.03 (AUS.TDR and AUS.MTB) to 0.76 (USA.GM and FJ.SVP) in R. stylosa. As expected, the high FST values were found between geographically distant populations, whereas the low FST values were found between geographically adjacent populations. At the species level, the mean FST values over all 13 loci were similar, 0.461 in R. apiculata, 0.452 in R. mucronata, and 0.484 in R. stylosa (Table 2). The high levels of population genetic differentiation were accordant with the presence of private alleles in many of the populations. Private alleles were detected in 9 of 20 populations of R. apiculata, 11 of 12 populations of R. mucronata, and 14 of 22 populations of R. stylosa. The number and frequencies of private alleles in these populations are given in Supplementary Table 3.
The DAPC results showed that individuals of R. apiculata could be clearly separated from those of R. mucronata and R. stylosa without ambiguity (Figure 2). However, the clusters of R. mucronata and R. stylosa showed some degree of overlapping (Figure 2A). Three clusters were identified in R. apiculata, namely Australia, Pacific islands, and SE Asia (Figure 2B). This pattern was also detected in R. stylosa, but the separation between the three geographical groups was not as well-defined as in R. apiculata (Figure 2C). In R. mucronata, individuals from Australia and Kenya were grouped together, individuals from SE Asia and Pacific islands were grouped together, and individuals from Sri Lanka were separated from the other two clusters (Figure 2D).
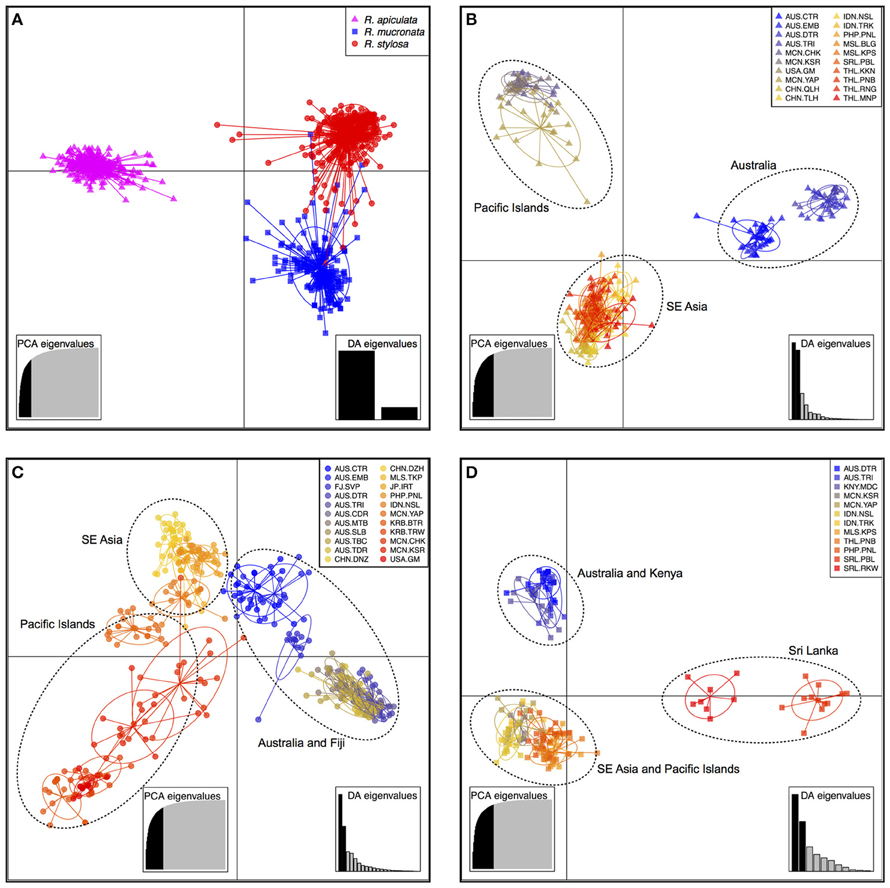
Figure 2. Plots of discriminant analysis of principal components (DAPC) for all species combined (A), R. apiculata (B), R. stylosa (C), and R. mucronata (D). Species and populations are shown by inertia ellipses and different shapes and colors as indicated in the top-right inset of each figure, and dots represent individuals.
The inferred best K-values from STRUCTURE cluster analysis (Figure 3; Supplementary Figure 1) were different between the species, with K = 7 clusters for R. apiculata (Figure 3A), 2 clusters for R. mucronata (Figure 3B), and 2 for R. stylosa (Figure 3C). When adopting the same K = 2 clusters for interspecific comparisons, populations of R. apiculata from Australia and Pacific Islands formed one cluster, and all populations from SE Asia formed the other (Supplementary Figure 2A). The minor mode of K = 7 in R. apiculata (supported by 7 out of 20 iterations; Supplementary Figure 2B) was similar to the major mode (12 out of 20; Figure 3A), but with all Australian populations placed in one group. In R. mucronata, the major cluster mode (10 out of 20; Figure 3B) separated most of the populations from Australia, Indonesia, and Micronesia from others, but with considerable admixture in several of the populations. However, a minor cluster mode (7 out of 20; Supplementary Figure 2C) separated the two Australian populations from all others, whereas the second minor mode (3 out of 20; Supplementary Figure 2D) placed populations from Australia, Sri Lanka and Kenya into one group, and all other populations formed the second cluster. In contrast, populations of R. stylosa from Australia and Fiji were well separated from populations of SE Asia and Pacific Islands, with little admixture.
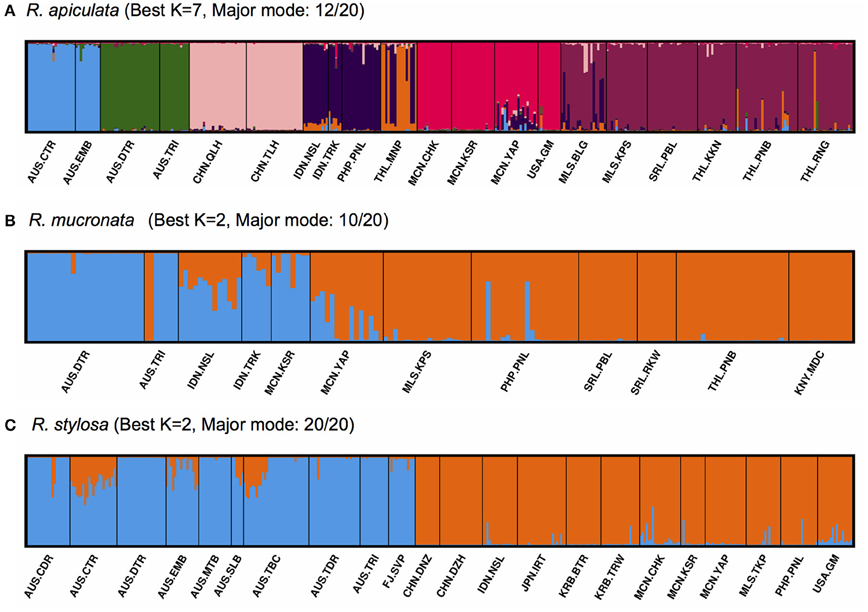
Figure 3. Structure bar plots showing the assignment of individuals in Rhizophora. Each vertical bar represents one individual, and different colors within each bar indicate admixture. (A) R. apiculata (best K = 7); (B) R. mucronata (best K = 2); (C) R. stylosa (best K = 2).
The NJ analysis based on allele frequencies in populations of all three species showed three major groups (Figure 4), with each group consisting of largely conspecific populations. Within the R. apiculata group, populations can be further divided into two subgroups, one consisting of populations from South East Asia, and the other including populations form Australia and Pacific islands. Populations of R. mucronata were grouped together with two exceptions, AUS.TRI and AUS.DTR from Australia, which were grouped with populations of R. stylosa from the sympatric sites. The R. stylosa group was further divided into two subgroups, with populations from Pacific islands and South East Asia forming one group and all Australian populations and Fiji forming the other. Among the Australian populations, the two populations from North Australia (AUS.EMB and AUS.CTR) were clearly divergent from those of East Coast.
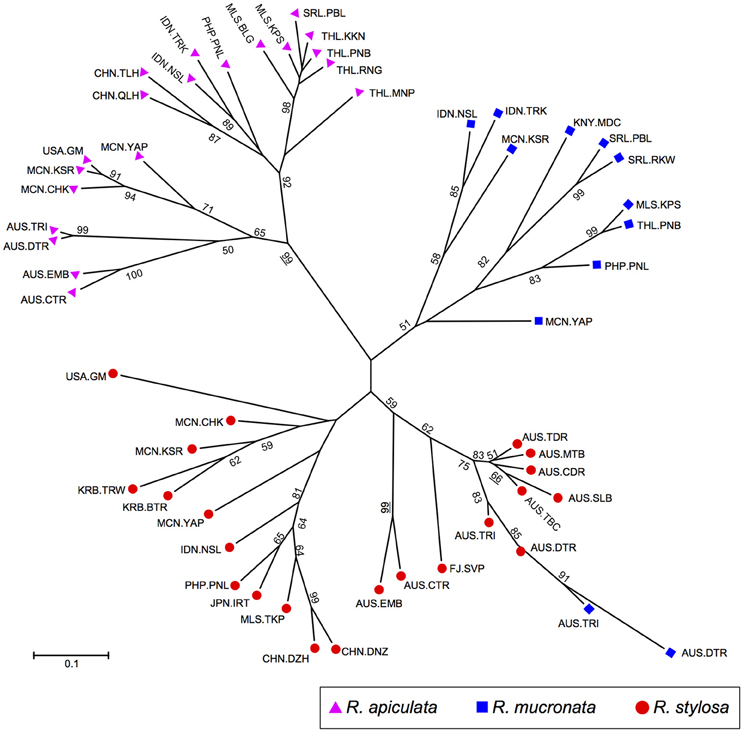
Figure 4. Neighbor-joining tree based on Nei's genetic distance showing relationships among Rhizophora populations. Purple triangles, R. apiculata; Blue squares, R. mucronata; and red circles, R. stylosa.
Recent Gene Flow
The estimates of gene flow/migration rate between intraspecific populations, ranged from 0.0068 to 0.1721 in R. apiculata; from 0.0088 to 0.2052 in R. mucronata, and from 0.0062 to 0.1513 in R. stylosa (Supplementary Table 4). With rare exceptions, the relatively higher rate of gene flow was detected for geographically adjacent population pairs, e.g., from AUS.TRI to AUS.DTR (0.1389) and from THL.RNG to THL.PNB (0.1721) in R. apiculata; from AUS.TRI to AUS.DTR (0.0866) and from SRL.RKW to SRL.PBL (0.1425) in R. mucronata; from AUS.EMB to AUS.CTR (0.1419) and from AUS.CDR to AUS.TDR (0.1513) in R. stylosa. Furthermore, strong directional differences in gene flow were detected between some of these adjacent populations, e.g., gene flow from AUS.EMB to AUS.CTR was much higher than that from the opposite direction in both R. apiculata (0.1285 vs. 0.0077) and R. stylosa (0.1419 vs. 0.0072); gene flow from AUS.TRI to AUS.DTR was up to 18 times higher than that from AUS.DTR to AUS.TRI and the same pattern of directionality was observed in all three species (0.1389 vs. 0.0072 in R. apiculata; 0.0888 vs. 0.0089 in R. mucronata; and 0.1243 vs. 0.0070 in R. stylosa). Strong directional differences in gene flow were detected in seven population pairs in R. apiculata, four in R. mucronata, and seven in R. stylosa (highlighted in the Supplementary Table 4), suggesting that directionality of wind and ocean currents must have played a major role in the dispersal of water-floating propagules or pollen between adjacent populations of Rhizophora.
Discussion
The present levels of genetic diversity and population structure in mangrove tree species, which border on the terrestrial edge with ocean-current dispersal, are the consequences of their unique evolutionary history, environmental factors, and life history traits. It is often challenging to untangle the relative importance of these factors or their interactions in determining population genetic characteristics. Comparative analysis of closely related species with shared life history traits and similar ecological and environmental conditions could greatly reduce the difficulties of interpretation by reducing the number of variables arising from different evolutionary pathways. In the present study, we included all three IWP Rhizophora species to investigate the major evolutionary processes and environmental factors in shaping the pattern of genetic diversity and population structure in these ecologically and economically important mangrove tree species.
Pattern of Genetic Diversity
Comparative analyses of allelic diversity, observed and expected heterozygosities revealed similarly low genetic variation at the population and species levels in the three IWP Rhizophora species, which is consistent with their common life history traits, similar environmental conditions and evolutionary history. However, in contrast to the expectation that long-lived woody species maintain more variation within species and within populations but have less variation among populations than species with other life forms (Hamrick et al., 1992), we detected an opposite pattern of population genetic diversity in the three Rhizophora species: mostly low variation within populations but high differentiation among populations. Compared to the mean values of genetic variation at the population level estimated with genomic microsatellite markers in species belonging to the same taxonomic group rosids of eudicots (A = 6.21, HO = 0.480, and HE = 0.579; Merritt et al., 2015), all the corresponding measures of genetic variation were much lower in the populations of IWP Rhizophora (Table 1), despite being primarily wind-pollinated, long-lived trees with ocean current-dispersed seedlings and wide geographic distributions. We considered possible sampling effects, but did not find any significant relationships between population sample size and genetic diversity parameters (correlation test p = 0.276 and 0.145 for A and HE, respectively). Repeated founder effects or bottleneck events associated with geo-climatic history in the IWP region and genetic drift in small and geographically isolated populations are most likely the major cause of the low genetic diversity within populations and within species of Rhizophora, especially in marginal populations of the species' distribution ranges. With rare exceptions, the lowest estimates of genetic diversity were found in the peripheral populations of each species. Low genetic diversity in marginal populations is also shown in other studies of R. stylosa. For example, Wilson (2009) sampled 20 populations of R. stylosa from eastern Australia (representing the species' southern geographic range limit), and reported much lower estimates of heterozygosity (HO = 0.19 and HE = 0.26). Islam et al. (2013) reported a very low level of HO (0.130) but higher HE (0.338) in 16 populations of R. stylosa from Sakishima islands of the Japanese archipelago (representing the species' northern distributional edge). These marginal populations of Rhizophora may represent descendants of a few ancestral propagules dispersed from the more centrally located populations after the last glacial maximum (LGM), resulting in further reduction of genetic variation due to the founder effect. Low genetic diversity in peripheral populations was also detected in other mangrove tree species, such as Bruguiera gymnorhiza (Rhizophoraceae) from its northern geographic limit in Japan (Islam et al., 2014), and Rhizophora mangle and Avicennia germinans (Avicenniaceae) in the AEP region (Pil et al., 2011; Sandoval-Castro and Muñiz-Salazar, 2012; Sandoval-Castro et al., 2014).
Geographic distributions of mangrove trees are strongly influenced by air temperature and availability of intertidal habitats, with the latter being tightly linked to sea level fluctuations (Duke et al., 1998). During the Pleistocene epoch, the sea level fluctuated to a great extent, up to 125 m lower than the present level (Voris, 2000). Along with every cycle of warming and cooling, mangrove populations, especially those located in their distributional limits, would have experienced repeated local extinction and recolonization by a few founders, leading to a very small long-term effective population size (NE), which is often a small fraction of the census population size (Woodruff, 2001; Frankham et al., 2002). The generally small NE alone could account for the observed pattern of low variation within populations and high divergence between populations due to enhanced genetic drift in mangroves. A recent large-scale comparative genomic study has shown that mangrove populations generally have much smaller NE and lower level of heterozygosity than non-mangrove plants based on genome-wide single nucleotide polymorphism (SNP) data (S. Shi and C-I Wu, personal communications). It can be concluded that genetic drift might have played a dominant role in the evolutionary history of mangrove trees, as evidenced at both SNP and microsatellite loci across the genome.
Compared to the present estimates, much lower levels of allelic diversity and heterozygosity in populations of R. mucronata and R. stylosa (e.g., HO averaged 0.108 and 0.097 respectively) were reported in Wee et al. (2015). They interpreted the low heterozygosity as a result of inbreeding in the two species. However, other factors need to be taken into consideration before attributing the lack of heterozygosity to inbreeding. Furthermore, the characteristics of microsatellite markers can affect the estimates of genetic variation (Merritt et al., 2015). For comparing the level of genetic variation between species or between studies, it is necessary to use the same set of marker loci. Nevertheless, despite the difference in marker loci employed between studies, the same pattern of genetic diversity: low within- but high between-population variation, was found in R. mucronata and R. stylosa in this study and Wee et al. (2015) as well as in R. apiculata, indicating that the same evolutionary processes operated on genetic diversity in these species.
Inbreeding Coefficient, Outcrossing Rate, and the Effect of Breeding System on Genetic Diversity
Rhizophora species are self-compatible, weakly protandrous, and predominantly wind-pollinated, though pollination by small insects may also exist (Tomlinson, 1986; Kondo et al., 1987; Nadia and Machado, 2014). According to their population outcrossing rates (t), self-compatible plant species can be further characterized as predominantly outcrossing (t > 80%), mixed mating (t = 20–80%), or predominantly selfing (t = 0−20%). Although t is commonly computed using progeny arrays (e.g., Sun and Ganders, 1986, 1988, 1990; Sun and Ritland, 1998; Sun et al., 1998), it also can be indirectly estimated based on Wright's within-population inbreeding coefficient (Wright, 1965, 1969) using the relationship t = (1 − FIS)/(1 + FIS) as described by Weir (1996). Our present estimates of t based on FIS were similarly high in R. apiculata and R. mucronata, and the estimates were still higher for populations of R. stylosa. Accordingly, the breeding systems of these species can be defined as mixed mating or predominantly outcrossing. Given that the population FIS value might represent an overestimate of inbreeding if null alleles are present at some of the marker loci, the estimate of t could even be higher. Hence, a shift in mating system toward inbreeding is unlikely a valid explanation for the generally low levels of genetic variation within their populations.
Several previous studies reported various levels of inbreeding in populations of Rhizophora from both IWP and AEP regions (e.g., Lowenfeld and Klekowski, 1992; Dominguez et al., 1998; Cerón-Souza et al., 2012; Yahya et al., 2013), as well as in populations of other mangrove species, such as Avicennia marina (Maguire et al., 2000), Ceriops decandra (Tan et al., 2005), and Kandelia candel (Chen et al., 1996; Sun et al., 1998). For example, field observations of bee activities suggested that there might be substantial geitonogamous selfing in populations of K. candel and thus quantitative analysis of the mating system parameters was performed using progeny arrays assayed for allozyme markers (Sun et al., 1998). Although the breeding system of K. candel can be regarded as mixed-mating based on the estimated outcrossing rate in two of its populations (0.697 ± 0.091 and 0.797 ± 0.062 respectively), the levels of allozyme variation were extremely low at both population and species levels in comparison with other plant species with mixed-mating system. Random genetic drift and founder effects are most likely the driving force in mangrove populations, especially in the species' distributional margins, overriding the effect of breeding system on the level and pattern of genetic diversity.
With rare exceptions (e.g., Lowenfeld and Klekowski, 1992; Sun et al., 1998), the estimates of FIS have been commonly used to infer inbreeding in many mangrove studies. This is probably due to the difficulties to assay progeny arrays with mangrove propagules. However, microsatellite-based estimates of FIS should be interpreted with caution if null alleles are present at one or more of the sampled loci, because null alleles could result in an excess of observed homozygosity compared to HWE expectation and consequently result in an overestimate of FIS at the locus. Null alleles are commonly present at microsatellite loci (Chapuis and Estoup, 2007), thus the estimates of FIS at each locus should be carefully checked before inferring inbreeding at the population level.
In this study, we also detected significant FIS in four of the 20 populations of R. apiculata, four of the 12 populations of R. mucronata, and five of the 22 populations of R. stylosa. After carefully examining the estimates of FIS at each locus in these 13 populations, we found that the deficiencies of observed heterozygosity in all the populations with significant FIS could be explained by the presence of null alleles at some of the marker loci in these populations, because other loci in the same individuals had nearly zero or even negative FIS. Because a species' mating system affects all genetic loci equally, whereas null alleles affect only those loci where they are present, thus near zero or negative FIS at some of the individual loci provides stronger evidence for random mating or outcrossing than any high values of positive FIS at different loci in the same population as evidence for inbreeding. We think heterogeneity in FIS across the sampled loci within the same population, rather than the mean value of FIS over these loci, should be taken into account before inferring inbreeding at the whole population level.
We found that FIS values were highly heterogeneous among the marker loci in the 13 populations with significant FIS, suggesting that the significant FIS values were likely caused by the presence of null alleles at some of the loci in these populations, rather than reflecting the actual population level of inbreeding. To prove this might be the case, we further analyzed the relationship between null allele frequencies and FIS estimates at each of the sampled loci for all populations included in the present study, and also did the same analysis for the data given in Wee et al. (2015; original data from http://datadryad.org/resource/doi:10.5061/dryad.42711/1). We found highly significant correlations (p < 2.2e−16) between the two estimates in both of the studies (Figure 5). This relationship indicates caution should be exercised in inferring inbreeding from microsatellite-based FIS estimates in all future population genetic studies. Because it is often impractical to eliminate all the loci with null alleles if they are present in only a few sampled populations but not in most others, a simple solution to this problem is to inspect heterogeneity in the FIS estimates across all sampled loci for each population, as we have done here in data analysis and interpretation.
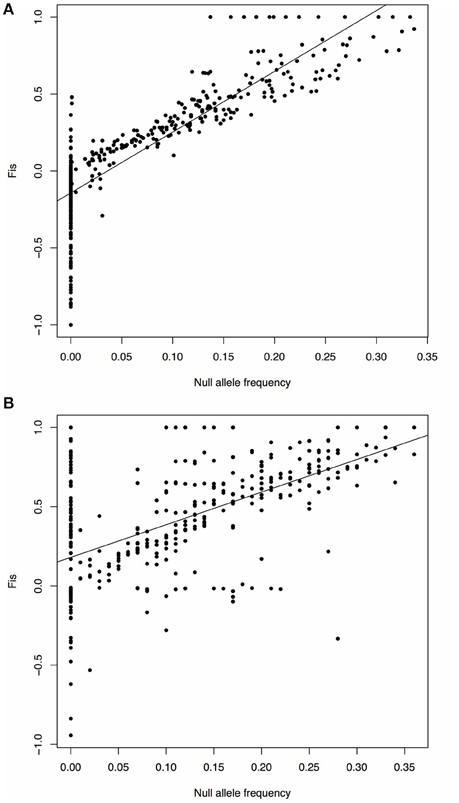
Figure 5. Scatter plot and fitting linear regression of null allele frequency and FIS. The X axis represents the null allele frequency, and the Y axis represents the FIS value. The black line shows the fitting linear regression. (A) Data from this study. Y = −0.1425+3.9492X; P < 2.2e−16; the correlation coefficient r = 0.8493. (B) Data from Wee et al. (2015). Y = 0.1802+2.0604X; P < 2.2e−16; r = 0.5622.
Gene Flow and Population Genetic Differentiation
We detected a generally low level of gene flow between pairs of populations within each Rhizophora species, as most of these populations were separated by a vast body of sea water or land barriers. In contrast, gene flow can be relatively high between neighboring populations along the same coastline. We also detected a strong directional asymmetry in the level of gene flow between some of these adjacent populations. For example, the direction of gene flow was predominantly northward between AUS.TRI and AUS.DTR, and westward between AUS.EMB and AUS.CTR; and this same pattern of directionality was detected in all the three Rhizophora species. Therefore, to fully understand the levels of gene flow and pattern of population genetic differentiation, the simple “isolation by distance” model alone may not be applicable for mangrove species. Other factors, such as directions of wind and local current, costal topographies as well as land barriers need to be considered in addition to geographic distances between populations.
High levels of gene flow and hence low genetic differentiation between populations are often associated with long-lived trees with predominant wind pollination and water-dispersed seeds. But this is not the case in all the three IWP Rhizophora species. Despite that their large water-buoyant propagules could preserve viability after floating for long periods of time in salt water (Davis, 1940; Rabinowitz, 1978; Drexler, 2001), the presumed capacity for long-distance dispersal via ocean currents was not supported in the present study, as indicated by the generally low level of gene flow and high genetic differentiation among their populations. Wee et al. (2014, 2015) also found similarly high levels of population genetic differentiation in R. mucronata and R. stylosa. Other physical factors, such as estuarine geomorphology and the interplay between water and wind currents likely played important roles in facilitating or blocking gene flow. For instance, Van der Stocken et al. (2015) showed that whether mangrove propagules could reach the open ocean depends on the strength and direction of both outgoing water flow and winds. Other studies have found that the dispersal of Rhizophora seedlings was mostly restricted to narrow geographic scales (Cerón-Souza et al., 2012; Islam et al., 2013). High levels of genetic differentiation were also found in other water-dispersed mangrove species, including Avicennia (Maguire et al., 2000; Dodd and Rafii, 2002), Ceriops tagal (Ge and Sun, 2001; Huang et al., 2012), and B. gymnorhiza (Minobe et al., 2009). Land barriers, vast oceanic surface distance, and directionality and dynamic interactions of wind and current, whether acting alone or in synergy, apparently played important role in determining the levels of gene flow between populations in most of the mangrove species.
Although the presence of null alleles may lead to an overestimation of genetic differentiation (Chapuis and Estoup, 2007), the effects could be negligible if they were uncommon or rare, i.e., at a frequency of < 0.2 (Carlsson, 2008; Queloz et al., 2010). The MICRO-CHECKER results showed that null alleles were not present at any of the 13 microsatellite loci in 16 populations, and the estimated null allele frequencies in the remaining 38 populations were generally low, only 45 out of 702 locus-population combinations in excess of 0.2. Because none of the null alleles at any of the microsatellite loci was commonly present in these populations, all the 13 loci were used in our data analyses. Still the possible effects of null alleles on FST estimates should be taken into account. Thus, we compared the FST estimates from FSTAT (null alleles included) with those from FREENA (null alleles excluded). We found that the estimates of genetic differentiation were comparably high whether or not the null alleles were included in the data analyses (Supplementary Table 2).
It should be noted, however, the estimates of genetic differentiation between populations are also found to be closely correlated with maximum geographic distance between the analyzed populations in outcrossing species (Nybom and Bartish, 2000). This indicates the importance of sampling strategies in population genetic studies. Limited coverage of the species' geographic distribution in population sampling could potentially bias FST estimates downward. Thus, geographic range of the samples should closely match the species' distributional range in the analysis of population genetic structure, as we have done in the present study.
Genetic Divergence and Phylogeographic Disjunction
At individual species level, genetic divergence among populations may not follow the same geographic pattern. In this study, the STRUCTURE analysis showed that populations of R. apiculata were highly divergent, forming 7 small clusters among the 20 sampled populations. However, only two main clusters were present in the neighbor-joining analysis of genetic distances among these populations, showing a deep division between Australasian and Indo-Malaysian populations, coincident with the marine Wallace's Line (Wallace, 1863). This pattern of two notable clusters of populations of R. apiculata is concordant with its phylogeographic disjunction previously revealed based on morphological traits (Duke et al., 2002) and cpDNA and ITS sequences (Lo et al., 2014), suggesting the effect of ancient separation of Australia and SE Asia geological plates. Subsequent genetic differentiation between the Pacific island populations and those of Australia could be caused by the rarity of long-distance dispersal and hence lack of subsequent gene flow following the initial colonization of the islands from source populations in Australia. Within SE Asia, populations on the western side of Malay Peninsula were separable from those on the eastern side, suggesting that the Malay Peninsula acted as a land barrier to the dispersal of R. apiculata, which is consistent with previous studies on Rhizophora species (Inomata et al., 2009; Ng et al., 2015; Wee et al., 2015). This pattern of population differentiation is also evident in other sea water dispersed mangrove species, such as Ceriops species (Ge and Sun, 2001; Liao et al., 2007; Huang et al., 2008, 2012), B. gymnorhiza (Minobe et al., 2009; Urashi et al., 2013), and Lumnitzera species (Su et al., 2006, 2007; Li et al., 2016). Similarly, genetic structure of R. mangle, R. racemosa, and R. samoensis in the AEP region is influenced by the Central American Isthmus and the American continent land masses (Núñez-Farfán et al., 2002; Takayama et al., 2013).
Genetic divergence among populations of R. mucronata and R. stylosa did not exhibit the same pattern as seen in R. apiculata. All the Australian populations of both R. mucronata and R. stylosa were still well separated from those of SE Asia, but their Pacific island populations were more similar to SE Asian than to Australian populations, as reflected by DAPC, STRUCTURE, and NJ analyses. This pattern of population genetic divergence could not be explained by ancient vicariant events, which were expected to affect co-distributed taxa simultaneously and thus produce similar patterns of phylogeographic disjunction, as revealed previously in both R. apiculata and R. mucronata/stylosa in the IWP region with DNA sequence data (Lo et al., 2014). The incongruity between population genetic divergence and phylogeographic disjunction might arise from the difference in the rate of evolution at different molecular marker loci. Microsatellites evolve much faster than DNA sequences, especially faster than cpDNA sequences in plant species (Freeland et al., 2011). Rosenbaum and Deinard (1998) have pointed out some problems with attempting to resolve evolutionary relationships between taxa or among intraspecific populations through microsatellite analysis. Nevertheless, microsatellites continue to be the marker of choice in a wide variety of studies, especially for investigation of population genetic structure and paternity analysis (Merritt et al., 2015).
Natural Hybridization between Species
Our STRUCTURE and gene flow analyses of combined populations (including two or all three species together) showed that R. apiculata was indeed distinct from R. mucronata and R. stylosa, but the species boundary between the latter two taxa was blurry (Supplementary Figures 3, 4). For example, in the combined STRUCTURE analysis including both R. mucronata and R. stylosa, the Australian populations AUS.TRI and AUS.DTR of R. mucronata were grouped together with those of R. stylosa from the same sites (Supplementary Figure 3), similar to the finding based on NJ analysis (Figure 4). These findings are congruent with the extent of natural hybridization as well as phylogenetic relationships among the three species. Natural hybridization between R. apiculata and R. stylosa or R. mucronata resulted in sterile F1 hybrids, named as R. x lamarckii or R. annamalayana (e.g., Kathiresan, 1995; Chan, 1996; Ng et al., 2013). These hybrid sterilities indicate a strong postzygotic isolation mechanism maintaining morphological and genetic distinctions between sympatric R. apiculata and R. mucronata/R. stylosa. In contrast, R. mucronata and R. stylosa are morphologically similar and difficult to distinguish even by experts in the field (Duke et al., 2002). When all 54 populations of the three species were combined in the same analysis, the level of gene flow between R. mucronata and R. stylosa was many times higher than between R. mucronata/R. stylosa and R. apiculata (Supplementary Figure 4). However, no putative hybrids between R. mucronata and R. stylosa have been described based on morphological traits, as the differences between the parental species are subtle and the identification of morphologically intermediate individuals is nearly impossible. Ng and Szmidt (2015) provided genetic evidence for substantial introgression between R. mucronata and R. stylosa at all studied locations where they co-occur, indicating the absence of reproductive barrier. Without pre- or postzygotic barriers, interbreeding between R. mucronata and R. stylosa would be equivalent to gene flow within the same species. Any existing morphological or genetic divergence between the two parental taxa, in the absence of strong local selection for their maintenance, would tend to disappear at the sites of sympatry. This could explain the difficulties in separating R. mucronata from R. stylosa in the two Australian populations AUS.TRI and AUS.DTR where they coexist.
Despite the difficulties in distinguishing R. mucronata and R. stylosa based on morphological keys (such as leaf size and length of flower styles; Duke et al., 2002), there seems to be differential habitat preference: R. stylosa frequently occurs in hard sandy soil and more exposed offshore sites, whereas R. mucronata occurs mostly in areas subject to regular freshwater flows, at least in the eastern part of its range (Duke, 2006). These observations suggest that environmental conditions might have exerted heavy influence on the morphological characters used to delimit R. stylosa and R. mucronata. Also, the morphological or genetic divergence between the two taxa likely developed independently in multiple localities, resulting in polyphyletic origins of both R. mucronata and R. stylosa (Lo et al., 2014). Thus, it seems appropriate to consider R. mucronata and R. stylosa as different ecotypes of the same species, or at most as incipient ecological species, assuming that the speciation process is not reversed due to ongoing hybridization/gene flow. Genome wide SNP markers can be explored to shed further light on the pattern of genetic divergence, hybridization, and introgression between populations of R. mucronata and R. stylosa.
Conclusion
Rhizophora species are the most widely distributed mangrove trees in the IWP region. This study represents the first comprehensive, large-scale population genetic investigation that included all three species of IWP Rhizophora across their distributional ranges. Although long-lived woody trees with predominant wind-pollination, water-dispersed seeds, and broad geographical range are expected to maintain more genetic variation within populations and less genetic differentiation between populations than species with other life history traits, an opposite pattern of genetic diversity was revealed in R. apiculata, R. mucronata as well as R. stylosa: all estimates of within-population genetic variation were very low and between-population genetic differentiation was high. This pattern of genetic diversity indicates genetic drift coupled with limited gene flow likely played the dominant role in the evolutionary history of mangrove trees, as frequent sea level fluctuations associated with climate changes would negatively impact their effective population sizes and various physical barriers hinder long-distance dispersal of their propagules. Our findings indicate that, in addition to life history traits, historical, demographical, ecological, and evolutionary factors must be taken into account to understand the organization of genetic variation among individuals both within and between populations. Furthermore, we discussed the genetic relationships among the three Rhizophora species, hybrid sterility barriers effectively maintain morphological and genetic distinction of R. apiculata at the sites of sympatry, but R. mucronata and R. stylosa are morphologically and genetically similar and lack reproductive isolation, suggesting that they could be treated as ecotypes of the same species.
Author Contributions
MS initiated the research; ND collected most of population samples; YY performed experiments; YY and MS analyzed data and wrote the paper.
Funding
This research was funded by a HKRGC grant (HKU7261/00M) and a CRCG grant to MS, and a postgraduate fellowship from the University of Hong Kong to YY.
Conflict of Interest Statement
The authors declare that the research was conducted in the absence of any commercial or financial relationships that could be construed as a potential conflict of interest.
Acknowledgments
The authors thank Suhua Shi and other members of her laboratory for facilities and help in DNA sample preparation, and Siddharthan Surveswaran and Yelin Huang for comments on an early draft of the manuscript.
Supplementary Material
The Supplementary Material for this article can be found online at: http://journal.frontiersin.org/article/10.3389/fpls.2016.01434
References
Barrett, S. C. H., and Shore, J. S. (1989). “Isozyme variation in colonizing plants,” in Isozymes in Plant Biology, eds D. E. Soltis and P. S. Soltis (Portland, OR: Dioscorides Press), 106–126.
Carlsson, J. (2008). Effects of microsatellite null alleles on assignment testing. J. Hered. 99, 616–623. doi: 10.1093/jhered/esn048
Cerón-Souza, I., Bermingham, E., McMillan, W. O., and Jones, F. A. (2012). Comparative genetic structure of two mangrove species in Caribbean and Pacific estuaries of Panama. BMC Evol. Biol. 12:205. doi: 10.1186/1471-2148-12-205
Chan, H. T. (1996). A note on the discovery of Rhizophora × lamarckii in Peninsular Malaysia. J. Trop. For. Sci. 9, 128–130.
Chapuis, M. P., and Estoup, A. (2007). Microsatellite null alleles and estimation of population differentiation. Mol. Biol. Evol. 24, 621–631. doi: 10.1093/molbev/msl191
Chen, X. Y., Lin, P., and Lin, Y. M. (1996). Mating systems and spontaneous mutation rates for chlorophyll-deficiency in populations of the mangrove Kandelia candel. Hereditas 125, 47–52.
Davis, J. H. (1940). The Ecology and Geologic Role of Mangroves in Florida. Washington, DC: Publications of the Carnegie Institution of Washington.
Dempster, A. P., Laird, M., and Rubin, D. B. (1977). Maximum likelihood from incomplete data via the EM algorithm. J. R. Stat. Soc. 39, 1–38.
Dodd, R. S., Afzal-Rafii, Z., Kashani, N., and Budrick, J. (2002). Land barriers and open oceans: effects on gene diversity and population structure in Avicennia germinans L. (Avicenniaceae). Mol. Ecol. 11, 1327–1338. doi: 10.1046/j.1365-294X.2002.01525.x
Dodd, R. S., and Rafii, Z. A. (2002). Evolutionary genetics of mangroves: continental drift to recent climate change. Trees 16, 80–86. doi: 10.1007/s00468-001-0142-6
Dominguez, C. A., Eguiarte, L. E., Nunez-Farfan, J., and Dirzo, R. (1998). Flower morphometry of Rhizophora mangle (Rhizophoraceae): geographical variation in Mexican populations. Am. J. Bot. 85, 637–643. doi: 10.2307/2446532
Doyle, J. J., and Doyle, J. L. (1987). A rapid DNA isolation procedure for small quantities of fresh leaf tissue. Phytochem. Bull. 19, 11–15.
Drexler, J. Z. (2001). Maximum longevities of Rhizophora apiculata and R. mucronata propagules. Pac. Sci. 55, 17–22. doi: 10.1353/psc.2001.0004
Duke, N. C. (2006). “Indo-West Pacific stilt mangroves: Rhizophora apiculata, R. mucronata, R. stylosa, R. X annamalai, R. X lamarckii,” in Traditional Trees of Pacific Islands: Their Culture, Environment, and Use, ed C. R. Elevitch (Holualoa, HI: Permanent Agriculture Resources), 641–660.
Duke, N. C. (2013). World Mangrove iD: Expert Information at Your Fingertips, App Store Version 1.1 for iPhone and iPad. Mangrove Watch Publication. Available online at: https://itunes.apple.com/us/app/mangrove-id/id761487621?mt=8
Duke, N. C. (2014). World Mangrove iD: Expert Information at Your Fingertips, Google Play Store Version 1.1 for Android. Mangrove Watch Publication. Available online at: https://play.google.com/store/apps/developer?id=MangroveWatch+Ltd
Duke, N. C., Ball, M. C., and Ellison, J. C. (1998). Factors influencing biodiversity and distributional gradients in mangroves. Global Ecol. Biogeogr. 7, 27–47. doi: 10.2307/2997695
Duke, N. C., Lo, Y., and Sun, M. (2002). Global distribution and genetic discontinuities of mangroves – emerging patterns in the evolution of Rhizophora. Trees 16, 65–79. doi: 10.1007/s00468-001-0141-7
Duke, N. C., Meynecke, J. O., Dittmann, S., Ellison, A. M., Anger, K., Berger, U., et al. (2007). A world without mangroves? Science 317, 41–42. doi: 10.1126/science.317.5834.41b
Earl, D. A., and Vonholdt, B. M. (2012). STRUCTURE HARVESTER: a website and program for visualizing STRUCTURE output and implementing the Evanno method. Conserv. Genet. Resour. 4, 359–361. doi: 10.1007/s12686-011-9548-7
Ellison, J. C. (2008). Long-term retrospection on mangrove development using sediment cores and pollen analysis: a review. Aquat. Bot. 89, 93–104. doi: 10.1016/j.aquabot.2008.02.007
Ellstrand, N. C. (2014). Is gene flow the most important evolutionary force in plants? Am. J. Bot. 101, 737–753. doi: 10.3732/ajb.1400024
Evanno, G., Regnaut, S., and Goudet, J. (2005). Detecting the number of clusters of individuals using the software STRUCTURE: a simulation study. Mol. Ecol. 14, 2611–2620. doi: 10.1111/j.1365-294X.2005.02553.x
Excoffier, L., Foll, M., and Petit, R. J. (2009). Genetic consequences of range expansions. Annu. Rev. Ecol. Evol. S. 40, 481–501. doi: 10.1146/annurev.ecolsys.39.110707.173414
Falush, D., Stephens, M., and Pritchard, J. K. (2003). Inference of population structure using multilocus genotype data: Linked loci and correlated allele frequencies. Genetics 164, 1567–1587.
FAO (2007). The World's Mangroves 1980-2005. Rome: Food and Agriculture Organization of the United Nations.
Frankham, R., Briscoe, D. A., and Ballou, J. D. (2002). Introduction to Conservation Genetics. Cambridge: Cambridge University Press.
Ge, X. J., and Sun, M. (2001). Population genetic structure of Ceriops tagal (Rhizophoraceae) in Thailand and China. Wetl. Ecol. Manag. 9, 213–219. doi: 10.1023/A:1011156707160
Goudet, J. (2001). FSTAT (Version 2.9.3): A Program to Estimate and Test Gene Diversities and Fixation Indices. Avaiable online at: http://www2.unil.ch/popgen/softwares/fstat.htm (Accessed on: 2 January, 2014).
Guo, S. W., and Thompson, E. A. (1992). Performing the exact test of Hardy-Weinberg proportion for multiple alleles. Biometrics 48, 361–372. doi: 10.2307/2532296
Hamrick, J. L., and Godt, M. J. W. (1989). “Allozyme diversity in plant species,” in Plant Population Genetics, Breeding and Genetic Resources, eds A. H. D. Brown, M. T. Clegg, A. L. Kahler, and B. S. Weir (Sunderland MA: Sinauer), 43–63.
Hamrick, J. L., and Godt, M. J. W. (1996). Effects of life history traits on genetic diversity in plant species. Philos. Trans. R. Soc. Lond. B Biol. Sci. 351, 1291–1298. doi: 10.1098/rstb.1996.0112
Hamrick, J. L., Godt, M. J. W., and Sherman-Broyles, S. L. (1992). Factors influencing levels of genetic diversity in woody plant species. New For. 6, 95–124. doi: 10.1007/BF00120641
Hardy, O. J., Charbonnel, N., Fréville, H., and Heuertz, M. (2003). Microsatellite allele sizes: a simple test to assess their significance on genetic differentiation. Genetics 163, 1467–1482.
Hardy, O. J., and Vekemans, X. (2002). SPAGeDi: a versatile computer program to analyse spatial genetic structure at the individual or population levels. Mol. Ecol. Notes 2, 618–620. doi: 10.1046/j.1471-8286.2002.00305.x
Holleley, C. E., and Geerts, P. G. (2009). Multiplex Manager 1.0: a cross-platform computer program that plans and optimizes multiplex PCR. Biotechniques 46, 511–517. doi: 10.2144/000113156
Huang, Y., Zhu, C., Li, X., Li, X., Hu, L., Tan, F., et al. (2012). Differentiated population structure of a genetically depauperate mangrove species Ceriops tagal revealed by both Sanger and deep sequencing. Aquat. Bot. 101, 46–54. doi: 10.1016/j.aquabot.2012.04.001
Huang, Y. L., Tan, F. X., Su, G. H., Deng, S. L., He, H. H., and Shi, S. H. (2008). Population genetic structure of three tree species in the mangrove genus Ceriops (Rhizophoraceae) from the Indo West Pacific. Genetica 133, 47–56. doi: 10.1007/s10709-007-9182-1
Inomata, N., Wang, X. R., Changtragoon, S., and Szmidt, A. E. (2009). Levels and patterns of DNA variation in two sympatric mangrove species, Rhizophora apiculata and R. mucronata from Thailand. Genes Genet. Syst. 84, 277–286. doi: 10.1266/ggs.84.277
Islam, M. S., Lian, C., Kameyama, N., and Hogetsu, T. (2013). Low genetic diversity and limited gene flow in a dominant mangrove tree species (Rhizophora stylosa) at its northern biogeographical limit across the chain of three Sakishima islands of the Japanese archipelago as revealed by chloroplast and nuclear SSR analysis. Plant Syst. Evol. 300, 1123–1136. doi: 10.1007/s00606-013-0950-3
Islam, M. S., Lian, C., Kameyama, N., and Hogetsu, T. (2014). Analysis of the mating system, reproductive characteristics, and spatial genetic structure in a natural mangrove tree (Bruguiera gymnorrhiza) population at its northern biogeographic limit in the southern Japanese archipelago. J. For. Res. 20, 293–300. doi: 10.1007/s10310-014-0473-y
Islam, M. S., Lian, C., Kameyama, N., Wu, B., and Hogetsu, T. (2004). Development of microsatellite markers in Rhizophora stylosa using a dual-suppression-polymerase chain reaction technique. Mol. Ecol. Notes 4, 110–112. doi: 10.1046/j.1471-8286.2003.00585.x
Jombart, T. (2008). Adegenet: a R package for the multivariate analysis of genetic markers. Bioinformatics 24, 1403–1405. doi: 10.1093/bioinformatics/btn129
Jombart, T., Devillard, S., and Balloux, F. (2010). Discriminant analysis of principal components: a new method for the analysis of genetically structured populations. BMC Genet. 11:94. doi: 10.1186/1471-2156-11-94
Kathiresan, K. (1995). Rhizophora annamalayana: a new species of mangroves. Environ. Ecol. 13, 240–241.
Kondo, K., Nakamura, T., Tsuruda, K., Saito, N., and Yaguchi, Y. (1987). Pollination in Bruguiera gymnorrhiza and Rhizophora mucronata (Rhizophoraceae) in Ishigaki Island, the Ryukyu Islands, Japan. Biotropica 19, 377–380. doi: 10.2307/2388639
Kopelman, N. M., Mayzel, J., Jakobsson, M., Rosenberg, N. A., and Mayrose, I. (2015). CLUMPAK: a program for identifying clustering modes and packaging population structure inferences across K. Mol. Ecol. Resour. 15, 1179–1191. doi: 10.1111/1755-0998.12387
Li, J., Yang, Y., Chen, Q., Fang, L., He, Z., Guo, W., et al. (2016). Pronounced genetic differentiation and recent secondary contact in the mangrove tree Lumnitzera racemosa revealed by population genomic analyses. Sci. Rep. 6, 29486. doi: 10.1038/srep29486
Liao, P. C., Havanond, S., and Huang, S. (2007). Phylogeography of Ceriops tagal (Rhizophoraceae) in Southeast Asia: the land barrier of the Malay Peninsula has caused population differentiation between the Indian Ocean and South China Sea. Conserv. Genet. 8, 89–98. doi: 10.1007/s10592-006-9151-8
Lo, E., Duke, N., and Sun, M. (2014). Phylogeographic pattern of Rhizophora (Rhizophoraceae) reveals the importance of both vicariance and long-distance oceanic dispersal to modern mangrove distribution. BMC Evol. Biol. 14:83. doi: 10.1186/1471-2148-14-83
Lowenfeld, R., and Klekowski, E. (1992). Mangrove genetics. I. Mating system and mutation rates of Rhizophora mangle in Florida and San Salvador Island, Bahamas. Int. J. Plant Sci. 153, 394–399. doi: 10.1086/297043
Maguire, T., Saenger, P., Baverstock, P., and Henry, R. (2000). Microsatellite analysis of genetic structure in the mangrove species Avicennia marina (Forsk.) Vierh. (Avicenniaceae). Mol. Ecol. 9, 1853–1862. doi: 10.1046/j.1365-294x.2000.01089.x
McCauley, D. E. (1991). Genetic consequences of local-population extinction and recolonization. Trends Ecol. Evol. 6, 5–8. doi: 10.1016/0169-5347(91)90139-O
Merritt, B. J., Culley, T. M., Avanesyan, A., Stokes, R., and Brzyski, J. (2015). An empirical review: characteristics of plant microsatellite markers that confer higher levels of genetic variation. Appl. Plant Sci. 3:1500025. doi: 10.3732/apps.1500025
Minobe, S., Fukui, S., Saiki, R., Kajita, T., Changtragoon, S., Ab Shukor, N. A., et al. (2009). Highly differentiated population structure of a Mangrove species, Bruguiera gymnorhiza (Rhizophoraceae) revealed by one nuclear GapCp and one chloroplast intergenic spacer trnF–trnL. Conserv. Genet. 11, 301–310. doi: 10.1007/s10592-009-9806-3
Nadia, T. L., and Machado, I. C. (2014). Wind pollination and propagule formation in Rhizophora mangle L. (Rhizophoraceae): resource or pollination limitation? An. Acad. Bras. Cienc. 86, 229–238. doi: 10.1590/0001-37652014101712
Nei, M., Tajima, F., and Tateno, Y. (1983). Accuracy of estimated phylogenetic trees from molecular data. J. Mol. Evol. 19, 153–170. doi: 10.1007/BF02300753
Nettel, A., and Dodd, R. (2007). Drifting propagules and receding swamps: genetic footprints of mangrove recolonization and dispersal along tropical coasts. Evolution 61, 958–971. doi: 10.1111/j.1558-5646.2007.00070.x
Ng, W. L., Chan, H. T., and Szmidt, A. E. (2013). Molecular identification of natural mangrove hybrids of Rhizophora in Peninsular Malaysia. Tree Genet. Genomes 9, 1151–1160. doi: 10.1007/s11295-013-0619-7
Ng, W. L., Onishi, Y., Inomata, N., Teshima, K. M., Chan, H. T., Baba, S., et al. (2015). Closely related and sympatric but not all the same: genetic variation of Indo-West Pacific Rhizophora mangroves across the Malay Peninsula. Conserv. Genet. 16, 137–150. doi: 10.1007/s10592-014-0647-3
Ng, W. L., and Szmidt, A. E. (2015). Introgressive hybridization in two Indo-West Pacific Rhizophora mangrove species, R. mucronata and R. stylosa. Aquat. Bot. 120, 222–228. doi: 10.1016/j.aquabot.2014.07.006
Núñez-Farfán, J., Dominguez, C. A., Eguiarte, L. E., Cornejo, A., Quijano, M., Vargas, J., et al. (2002). Genetic divergence among Mexican populations of red mangrove (Rhizophora mangle), geographic and historic effects. Evol. Ecol. Res. 4, 1049–1064.
Nybom, H., and Bartish, I. V. (2000). Effects of life history traits and sampling strategies on genetic diversity estimates obtained with RAPD markers in plants. Perspect. Plant Ecol. Evol. Syst. 3, 93–114. doi: 10.1078/1433-8319-00006
Peakall, R., and Smouse, P. E. (2012). GenAlEx 6.5: genetic analysis in Excel. Population genetic software for teaching and research – an update. Bioinformatics 28, 2537–2539. doi: 10.1093/bioinformatics/bts460
Petit, R. J., El Mousadik, A., and Pons, O. (1998). Identifying populations for conservation on the basis of genetic markers. Conserv. Biol. 12, 844–855. doi: 10.1046/j.1523-1739.1998.96489.x
Pil, M. W., Boeger, M. R. T., Muschner, V. C., Pie, M. R., Ostrensky, A., and Boeger, W. A. (2011). Postglacial north-south expansion of populations of Rhizophora mangle (Rhizophoraceae) along the Brazilian coast revealed by microsatellite analysis. Am. J. Bot. 98, 1031–1039. doi: 10.3732/ajb.1000392
Pritchard, J. K., Stephens, M., and Donnelly, P. (2000). Inference of population structure using multilocus genotype data. Genetics 155, 945–959.
Queloz, V., Duo, A., Sieber, T. N., and Grunig, C. R. (2010). Microsatellite size homoplasies and null alleles do not affect species diagnosis and population genetic analysis in a fungal species complex. Mol. Ecol. Resour. 10, 348–367. doi: 10.1111/j.1755-0998.2009.02757.x
Rabinowitz, D. (1978). Dispersal properties of mangrove propagules. Biotropica 10, 47–57. doi: 10.2307/2388105
Rambaut, A., Suchard, M. A., Xie, D., and Drummond, A. J. (2014). Tracer v1.6. Available online at: http://beast.bio.ed.ac.uk/Tracer (Accessed on: 1 November, 2014).
Rice, W. R. (1989). Analyzing tables of statistical tests. Evolution 43, 223–225. doi: 10.2307/2409177
Rogstad, S. H., and Pelikan, S. (2011). Genetic Diversity in Establishing Plant Populations: Founder Number and Geometry. Enfield, CT: Science Publishers.
Ronnback, P. (1999). The ecological basis for economic value of seafood production supported by mangrove ecosystems. Ecol. Econ. 29, 235–252. doi: 10.1016/S0921-8009(99)00016-6
Rosenbaum, H. C., and Deinard, A. S. (1998). “Caution before claim: an overview of microsatellite analysis in ecology and evolutionary biology,” in Molecular Approaches to Ecology and Evolution, eds R. DeSalle and B. Schierwater (Boston, MA: Birkhäuser), 87–106.
Rosero-Galindo, C., Gaitan-Solis, E., Cardernas-Henao, H., Tohme, J., and Toro-Perea, N. (2002). Polymorphic microsatellites in a mangrove species, Rhizophora mangle L. (Rhizophoraceae). Mol. Ecol. Notes 2, 281–283. doi: 10.1046/j.1471-8286.2002.00232.x
Sandoval-Castro, E., Dodd, R., Riosmena-Rodríguez, R., Enríquez-Paredes, L., Tovilla-Hernández, C., López-Vivas, J. M., et al. (2014). Post-glacial expansion and population genetic divergence of mangrove species Avicennia germinans (L.) Stearn and Rhizophora mangle L. along the Mexican coast. PLoS ONE 9:e93358. doi: 10.1371/journal.pone.0093358
Sandoval-Castro, E., and Muñiz-Salazar, R. (2012). Genetic population structure of red mangrove (Rhizophora mangle L.) along the northwestern coast of Mexico. Aquat. Bot. 99, 20–26. doi: 10.1016/j.aquabot.2012.01.002
Slatkin, M. (1987). Gene flow and the geographic structure of natural populations. Science 236, 787–792. doi: 10.1126/science.3576198
Spalding, M., Kainuma, M., and Collins, L. (2010). World Atlas of Mangroves. London; Washington, DC: Earthscan.
Su, G. H., Huang, Y. L., Tan, F. X., Ni, X. W., Tang, T., and Shi, S. H. (2006). Genetic variation in Lumnitzera racemosa, a mangrove species from the Indo-West Pacific. Aquat. Bot. 84, 341–346. doi: 10.1016/j.aquabot.2006.01.001
Su, G. H., Huang, Y. L., Tan, F. X., Ni, X. W., Tang, T., and Shi, S. H. (2007). Conservation genetics of Lumnitzera littorea (Combretaceae), an endangered mangrove, from the Indo-West Pacific. Mar. Biol. 150, 321–328. doi: 10.1007/s00227-006-0357-6
Sun, M., and Ganders, F. R. (1986). Female frequencies in gynodioecious populations correlated with selfing rates in hermaphrodites. Am. J. Bot. 73, 1645–1648. doi: 10.2307/2443933
Sun, M., and Ganders, F. R. (1988). Mixed mating systems in Hawaiian Bidens (Asteraceae). Evolution 42, 516–527. doi: 10.2307/2409036
Sun, M., and Ganders, F. R. (1990). Outcrossing rates and allozyme variation in rayed and rayless morphs of Bidens pilosa. Heredity 64, 139–143. doi: 10.1038/hdy.1990.18
Sun, M., and Ritland, K. (1998). Mating system of yellow starthistle (Centaurea solstitialis), a successful colonizer in North America. Heredity 80, 225–232. doi: 10.1046/j.1365-2540.1998.00290.x
Sun, M., Wong, K. C., and Lee, S. Y. (1998). Reproductive biology and population genetic structure of Kandelia candel (Rhizophoraceae), a viviparous mangrove species. Am. J. Bot. 11, 1631–1637. doi: 10.2307/2446492
Takayama, K., Tamura, M., Tateishi, Y., and Kajita, T. (2009). Isolation and characterization of microsatellite loci in a mangrove species, Rhizophora stylosa (Rhizophoraceae). Conserv. Genet. Resour. 1, 175–178. doi: 10.1007/s12686-009-9042-7
Takayama, K., Tamura, M., Tateishi, Y., Webb, E. L., and Kajita, T. (2013). Strong genetic structure over the American continents and transoceanic dispersal in the mangrove genus Rhizophora (Rhizophoraceae) revealed by broad-scale nuclear and chloroplast DNA analysis. Am. J. Bot. 100, 1191–1201. doi: 10.3732/ajb.1200567
Takezaki, N., Nei, M., and Tamura, K. (2010). POPTREE2: Software for constructing population trees from allele frequency data and computing other population statistics with Windows interface. Mol. Biol. Evol. 27, 747–752. doi: 10.1093/molbev/msp312
Tan, F. X., Huang, Y. L., Ge, X. J., Su, G. H., Ni, X. W., and Shi, S. H. (2005). Population genetic structure and conservation implications of Ceriops decandra in Malay Peninsula and North Australia. Aquat. Bot. 81, 175–188. doi: 10.1016/j.aquabot.2004.11.004
Tomlinson, P. B., Primack, R. B., and Bunt, J. S. (1979). Preliminary observations on floral biology in mangrove Rhizophoraceae. Biotropica 11, 256–277. doi: 10.2307/2387918
Triest, L. (2008). Molecular ecology and biogeography of mangrove trees towards conceptual insights on gene flow and barriers: a review. Aquat. Bot. 89, 138–154. doi: 10.1016/j.aquabot.2007.12.013
UNEP (2014). The Importance of Mangroves to People: A Call to Action, eds J. van Bochove, E. Sullivan, and T. Nakamura. United Nations Environment Programme World Conservation Monitoring Centre, Cambridge.
Urashi, C., Teshima, K. M., Minobe, S., Koizumi, O., and Inomata, N. (2013). Inferences of evolutionary history of a widely distributed mangrove species, Bruguiera gymnorrhiza, in the Indo-West Pacific region. Ecol. Evol. 3, 2251–2261. doi: 10.1002/ece3.624
Van der Stocken, T., Vanschoenwinkel, B., De Ryck, D. J. R., Bouma, T. J., Dahdouh-Guebas, F., and Koedam, N. (2015). Interaction between water and wind as a driver of passive dispersal in mangroves. PLoS ONE 10:e0127132. doi: 10.1371/journal.pone.0127132
Van Oosterhout, C., Hutchinson, W. F., Wills, D. P. M., and Shipley, P. (2004). MICRO-CHECKER: software for identifying and correcting genotyping errors in microsatellite data. Mol. Ecol. Notes 4, 535–538. doi: 10.1111/j.1471-8286.2004.00684.x
Voris, H. K. (2000). Maps of Pleistocene sea levels in Southeast Asia: shorelines, river systems and time durations. J. Biogeogr. 27, 1153–1167. doi: 10.1046/j.1365-2699.2000.00489.x
Wakeley, J. (2000). The effects of subdivision on the genetic divergence of populations and species. Evolution 54, 1092–1101. doi: 10.1111/j.0014-3820.2000.tb00545.x
Wallace, A. R. (1863). On the physical geography of the Malay archipelago. J. Roy. Geogr. Soc. 7, 205–212. doi: 10.2307/1798448
Wee, A. K. S., Takayama, K., Asakawa, T., Thompson, B., Onrizal, Sungkaew, K., et al. (2014). Oceanic currents, not land masses, maintain the genetic structure of the mangrove Rhizophora mucronata Lam (Rhizophoraceae) in Southeast Asia. J. Biogeogr. 41, 954–964. doi: 10.1111/jbi.12263
Wee, A. K. S., Takayama, K., Chua, J. L., Asakawa, T., Meenakshisundaram, S. H., Onrizal, et al. (2015). Genetic differentiation and phylogeography of partially sympatric species complex Rhizophora mucronata Lam and R. stylosa Griff. using SSR markers. BMC Evol. Biol. 15:57. doi: 10.1186/s12862-015-0331-3
Weir, B. S. (1996). Genetic Data Analysis II: Methods for Discrete Population Genetic Data. Sunderland, MA: Sinauer Associates, Inc.
Wilson, G., and Rannala, B. (2003). Bayesian inference of recent migration rates using multilocus genotypes. Genetics 163, 1177–1191.
Wilson, N. C. (2009). The Distribution, Growth, Reproduction and Population Genetics of a Mangrove Species, Rhizophora stylosa Griff. Near its Southern Limits in New South Wales, Australia. Ph.D. dissertation, Australian Catholic University.
Woodroffe, C. D., and Grindrod, J. (1991). Mangrove biogeography: the role of Quaternary environmental and sea-level change. J. Biogeogr. 18, 479–492. doi: 10.2307/2845685
Woodruff, D. S. (2001). “Population, species, and conservation genetics,” in Encyclopedia of Biodiversity, ed S. A. Levin (Amsterdam: Elsevier Inc.), 811–829.
Wright, S. (1965). The interpretation of population structure by F-statistics with special regard to systems of mating. Evolution 19, 395–420. doi: 10.2307/2406450
Wright, S. (1969). Evolution and the Genetics of Populations, Vol. 2: The Theory of Gene Frequencies. Chicago: University of Chicago Press.
Keywords: genetic diversity, genetic drift, gene flow, inbreeding coefficient, mangroves, microsatellites, population structure, Rhizophora
Citation: Yan Y-B, Duke NC and Sun M (2016) Comparative Analysis of the Pattern of Population Genetic Diversity in Three Indo-West Pacific Rhizophora Mangrove Species. Front. Plant Sci. 7:1434. doi: 10.3389/fpls.2016.01434
Received: 13 June 2016; Accepted: 08 September 2016;
Published: 30 September 2016.
Edited by:
Renchao Zhou, Sun Yat-sen University, ChinaReviewed by:
Peter J. Prentis, Queensland University of Technology, AustraliaWei Lun Ng, Universiti Putra Malaysia, Malaysia
Copyright © 2016 Yan, Duke and Sun. This is an open-access article distributed under the terms of the Creative Commons Attribution License (CC BY). The use, distribution or reproduction in other forums is permitted, provided the original author(s) or licensor are credited and that the original publication in this journal is cited, in accordance with accepted academic practice. No use, distribution or reproduction is permitted which does not comply with these terms.
*Correspondence: Mei Sun, meisun@hku.hk